
Abstract
Tennis, like other games and sports, is governed by rules, including the rules that determine the winner of points, games, sets, and matches. If the two players are equally skilled, each has an equal chance of winning matches. However, the player who wins the most games may not be the player who wins the match. A notable example was the 2019 men's Wimbledon final between Novak Djokovic and Roger Federer. In this paper, we study both theoretically and empirically the probability of such discrepancies occurring, using data from 50,000 Grand Slam matches. We argue that this discrepancy, when it occurs, should be resolved by a Grand Tiebreak (GT)—played according to the rules of tiebreaks in sets—because each player has a valid claim to being called the rightful winner. A GT would have the salutary effect of giving each player an incentive to strive hard to win every game—even every point—lest he/she win in sets but lose more games. This would make competition keener throughout a match and probably decrease the need for a GT, because the game and set winner would more likely coincide when the players fight hard for every game and point.
Introduction
In Kemeny and Snell (1960), the authors use Markov chains to calculate the probability that tennis players with different probabilities of winning points go on to win games, sets, and matches. Subsequently, there have been numerous studies to expand on this work, which now include tiebreaks in sets (Brams and Ismail, 2018; Brams et al., 2018; Carrari et al., 2017; Haigh, 1996; MacPhee et al., 2004; Newton and Keller, 2005; Pollard, 1983). The rules for tiebreaks, which did not exist in 1960, have varied but have now been standardized in the four so-called Grand Slam Tournaments, which we assume here.
There is a consensus that serving in a game provides the server with an advantage, which is mitigated by the rule that servers alternate over the games of a set. Still, if P serves first in a set and Q second, with alternation thereafter, P has a better chance of winning if the set ends at 6-1 or 6-3, because P serves in one more game, whereas at the other set scores without tiebreaks (6-0, 6-2, 6-4, and 7-5), the even number of games ensures that P and Q serve first in the same number of games, giving them equal chances of winning the set if they are equally skilled.
But Haigh (1996) argued that serving first in a set does not advantage the first server, and MacPhee et al. (2004) generalized this argument to a broader class of contests. Our calculations support this conclusion. Haigh's key observation was that extending a set a certain number of games beyond the point when a winning score is reached does not affect the result, because the winning player will remain ahead by the required winning margin. For example, if the set ends with a score of 6-3, and if Q is given another game to serve, P will still win the set by the required margin of two games even if Q wins the extra game. In other words, serving an extra game in a set does not benefit a player over the course of a set or a match.
In this paper, we focus on the discrepancy between the match winner, who wins more sets, and the winner of the most games. Although both the theoretical probability of this discrepancy's happening (about 5 percent) and the empirical probability that it actually has occurred in the four annual Grand Slam Tournaments of the Open Era (1968–2024) are low (less than 2 percent), the discrepancy between a game winner and a set winner recently occurred in one Grand Slam men's final (Wimbledon, 2019), demonstrating how the choice of a champion in the most storied tennis tournament in the world would have changed if the criterion for winning the tournament had been the game winner rather than the set winner (see Conclusions for more on this match). 2
To settle who is the rightful winner when there is such a discrepancy—the game or set winner—we recommend that there be a Grand Tiebreak (GT), played according to the rules of tiebreaks in sets. 3 A GT would have the salutary effect of giving each player an incentive to strive hard to win every game—even every point—lest he/she lose in sets after winning more games. This would make competition keener throughout a match and almost surely decrease the need for a GT, because the two winners are more likely to coincide when they fight for every point.
Many tiebreaking mechanisms and their fairness have been extensively studied. They can be broadly categorized into the following topics: bidding (Brams and Sanderson, 2013; Che and Hendershott, 2008; Granot and Gerchak, 2014); order of play (Anbarci et al., 2021; Apesteguia and Palacios-Huerta, 2010; Arrondel et al., 2019; Brams and Ismail, 2018; Brams et al., 2018; Cohen-Zada et al., 2018; Kassis et al., 2021; Kocher et al., 2012; Lambers and Spieksma, 2021; Rudi et al., 2020), final-score variations (Brams et al., 2024), use of artificial intelligence to break a tie (Anbarci and Ismail, 2024). For an overview of some tiebreaking methods, see Csato (2021, section 1.3); for a review of more general tournament design rules, see Devriesere et al. (2025).
Markov chains and games
A tennis match comprises several distinct contests—games, sets, and the match itself—that may have different winners. A set consists of a sequence of games, with possibly a tiebreak, and a match consists of a sequence of sets. In men's Grand Slam matches, the winner is the first player to win 3 sets; in women's, the winner is the first player to win 2 sets.
A coin toss determines which player starts the match by serving in the first game. Let
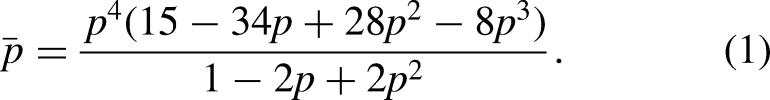
Suppose that A serves in a game. We have assumed that A wins each point with probability p and loses it with probability 1 – p. Throughout the paper, we assume that outcomes of serves are independent events. Then a game can be modeled as a Markov chain. Beginning at state 0–0, the probability that A wins can be shown to equal
The probability that B wins the game is the complementary probability,
In a game in which B serves, the probability that B wins when B serves is
Markov chains, sets, and matches
As noted earlier, each set in a tennis match is a sequence of games with alternating servers. The winner of a set is the first player to win (1) at least 6 games (2) by at least two more games than the opponent. The winner of a match is the first player to win 3 sets (men's) or 2 sets (women's).
In a set, the players start at a score of 0–0 (in games) and alternate serves after each game is won. Eventually either there is a direct win—the score (in games) if A wins is 6–0, 6–1, 6–2, 6–3, 6–4, or 7–5, or if B wins it is 0–6, 1–6, 2–6, 3–6, 4–6, or 5–7—or the score of 6–6 is reached. If there is no direct win, the score must be 6–6 at some point; then, a tiebreak begins.
Recall that
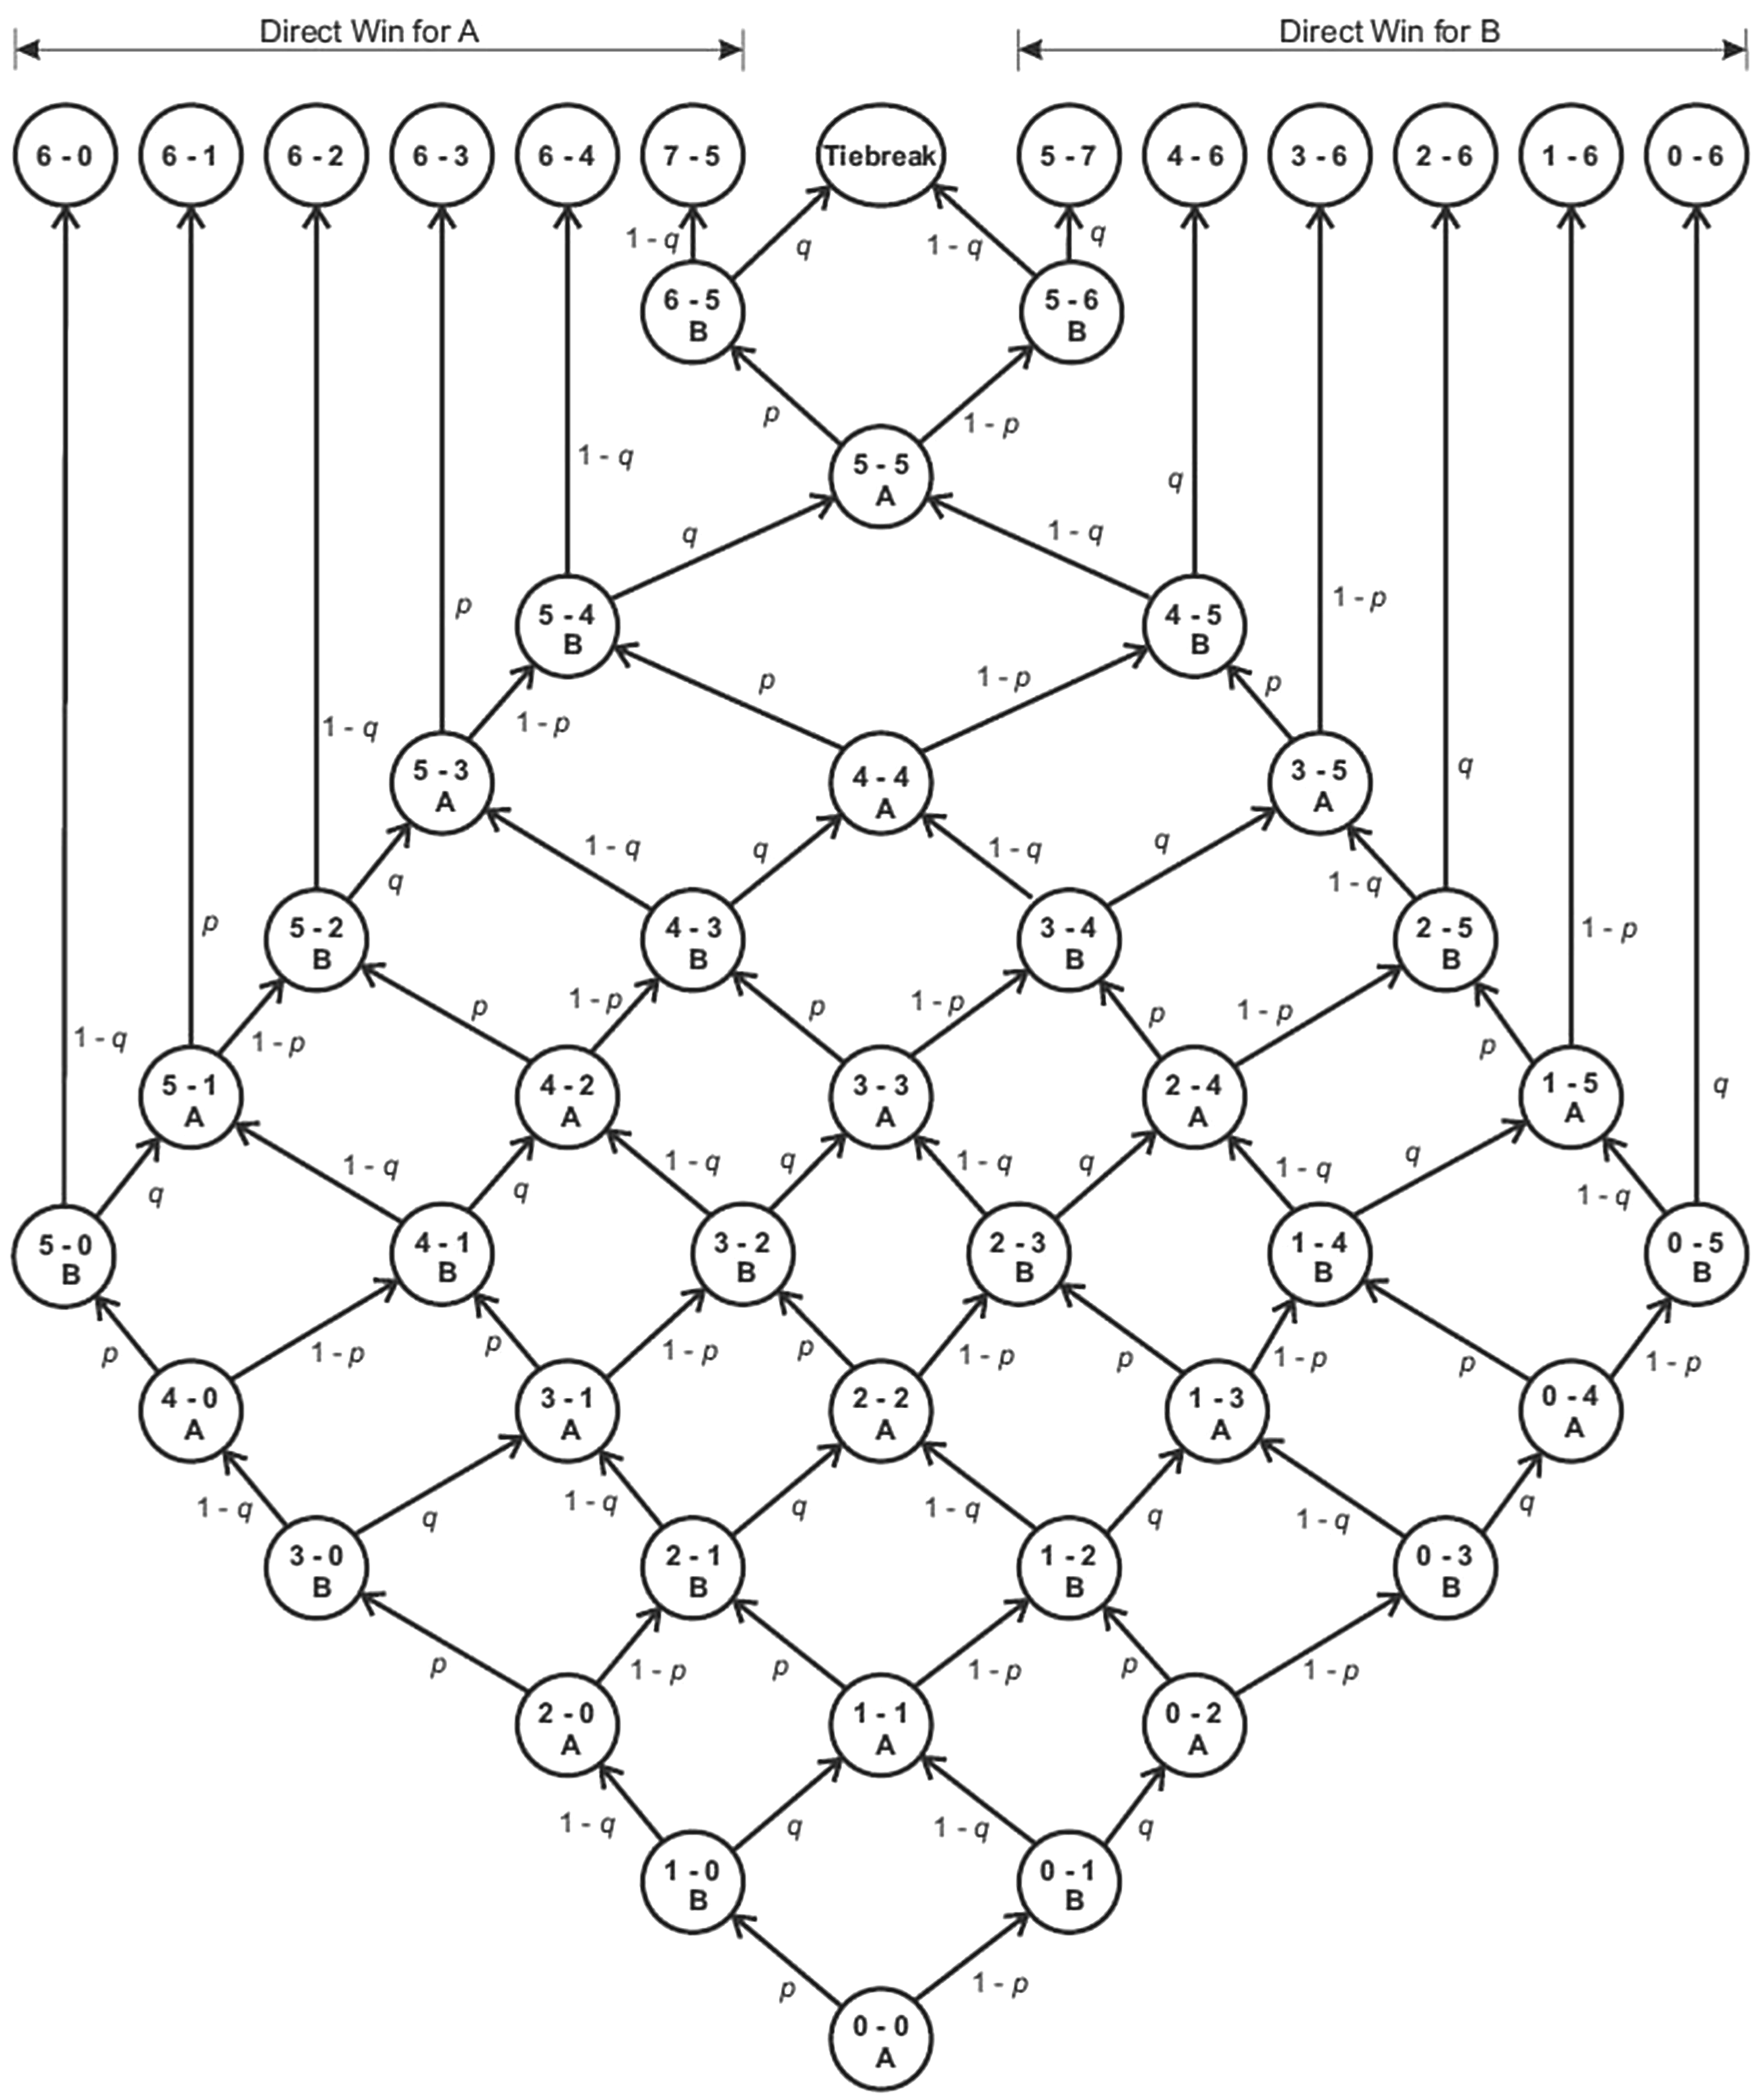
Markov chain of a tennis set.
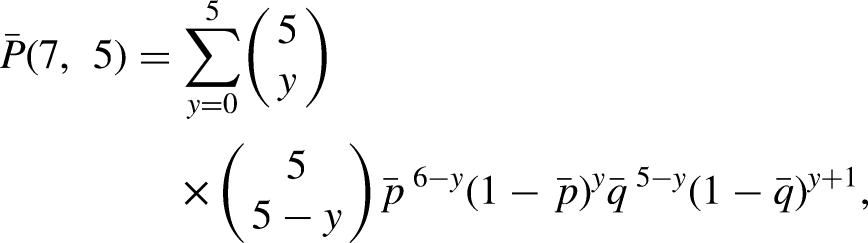
The probability that the set score is 6–x, denoted
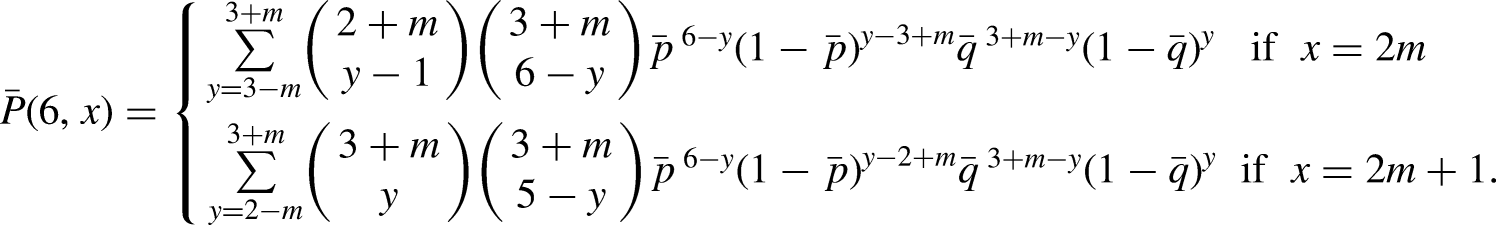
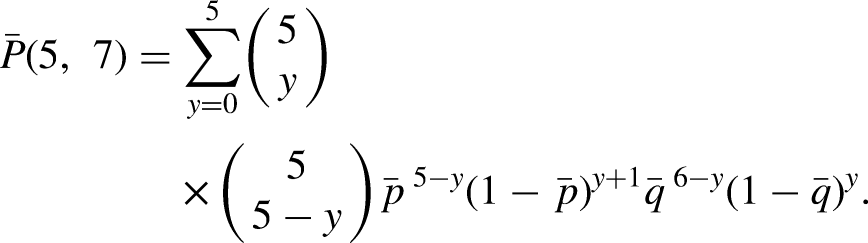
Note that the index of summation, y, equals the number of times that the winner “breaks serve,” i.e., wins a game in which the opponent serves. Similarly, the probability that the set score is x–6, denoted
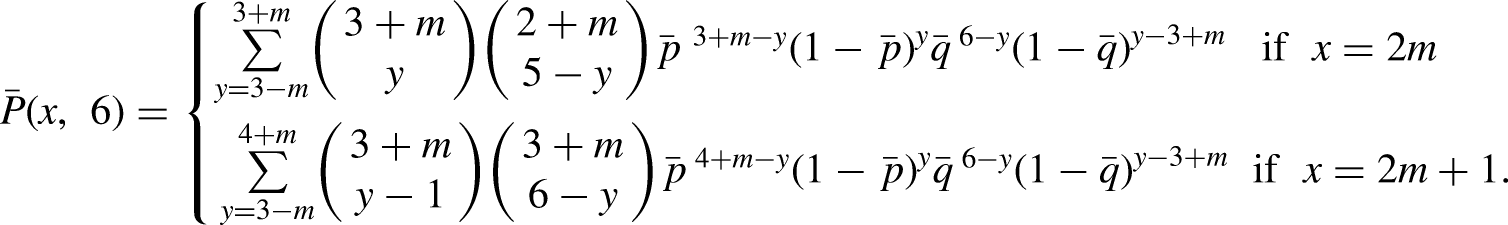
The probabilities of set scores 7–5 and 5–7 are
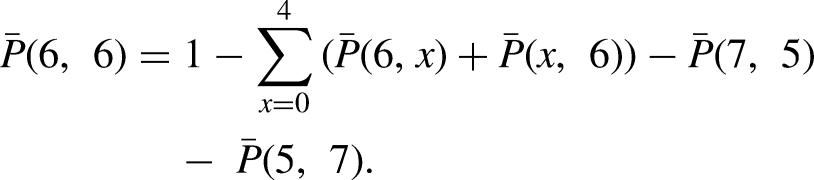
The probability that the set goes to a tiebreak is
If a set goes to tiebreak and A wins, its score is recorded as 7–6; if it goes to tiebreak and B wins, the recorded score is 6–7. Thus, the probabilities of set scores 7–6 and 6–7 are


This tiebreak is resolved according to the Markov subchain shown in Figure 2. It consists of eight states, two of which are absorbing, one a win for A and the other a win for B. The non-absorbing states are labelled with the name of the player who serves next and the value of r, the relative advantage of player A. Note that the winner is the first player to win two points more than the opponent. The initial (6–6) state is now called (A, 0), where it is A's turn to serve to begin the tiebreak.
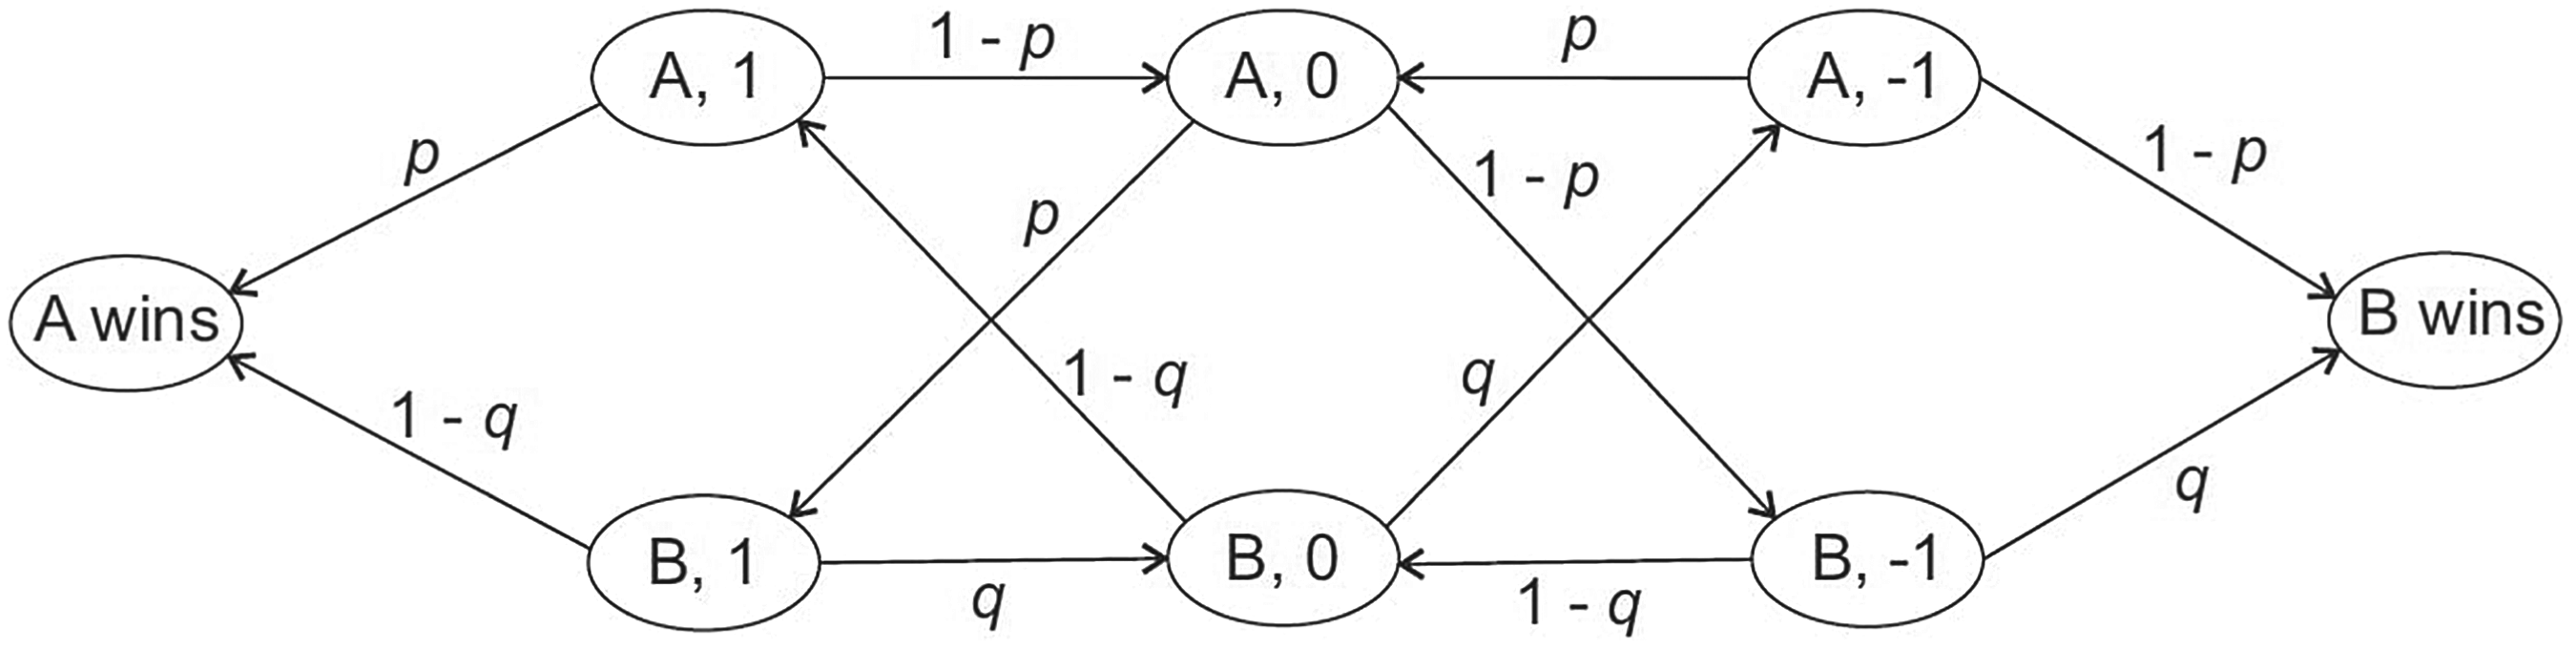
Markov subchain for a tiebreak.
If S is a non-absorbing state, let
The probabilities of wins for A from the initial state can be calculated using standard methods, and are found to be
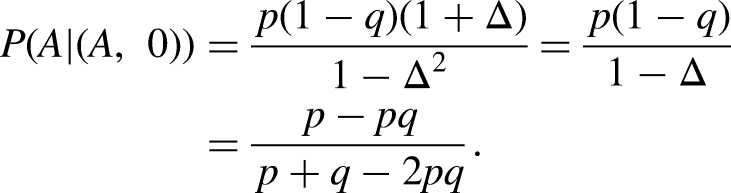
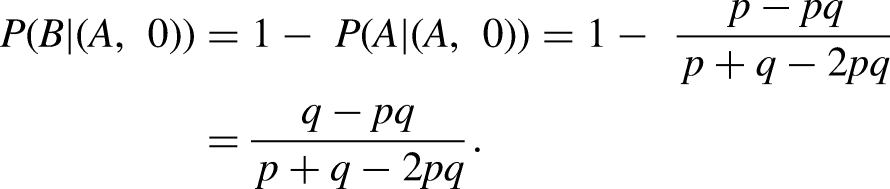
It can be checked that
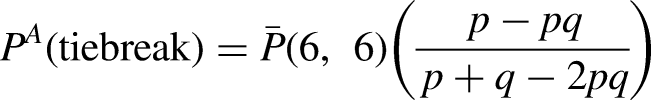
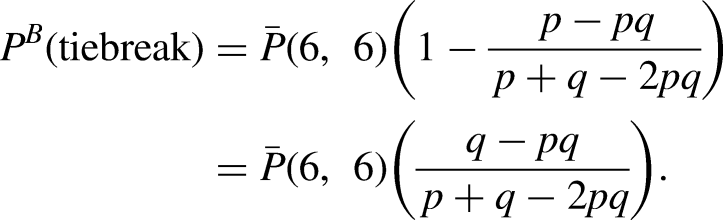
Finally, the unconditional probabilities that a set ends in a tiebreak that A (respectively, B) wins are given by the following formulas:
Thus, the probability that a set is won by player A is given by
If the two players are tied 6–6, the set is decided by a 7-point tiebreak, a special “game” involving serves by both players according to the ABBAABBAA … rule. The tiebreak continues until one player, the winner, has won at least seven points by at least two more points than the opponent. 4
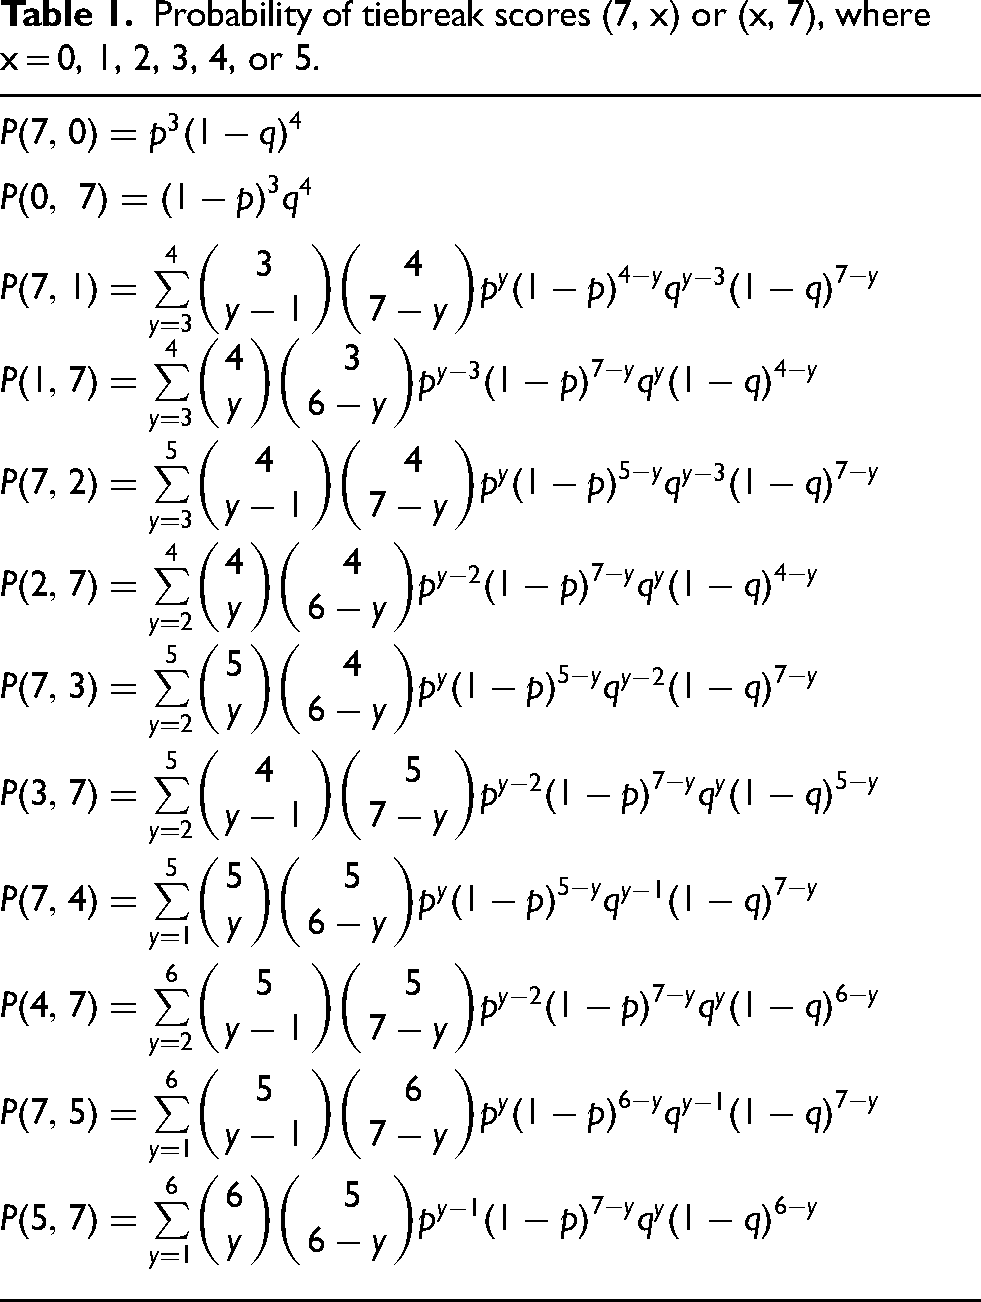
We assume, as usual, that A serves first in the 7-point tiebreak. Table 1 presents the formulas for the probabilities
Probability of tiebreak scores (7, x) or (x, 7), where x = 0, 1, 2, 3, 4, or 5.
If the tiebreak score is ever 6–6—so that the winner must score more than 7 points—the contest enters the “tiebreak of the tiebreak.” The probability that this occurs is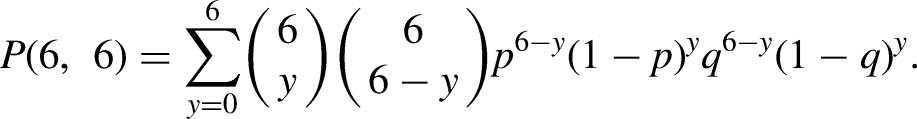
Finally, the unconditional probabilities that a tiebreak of a tiebreak occurs and that A and B win are given by
Thus, the probability that a tiebreak is won by player A is given by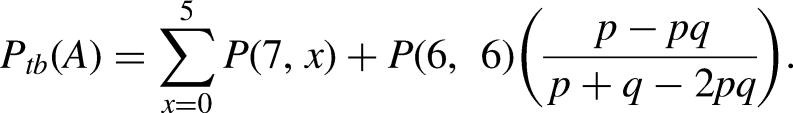
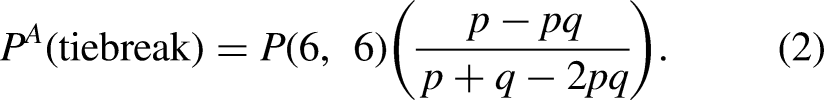
The grand tiebreak (GT) and the data
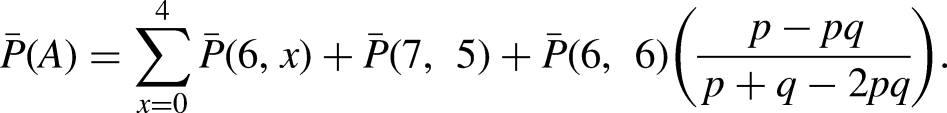
As noted earlier, the winner of a match (i.e., by sets) may win strictly fewer games than his/her opponent. We proposed that a Grand Tiebreak (GT) be used in such a situation to determine the player who more deserves to win the match. In this section, we assess the frequency of this discrepancy's occurring both in theory and in a dataset of Grand Slam Tournaments.
The grand tiebreak
Men's and women's Grand Slam Tournaments are played as best-of-5 matches and best-of-3 matches, respectively, so we focus on these two formats. In a best-of-(2k + 1) match, a set sequence is defined as a sequence of set scores in which one player wins k + 1 sets out of (at most) 2k + 1 of the sets played in the match. For example, in a best-of-5 match, A can win a match in three sets with a set sequence of [(6, 4), (6, 0), (7, 5)], or in four sets with a set sequence of [(6, 1), (2, 6), (7, 6), (7, 5)]. In a best-of-(2k + 1) match, where k = 1 or 2, if A wins, the match score is
We begin by calculating the total number of possible match scores and then determine how many of these lead to a GT. We earlier showed that there are 7 different set scores by which a player wins: for A, they are 6–0, 6–1, 6–2, 6–3, 6–4, 7–5, and 7–6.
First consider a best-of-3 match in women's Grand Slam Tournaments. We start by calculating the number of different set scores when the match concludes in 2 sets. Because there are 7 possible winning scores for each set, the number of different scores for a match that ends in two sets is
There are two distinct cases in which a player can win with a 2–1 or 1–2 match score, because the winner can lose either the first or the second set (but not the third set). For each of these cases, a 2–1 or 1–2 match score can occur in
To determine the number of ways a GT can occur, we count the match scores in which the winner wins strictly fewer games, in total, than the loser. First, consider a best-of-3 match. For a GT to occur, the final score must be either 2–1 or 1–2. Using a computer search, we found that there are 136 distinct match scores that lead to a GT for matches that end in three sets. Because there are in total 98 + 1372 = 1470 distinct match scores, the percentage of match scores with a GT is
Now consider a best-of-5 match. Similar calculations to those above show that there are 180 distinct match scores that lead to a GT for matches that end in 4 sets, and 32,124 distinct match scores that end in 5 sets. Overall, the percentage of match scores requiring a GT is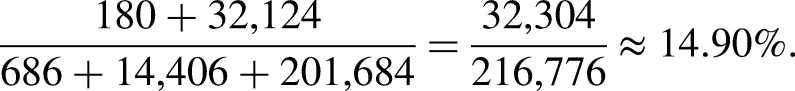
Thus, in almost 15 percent of all match scores, the winner wins fewer games, in total, than the loser.
The above calculations show that a non-negligible proportion of match scores leads to a GT if each set score is equally likely. But even casual observation suggests that a 7–5 set score is much more probable than a 6–0 sweep. This observation motivates the definition of a GT probability, which is the weighted average of match scores requiring a GT, with the weights based on the probability of each specific set score.
The GT probability
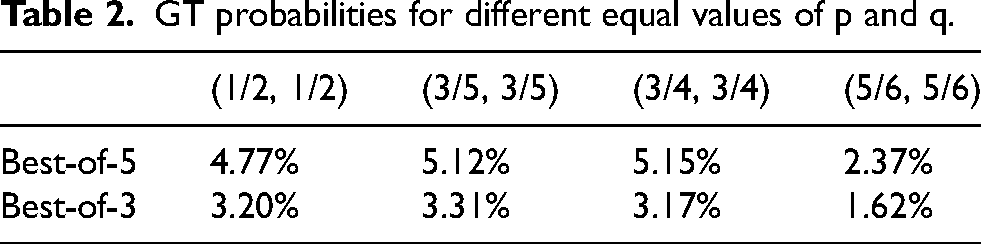
Recall that p is A's probability of winning a point when he/she serves, and q is B's probability when he/she serves. For different values of p = q, we calculate, using a computer program, the GT probability—the probability that the match winner wins fewer total games than the loser.
Notice that the best-of-5 GT probabilities are uniformly greater than the best-of-3 probabilities, indicating that longer matches raise the probability of a discrepancy between the game and the set winners when the players are equally skilled at serving. The maximum probabilities in each case are intermediate probabilities (3/4 for best-of-5, 3/5 for best-of-3), which are the two probabilities that best reflect the actual advantage of serving in Grand Slam Tournaments.
To illustrate the calculation of the GT probabilities in Table 2, consider the set sequence [4–6, 6–0, 6–0, 4–6, 4–6], which leads to a GT. B wins this match with 3 sets to A's 2 sets, but A wins 24 games compared to B's 18. According to the formulas in Markov chains, sets, and matches, for 
GT probabilities for different equal values of p and q.
The GT probability varies depending on the value of
Grand Slam dataset
We utilize a dataset compiled by Jeff Sackmann / TennisAbstract.com (available at www.github.com/JeffSackmann), which includes matches from 1968, the beginning of the Open Era in tennis, up to and including the 2024 US Open Grand Slam Tournament. In total, the dataset comprises 50,142 completed matches (25,399 men's and 24,502 women's) in Grand Slam Tournaments (i.e., excluding matches which ended because one player retired).
Table 3 provides summary statistics for the Grand Slam Tournament dataset. It also shows the number of matches where the winner won fewer games in total than the loser (referred to as Empirical GTs). The table compares these statistics across men's and women's Grand Slam matches, as well as those from the most recent three years (2022, 2023, and 2024). 5
Grand Slam summary statistics and empirical GT percentages.
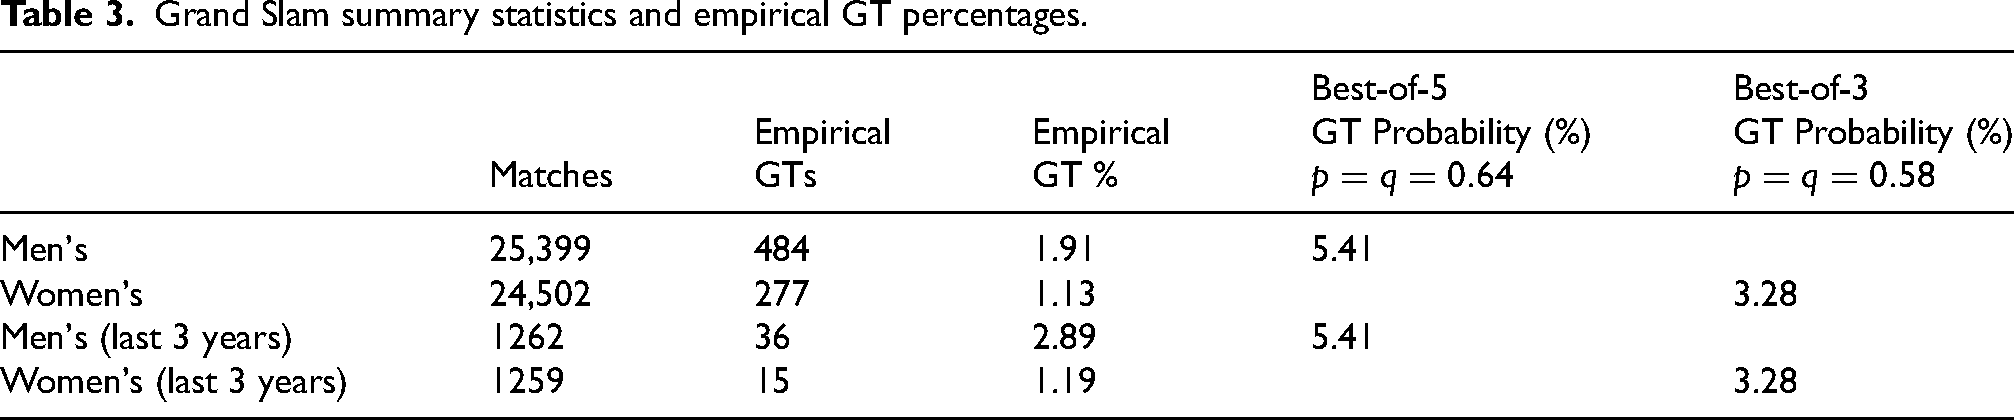
The Empirical GT Percentage column in the table presents the actual percentage of GTs for each category. The empirical GT probability is less than the theoretical GT probability (for men, about 2 versus 5 percent). But we note that about 14 matches per Grand Slam tournament would require a GT, a number we consider significant.
The GT Probability columns show the theoretical GT probabilities for men's and women's Grand Slam matches. These probabilities are calculated using empirical server point-winning percentages:
We think the gap between theoretical and empirical GT percentages is mainly because, early in a tournament, there are many matches between contestants who are not equally skilled. Higher-ranked players typically win most games and most sets, making a GT very unlikely. Straight-set wins (2 for women, 3 for men) are indeed about three percentage points higher in the first three rounds of Grand Slams than in the last three rounds: 49.4 percent vs. 46.7 percent for men, and 70.8 percent vs. 67.6 percent for women.
ATP and WTA dataset and GTs per round
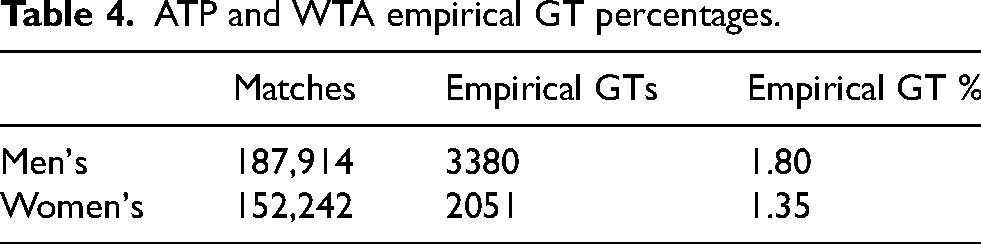
We now analyze the GT percentage in all ATP and WTA matches up to and including May 20, 2024. In total, this dataset comprises 340,156 professional singles matches. Table 4 presents the corresponding empirical GT percentages, which are similar to those observed in the Grand Slam dataset.
ATP and WTA empirical GT percentages.
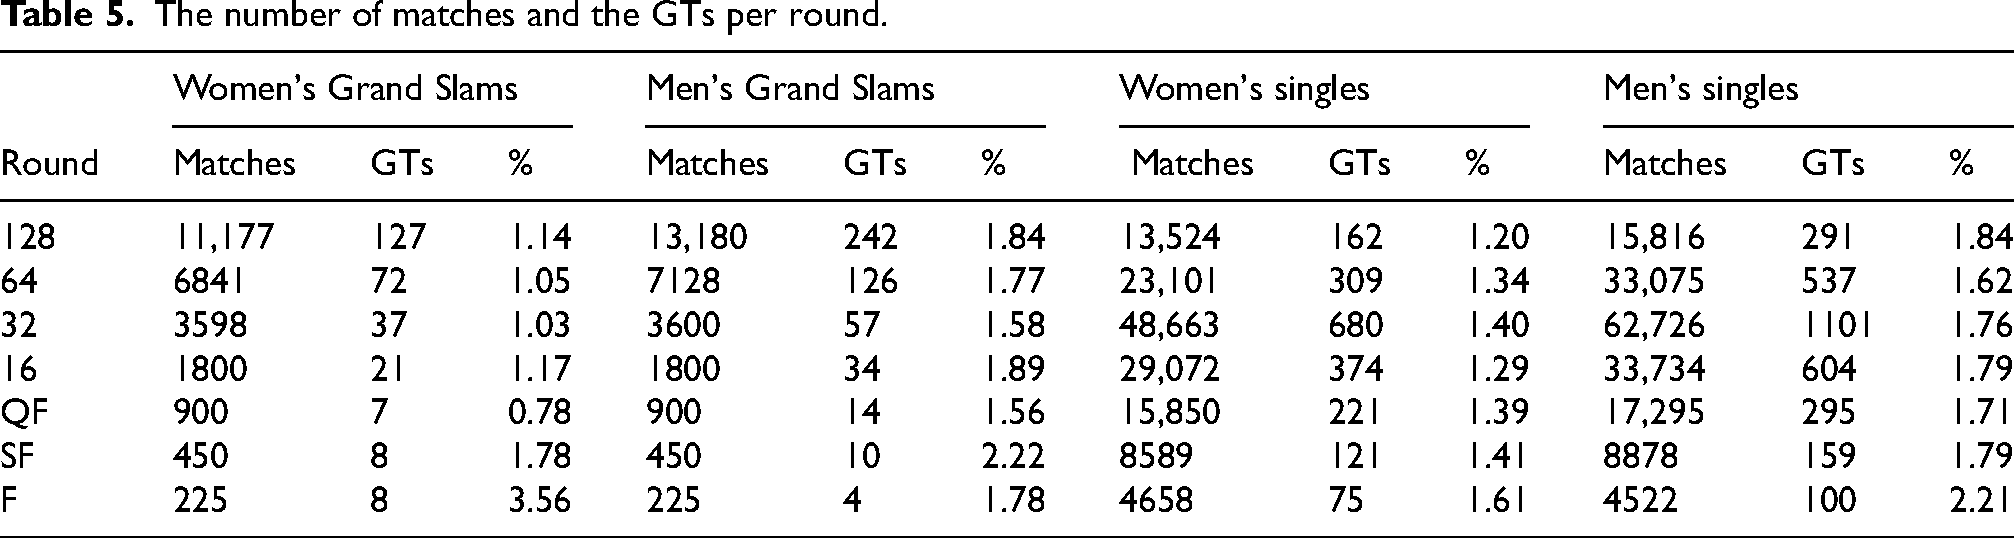
We next present the data on a per-round basis. Table 5 presents the number of GTs and the empirical GT percentage for different categories per round, from the round of 128 to the final (F). In both women's and men's singles, we observe a slight increase in the GT percentage as the tournament progresses. For women, it increases from 1.2% in the round of 128 to 1.6% in the final; for men, it increases from 1.8% to 2.2% over the same rounds.
The number of matches and the GTs per round.
Conclusions
We analyzed men's and women's Grand Slam tennis matches under the present rules of play, assuming that the players were equally skilled at winning points. We calculated the theoretical probability that the set winner does not win the most games in both men's and women's matches (about 5 percent for men and 3 percent for women).
We compared these figures with the number of matches in which this difference arose in actual play and found the theoretical percentage to be much higher than the actual percentage (5 vs. 1.9 percent for men). We think this is partly explained by the fact that, especially early in a tournament, the contestants are not equally skilled. In fact, the more highly rated players tend to win by more decisive scores in early matches, often in straight sets, in which a discrepancy between the set and the game winner cannot arise, making a GT moot.
But once the 128 contestants are whittled down to two in the first seven rounds of play, the two finalists are usually more or less equally skilled. More than 50% of men's final matches are won in 4 or 5 sets. If, in addition, the game winner is different from the set winner, we think it only fair that this discrepancy be resolved by a GT.
It is a startling fact that this discrepancy occurred in the 2019 Wimbledon final between Novak Djokovic and Roger Federer, which Djokovic won in five sets that took almost five hours to complete. (This made it the longest Wimbledon final ever; after reaching 12 games all in the 5th set, Djokovic won the set tiebreak 7–3.) But Federer beat Djokovic in almost every statistic used to measure tennis performance, including winning more games (36 to 32). 6 A GT would have given Federer the opportunity to test Djokovic's mettle, which seems only fair to decide such a nail-biting contest.
A saving grace of GT is that it will almost surely diminish the likelihood that it happens, because players will have an incentive not to coast in a set that they are likely to lose. Competing for every game, and even for every point, in order to win as many games as possible will make sets more engaging contests throughout a match.
The only downside to a GT, we think, is that it will be more exhausting for players, both physically and mentally. But shouldn’t physical stamina and mental resilience be considered the hallmarks of skill in sports?
There is a final question we would like to address: Tennis has a long and venerable history, so why are we suggesting a rule change now? First, tennis has not been immune to rule changes; over the last 50 years, the most significant was the tiebreak after a set ties at 6–6. This solved a serious problem of extraordinarily long matches, sometimes lasting more than a day. (When this problem is caused by inclement weather, it is solved in most high-level tournaments today by rolling out roofs.) We think that the 2019 Wimbledon final highlights the problem that the strengths of two players may well be gauged by different and equally valid performance measures. A GT will force players to try to succeed according to both measures, so its existence is likely to greatly diminish the need for it even to be invoked. 7
Footnotes
Funding
The authors received no financial support for the research, authorship, and/or publication of this article.
Declaration of conflicting interests
The authors declared no potential conflicts of interest with respect to the research, authorship, and/or publication of this article.