
Abstract
In this paper, we examine team ball sports to investigate how the likelihood of weaker teams winning against stronger ones, referred to as underdog achievement, is influenced by inherent randomness factors that affect match outcomes in such sports. To address our research question, we collected data on match scores and computed corresponding team rankings from major international competitions (World cups or Olympic games) for 12 popular team ball sports: basketball, cricket, field hockey, futsal, handball, ice hockey, lacrosse, roller hockey, rugby, soccer, volleyball, and water polo. Then, we developed an underdog achievement score to identify the sports with the highest occurrences of weaker teams prevailing over stronger ones, and we designed a randomness model consisting of factors that contribute to unexpected match outcomes within each sport. Our findings indicate that soccer is among the sports in which a weaker team is most likely to win. Through principal component analysis (PCA) and correlation analysis, we demonstrate that our randomness model can explain such a phenomenon, showing that the underdog achievement can be attributed to numerous factors that can randomly influence match outcomes.
Introduction
Team ball sports have been the subject of growing research over the past decade, and most of the papers are within the domain of sports medicine literature (Sarmento et al., 2022). In our work, we do not focus on medicine applications. Instead, we aim to provide novel insights into team ball sports by determining which sports are more likely to see weaker teams win, referred to as underdog achievement, and which randomness factors contribute to such an outcome. Since certain teams consistently outperform others in all sports, it is clear that outcomes of matches are not purely random. The question of whether a team wins due to chance or their own skills has been discussed in non-scholarly books. For example, in Sally and Anderson (2013), the authors claim that soccer, which is universally recognised as the world’s most popular sport (Dvorak et al., 2004), is also the most random, and its inherent randomness is what makes soccer so popular. Similar conclusions were confirmed in the academic literature by Ben-Naim et al. (2006), where the authors analyzed the English Football Association and four major North American professional sports leagues (MLB for baseball, NBA for basketball, NFL for American football, and NHL for hockey), finding that soccer is the sport with the most random outcomes. In general, the randomness element adds excitement and unpredictability, making a sport enjoyable to watch. However, one should also notice that excessive randomness can diminish interest, as viewers prefer a balance between unpredictability and skill (Mauboussin, 2012).
A novel research question is whether a weak team is more likely to win than a strong one as a consequence of certain random and situational conditions. Such a question has recently emerged as a research focus and has been studied by Wunderlich et al. (2021), where the authors use data from the English Premier League to show that the influence of randomness on goals in soccer decreases as the match progresses. Such a decreasing trend was observed to be disadvantageous for weaker teams, as they rely more on randomness to score. The study in Wunderlich et al. (2021) also identifies variables of randomness that affect the outcome during a match and cannot be entirely attributed to skills. Examples of such variables include the degree of involvement of the defending team and the chances to score goals from outside the penalty area. Additionally, the analysis includes situational variables that may influence the outcome by affecting the motivation of players, such as match location and current score. We conclude our literature review with Lopez et al. (2017), where a Bayesian state-space model was proposed to study the randomness in match outcomes for four major North American professional sports leagues (once again, MLB, NBA, NFL, and NHL). Probability-based metrics derived from betting market data were used to quantify the influence of chance on the outcomes. Their findings indicate that the MLB and NHL exhibit the highest levels of randomness in match outcomes (and we found a similar result for ice hockey in our study). However, soccer was not included in their analysis.
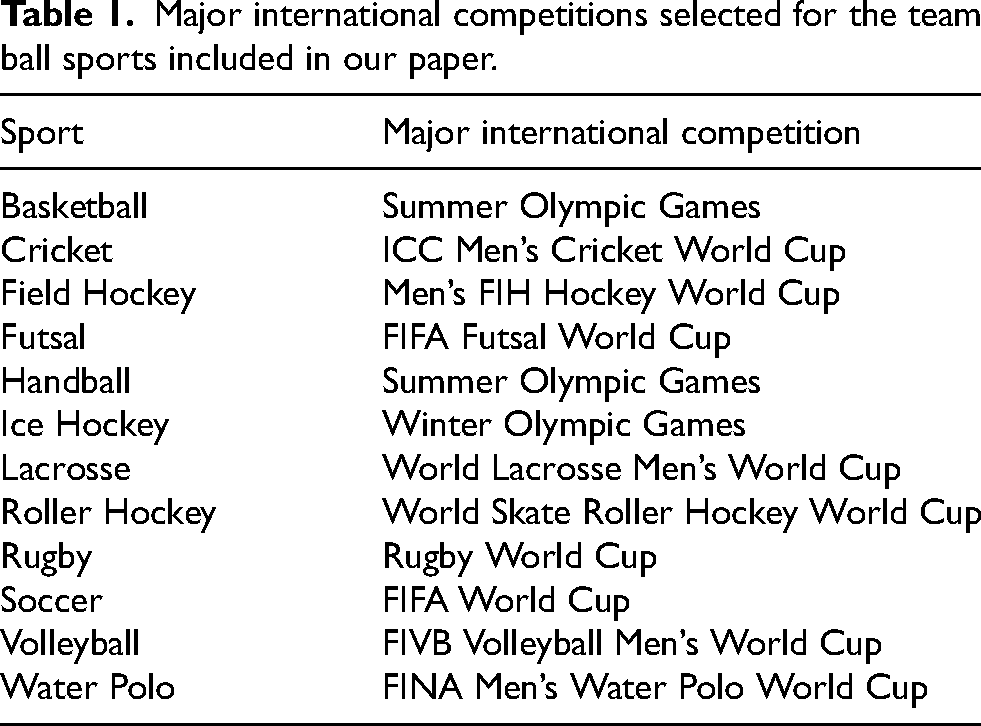
Previous studies examining underdog achievement have focussed on a limited range of team ball sports and have not systematically identified the randomness factors contributing to underdog victories. The ultimate goal of our paper is to investigate how the likelihood of weaker teams winning against stronger ones is influenced by inherent randomness factors in team ball sports. To achieve our goal, we selected major international competitions for 12 popular team ball sports: basketball, cricket, field hockey, futsal, handball, ice hockey (We include ice hockey among the team ball sports, even though it technically uses a puck.), lacrosse, roller hockey, rugby, soccer, volleyball, and water polo. The official names of the competitions selected for each sport are included in Table 1. Note that such competitions are all men’s events, for which more data is available. We notice that certain popular team ball sports, such as American football, baseball, and tennis, were not included in our analysis. This decision was made due to either the absence of international competitions for these sports or the smaller size of their teams compared to the sports considered in this paper (for instance, in tennis, teams consist of at most two players, whereas all the other sports discussed in our paper involve teams with many more than two players).
Major international competitions selected for the team ball sports included in our paper.
Our main contributions can be summarised as follows:
We collected match score data from major international competitions (World cups or Olympic games) held between 1970 and 2023, and we computed corresponding team rankings for each edition of the competitions in Table 1. This data represents valuable information for researchers in the field of sports analytics. We developed an underdog achievement score to determine the sports with the highest and lowest occurrences of weaker teams defeating stronger ones when focusing on a much broader range of team ball sports than the ones considered in the literature. In accordance with the limited existing literature (again, see Ben-Naim et al., 2006; Sally and Anderson 2013), soccer is among the sports with the highest underdog achievement. We designed a randomness model consisting of 13 factors that contribute to unexpected match outcomes within each sport, providing quantitative values for each of the factors. We performed principal component analysis (PCA) and correlation analysis to identify the randomness factors with the greatest impact on underdog achievement and demonstrate that our randomness model can explain underdog achievement.
Our paper is organised as follows. In Section Data collection: Match scores and team rankings, we detail our data collection process. In Section Underdog achievement, we develop an underdog achievement score and in Section Randomness model, we present our randomness model. In Section Explaining the underdog achievement through our randomness model, we perform PCA and correlation analysis to demonstrate how our randomness model can explain underdog achievement. In Section Concluding remarks and future work, we conclude our paper with some remarks and ideas for future work.
Data collection: Match scores and team rankings
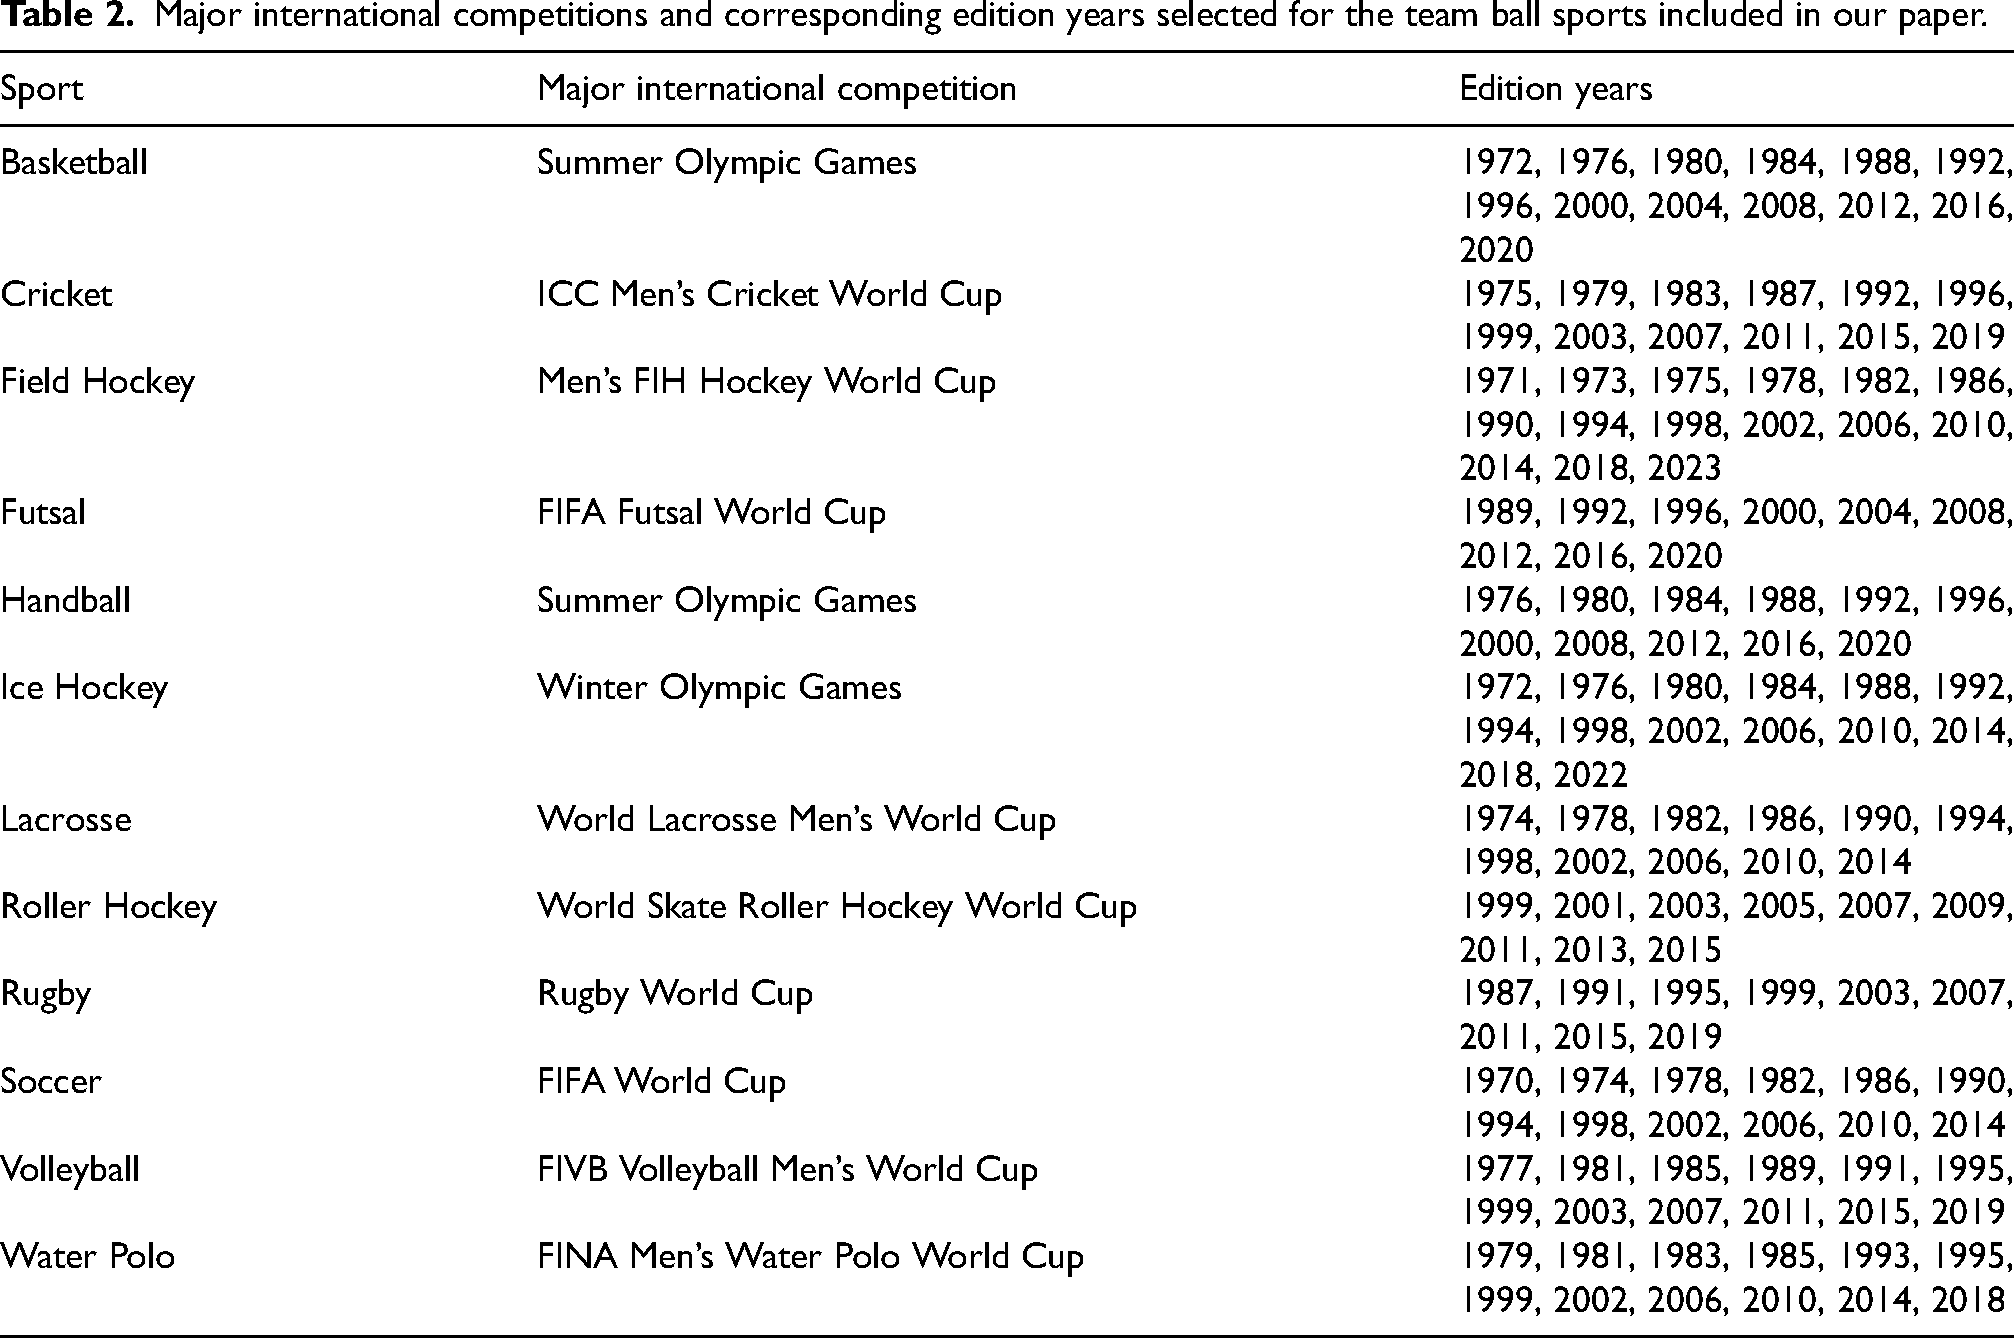
To perform our analysis, for each sport, we collected real data on match scores and computed corresponding team rankings for the major international sports competitions in Table 1. We selected such competitions due to the ease of access and availability of their data. The complete table with the years of the editions of each competition is provided in Table 2. We have arbitrarily included editions from 1970 onward to avoid introducing bias into our analysis, as earlier editions may exhibit different patterns compared to more recent ones. To obtain match score data for each edition, we conducted web scraping of match information from Wikipedia pages. All this data was aggregated into a match score dataset, which contains information related to individual matches, including the names of the two opposing teams and their respective scores. Given the match score dataset, we then computed a team ranking for each edition. Finally, for each competition, we aggregated the team rankings across all the edition years included in Table 2 into a weighted team ranking. Our code is publicly available on GitHub (https://github.com/thaksheel/randomness-team-ball-sports.git).
Major international competitions and corresponding edition years selected for the team ball sports included in our paper.
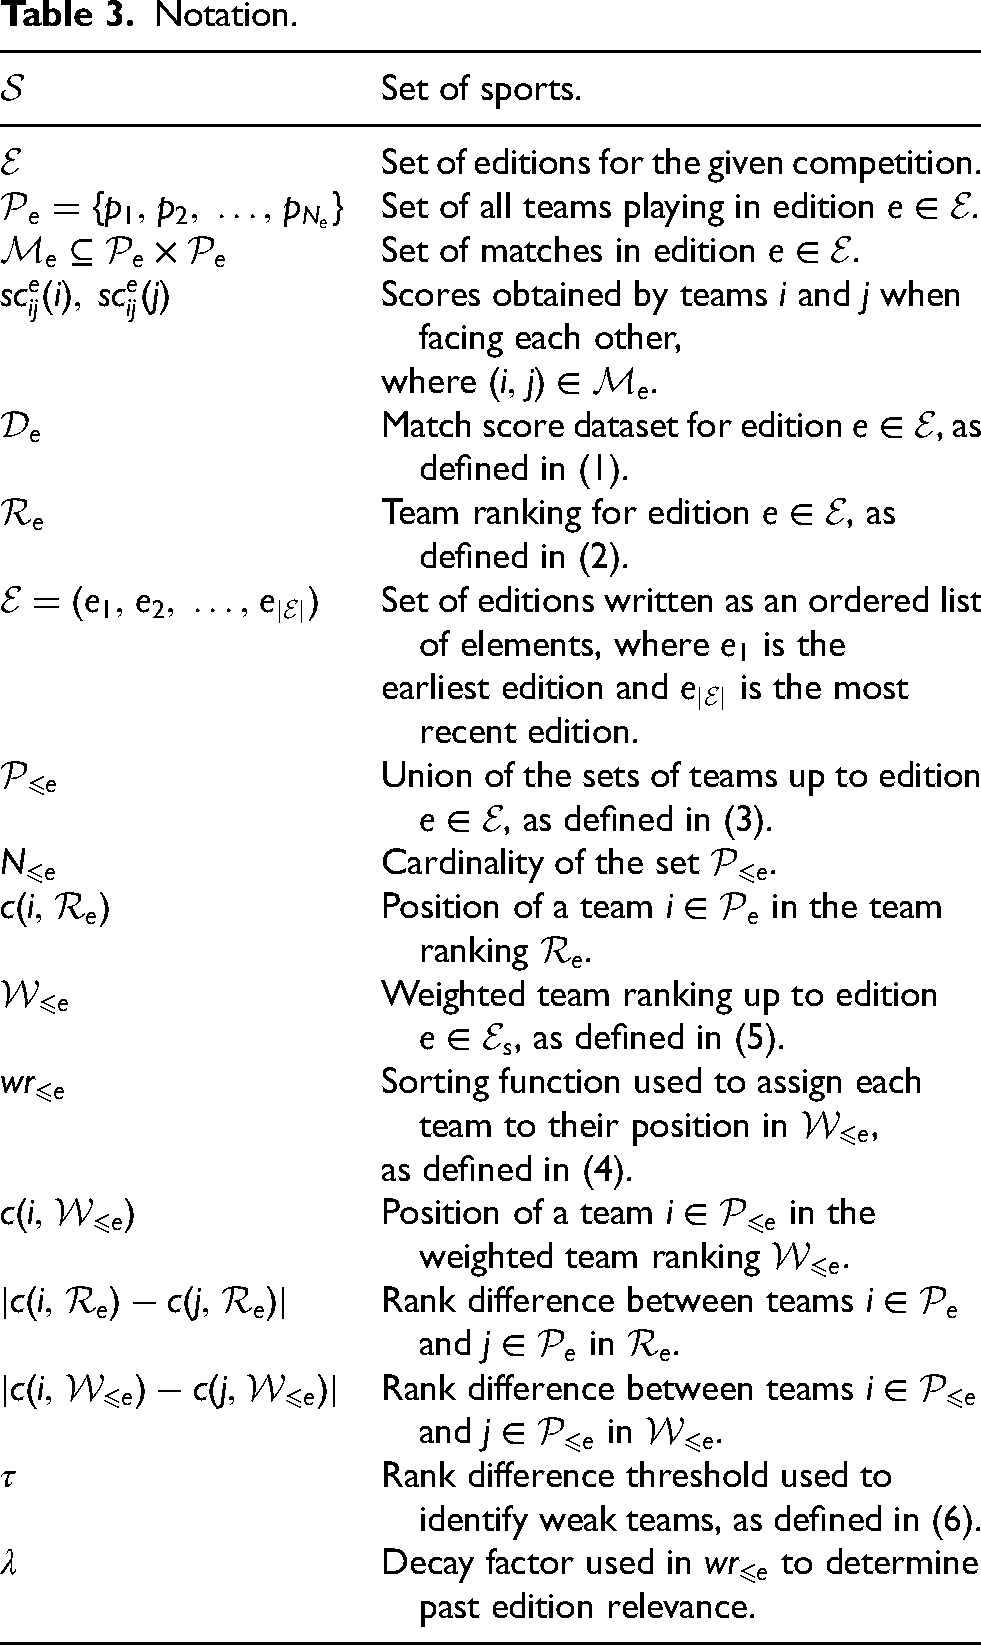
We will now introduce some general notation that will allow us to formally describe the match score dataset, the team ranking for each edition, and the weighted team ranking. Denoting as
Notation.
Match score dataset
For any edition 
Note that the match score dataset is a convenience sample (Elfil and Negida, 2017; Galloway, 2005), meaning it consists of data for specific competitions that was conveniently accessible and ready to be collected, rather than a dataset chosen through a random or probabilistic selection process from the population of interest, which includes all sports matches. This can introduce certain limitations due to the potential biases in the types of matches included in the sample, which may not fully represent the entire population. Despite such limitations, convenience sampling is the most common sampling method due to the impracticality of accessing the entire population (Edgar and Manz, 2017).
Team rankings
Based on the match score dataset 
An alternative to the team ranking logic adopted in our paper would be to use official team rankings from major international competitions. However, the availability of official ranking data is limited for many sports and competition editions. Official team rankings are mainly available for soccer and rugby, while rankings for other sports are often inconsistently documented or inaccessible. An advantage of using our team ranking logic is that it applies uniformly across all sports, despite the different rules and official ranking systems used in different competitions. We acknowledge that our team ranking logic does not account for the importance of specific matches within a competition, a factor typically considered in official rankings. In our approach, all losses and draws are weighted equally, regardless of the match’s significance.
Weighted team ranking.
The weighted team ranking aggregates team rankings from the earliest available edition up to a given edition. When referring to the weighted team ranking, we will explicitly write the set of editions as an ordered list of elements as follows 
To build the weighted team ranking that aggregates team rankings up to an arbitrary edition 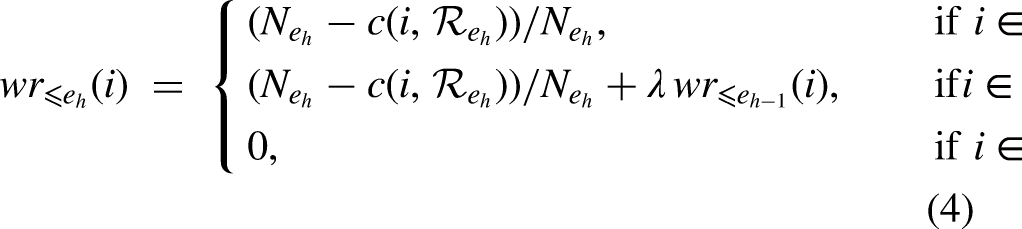
The weighted team ranking up to edition 
Underdog achievement
To quantify the underdog achievement, we first need to determine criteria that allow us to distinguish weak teams from strong ones. As noticed in the literature related to soccer (Wunderlich et al., 2021), determining a team’s strength is a difficult task because of the interaction between skills and randomness. Different approaches have been proposed to evaluate a team’s strength, such as using the positions of teams in team rankings (Evangelos et al., 2018), the total number of points scored in a competition (Heuer and Rubner, 2008), ELO-ratings (Hvattum and Arntzen, 2010), or betting odds (Wunderlich et al., 2021). In this paper, weak teams are identified based on their positions in the weighted team ranking described in Section Data collection: Match scores and team rankings.
Identifying weak teams
Given the weighted team ranking in (5), one can consider two strategies to identify weak teams. A first strategy consists of considering the top
The approach used in our paper consists of comparing the positions of two teams in the weighted team ranking and considering as weak the team that is ranked significantly lower, if it exists. In other words, there must be a relatively high difference in positions between the teams in the weighted ranking to consider the lower-ranked team as weak. Using the notation introduced in Section Data collection: Match scores and team rankings, for each edition 
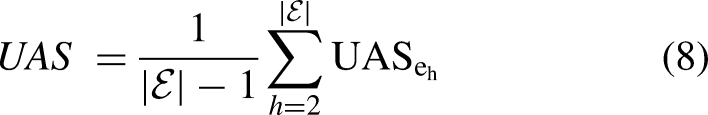
Underdog achievement score
Recall 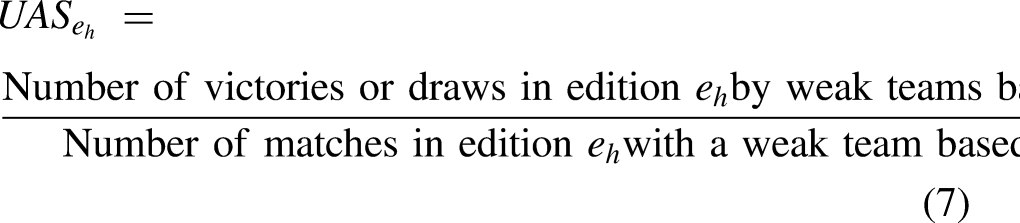
Numerical results
In this subsection, we first perform a rank difference analysis to determine the value of the threshold
Figure 1 represents box plots showing the distribution of the rank differences between teams
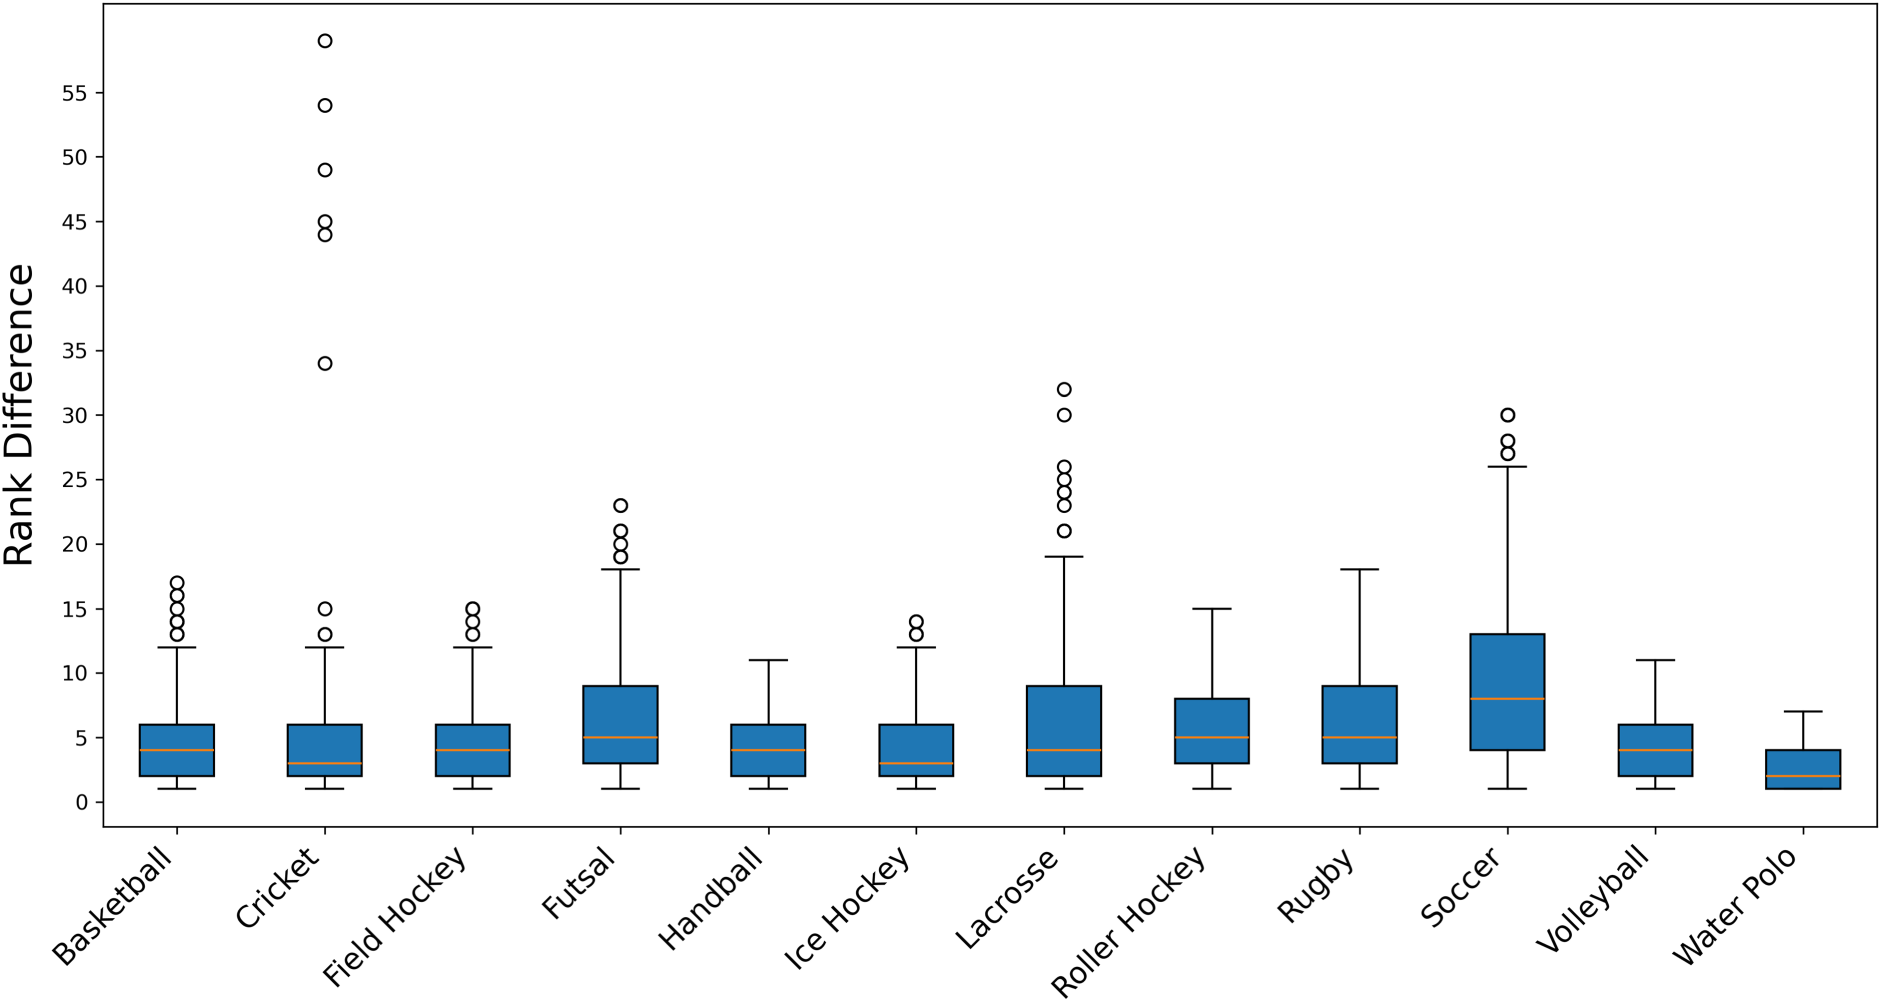
Box plot showing the distribution of rank differences between teams across all matches for each team ball sport included in our paper.
Threshold
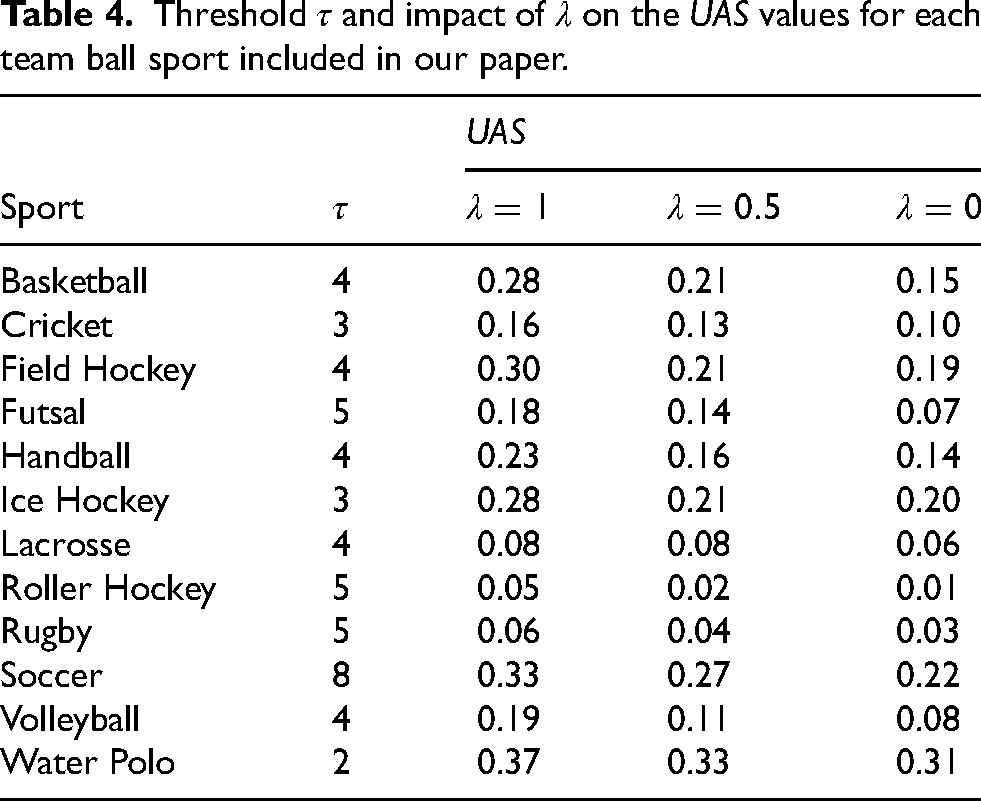
Figure 2 contains box plots representing the distribution of
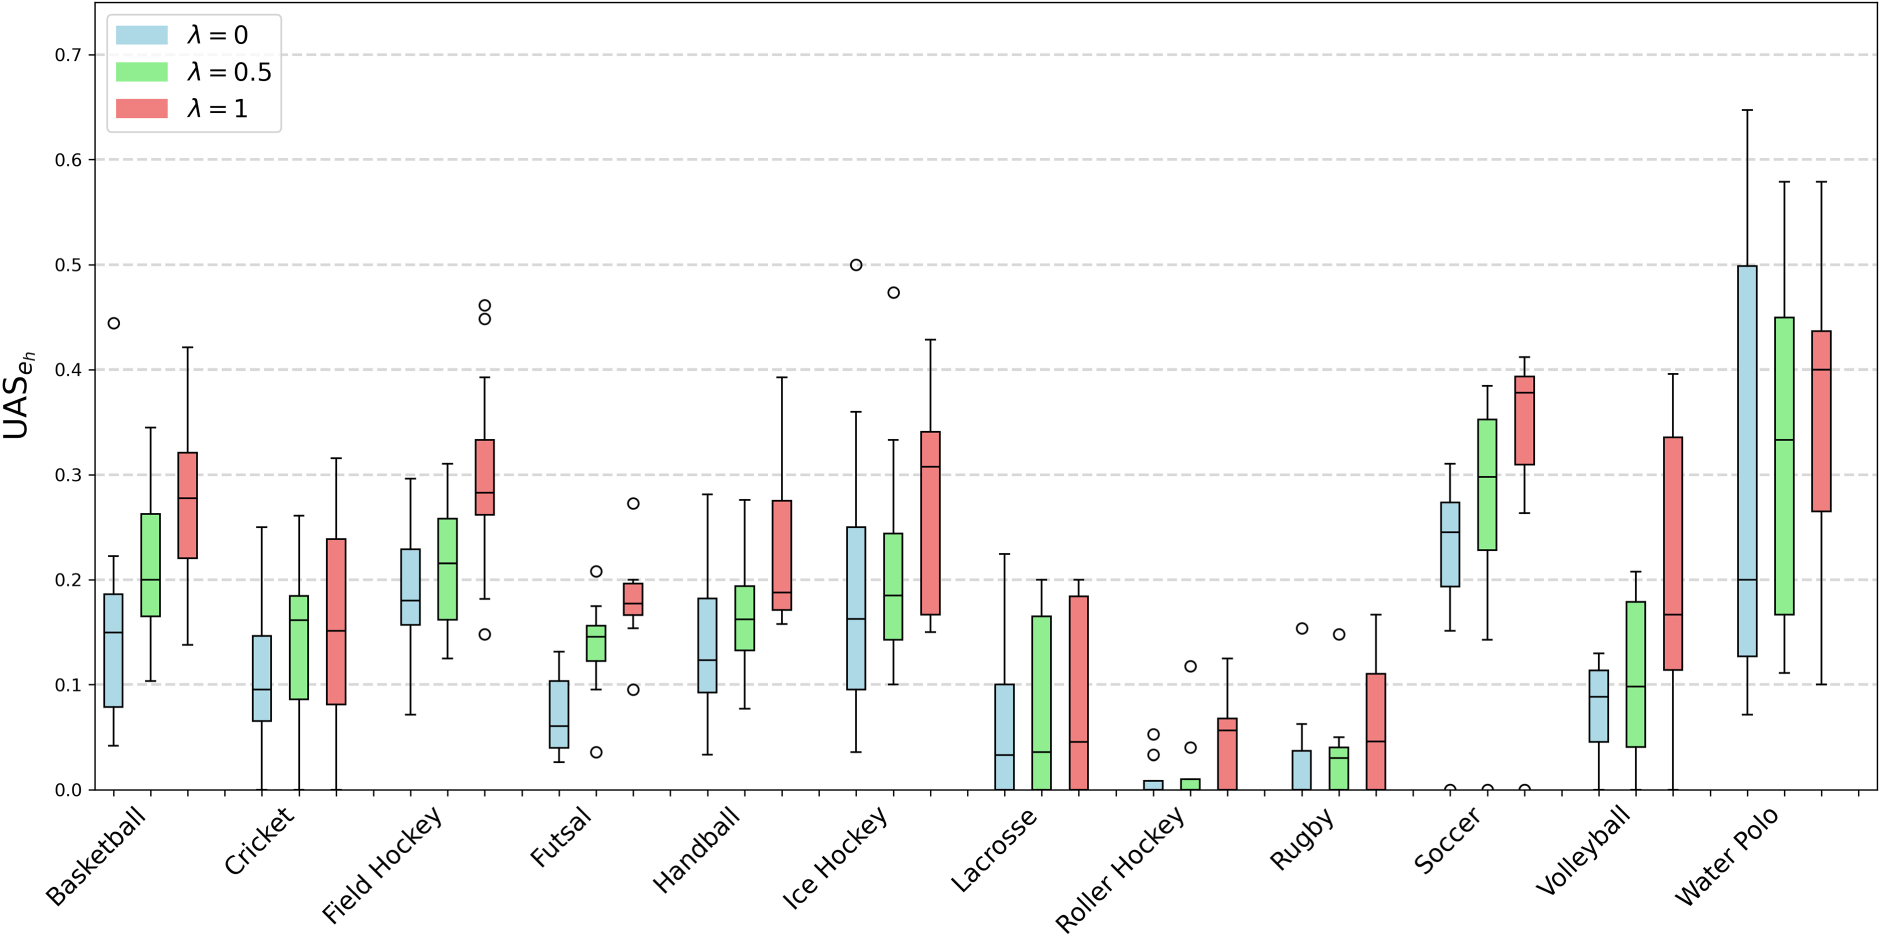
Box plot showing the
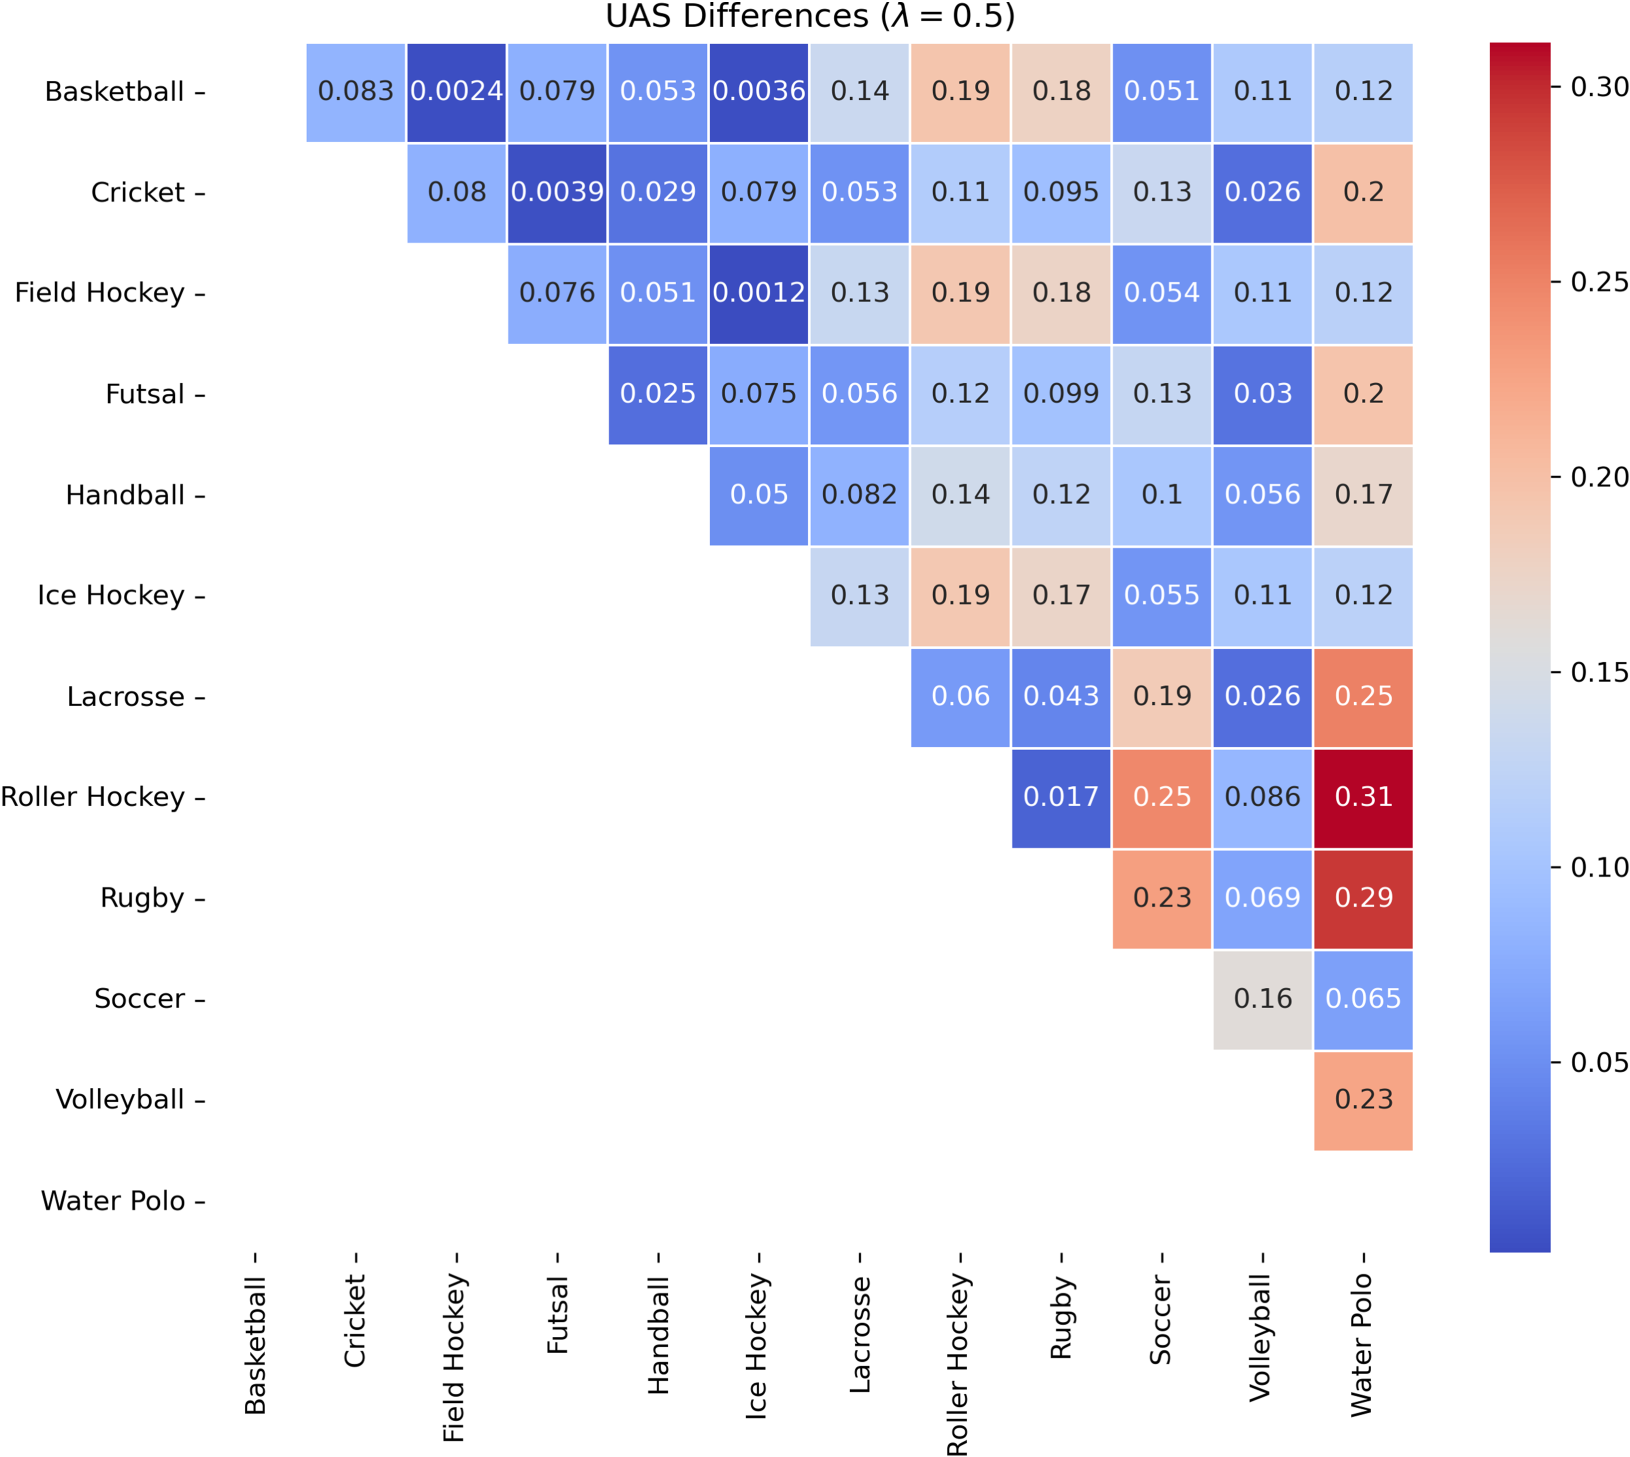
Upper triangular matrices representing the differences in UAS values for all pairs of sports, with the weight
Figure 4 includes graphs that depict the evolution of
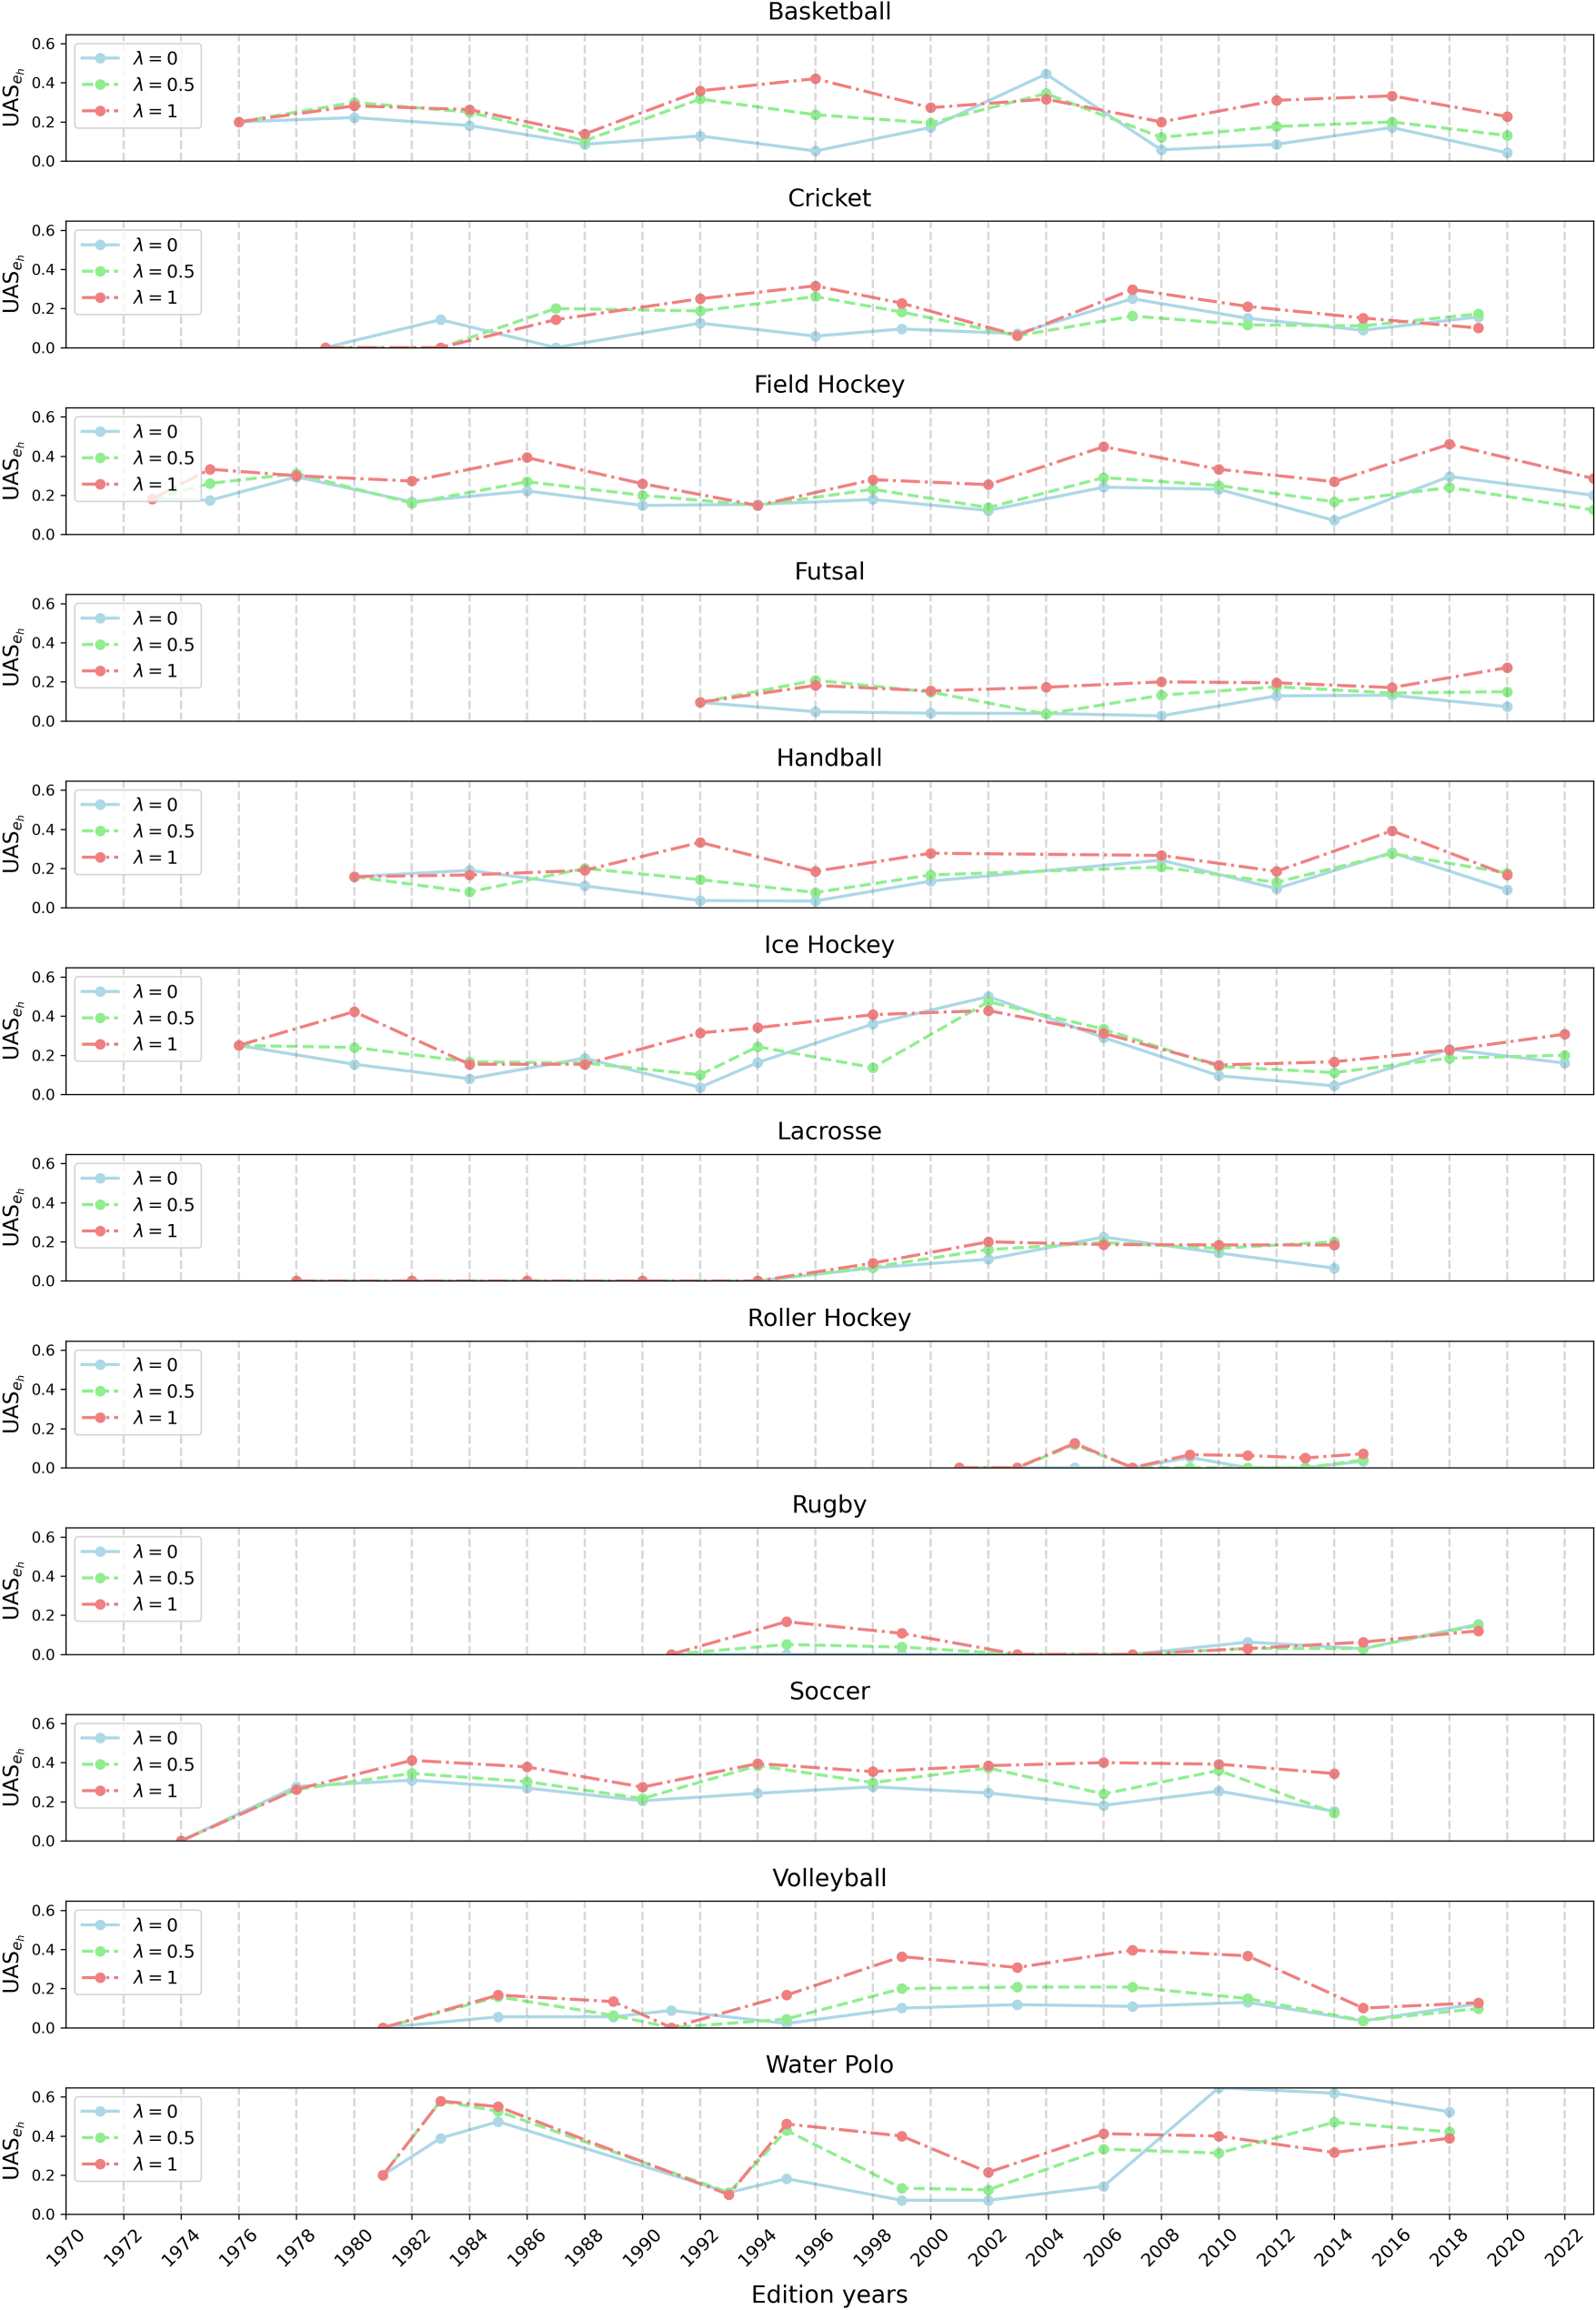
Graphs depicting the evolution of
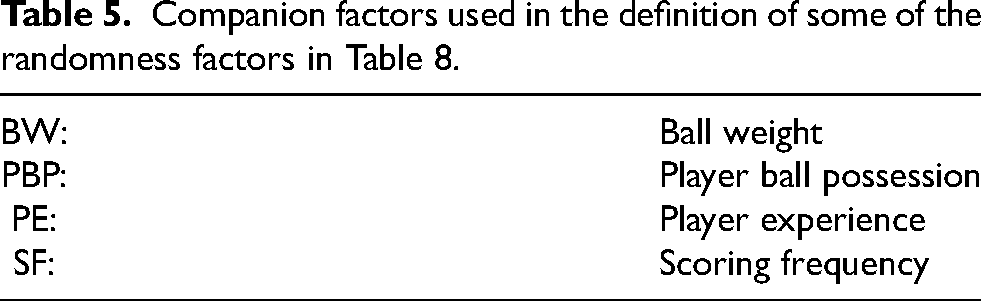
Companion factors used in the definition of some of the randomness factors in Table 8.
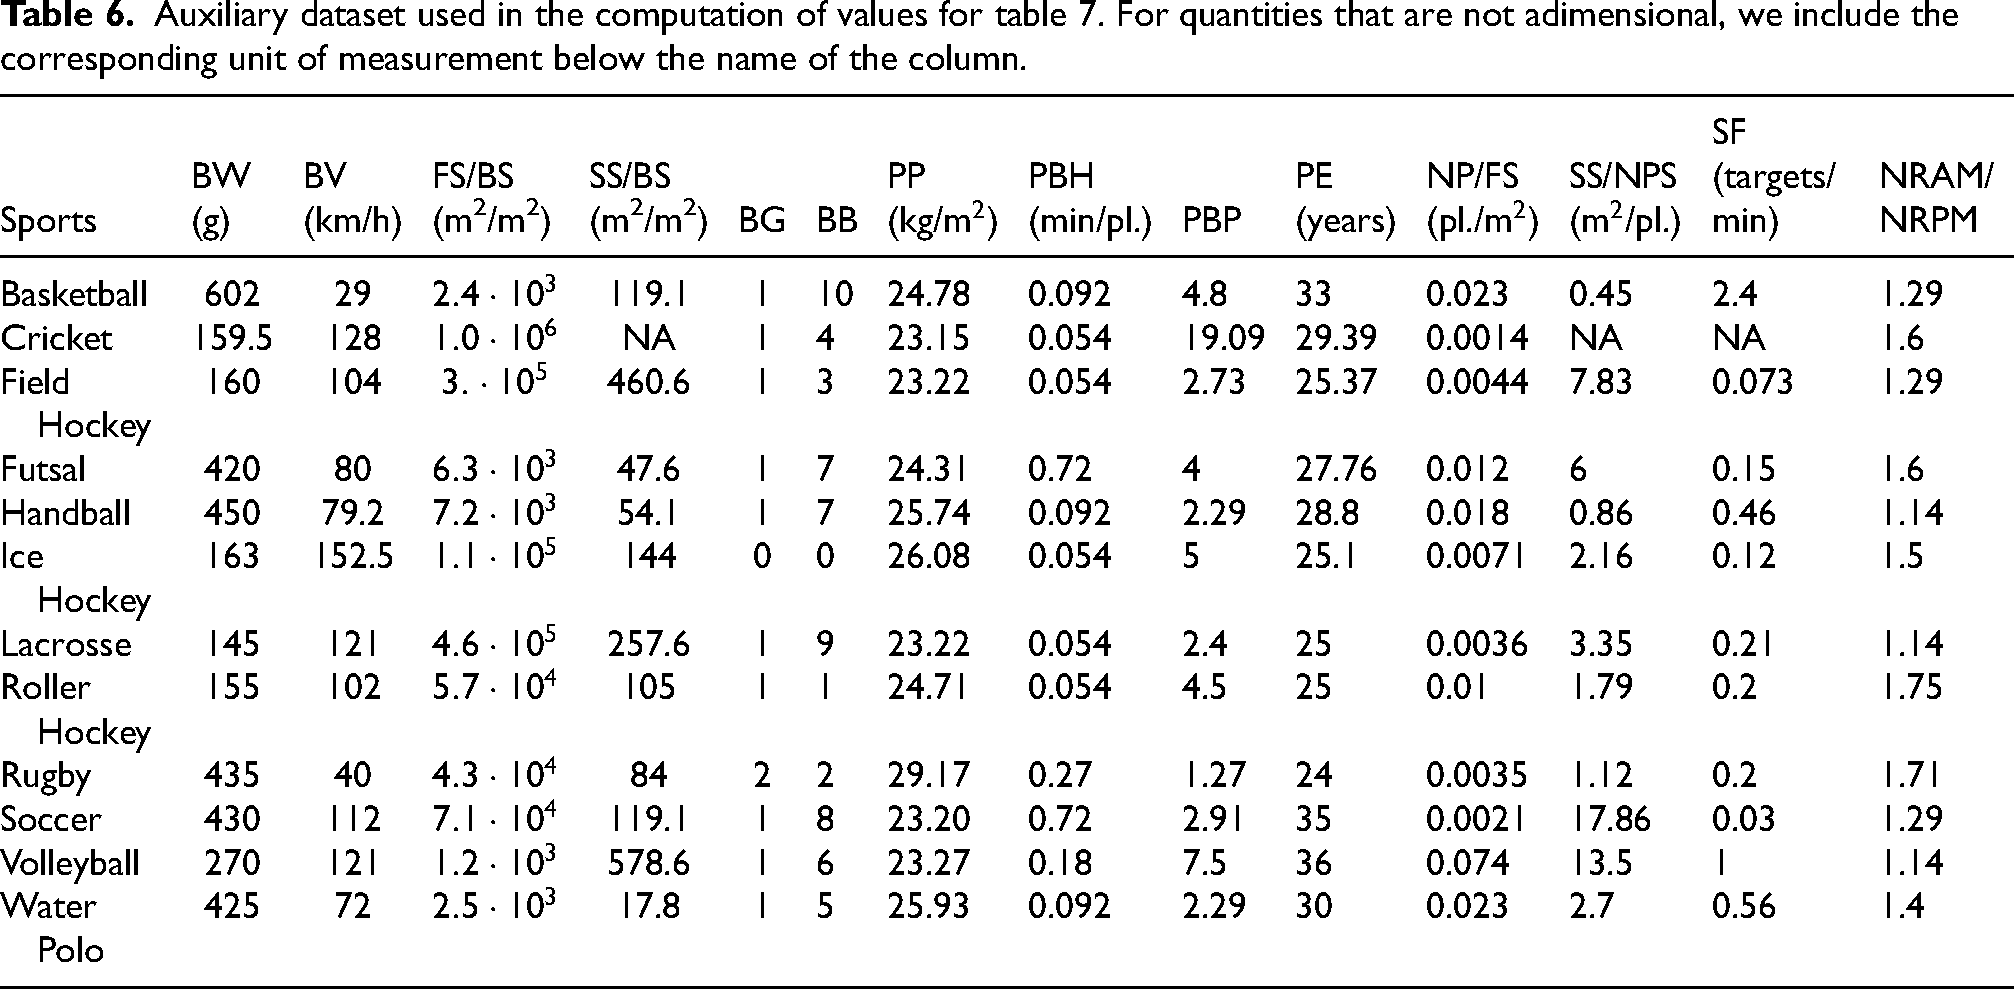
Auxiliary dataset used in the computation of values for table 7. For quantities that are not adimensional, we include the corresponding unit of measurement below the name of the column.
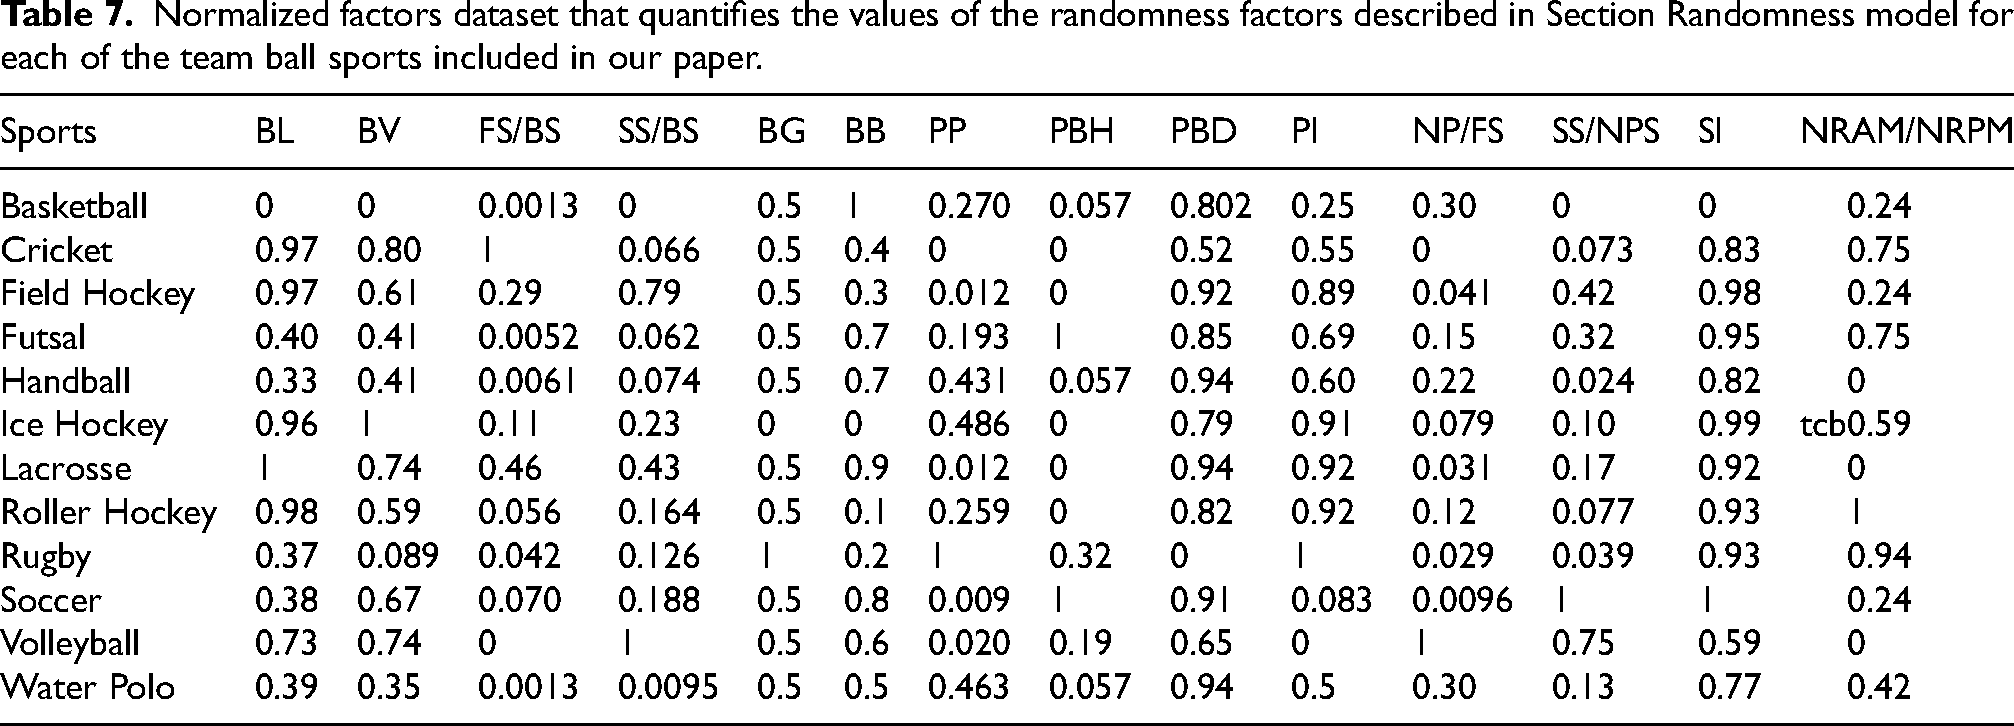
Normalized factors dataset that quantifies the values of the randomness factors described in Section Randomness model for each of the team ball sports included in our paper.
Randomness model
In this section, we develop a model consisting of randomness factors that can affect match outcomes in team ball sports. In Section Explaining the underdog achievement through our randomness model, such a model will be used to gain insights into the relationship between the randomness factors and underdog achievement. Unlike Wunderlich et al. (2021) and Lames (2018), which propose variables of randomness affecting goal scoring in soccer as the match progresses, our model focuses on static factors, assuming scores as given. Therefore, we exclude factors that may influence player motivation, such as match location and current score, which are known to impact all sports and are not of interest to our analysis.
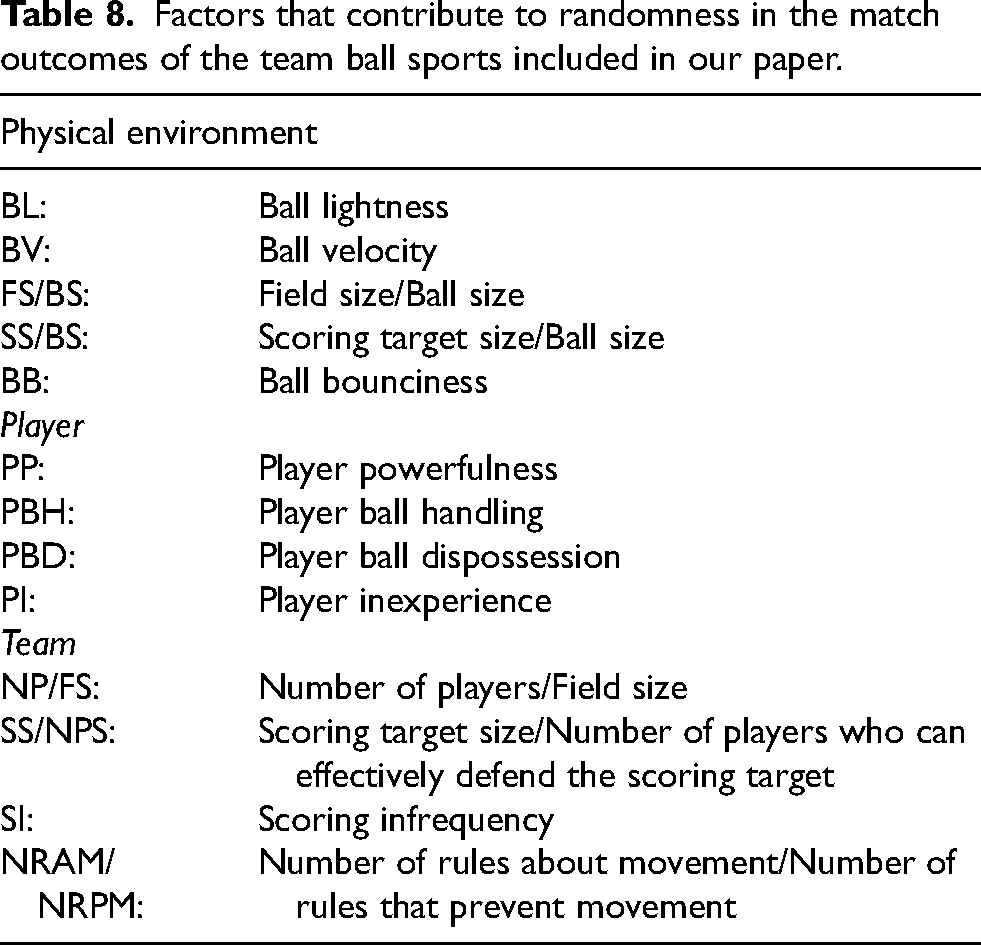
The factors that contribute to the inherent randomness observed in match outcomes are listed in Table 8 and categorised into three main groups: physical environment, player, and team. We believe that each of the factors in such a table should have a positive impact on randomness, meaning that a larger factor value corresponds to increased randomness. To provide further clarity into the relationship between such factors and randomness, we will include explanations when describing the three groups of factors in more detail. Although we believe the factors we have chosen comprehensively account for the observed variability in match outcomes across different sports, we acknowledge that the role of the factors in increasing or decreasing such variability reflects our own perspective. Table 5 includes companion factors used in the definition of some of the randomness factors in Table 8.
Factors that contribute to randomness in the match outcomes of the team ball sports included in our paper.
For each sport, we quantified the average values of the randomness factors, resulting in a factors dataset containing 12 rows (one for each sport) and 13 columns (one for each factor). Such a factors dataset, presented in Table 7 of Appendix “Factors dataset”, is provided in its normalised version. Table 6 serves as an auxiliary dataset used in the computation of values for Table 7. The sources for the values of the factors come from various websites and are available upon request. We will use the term “scoring targets” to collectively refer to the designated areas that allow teams to score, such as goals for soccer, baskets for basketball, and similar terms for the other team ball sports considered in our paper. The values in the factors dataset in Table 7 were derived by first using the formulas defined in the next subsections of this section and then applying normalisation to rescale the range of each column in 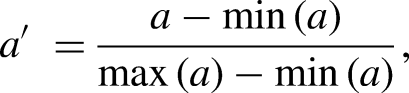
Physical environment factors
The physical environment category includes randomness factors related to properties of the sporting equipment and playing field. The formulas used to define such factors (including the units of measurement) are as follows:
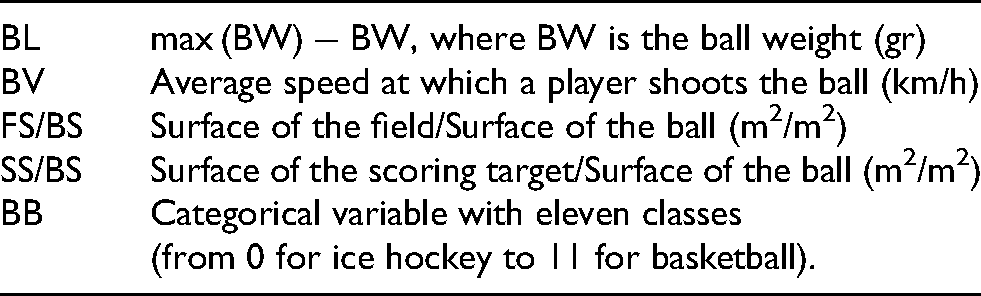
Ball lightness (BL), which is inversely related to ball weight (BW), influences the force required for players to control a ball. We expect that lighter balls contribute more to randomness because they are generally more difficult to control due to their reduced mass, responding differently to player actions. Ball velocity (BV) affects the timing of the gameplay, with faster balls expected to increase randomness. The ratio between field size and ball size (FS/BS) is related to spatial dynamics. Higher values for such a ratio are associated with less ball control and more player movement, thus increasing randomness. The ratio between the scoring target size and ball size (SS/BS) influences the dynamics of a match in a similar way, as higher values for such a ratio imply a higher likelihood of achieving a scoring target and changing the match outcomes. Since cricket lacks a scoring target, we estimate its ratio between the scoring target size and ball size by averaging values obtained for other sports. Ball bounciness (BB), which determines the extent of rebound upon impact, was treated as a categorical variable by assigning each sport to one of eleven categories, from 0 for ice hockey (no bounciness) to 11 for basketball (maximum bounciness).
Player factors
The player category focuses on player attributes and skills that contribute to randomness. The formulas used to define such factors (including the units of measurement) are as follows:
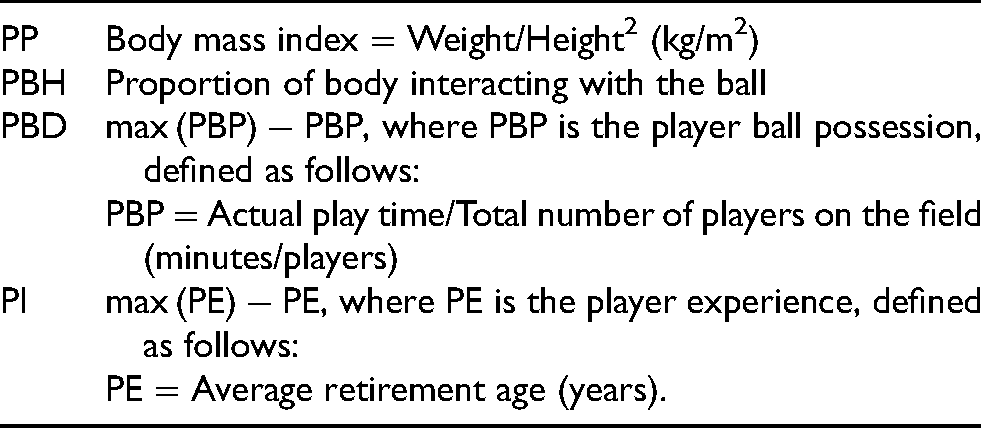
Player powerfulness (PP) is related to the strength with which a player strikes a ball, influencing its trajectory and speed. Such a factor is measured in terms of the body mass index of a player, which is defined as the body mass divided by the square of the body height. Higher powerfulness is expected to increase randomness. Player ball handling (PBH) refers to the percentage of the body used to control a ball. In the case of cricket, lacrosse, field hockey, ice hockey, and roller hockey, such a percentage takes into account the sticks. Player ball dispossession (PBD) refers to a player’s inability to maintain possession of a ball and, therefore, is inversely related to player ball possession (PBP), which we measure by the actual play time (i.e., match time, without including interruptions) divided by the total number of players on the field. Player ball dispossession influences scoring opportunities because the lower the possession, the lower the control on a ball, and the higher the contribution to randomness. Player inexperience (PI) is inversely related to player experience (PE), which we measure in terms of average retirement age. The average retirement age reflects the accumulation of skills and decision-making abilities over time, and thus results in performance consistency. Therefore, as the level of inexperience increases, so does the contribution to randomness.
Team factors
The team category includes randomness factors related to collective dynamics and match rules. The formulas used to define such factors (including the units of measurement) are as follows:
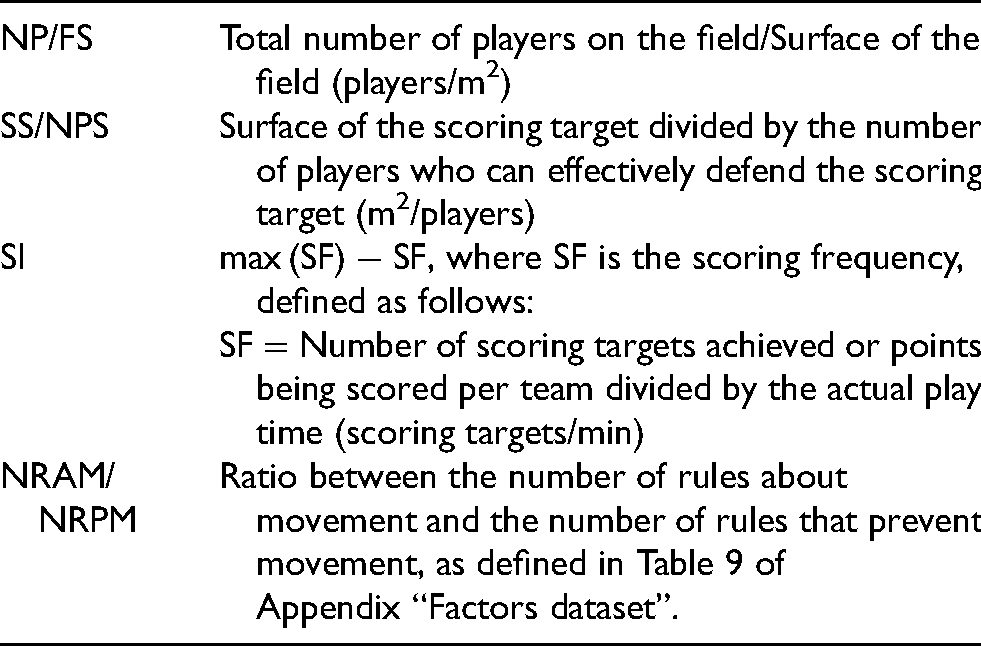
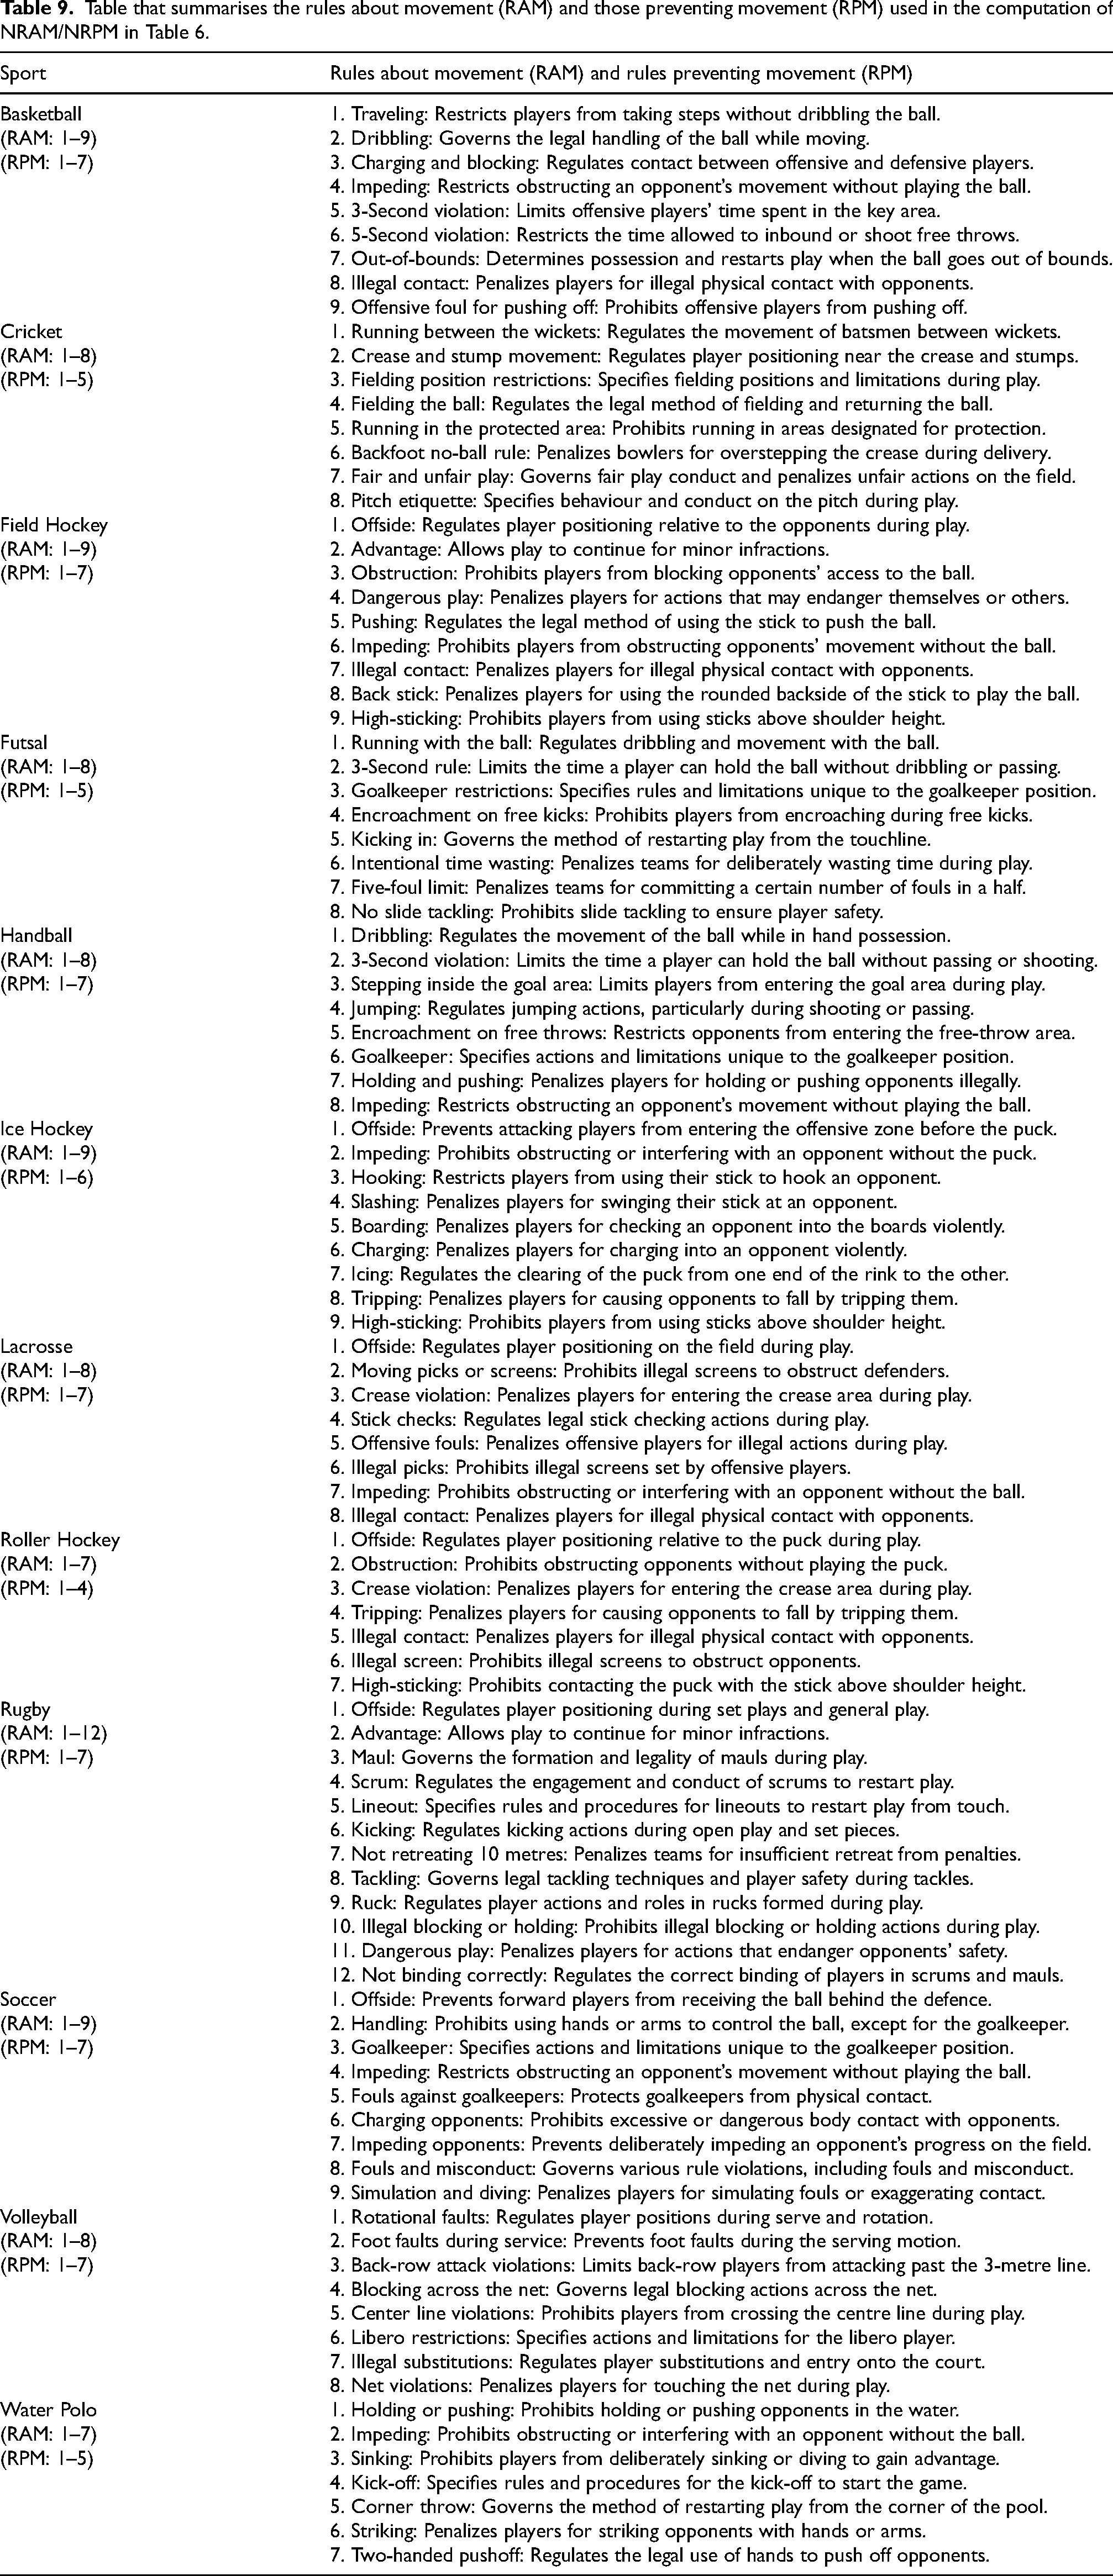
The ratio between the number of players and the field size (NP/FS) is a measure of the coverage of the field by players. A higher value of such a ratio is associated with a wider range of offensive and defensive strategies and, therefore, is expected to have a positive impact on randomness. The ratio between the scoring target size and the number of players who can effectively defend the scoring target (SS/NPS) is a measure of the defensive weakness of a team. The fewer players defend the scoring target, the higher the variability in match outcomes. We estimate the value of such a ratio for cricket, which lacks a scoring target, by averaging the values obtained for the other sports. Scoring infrequency (SI) refers to how rarely scoring targets are achieved during a match. Such a factor is inversely related to the scoring frequency (SF), which we measure by the number of scoring targets achieved or points being scored per team divided by the actual play time. Sports with a low number of scoring targets achieved per match are more sensitive to randomness (in the sense of the final outcome of a match) and, therefore, the scoring infrequency can significantly impact the overall match outcome. The presence of team rules that restrict movement imposes tactical constraints, limiting team dynamics and playstyle. Fewer movement constraints can result in greater unpredictability for match outcomes. Table 9 of Appendix “Factors dataset” includes all the rules considered for the computation of the ratio between the number of rules about movement and the number of rules that prevent movement (NRAM/NRPM).
Table that summarises the rules about movement (RAM) and those preventing movement (RPM) used in the computation of NRAM/NRPM in Table 6.
Explaining the underdog achievement through our randomness model
In this section, we perform a PCA and a correlation analysis to gain insights into the relationship between the
Principal component analysis
By applying PCA, one can transform the factors dataset in Table 7, consisting of 13 columns, into a reduced dataset with as many columns as the number of principal components selected, where each principal component is obtained as a linear combination of the columns in the original factors dataset. Figure 5 represents the PCA plots for the first two principal components resulting from the application of PCA to the original factors dataset (upper plot) and the factors dataset with an additional column consisting of the
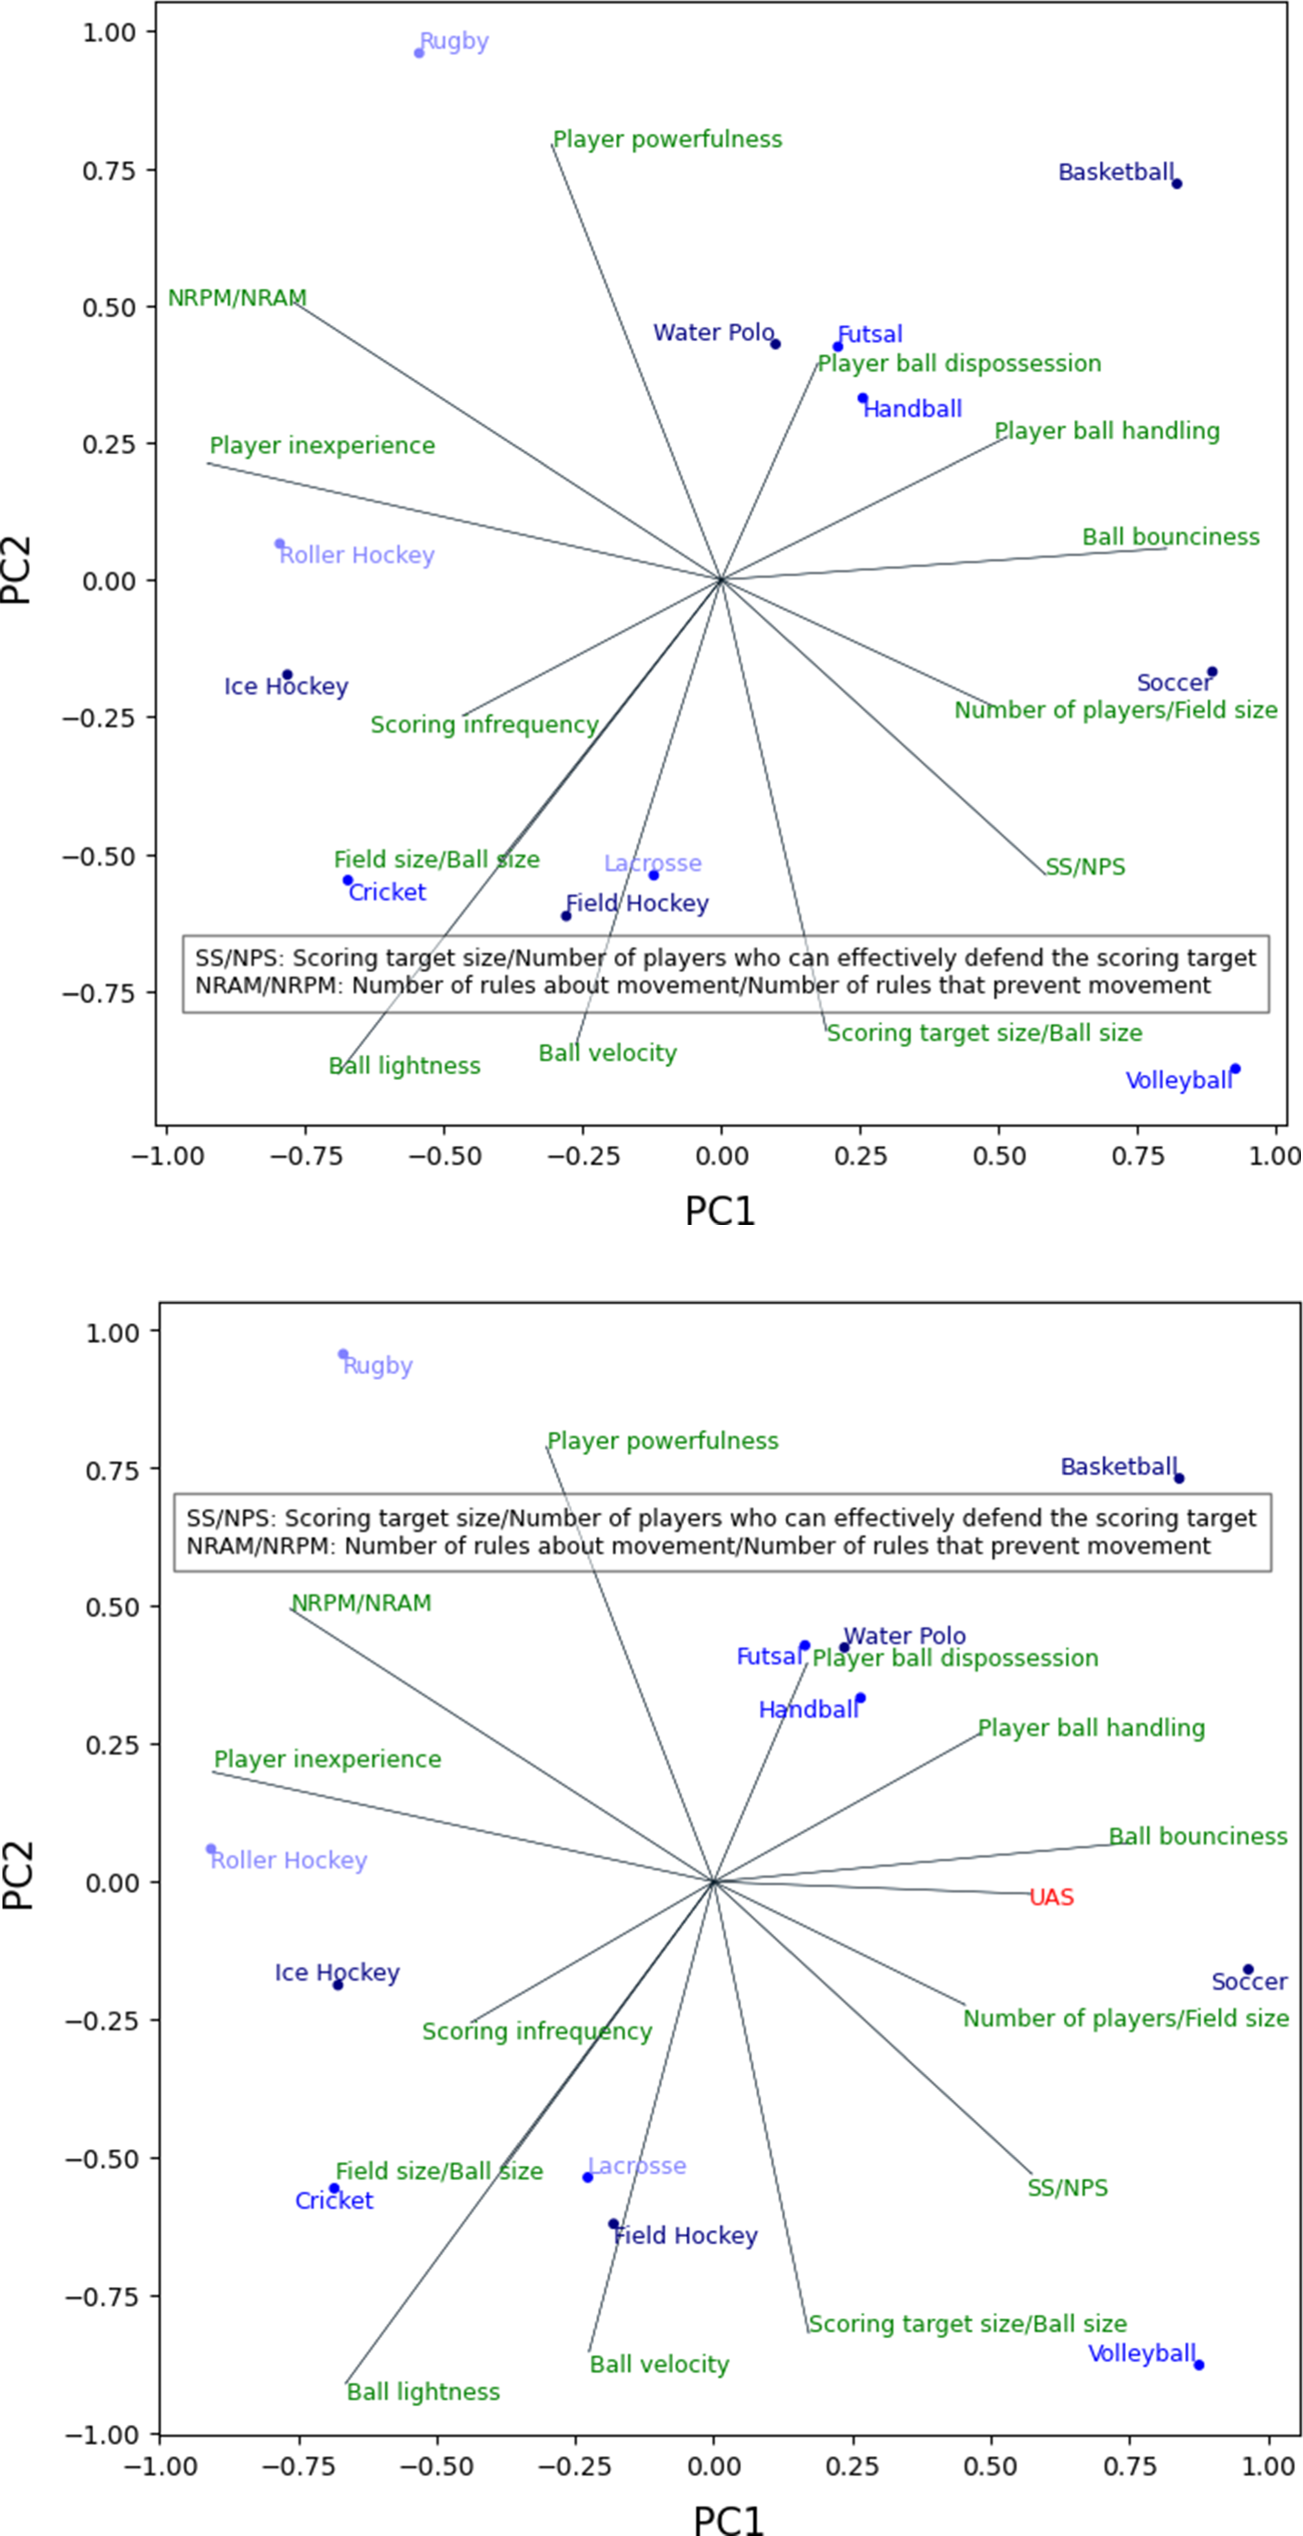
PCA plots, without
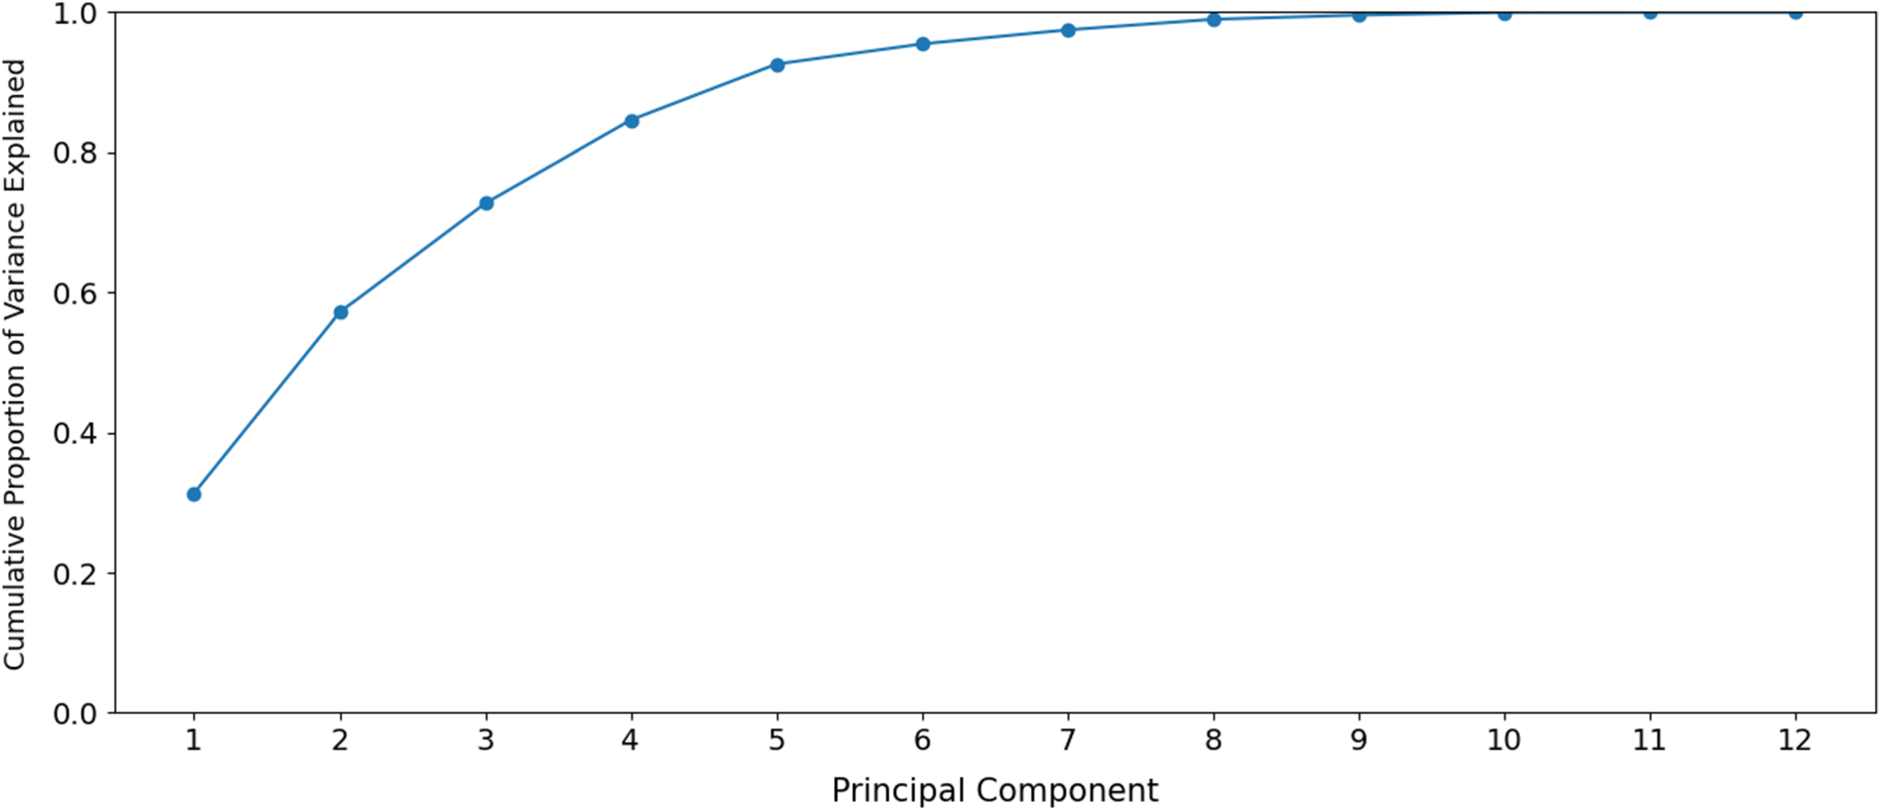
Scree plot showing the cumulative proportion of variance explained by each additional principal component when
By examining the positions of the data points associated with the sports and the directions and magnitudes of the loading vectors in each of the PCA plots in Figure 5, one can observe the relative importance of the randomness factors for each sport.
Correlation analysis
To gain insights into the relationship between underdog achievement and randomness factors, we report Figure 7, which shows a heatmap illustrating the Pearson correlation coefficient between each pair of factors, including
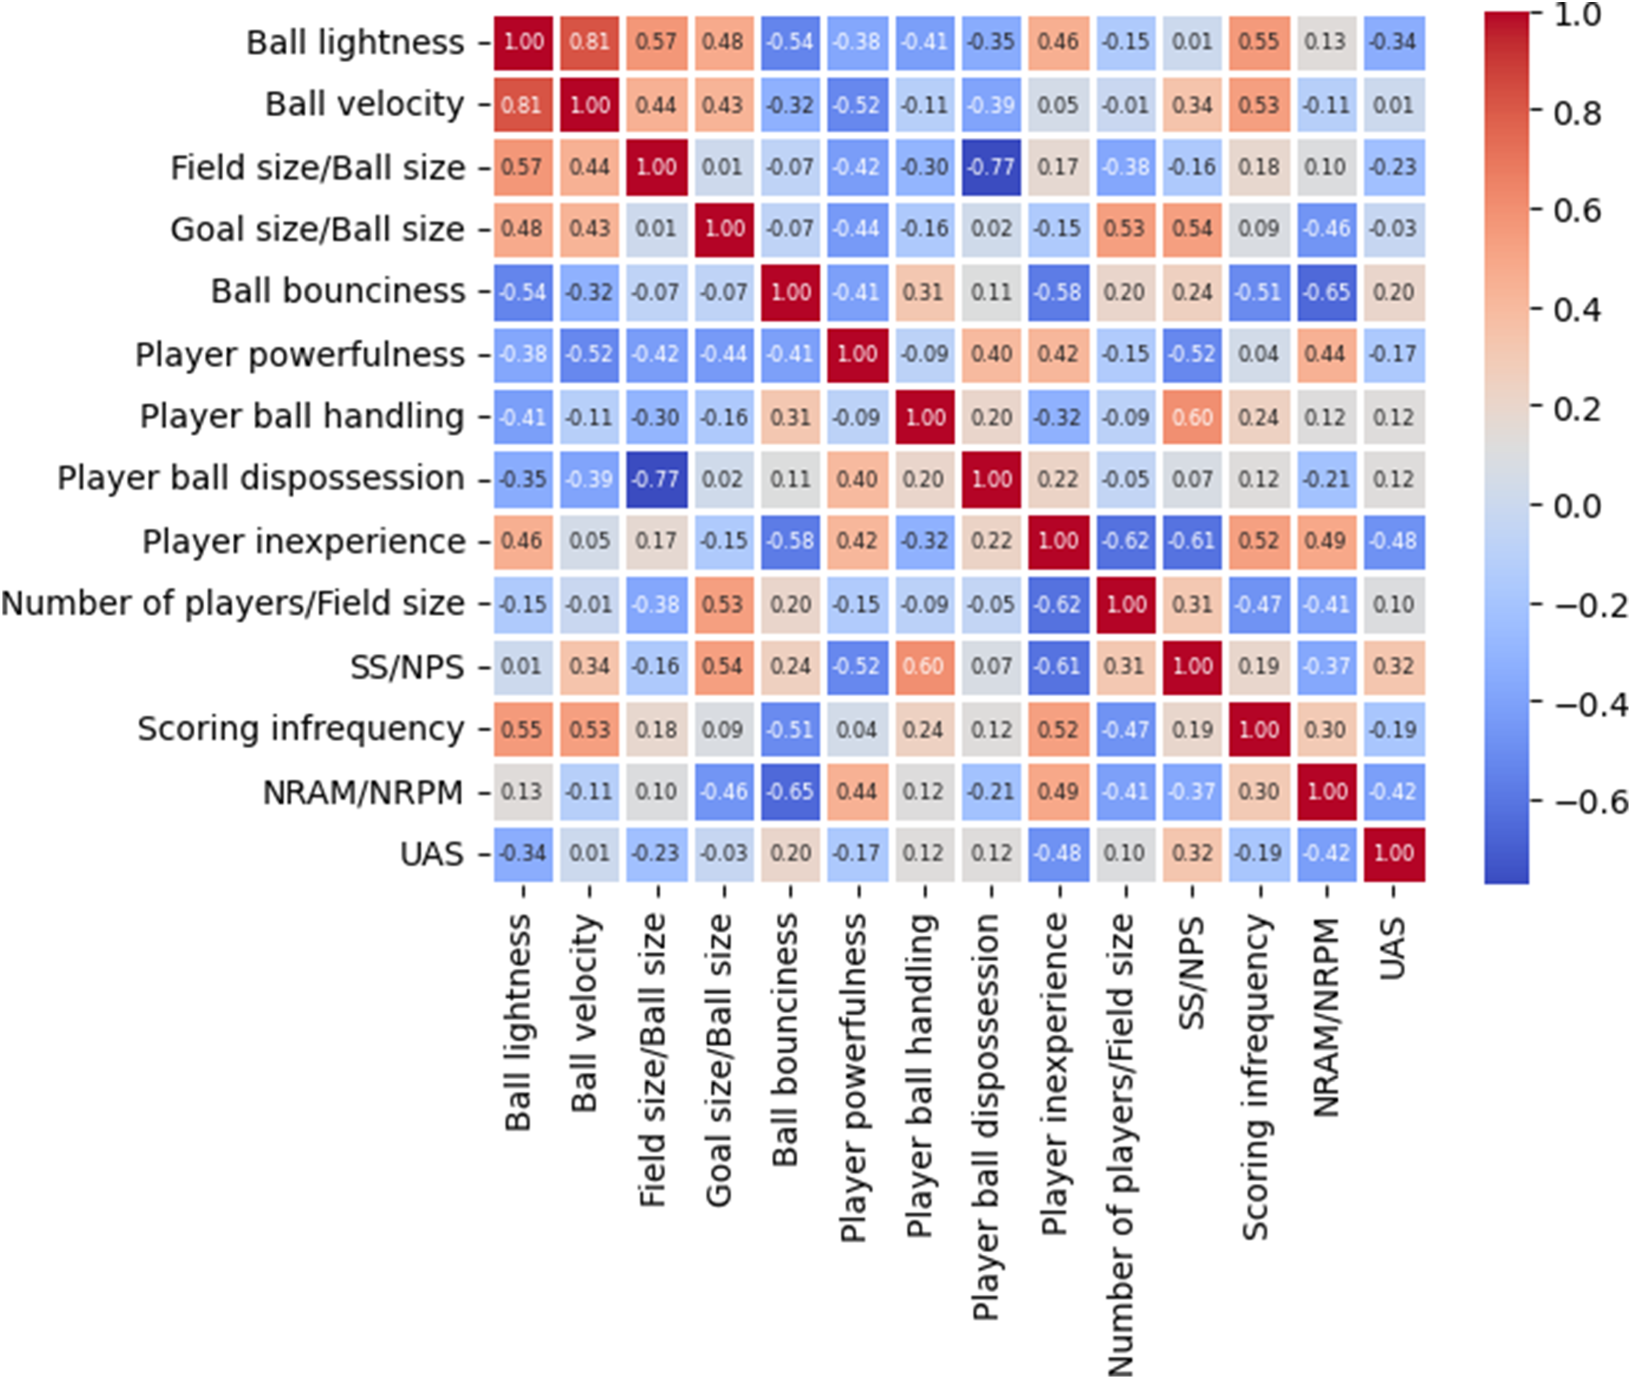
Heatmap illustrating the correlation between each pair of factors, including
Concluding remarks and future work
In this paper, we studied the relationship between underdog achievement and randomness factors that affect match outcomes in team ball sports. To achieve our goal, we collected match score data from major international competitions (World cups or Olympic games) held between 1970 and 2023, and we computed corresponding team rankings for each edition of the competitions selected for each sport. Then, we developed an underdog achievement score to determine the sports with the highest and lowest occurrences of weaker teams defeating stronger ones. Our findings indicate that water polo, soccer, field hockey, ice hockey, and basketball are among the sports with the highest underdog achievement, while lacrosse, roller hockey, and rugby are the ones with the lowest underdog achievement. Subsequently, we designed a randomness model consisting of 13 factors that contribute to unexpected match outcomes within each sport, providing quantitative values for each of the factors. Finally, we performed PCA and correlation analysis demonstrating that our randomness model can explain the underdog achievement. The randomness factors with the highest impact on underdog achievement are the ratio between the scoring target size and the number of players who can effectively defend the scoring target, the ratio between the number of players and the field size, player ball dispossession, player ball handling, and ball bounciness.
Although water polo appears to have a higher underdog achievement than soccer, our analysis confirms findings partially noted in the literature: soccer is among the sports with the highest underdog achievement, and we believe its inherent randomness is one of the reasons why soccer is universally recognised as the world’s most popular sport (Dvorak et al., 2004). Of course, other aspects contribute, such as the fact that playing soccer requires only a regular ball and no complex equipment. However, exploring such additional reasons is beyond the scope of our paper.
Our analysis has some limitations. As observed in Section Data collection: Match scores and team rankings, the match score dataset is a convenience sample, meaning it might not be fully representative of the entire population of sports matches. For futsal, roller hockey, and rugby, the data is limited either because their competitions are relatively new (futsal and rugby) or due to the unavailability of data from early editions (roller hockey). For water polo, data for some editions is missing, and for lacrosse, the early editions of the World Lacrosse Men’s World Cup had fewer than seven teams (see Alleck et al., 2024 for more details). Due to the lack of access to official team rankings across different sports, we developed a team ranking logic that applies uniformly to all sports but does not account for the importance of specific matches within a competition, which can be relevant when assessing the strength of a team (e.g., strong teams may underperform or lose in less critical matches to conserve energy for more important matches, which does not necessarily indicate weakness). Finally, although we believe that the randomness factors we have chosen provide a reasonable explanation for the observed variability in match outcomes across different sports, we acknowledge that the role of the factors in increasing or decreasing such variability reflects our own perspective.
For future research, we plan to replicate the analysis by including women’s sports competitions, competitions organised within professional sports leagues, and collegiate sports competitions. Additionally, we aim to investigate the applicability of the methodology to team non-ball sports.
Footnotes
Acknowledgements
This work is partially supported by the U.S. Air Force Office of Scientific Research (AFOSR) award FA9550-23-1-0217 and the U.S. Office of Naval Research (ONR) award N000142412656.
Funding
The authors received no financial support for the research, authorship, and/or publication of this article.
Declaration of conflicting interests
The authors declared no potential conflicts of interest with respect to the research, authorship, and publication of this article.