
Abstract
We propose a Machine Learning model to predict handball games and derive insightful information for sport coaches. Our model, augmented with statistical features, outperforms state-of-the-art models with an accuracy beyond 80%. In this work, we show how we construct the data set to train Machine Learning models on past female club matches. We compare different models, evaluate them to assess their predictive capabilities and show that our statistical variables, estimating the strengths of the teams, appear as the most important features to the selected model. Finally, explainability methods allow us to change the scope of our tool from a purely predictive solution to a highly insightful analytical tool. This can become a valuable asset for handball teams’ coaches by providing statistical and predictive insights to prepare future competitions.
Introduction
Handball is a popular sport in Europe with growing interest in Northern Africa and South America. As a fast-paced sport, it is gaining interest in the population and in the scientific literature, yet predictive models are rarely discussed Saavedra (2018). In this paper, we intend to fill this gap.
The history of handball
With its primitive form going back to the ancient Greece, modern handball was considered to be created by German sports teachers (outdoors with 11-aside players) around 1890 while Scandinavian countries (Denmark and Sweden) introduced a version with 7-aside players around the same period (Hahn et al., 2013). Its original Danish name “Haandbold” was first called in 1898 and the first official competition was organized in 1917 when the term “handball” was also officially used for the first time. It became an Olympic discipline at the 1972 Olympics in Munich for men and at the 1976 Olympics in Montreal for women (Olympics, 2023).
Literature review and related work
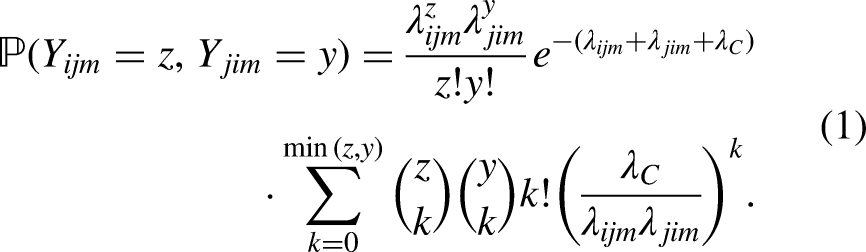
Sports predictions is an active field of research mostly focusing on sports such as football and basketball due to a larger amount of data publicly available. To predict the outcome of a match, several algorithms are considered to model sports matches (Ley and Dominicy, 2023) such as linear regressions (Miljkovic et al., 2010; Rodriguez-Ruiz et al., 2011), support vector machines (Cai et al., 2019), random forests (Groll et al., 2019), XGBoost (Lampis et al., 2023) or neural networks (McCabe and Trevathan, 2008; Huang and Chang, 2010). In the field of football predictions, Groll et al. (2019) use a so-called “Hybrid Random Forest” to predict the outcome of football matches. They augment their data set by adding a feature corresponding to the strength of a team, estimated by maximum likelihood. This value is obtained by modeling scored goals with a bivariate Poisson distribution. Denoting the random variable
Only scarce literature covers the field of handball analytics (Saavedra, 2018). Most of the existing research works are medical analyses looking at body fatigue and injury (Akyüz et al., 2019; Seil et al., 1998; Camacho-Cardenosa et al., 2018) with a particular interest on young players (Madsen et al., 2019; Grabara, 2018; Fonseca et al., 2019). Wagner et al. (2014) propose a review of performance for handball players and teams, highlighting the importance of factors such as experience level, age or playing positions. Pic (2018) showed that the impact of the home effect can play a role in critical moments of a game. In particular, when the score indicates a draw, the home team is more likely to win the game. As highlighted in Pic (2018), this advantage should be taken with care as it can either come from the effect of playing at home (with more supporters cheering) or from the fatigue of the away team from the travel. Indeed, unlike sports such as football where players are mostly travelling by plane or train, most handball clubs travel by bus which can have an important impact on the players’ fatigue during the competition. Therefore, the difference in distance traveled between both teams can explain the level of players’ freshness.
With a focus on prediction of handball outcomes, Groll et al. (2020) compared different regression approaches to model international handball games. Given the level of under-dispersion (the variance is lower than the mean), they discarded the regular Poisson distribution and opted for a Gaussian distribution with low variance. In a similar spirit, Felice (2024) proposed to model the number of goals scored by a team with a Conway-Maxwell-Poisson distribution (Sellers, 2022) and to derive a strength parameter from the parameters of the fitted distribution.
Contribution of this paper
In this paper, we will build upon the latter idea and integrate these strengths parameters into the features that we use for handball match prediction. In Section ‘Materials and methods’, we will describe the construction of our training data set based on publicly available data and define the evaluation metrics for classification and regression models. Next, we will present the results of the trained models in Section ‘Results’ and show that adding statistical features helps improve the predictive performance of the different ML models we explore. This section will also present how we can extract informative sports insights from a ML model via an explainable ML framework. Section ‘Discussion’ discusses the potential extensions of this work that can also serve as user-friendly tool to team coaches in view of preparing upcoming games and competitions. Finally, we conclude in Section ‘Conclusions’.
Materials and methods
In this section we present the data used to train our machine learning models with the associated features.
Data set
Our data set consists of two data sources that include historical games and team squads information. We extract information of past games using the SportScore API from the service RapidAPI. The extracted data include information such as game location, time, competition and score. The second source used to complete the data set contains information about teams and players. The data are extracted from the website www.handball-base.com and will help us generate team and player specific variables.
Target response
We will consider the prediction of match outcomes from two perspectives. On the one hand, as a two-target regression model, when our objective is to predict the number of goals scored by each team by the end of a match, allowing us to deduce the outcome. On the other hand, as a classification model when we aim to directly predict the outcome, namely home win, draw or away win.
Features
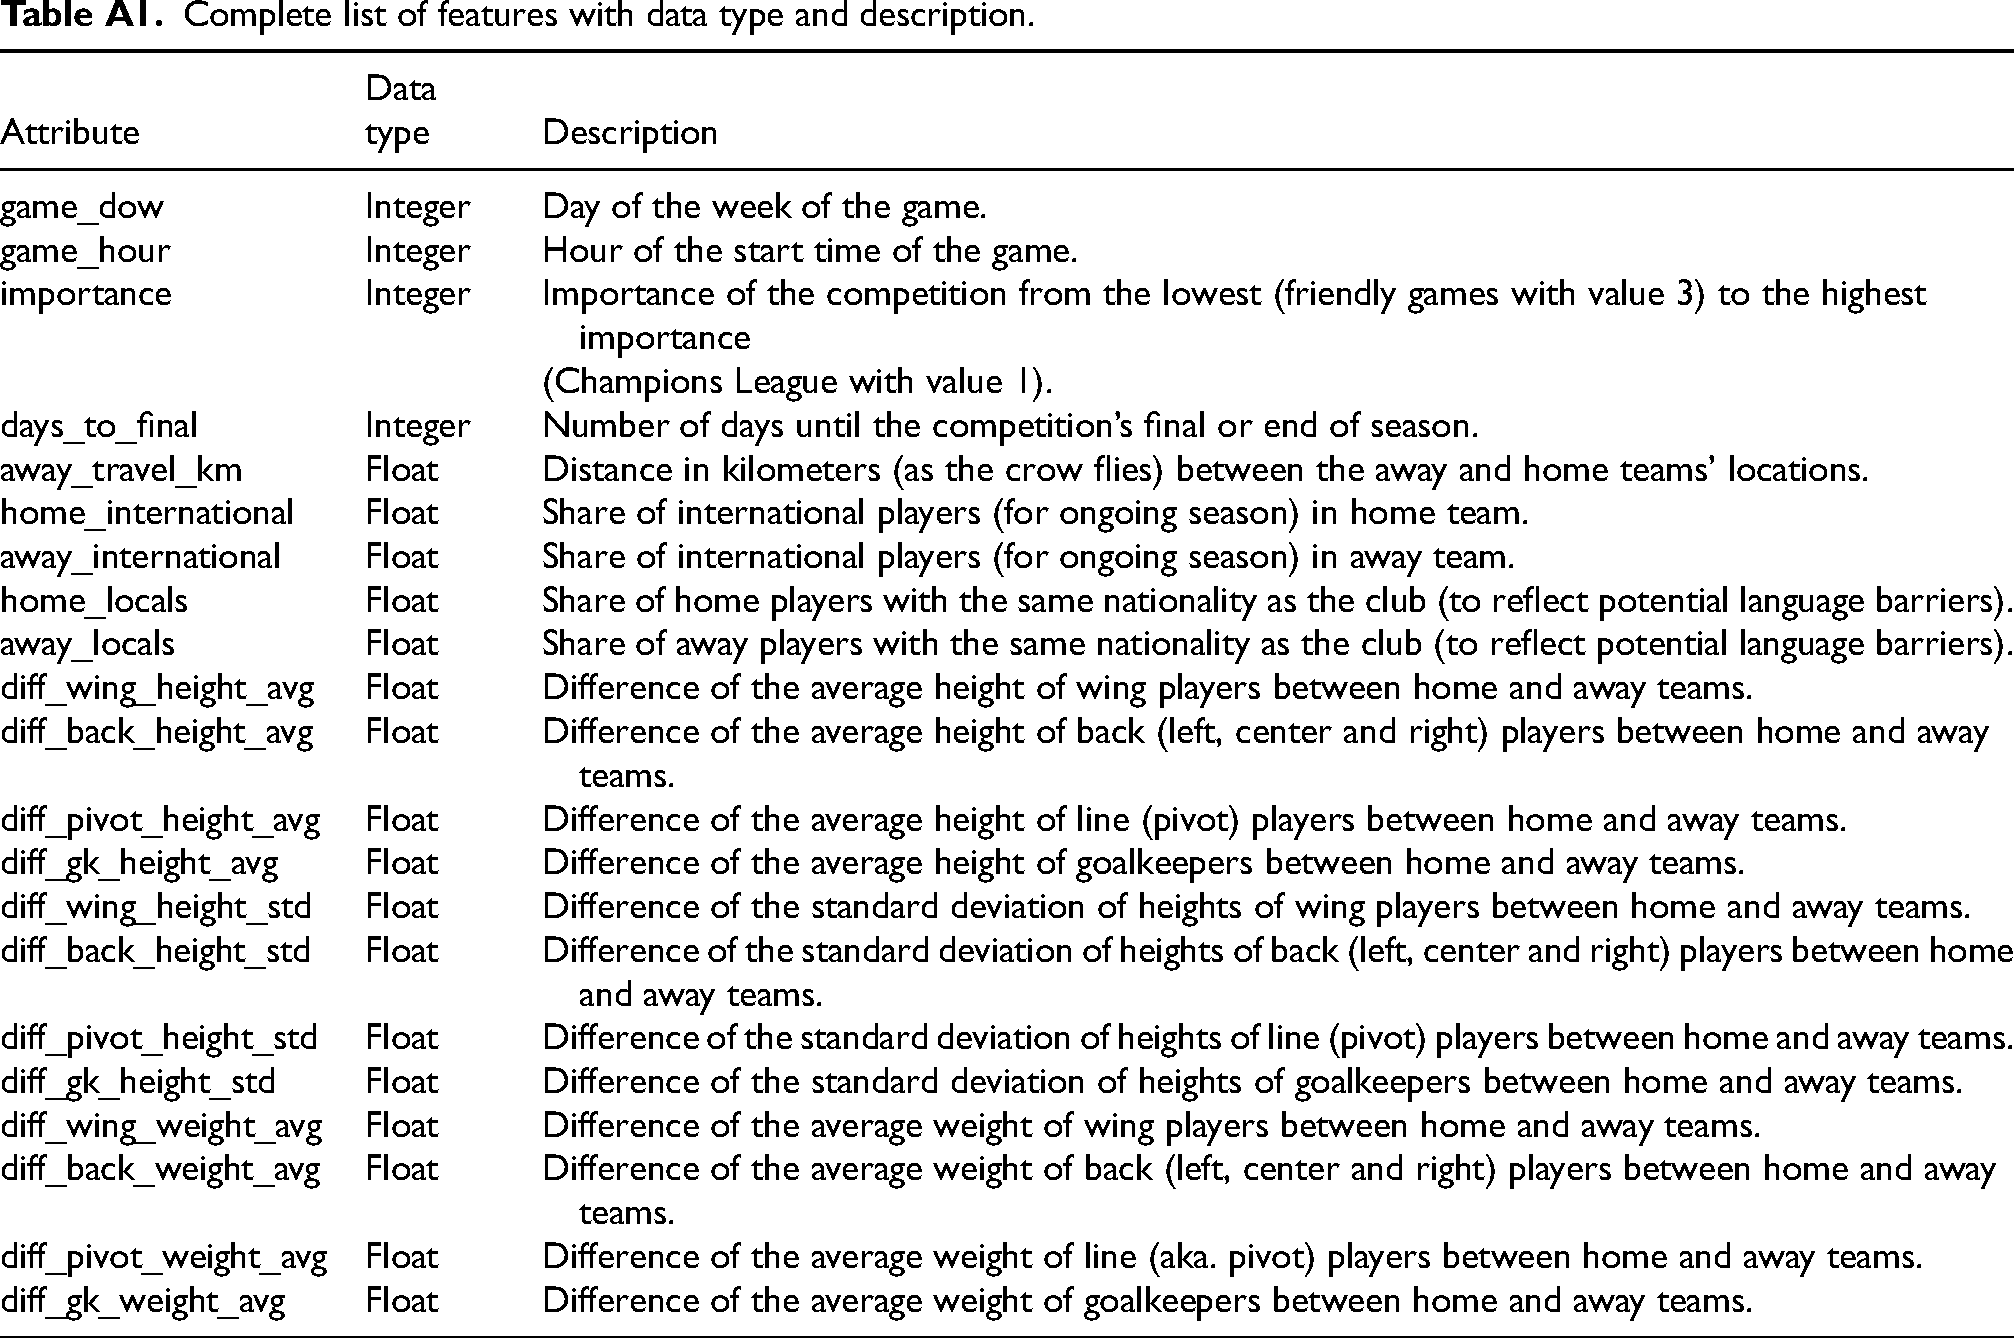
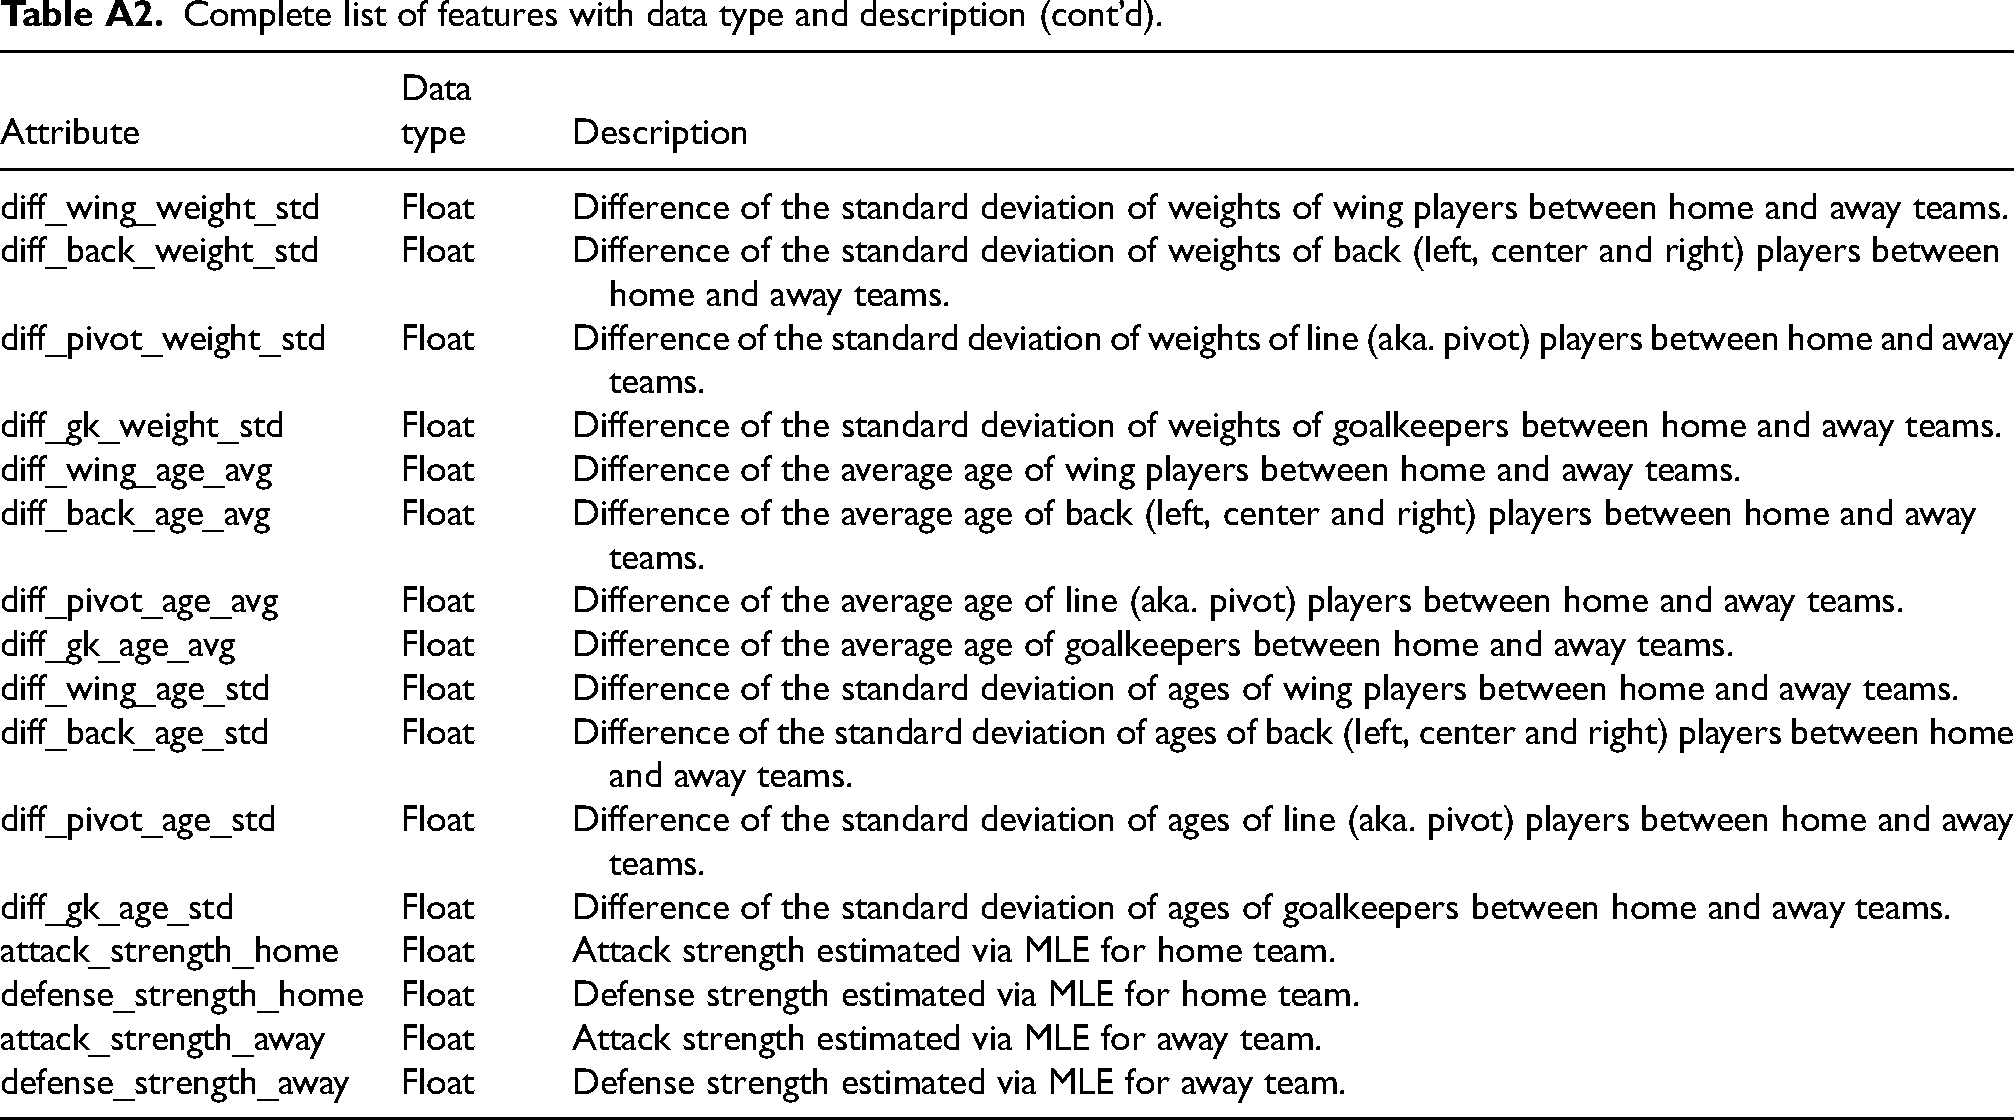
Our data set is composed of features which bring different levels of information about the two competing teams. The exhaustive list of features with abbreviations is available in Appendix A.1.
Game information
These features aim to carry information about the game and its importance. It can help encapsulate information such as potential stress for players and their state of mind (for instance, how seriously they may take a game).
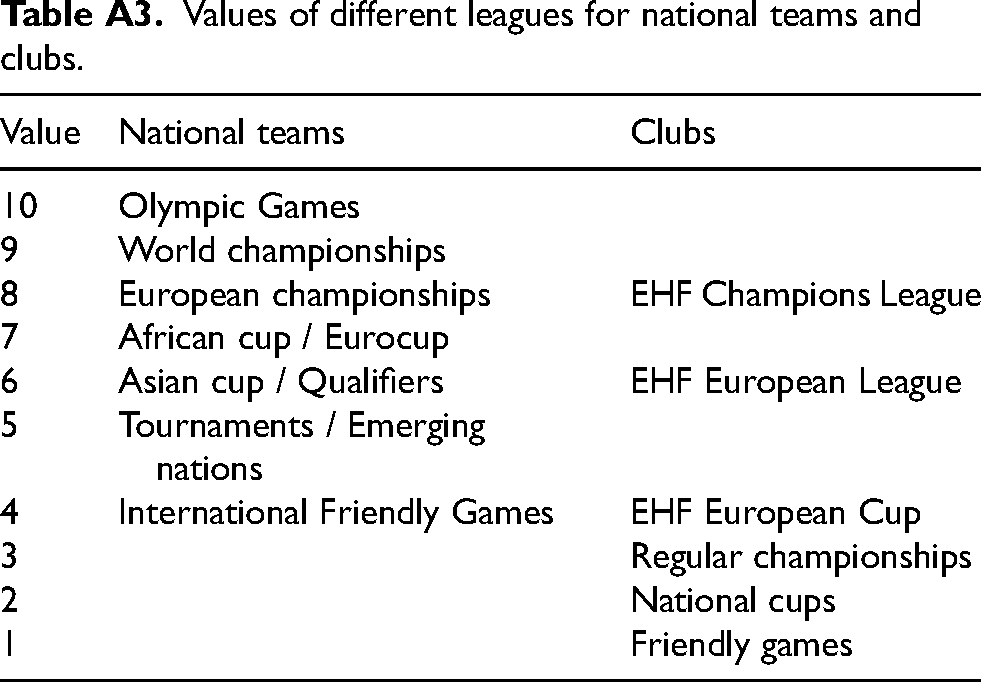
Day of week: encoded day of the week for the start time of the game. Hour: hour of the start time of the game. We can expect that games starting early in the day (e.g., morning) can be less important or players may lack time for preparation. Importance: carries the importance of the competition from the lowest (friendly games with value 3) to the highest importance (Champions League with value 1). Days until final: counts the number of days until the competition’s final or end of season. Combined with the variable Importance, this should account for the intensity of the game (last day of competition for the championship, e.g. Champions League’s final, will be more important than the first day of the competition).
Team’s structure
We also consider features allowing us to capture information from the team’s physical abilities and experience, and we incorporate them as differences between the home and away teams. There is one feature for each attribute (height, weight, age) and position on the field (wings, back players, line players/pivots and goalkeepers). They all act as proxy variables for players’ experience (age) or physical superiority (height and weight).
Height: difference of the average height of players per position between home and away teams. This aims to measure the difference in physical characteristics between players (e.g., taller back players for one team may result in an advantage both in attack and in defense). Weight: difference of the average weight of players per position between home and away teams. Similar to Height, this aims to capture the differences in physical abilities between players. Age: difference of the average age of players per position between home and away teams. This aims to capture the difference in experience/maturity between teams. Positive values will tend to indicate more experienced players in the home team who could better handle the pressure from games with high importance and have a positive impact on their team’s result.
Other features give us information about the team’s structure such as the distance to travel or the team’s composition.
Travel distance: distance in kilometers (as the crow flies) to travel for the away team between the club’s location and the address of the home team. This aims to capture the potential fatigue caused by the travelling distance. Nationalities: ratio between the total count of players’ nationalities in a team and the total amount of players. This aims to capture the affinity between players as well as potential language barriers. International: ratio of players selected in their national team.
Teams’ strengths
We finally add features that correspond to the teams’ strengths as described in more details in Section ‘Estimating team strengths’.
Attack strength: estimated strength in attack via Maximum Likelihood for home and away teams. Defense strength: estimated strength in defense via Maximum Likelihood for home and away teams.
Data preparation
To prepare the data for training our models, some preprocessing steps were required.
Pulling data from different sources
In addition to the main data extracted from the sources presented in Section ‘Data set’, we manually collected few more information. The dates of competitions that generate the feature Days until final were fetched manually from official IHF and EHF websites. The feature Importance was created manually (see Appendix A.2) using knowledge from professional handball experts.
Correction of errors
From the collected data, we performed several manual data investigations to remove errors from the data. The main sources of errors are typos coming from humans when reporting values. These were mostly on birth dates and height reported on players’ profile. We thus looked at identifying impossible values (such as players born in 2995, or players taller than 2.5 m, etc) to be removed and flagged as missing.
Filling missing data
The data to be used in the model extracted from the sources presented in Section ‘Data set’ are most often complete but may sometimes present missing values. Therefore, any missing data points (either after removing errors or missing from the source) had to be manually added. A long process of manual searches and data collection was performed to update players’ profile. This represented approximately 400 players out of a total of 12,000 available in the database.
Computing transformed variables
The last step of the data preparation is to compute the custom features from the raw information we collected and cleaned. Features such as Height, Weight and Age were computed within a SQL query to compute the difference of the average values per position between the home and away teams. Similarly, features such as Nationalities and International were also computed within the SQL query by counting the number of countries (or national players) divided by the total number of players in the team. Finally, some more advanced features are computed in Python. The variable Travel distance uses the haversine formula to compute the distance to travel for each team to the match location (home team coordinate for club matches). The feature Days until final counts the number of days between the day of the match and the final match of the tournament (or the season for clubs). The variables Attack strength and Defense strength use the methodology presented in Section ‘Estimating team strengths’.
Estimating team strengths
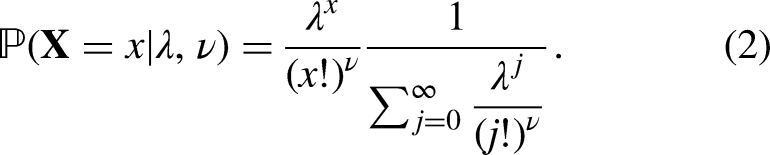
The strength of a team is an undeniably important factor of a handball match but it is not directly measurable and only remains an abstract concept. We can palliate this shortcoming by devising a statistical model that incorporates parameters which are meant to represent the attacking and defensive strengths of each team, and then estimate these parameters on the basis of preceding matches. To this end, we consider the recent history (from the past 6 months) of each team’s matches and fit the distribution of scored goals with an appropriate probability law. Felice (2024) explained that the Conway-Maxwell-Poisson distribution (Sellers, 2022) is a very good choice for this purpose as it not only satisfies the discrete nature of goal counts but also handles the problem of over- and under-dispersion one may have to deal with. Hence it is a better choice than the often used Normal (not discrete), Poisson (assumes equi-dispersion) and Negative Binomial (cannot handle under-dispersion) distributions, for instance.
The Conway-Maxwell-Poisson distribution possesses two parameters,
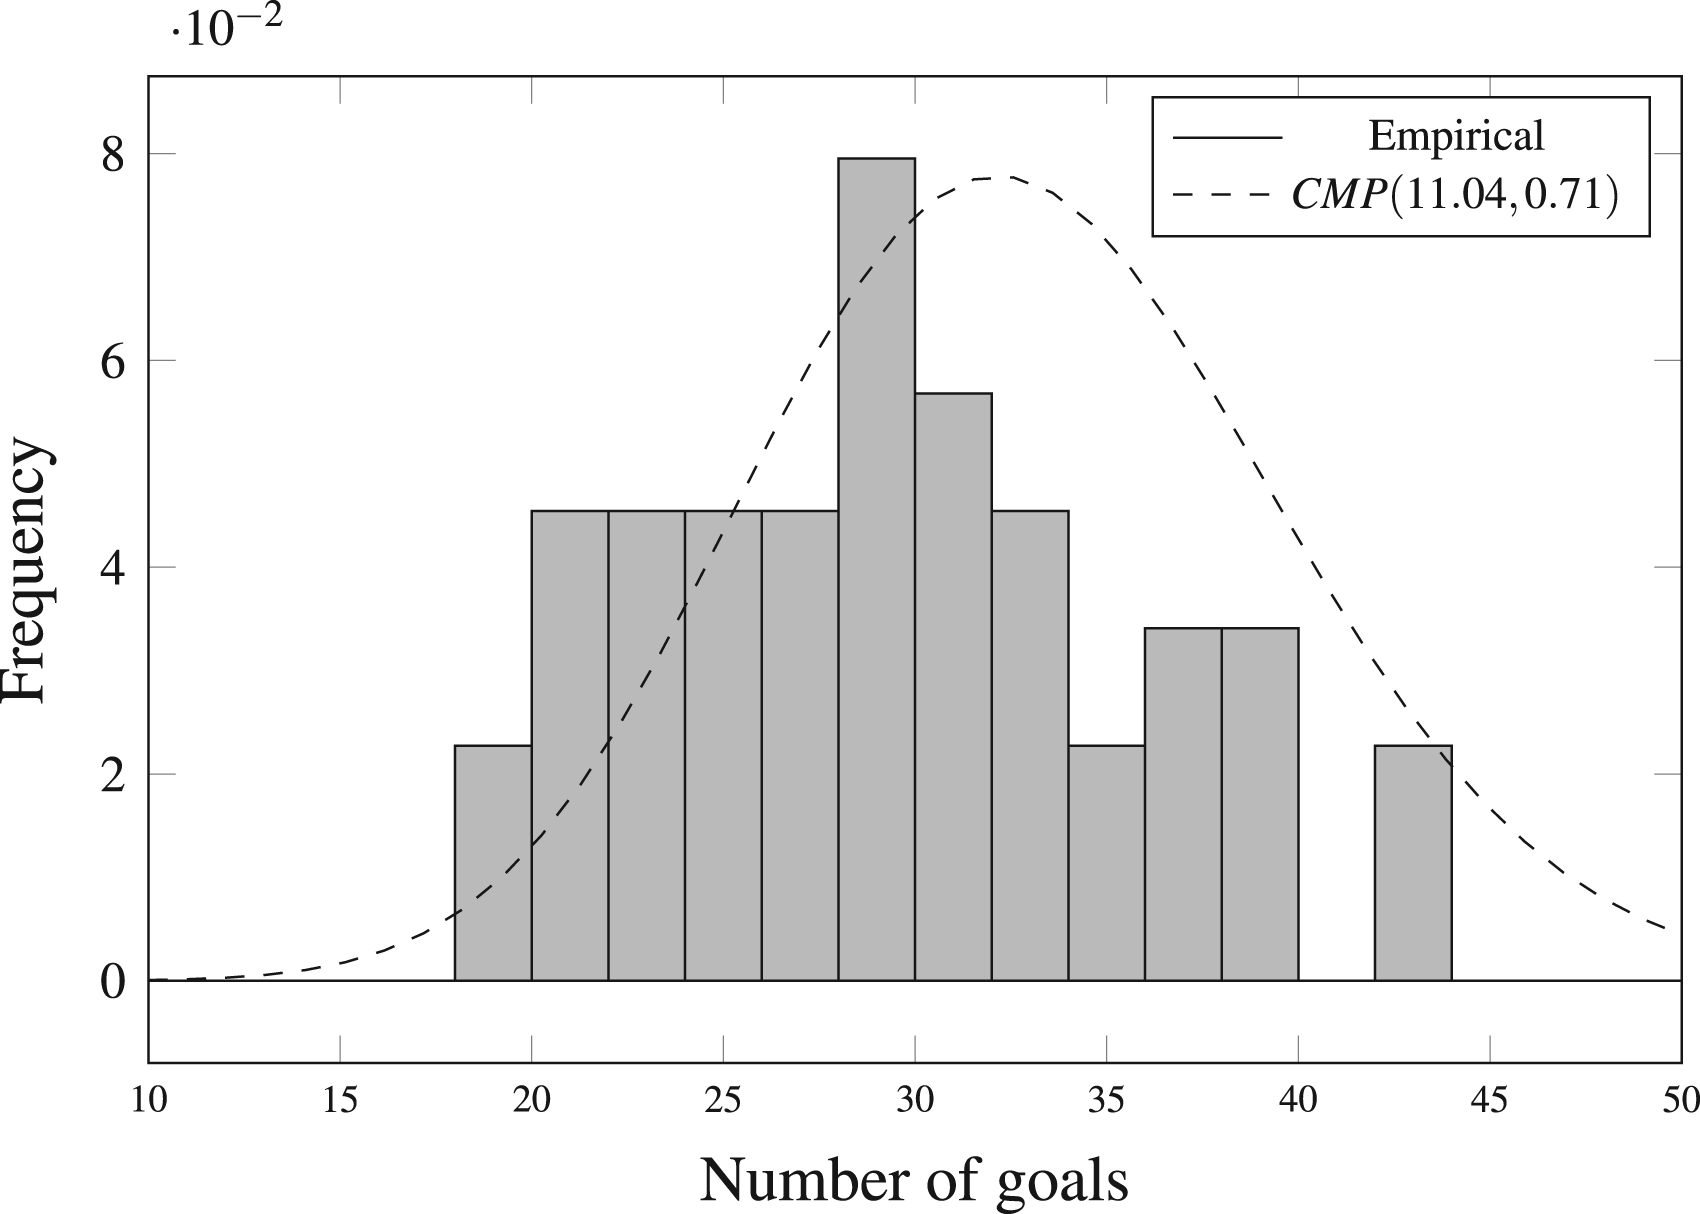
Histogram of goals scored by Metz Handball during the season 2022/2023 versus fitted Conway-Maxwell-Poisson (CMP) distribution. The value of the Akaike Information Criteria (AIC) is 258.72, which is the lowest among all tested distributions (CMP, Gaussian, Negative Binomial) as reported in Felice (2024).
Based on the nature of the two parameters, we use the work in Felice (2024) to define the strength of a team. Thus, we consider that the distribution of goals scored follows a CMP distribution with parameters
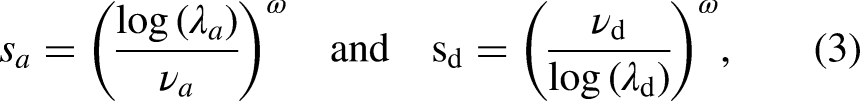
The rationale behind these choices of
We thus model historical matches with the Conway-Maxwell-Poisson distribution. We estimate, by means of maximum likelihood estimation for each team, the defense parameters (
Prediction models
To model the outcome of a handball match, we consider both classification and regression models to either predict the winner of the game or the scores of the competing teams. The results of the experimented models for classification and regression are discussed in Section ‘Results’.
Classification models
To predict the outcome of a match (as win, draw or loss), we train different ML classification algorithms. A first approach is based on Random Forests (Breiman, 2001). Another model is based on the popular XGBoost algorithm (Chen and Guestrin, 2016). We also use an improved version of the boosting model, CatBoost (Prokhorenkova et al., 2018), which is specialized in handling categorical data. Finally, we train a Multi-Layered Perceptron (Rosenblatt, 1958).
Regression models
As insightful alternative, we also consider regression models to predict the score of each team during a match, from which we can of course derive the predicted outcome. To that end, we use multi-target variants of the aforementioned models which will predict the final score of the home and away teams.
We note that, when training a Random Forest, it by default uses a univariate splitting criterion Breiman (2001). There is however no theoretical constraint to extent it to a multi-dimensional impurity in the case of multi-target regressions Alakus et al. (2023). The constraints instead come from implementations that might not be available in Python. We thus use Python’s modules to implement these models. 2 The module is a wrapper class of the model that, under the hood, simply trains two models in parallel: one for the home team and one for the away team. Similarly, Gradient Boosted models do not have any theoretical restrictions for handling scoring functions for multiple outputs Iosipoi and Vakhrushev (2024) but practical implementations may not offer such options. This is the case for the implementation of XGBoost which does not fully support multi-target settings. Therefore, we also use the same Python module as an alternative to achieve our goal. The other models, CatBoost and Multi-Layered Perceptron, can handle multiple outcome predictions by nature and have built-in implementations.
We also note that the scope of our regression problem is about predicting the score of both teams. Some work has already been done on predicting the score difference to overcome the problem of non-equidispersion Karlis et al. (2024). This approach would, in our context, lack information and only show a limited picture to sport experts. Indeed, as end users of our tool, coaches and staff members not only need to know the score difference but also the scale, in order to understand how many goals will be scored and conceded by each team.
Performance metrics
To evaluate the performance of our models, we first define the metrics we use for classification and regression models. In this section, we consider a predictive model
Metrics for classification models
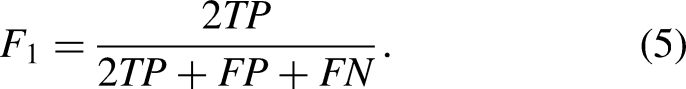
To measure the performance of our classification models, we use three common metrics in the field of sports predictions: accuracy,
The accuracy corresponds to the percentage of predicted matches
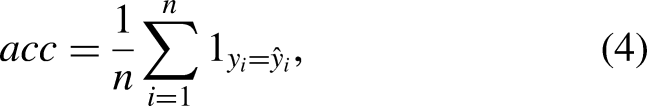
The
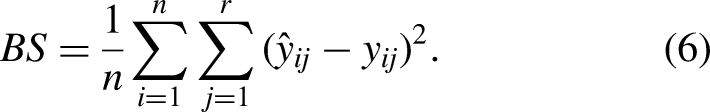
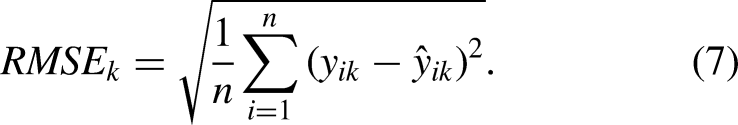
Metrics for regression models
To assess the quality of our regression models for each of the
Given the predicted score
The Mean Absolute Percentage Error for team
Results
To evaluate the performance of our distinct approaches, we train the different models on several years of female club matches. Our training set spans from September 2019 until April 2023 (representing 3,260 games) and leaves matches from April to June 2023 (250 games) as the test set.
In both the classification and regression settings, we train the four different models presented in Section ‘Prediction models’ where we compare the scenarios with and without the strengths features introduced in Section ‘Estimating team strengths’. The results are summarized in Section ‘Model performances’. After that comparison, we further investigate the best performing model with explainability frameworks for global and local explanations (Section ‘Model explainability’).
Model performances
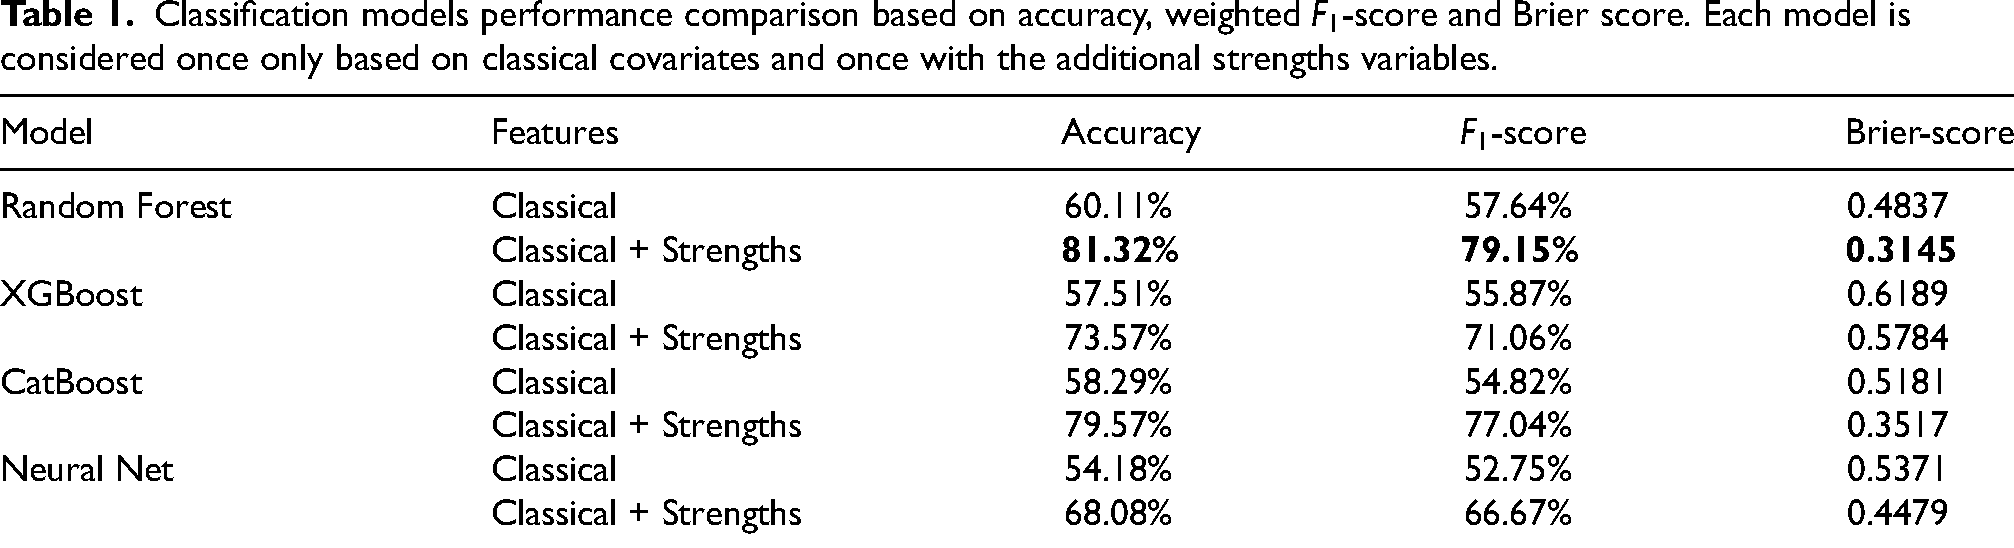
In the first case of match classification, we train our four models and report the classification metrics evaluated on the test set in Table 1. We can see from Table 1 that the Random Forest with strengths features performs the best. Furthermore, we observe that adding statistical features to our models is always beneficial and, with no exception, strongly helps improve our metrics. The performance improvement is particularly remarkable for the Random Forest model which has the highest gap between the two scenarios. Although its performance with classical covariates already achieves 60.11%, the strengths features boost the performance to reach 81.32%. As a point of comparison, Groll et al. (2020) report a minimum classification error of 23.35% with an under-dispersed Poisson regression model.
Classification models performance comparison based on accuracy, weighted
Turning our attention to regression settings, we train multi-target regression models with and without strengths features and report the resulting performance metrics in Table 2. Our metrics of interest here are the Root Mean Squared Error and Mean Absolute Percentage Error for both home and away teams.
Regression models performance comparison based on root mean squared error and mean absolute percentage error. Each model is considered once only based on classical covariates and once with the additional strengths variables. Note that we separate the predictions for home and away teams.
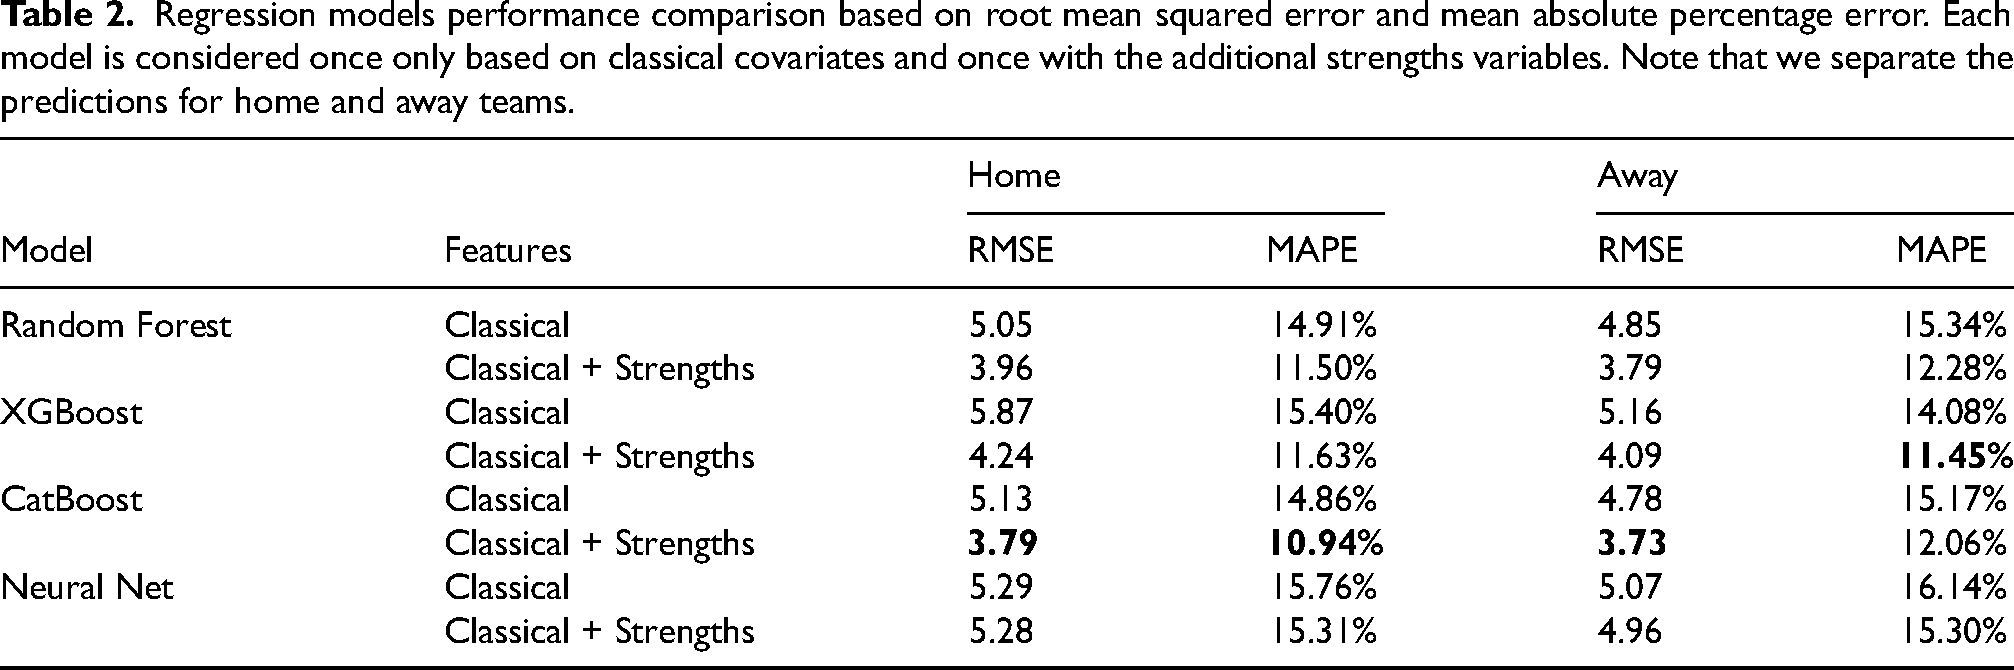
We can see from Table 2 that, although the Random Forest with strengths achieves good performance levels, the CatBoost model can predict match scores with the least error. Similar to our classification use case, adding statistical features benefits greatly to all trained models, with the exception of the Neural Net for home team. 3 This outcome suggests that our best model can accurately predict the outcome of a female handball game with an error of 3.8 goals (i.e. 11% considering 27.9 goals per match on average) for the home and away teams. As a comparison, state-of-the-art predictive models for football can achieve a prediction error of 1.194 goals (Groll et al., 2019). Considering that the average number of goals scored during a game is 1.5 (Zebari et al., 2021), this corresponds to a 80% error. This highlights the reliability of our predictive models strengthened by the supplementary information carried by the statistical covariates.
Model explainability
Many ML models such as Random Forests or Neural Networks are considered as black boxes: they are excellent in terms of prediction accuracy, but one cannot understand the factors that lead to a given prediction. Therefore, explainability (model transparency) is an important capability any ML model should have. Its importance will become even stronger with forthcoming regulations on Artificial Intelligence Hamon et al. (2020); Sovrano et al. (2022). Furthermore, explaining a model’s outcome is crucial to trust its predictions and take actions from generated explanations. In this section, we explore the most important features of the selected CatBoost model from Section ‘Model performances’ and show how the extracted strengths features are used by our model.
We distinguish between global explanations, which focus on analyzing the overall behavior of the model (importance of features), and local explanations, used to explain predictions of specific instances. Global explainability techniques include methods such as the Partial Dependence Plot (PDP) Friedman (2001) or the feature importance analysis which aim to “describe the average behavior of a machine learning model” Molnar (2020). The literature for local explainability includes a range of model agnostic solutions which spans from surrogate models such as LIME Ribeiro et al. (2016), which aim to locally approximate the black box ML model with an interpretable model and understand from the latter the generated outcome, to game theoretic based approaches based on Shapley values (Lundberg and Lee, 2017).
For our setting, we use a game-theory based approach with the SHAP framework (Lundberg and Lee, 2017) to generate explanations. In particular, given the structure of our model, we use the TreeSHAP implementation Lundberg et al. (2020) which uses the tree structure of the CatBoost model to perform more efficient and exact calculations of Shapley values. We can therefore generate global explanations from aggregated SHAP values to obtain feature importance. SHAP values for a single instance will give us a local explanation of a particular observation in our data set.
The remainder of this section focuses on the explainability of the regression models, aligning with the paper’s main scope. However, the implementations and conclusions are exactly the same for the classification models.
Feature importance from global explanation
Figure 2 highlights the features in our test set which contribute the most to the predicted outcome. We can observe that the strengths features are considered as very important for the model. We notice that the attack strength of the home team is the most important to predict home goals, followed by the defense strength from the away team. This is perfectly logical, and again underlines the impact of our statistical features. To predict the score of the away team, we observe from our experiments that the most important feature is the attack strength of the away team, followed by the defense strength of the home team. This is in line with conclusions from Section ‘Model performances’, namely that, by adding these features to our model, the performance considerably improves.
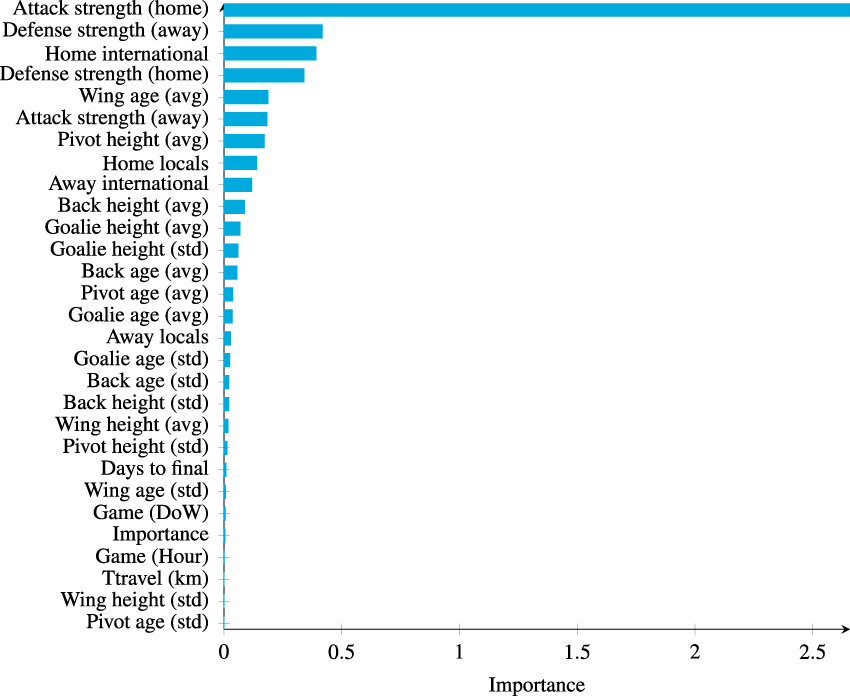
Feature importance plot using TreeSHAP for predicting home team’s goals.
Understand match predictions from local explanations
Analyzing predictions by means of local explainability frameworks can help anticipate events during an upcoming match. To that end, we analyze the last game of the season 2022/2023 played at home for Metz Handball. This game was played on May 17
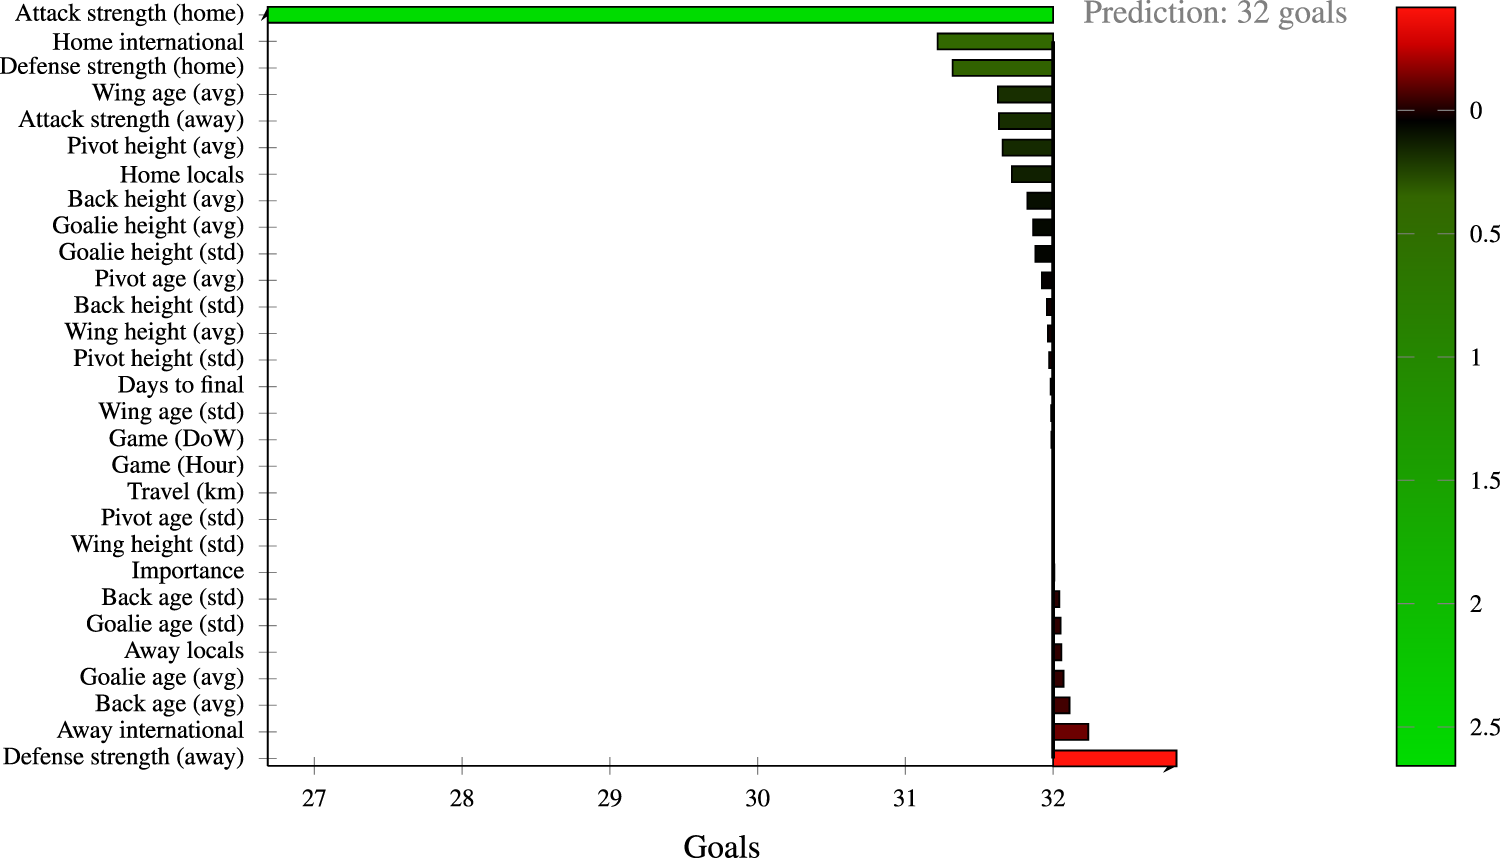
Force plot of predicted goals (from CatBoost with strengths) for Metz Handball for the game played on May 17
We can read Figure 3 as follows. Features close to the top of the plot contribute positively to increasing the number of goals Metz could score during the game. On the other hand, features at the bottom of the plot contribute negatively to goals scored by Metz, i.e. stand for the defense of Chambray. Therefore, in line with our conclusions from the feature importance plot from Figure 2, the attack strength for the home team (Metz) is the main contributor for the final score. The defense from Chambray, however, contributes to lower the total score, without which the outcome would be much worse for that team. Other features such as the experience from international or wing players positively contributed to the victory of Metz. An additional factor is the number of days until the final (end of season). Although the model could not be aware that Metz, playing their last game of the season at home, was about to receive the trophy and celebrate the title of champion, the few days left until the end of the season contributed to the motivation of players.
Discussion
We showed that the proposed ML solution achieves a high predictive performance and explanations generated with relevant explainability frameworks allow a translation of our analytical findings into concrete sports events. In this section, we argue that this tool can be used by sports professionals such as team coaches to prepare for upcoming games. We also open the discussion for future work on extending team strengths to player abilities as additional statistical covariates.
An analytical tool for coaches
While state-of-the-art Machine Learning models for sports predictions (e.g. football, basketball) usually plateau around 75% accuracy to predict the outcome of a match (Huang and Chang, 2010; Lampis et al., 2023), our proposed solution for handball matches achieves above 80% accuracy. Coupled with explainability capabilities, our approach can translate statistical predictions into real facts happening during a given match. Although no model can guarantee that the result of a game will be as predicted, the model can identify statistical facts that can explain parts of the outcome. Such patterns can therefore be used by team coaches in view of a competition.
Indeed, knowing the prediction of a game together with the potential main contributors to this outcome can help prepare a game and improve the team’s strategy. As we illustrated in Section ‘Understand match predictions from local explanations’, local explainability can reveal where a team is expected to excel or struggle during the match. We observed in Appendix Tables A1 to A3 that a team can have an advantage with the experience of their wing players or goalkeepers and struggle due to the defense strength of the opposing team. Therefore, a coach can use these pieces of information to ensure the team can accentuate on predicted strengths and work on removing their weak points, and adapt their strategy accordingly.
Complete list of features with data type and description.
Complete list of features with data type and description (cont’d).
Values of different leagues for national teams and clubs.
From team strengths estimation to player abilities
As presented in Section ‘Estimating team strengths’, the structure of handball games suggests the use of the Conway-Maxwell-Poisson distribution from which we can derive a formula to estimate the attack and defense strengths of a team. We showed the importance of these features to the predictive performance of a model, and Felice (2024) illustrated the relevance of such metrics to derive the ranking of clubs. This methodology can be adapted to other settings such as the estimation of individual player abilities. Although the publicly available data does not allow extracting a long history of player statistics over multiple seasons, having access to such data could lead to similar research. Indeed, following the methodology from Felice (2024) of determining the most appropriate distribution to fit relevant available data, one can also derive a formula to estimate the attack and defense ability of each player. The estimated strength can not only help derive another ranking for players but can also give valuable insights on player abilities and lead to novel analytical tools for managers when recruiting new players.
Conclusions
In this paper, we showed how we can construct a highly accurate predictive model for handball games. While data preparation and feature engineering are often under-explored in the literature Zheng and Casari (2018), our results highlight their importance on the model’s performance. This encourages us to focus, in future works, on the preparation of even more meaningful features to capture more signals and further improve the model’s performance. The models presented in this paper are trained and evaluated on female championships but this work can easily be extended to male championships as well as international competitions. In view of the upcoming Olympic Games in Paris in 2024, the presented solutions can also target national teams’ coaches to prepare for this worldwide event by means of analytical tools powered by accurate Machine Learning models.
Supplemental Material
sj-csv-1-san-10.1177_22150218251313937 - Supplemental material for Predicting handball matches with machine learning and statistically estimated team strengths
Supplemental material, sj-csv-1-san-10.1177_22150218251313937 for Predicting handball matches with machine learning and statistically estimated team strengths by Florian Felice and Christophe Ley in Journal of Sports Analytics
Supplemental Material
sj-csv-2-san-10.1177_22150218251313937 - Supplemental material for Predicting handball matches with machine learning and statistically estimated team strengths
Supplemental material, sj-csv-2-san-10.1177_22150218251313937 for Predicting handball matches with machine learning and statistically estimated team strengths by Florian Felice and Christophe Ley in Journal of Sports Analytics
Supplemental Material
sj-csv-3-san-10.1177_22150218251313937 - Supplemental material for Predicting handball matches with machine learning and statistically estimated team strengths
Supplemental material, sj-csv-3-san-10.1177_22150218251313937 for Predicting handball matches with machine learning and statistically estimated team strengths by Florian Felice and Christophe Ley in Journal of Sports Analytics
Footnotes
Funding
The author(s) received no financial support for the research, authorship, and/or publication of this article.
Declaration of conflicting interests
The authors declared no potential conflicts of interest with respect to the research, authorship, and publication of this article.
Code availability
Notes
A. Appendix
References
Supplementary Material
Please find the following supplemental material available below.
For Open Access articles published under a Creative Commons License, all supplemental material carries the same license as the article it is associated with.
For non-Open Access articles published, all supplemental material carries a non-exclusive license, and permission requests for re-use of supplemental material or any part of supplemental material shall be sent directly to the copyright owner as specified in the copyright notice associated with the article.