
Abstract
Background
Abnormal white blood cell count after kidney transplantation is an important adverse clinical outcome. The abnormal white blood cell count in patients after surgery may be caused by the use of immunosuppressive agents and other factors. A lower white blood cell count than normal will greatly increase the probability of adverse outcomes such as infection and reduce the success rate of surgery.
Objective
To establish a machine learning prediction model of leukocyte drop to abnormal level after kidney transplantation, and provide reference for clinical treatment.
Methods
A total of 546 kidney transplant patients were selected as the study subjects. The time correlation feature of the ratio of the duration time of each variable to the total time in different intervals was innovatively introduced. Least absolute shrinkage and selection operator algorithm was used for correlation analysis of 85 candidate variables, and the top 20 variables were retained in the end. Eight machine learning algorithms, including Logistic-L1, Logistic-L2, support vector machine, decision tree, random forest, multilayer perceptron, extreme gradient boosting and light gradient boosting machine, were used for the five-fold cross-validation on all data sets, and the algorithm with the best performance was selected as the final prediction algorithm based on the average area under the curve.
Results
As the final prediction model, the accuracy, sensitivity, specificity and area under the curve values of the multilayer perceptron model in test set were 71.34%, 61.18%, 82.28% and 77.30%, respectively. The most important factors affecting leukopenia after surgery were the proportion of time of lymphocyte less than normal, blood group AB, gender, and platelet CV.
Conclusions
The multilayer perceptron model explored in this study shows significant potential in predicting abnormal white blood cell counts after kidney transplantation. This model can help stratify risk following transplantation, subject to external and/or prospective validation.
Introduction
Kidney transplant surgery is the most effective treatment for end-stage renal disease today 1 with the continuous progress of modern medical technology. The success rate of kidney transplantation is also increasing, and the quality of life of patients with end-stage renal disease has been greatly improved. 2 A more common problem in the field of kidney transplantation today is that postoperative infection of kidney transplant recipients has become the main cause of eventual death of patients due to the use of various immunosuppressive drugs. 3 Lung infection is one of the main types of infection after kidney transplantation. 4 White blood cell level is an important laboratory standard to determine bacterial or viral infection. The normal range of white blood cell count in the human body should be between 4.0 and 10.0*109/L. Bacterial or viral infection is likely to occur in the human body beyond this range. This indicator also needs to be given attention in clinical practice. The occurrence of infection is highly correlated with abnormal count of white blood cells. 5
With the development of artificial intelligence, common machine learning models have been developed and applied in healthcare. 6 Some scholars have compared the prediction performance of machine learning models and traditional regression methods, and found that the prediction performance of machine learning methods is better than that of traditional regression methods. 7 At present, in the field of kidney transplantation, some prediction models based on artificial intelligence algorithm based on machine learning are available to predict and diagnose the occurrence of risk outcomes after kidney transplantation; however, they mainly focus on the occurrence of serious outcomes such as acute rejection (AR), delayed graft function (DGF), and death.8–14 Studies on the decrease in white blood cells below the normal level in patients after kidney transplantation are few. In addition, most of the feature indicators included in the existing studies are category-type features that can be directly extracted from the real-world data. For clinical variables monitored for a long time, statistics such as mean and variance are usually extracted directly; a more comprehensive and reasonable feature extraction method is lacking.15,16
Therefore, the short-term clinical characteristics after surgery need to be fully explored to determine the postoperative leukocyte level of kidney transplant patients. Moreover, a machine learning model should be established to predict whether the adverse outcome of leukocyte number will fall below the normal level in the long term after surgery. The other important tasks are to assist doctors in conducting fast identification and improve the prognostic effect of kidney transplant surgery.
In order to meet the above needs, this study proposed a time-dependent feature extraction method for some features repeatedly detected in a period of time, focusing on the proportion of the duration of each feature in different value ranges to the total time, and incorporated the longitudinal temporal features into the prediction algorithm modeling in this way. Aiming at the goal of abnormal white blood cell count in patients after kidney transplantation, least absolute shrinkage and selection operator (LASSO) algorithm was used to get 20 features that had the greatest impact on the target from 85 candidate features into the modeling. Finally, from Logistic L1 (Logic-L1), Logistic L2 (Logic-L2), support vector machine (SVM), decision tree (DT), random forest (RF), multilayer perceptron (MLP), extreme gradient boosting (XGBoost) and light gradient boosting machine (LightGBM). Among the eight machine learning models, the MLP model with the best prediction effect was selected as the final model. The area under the curve (AUC) on the test set reached 77.30%.
Methods
Sample establishment
This study was conducted in a real-world data set. 17 In this retrospective study, all kidney transplantation operations were performed in a third-class A hospital in Wuhan. The Organ Transplantation Institute of this hospital is the largest comprehensive medical service and research institution that specializes in the clinical research of organ transplantation in China. To date, more than 6000 cases of kidney transplantation have been conducted, which ranked first in China. This study initially planned to include the electronic medical record data of a total of 958 kidney transplant patients in this hospital from January 1, 2017 to June 31, 2019. Only the previous clinical data were used, and the identification number and other information were desensitized. Thus, the privacy of patients could be fully protected. Accordingly, the requirement of patients’ informed consent was exempted. Each patient included in the study was also given a unique identification number to ensure anonymity and accuracy.
Due to the great differences between relative kidney transplantation and donation of cardiac death (DCD) kidney transplantation, child kidney transplantation and adult kidney transplantation, single kidney transplantation and multiple kidney transplantation, it is necessary to ensure the unity of research objects. In addition, because what this paper needs to predict is the level of white blood cell count within one year after surgery, the follow-up period of blood routine must be more than one year in order to meet our observation time requirements. Finally, considering the integrity of the data, the patient data with missing values in the candidate features were deleted to avoid the impact of missing values on the prediction results and improve the prediction effect of the model. To sum up, we determined five inclusion criteria for the study samples in this paper, as shown in Figure 1. Real-world data of a total of 546 patients were finally included in this study.

Sample establishment flowchart.
Included variables
The patient data in this study were all real-world data, which were exported and extracted from the hospital's information system. The prospective collection method was adopted. The included characteristic variables are shown in Table 1.
List of candidate characteristic variables.
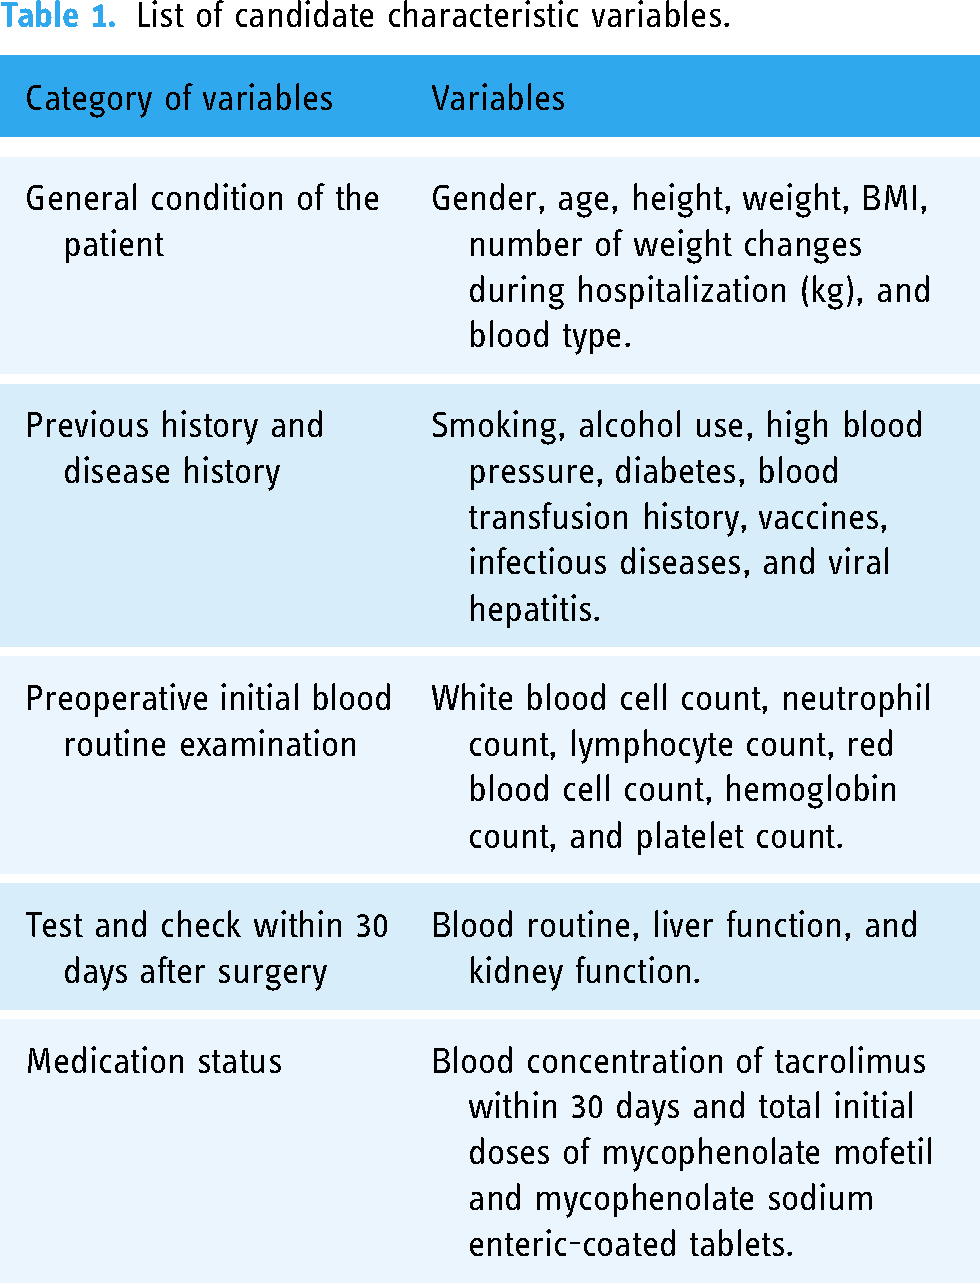
The abovementioned variables are all clinical data of recipients. The electronic information level of kidney donor and donor data in domestic hospitals is imperfect. Thus, this project included clinical variables of recipients except donor blood type, which is more in line with our clinical application scenario.
Feature extraction
Among all the variables included, some variables were repeatedly detected and had long observation period, low recording frequency, and unfixed characteristics, such as blood routine, liver function, kidney function, and tacrolimus blood concentration, of the test data within 30 days after surgery. In the existing studies, only the occurrence times of extreme, mean, or outlier value in a period of research time are usually extracted as the characteristic variable to be included at last, which is obviously incomprehensive and lacks the characteristics reflecting the changes in the variable in this period.
For this type of variable, this study focuses on the proportion of the duration of each feature in different value ranges in the total time. In this way, the longitudinal temporal features are incorporated into the modeling of the prediction algorithm. For the routine white blood cell count, the normal range as mentioned above is between 4.0 and 10.0*109/L, and the original record of the white blood cell count of a patient numbered 2017350 within 30 days after surgery is shown in Figure 2a. Through interpolation, smooth curves were used to plot the general trend of changes. We used a step-shaped curve to replace the original curve for obtaining the percentage of different durations of white blood cell count in the total time of the patient. Accordingly, the proportion of the sum of each duration of white blood cell count in different ranges in the total time can be calculated, as shown in Figure 2b.

Schematic of extraction of duration proportion of each count of leukocyte.
The specific calculation process is as follows.
The duration of each white blood cell count 


The features in the abovementioned table are taken as the timing features of the white blood cell count, and they are included in the next study together with the mean value of the white blood cell count, the coefficient of variation CV, and the maximum value. Other variables for feature extraction using the same method include neutrophil count, lymphocyte count, blood glucose value, uric acid value, and tacrolimus concentration, which will be mentioned later.
Extracted time proportion characteristics of different intervals.

Statistical analysis of normal and abnormal groups
This study focused on the white blood cell levels of all patients from 30 days to 365 days after surgery. With 4000/mm3 as the dividing line, all samples were divided into two groups: the abnormal group with white blood cell count that dropped below 4000/mm3, and the normal group with white blood cell count that remained above 4000/mm3. SPSS 26.0 software was used for statistical analysis of the two groups of data. Table 3 shows the results of statistical comparison between the two groups of patients.
Statistical analysis and comparison of all candidate variables in the normal and abnormal groups.

In Table 3, the weight change is the patient's discharge weight minus admission weight. WBC, NEU, LYM, RBC, HGB, and PLT respectively, represent the white blood cell count, neutrophil count, lymphocyte count, red blood cell count, hemoglobin, and platelet count in blood routine. Pre represents preoperative. The most recent test results before the time point of operation were taken. Max, Min, Mean, and CV represent the maximum value, minimum value, average value, and coefficient of variation of each variable within 30 days after surgery. Inc represents the difference between the maximum value after surgery and the preoperative value. Rdc represents the difference between the minimum value after surgery and the preoperative value. The values with the mathematical comparison symbol “<” and “>” are the proportion of the duration of different value ranges of this variable in the total time within 30 days. CR, eGFR, UREA, UA, AST, and ALT, respectively, represent creatinine, glomerular filtration rate, urea, uric acid, glutamic-oxalacetic transaminase, and alanine transaminase. After the operation of these variables will have a large fluctuation, the closest to the postoperative 30 days of the test results was taken due to the short time. TAC represents the concentration of tacrolimus. TDS represents the sum of the initial dose of mycophenolate mofetil and mycophenolate sodium enteric-coated tablets.
In Table 3, the data for numerical variables are expressed as mean (standard deviation), and the data for categorical variables are expressed as counts in each group (percentage of the group). For numerical variables, Shapiro–Wilk test was first used for normality test. If P value < .05, then the variable did not obey normal distribution. In this study, except for preoperative red blood cells and preoperative platelets, all other numerical variables did not obey normal distribution. For continuous variables with non-normal distribution, Mann–Whitney rank sum test was used, and P < .001 indicated significant difference. For comparison of continuous variables with normal distribution, T test was used, and P < .05 indicated significant difference. For class variables, Chi-squared test was used, and P < .05 indicated significant difference.
As shown in Table 3, significant differences are observed between the normal and abnormal groups in gender, height, maximum value of blood routine, average value, and proportion of each time.
Feature transformation
For numerical data, standard deviation standardization is adopted for preprocessing. After processing by this method, the values of different variables are processed into the form of mean value 0 and standard deviation 1. For categorical data, a categorical variable with m possible values can be converted into m binary features, and these features are mutually exclusive.
The abovementioned characteristic changes will result in more reasonable distance calculation between different types of variables.
Feature screening
With the aforementioned treatment, the initial number of variables included in this study was 85. Necessary feature screening was required to determine the risk variables most associated with the reduction in white blood cells to below normal levels after kidney transplantation. The minimum absolute contraction and selection (LASSO) algorithm commonly used in feature selection algorithms was used in this study,18,19 “lambda.min” variable was used as the final λ value. LASSO regression algorithm forces the coefficient of non-significant variables to shrink to 0 through L1 regularization. In this process, potential confounding variables are excluded, and only the part of variables with the greatest effect on the outcome are reserved for its prediction.
A total of 85 candidate variables were screened using R version 3.6.2. Figure 3 shows the coefficient variation curve of each candidate variable with the value of λ. The x axis represents the value of log(λ), and the y axis represents the coefficient of each variable in LASSO regression.
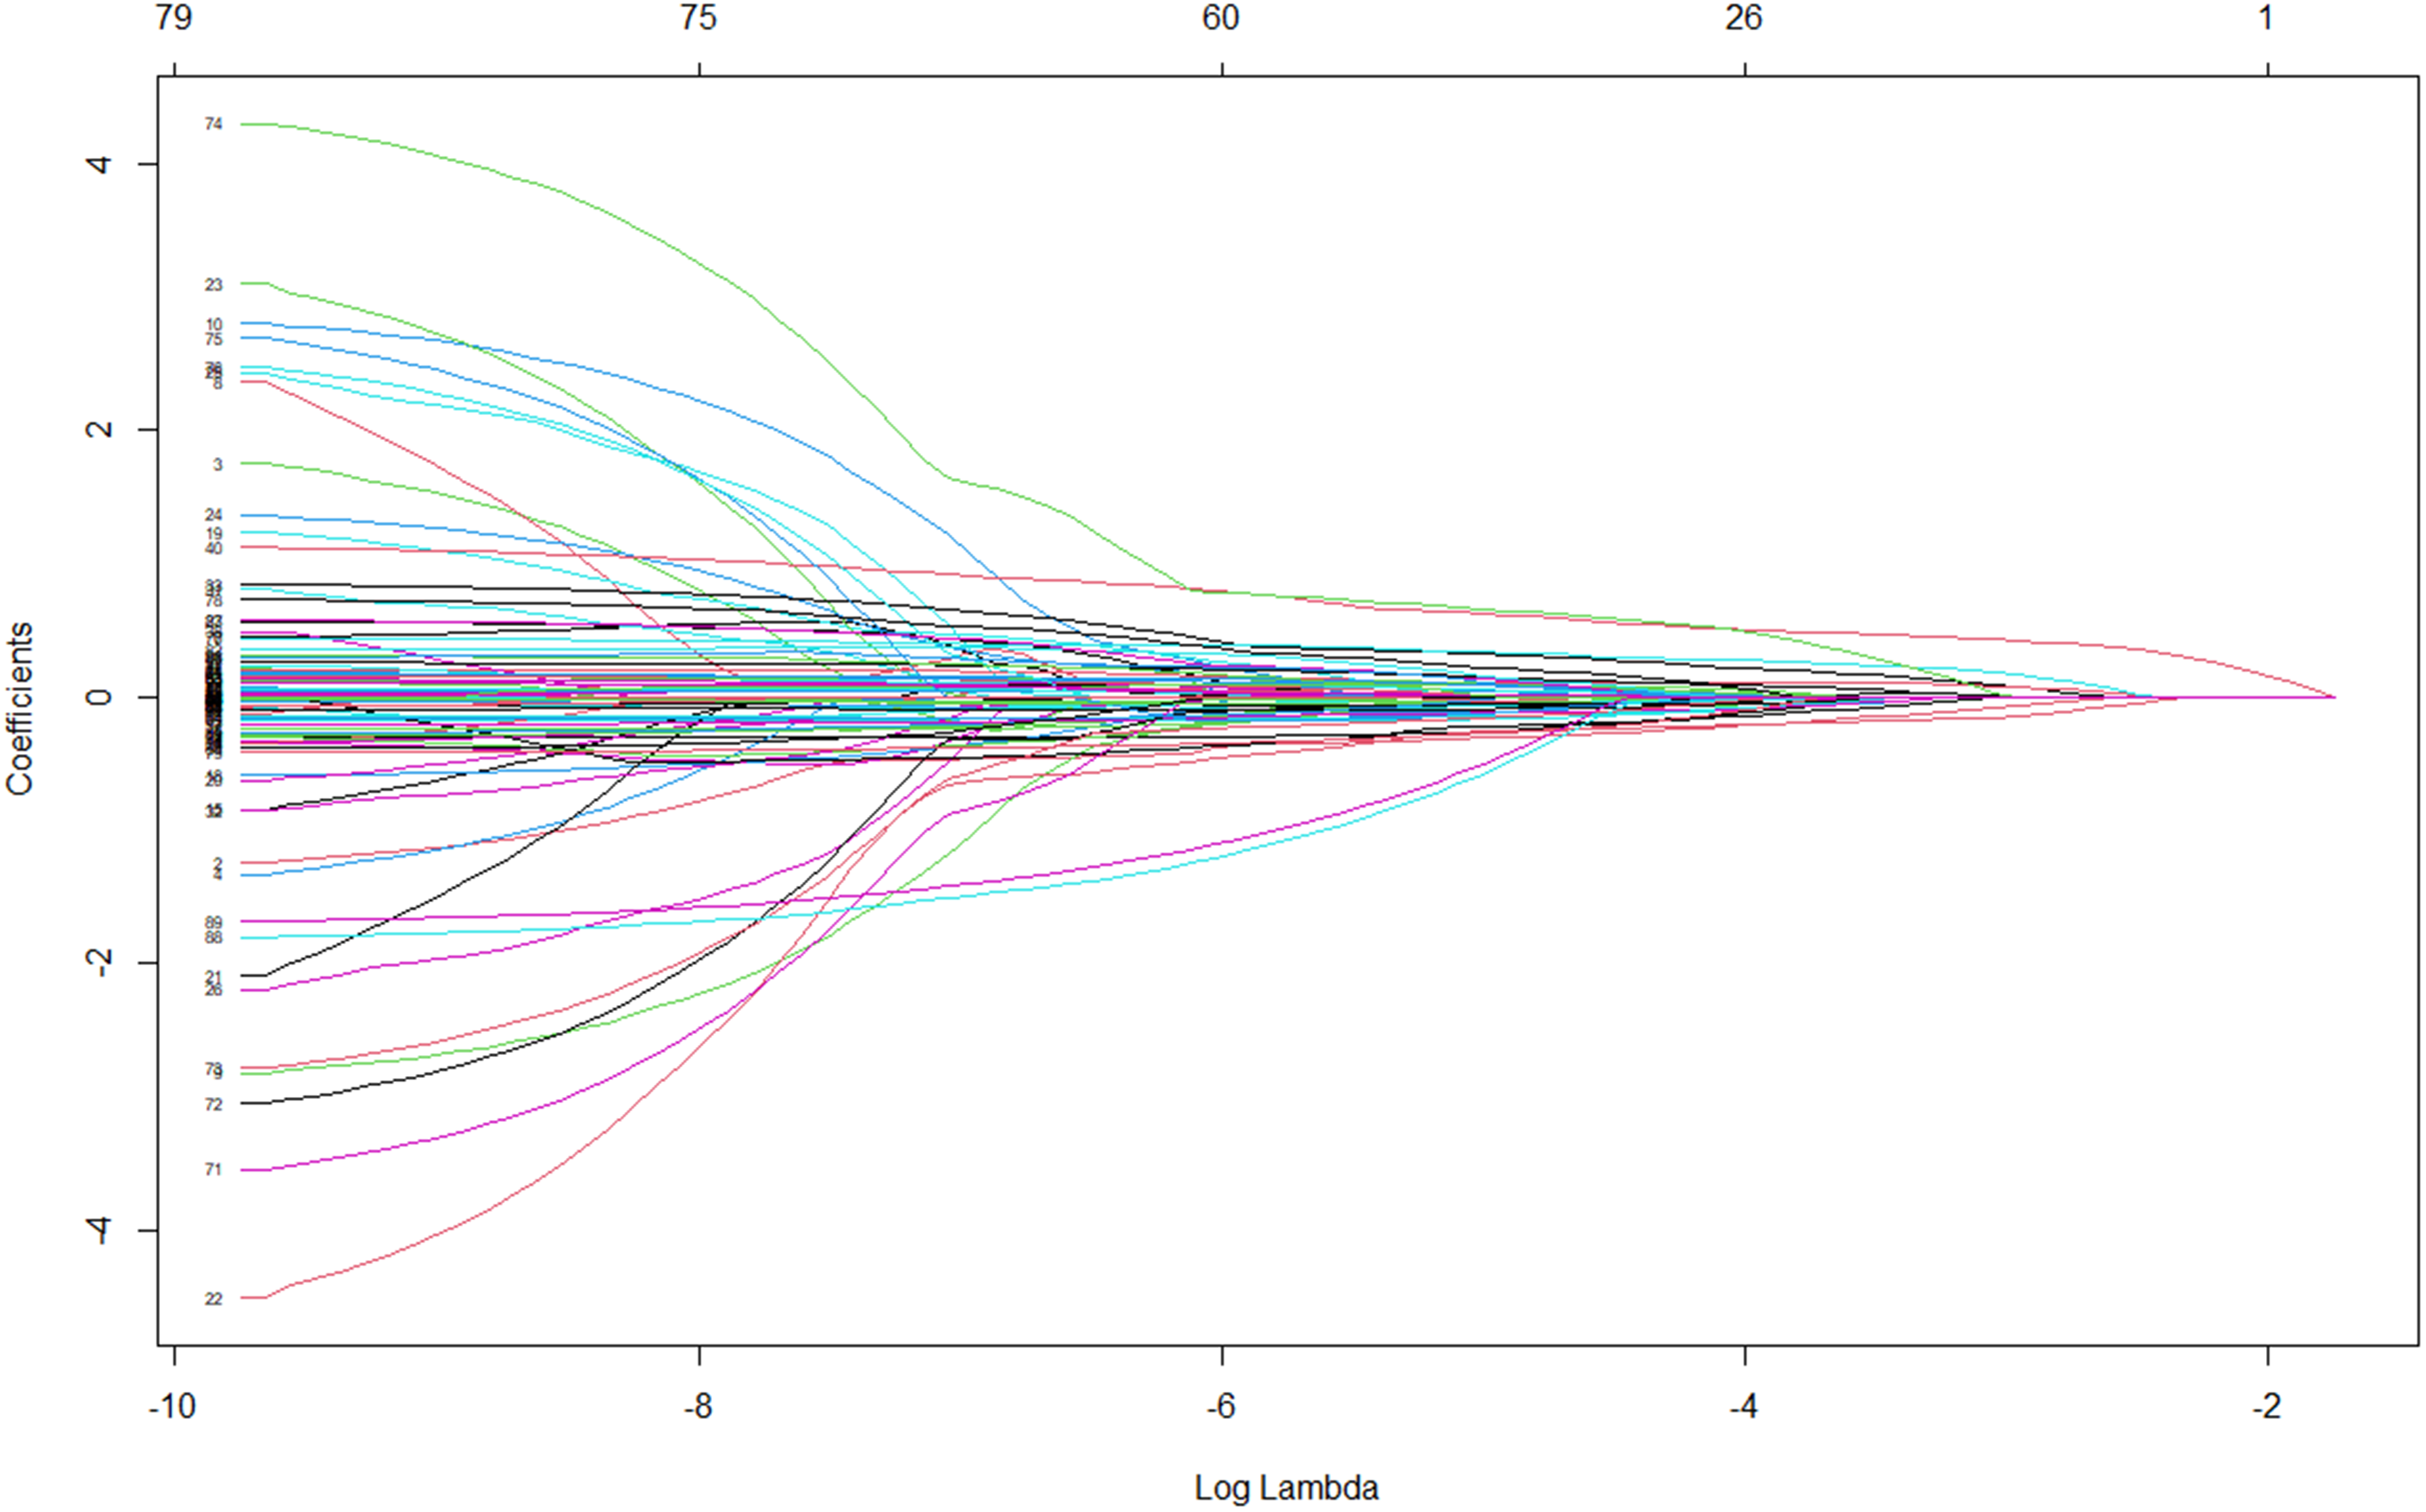
Variation chart of coefficients of variables in LASSO regression.
Figure 4 shows the number of retained variables and classification error change chart. x axis represents the coefficient that has not been reduced to 0 variable number, the lower x axis represents the value of log(λ), and y axis represents 95% CI binary error. The dashed line with the smallest dichotomous error corresponds to the optimal lambda.min. The top 20 variables ranked by the absolute value of the coefficient are shown in Figure 5.

Changes in the number of retained variables and classification errors.

Ranking of the top 20 variables.
As shown in Figure 5a, variables such as the proportion of lymphocyte duration less than 1.1 in the total time, blood type AB of recipient, gender, coefficient of variation of platelet, height, mean value of white blood cells at 30 days, and proportion of neutrophil duration greater than 6.3 in the total time are the most significant variables that affect the decline in postoperative white blood cell count.
Machine learning model selection
On the whole data set, the top 20 sorted variables were used as the final characteristic variables, and the normal group label to was set to 0 and the abnormal group label to was set 1. With the average AUC as the criterion, the model with the best performance was selected as the final prediction model by using the method of five-fold cross-validation. The candidate machine learning models included 8 types: L1 regularized logistic regression (Logic-L1), L2 regularized logistic regression (Logic-L2), SVM, DT, RF, MLP, XGBoost tree, and distributed gradient lift tree (LightGBM). The layout and training of the model were conducted in the sklearn machine learning library supported by Python 3.8.
The average evaluation indexes of the five-fold cross-validation of each machine learning model in all data sets are shown in Table 4. The average ROC curves of eight machine learning models are plotted in Figure 6. Table 4 and Figure 6 show that MLP model has the best comprehensive effect on this task, and it is selected as the final prediction model.
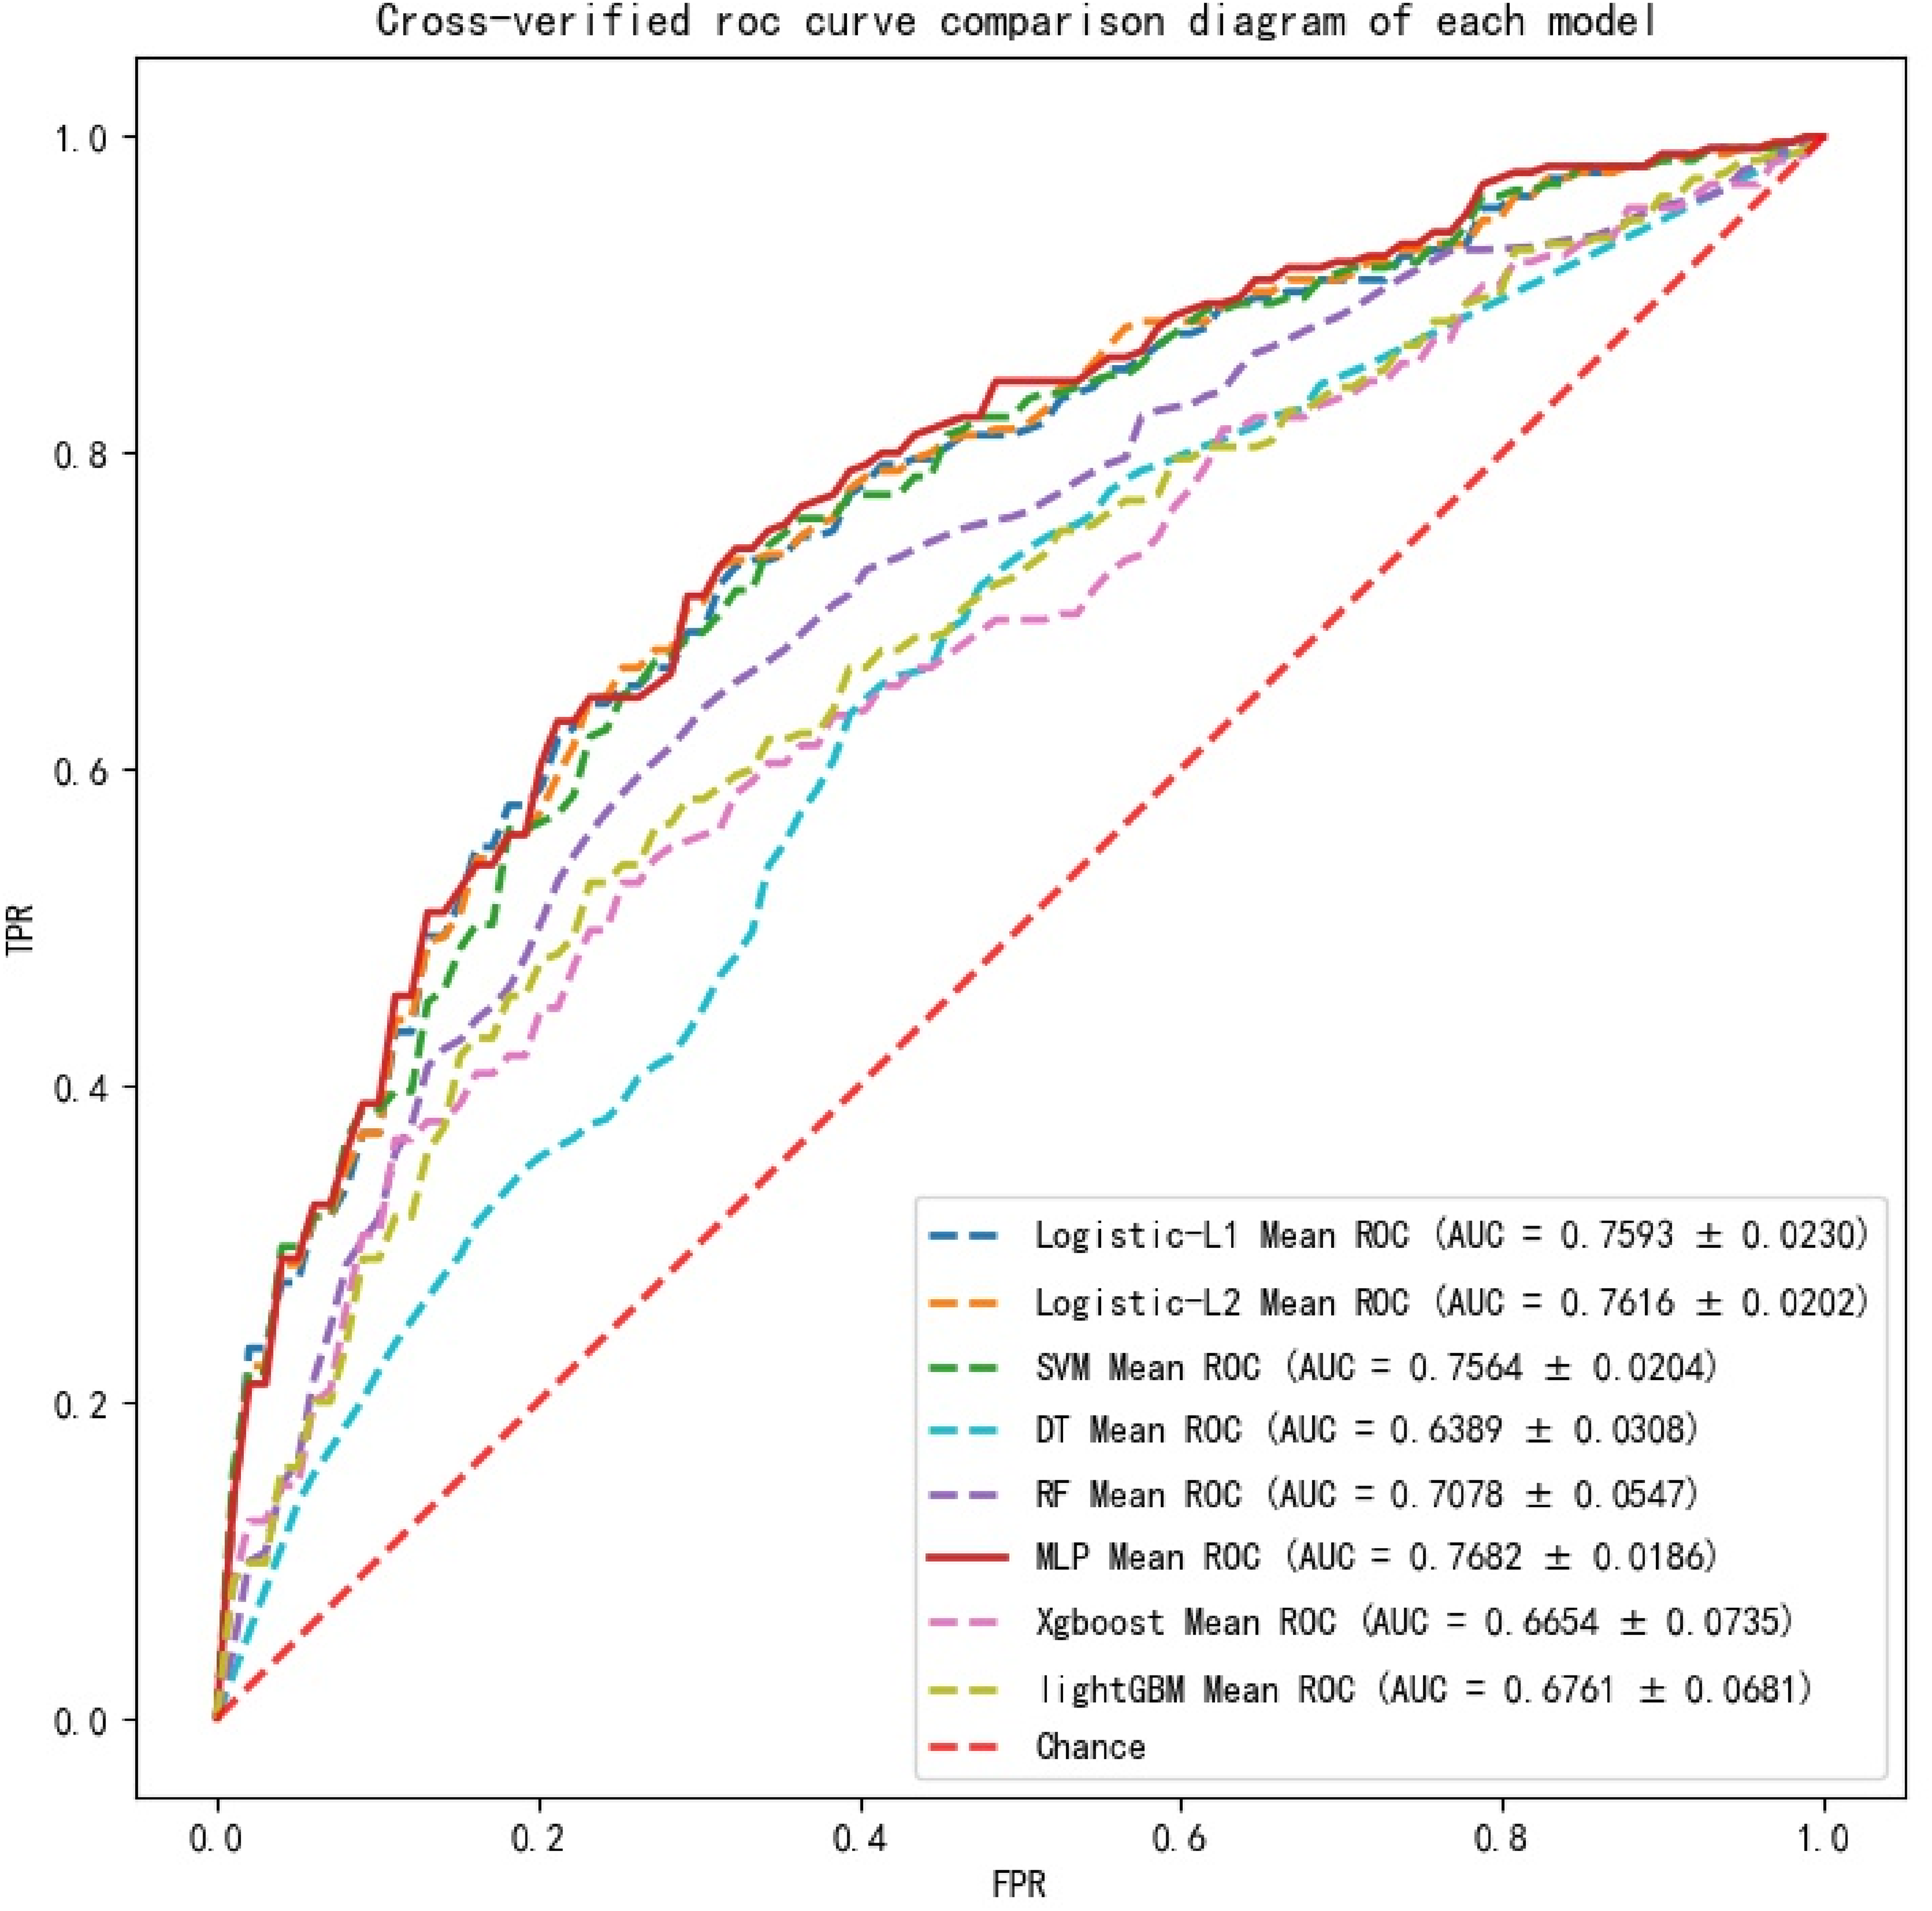
Comparison of average ROC curves of all models.
Comparison table of average evaluation indexes for cross-validation of each model.

Model building and optimization
A total of 546 patients were randomly divided into the training and test sets according to a ratio of 7:3. A total of 382 patients were included in the training set: 198 normal samples and 184 abnormal samples. A total of 164 patients were included in the test set: 83 normal samples and 81 abnormal samples.
The MLP model is a neural network model with at least one hidden layer of neurons between the input and output layers, and it adopts full connection between layers. The error backpropagation (BP) algorithm is used for training. The training process adjusts the connection weight between neurons and the threshold value of each neuron according to the data of the training set. The structural schematic diagram of the MLP model is shown in Figure 7.

The structural schematic diagram of the MLP model.
On the training set, the super parameters of the model are determined by means of half-fold cross-validation, and the value of AUC is selected as the evaluation index. If grid search is conducted for all parameters simultaneously, then the training time will increase exponentially. Therefore, this study adopts heuristic grid search to adjust parameters individually. The loss function adopts the cross entropy loss function, as shown in Formula (5):
Activation function of neurons adopts Sigmoid function, as shown in Formula (6):

Model effect of different numbers of neurons in the first hidden layer.
Then, the number of neurons in the second hidden layer is determined. The same method is adopted. The corresponding model results of different numbers of neurons in the second hidden layer are shown in Figure 9. The figure shows that the maximum average AUC is 77.23%, but the effect of the model will decline after adding another hidden layer. Thus, the model is finally determined to be a hidden layer with 18 neurons. Adam algorithm is used as the optimization algorithm. Adam algorithm is based on stochastic gradient descent. However, it is different from stochastic gradient descent in that the learning rate can be adjusted adaptively in the training process. Thus, it can achieve better training effect. The initial learning rate needs to be determined when modeling. In this study, the list of candidate learning rates is set as {0.0001, 0.0005, 0.001, 0.005, 0.01, 0.1}. The number of neurons and layers that have been determined are taken to get the corresponding model effects of different learning rates, as shown in Figure 10. The optimal initial learning rate is still the default learning rate of 0.001, and the average AUC value for cross-validation remains at 77.41%.

Model effects of different numbers of neurons in the second hidden layer.

Model effects corresponding to different initial learning rates.
The key parameters of the MLP model established in this study were set as follows: the number of hidden layers: 1; the number of hidden layer neurons: 18; neuron activation function: sigmoid function; optimization algorithm: Adam algorithm; initial learning rate: 0.001; all other parameters are default.
Results
After the steps of sample establishment, feature selection, model selection, model establishment and optimization, the final model was trained, and five-fold cross validation was used to avoid over-fitting of the model. After training, the average evaluation index on the training set and on the test set are shown in Table 5, and the ROC curve is shown in Figure 11.

ROC curve of the model on the test set.
Shows the effect of the model on the training and test sets.

In order to visualize the prediction effect of the model more intuitively, Figure 12 shows the confusion matrix of the average prediction effect of the model on the test set (the number of cases of each type is taken as an integer). From this figure, it can be seen that the prediction model has a clear tendency to predict correctly on both types of labels.
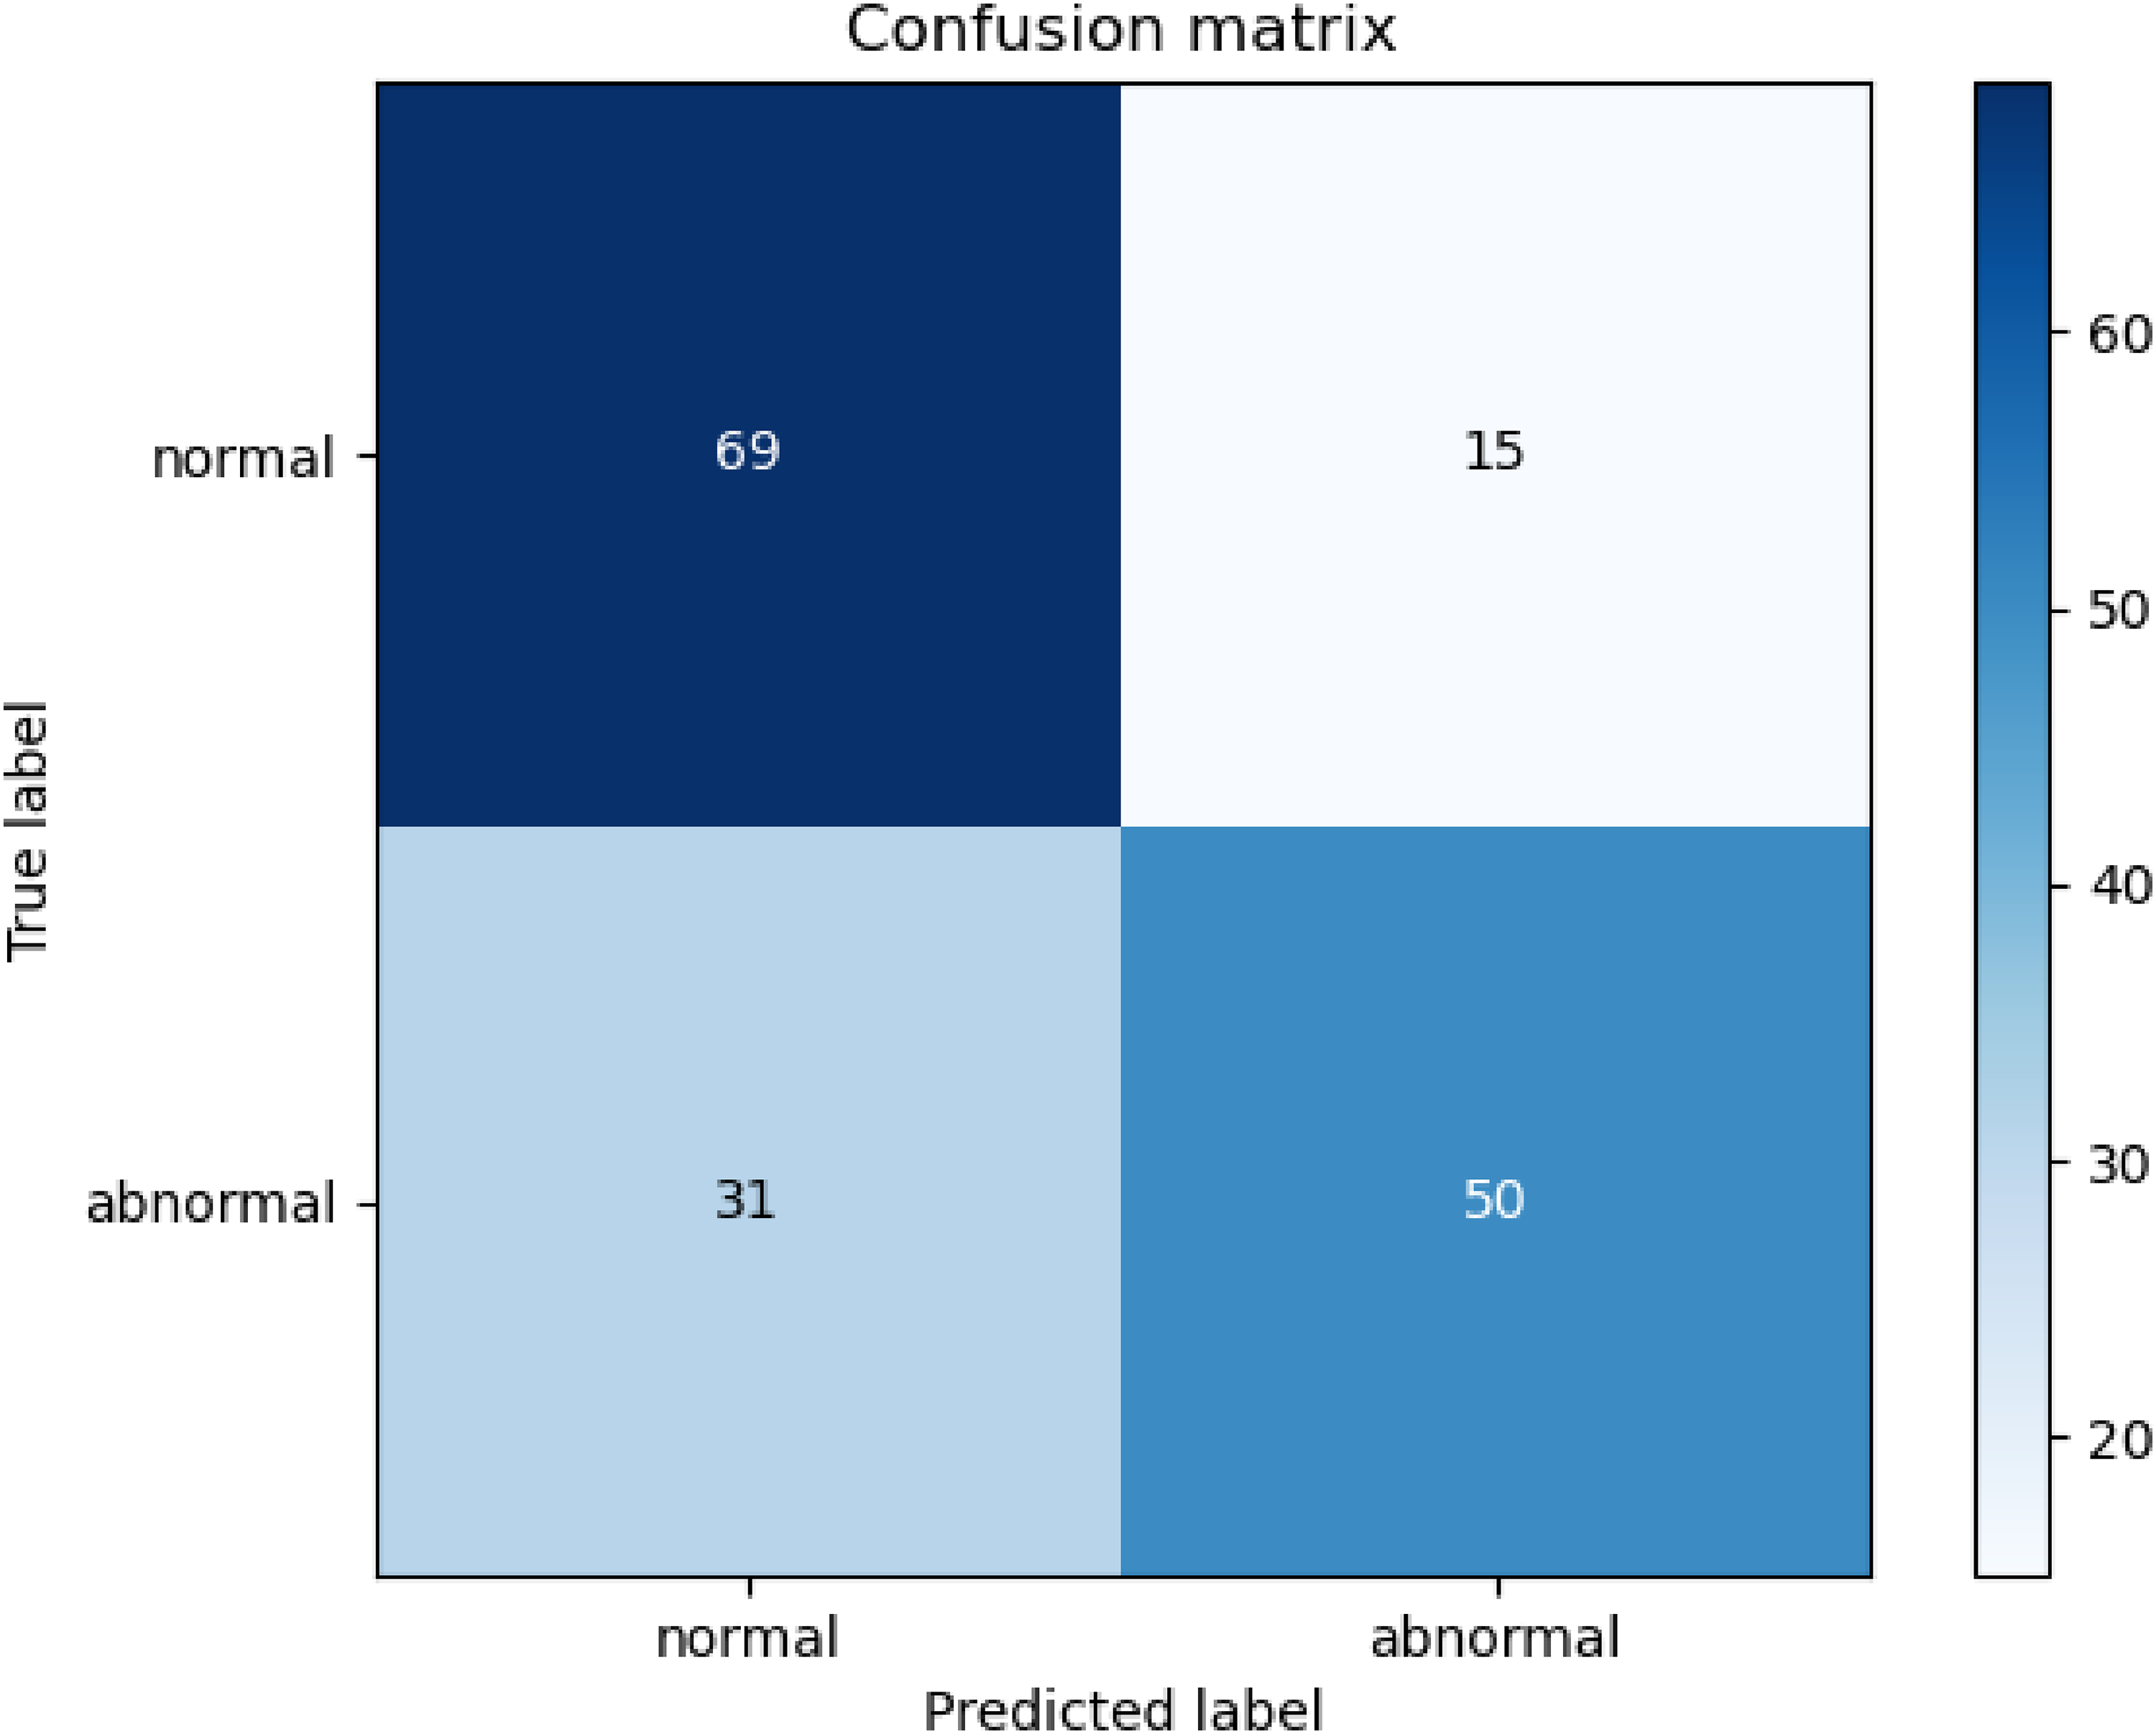
Test set confusion matrix of the classification prediction model.
To verify the robustness of the results of this study, the results of this study were compared with those of other published studies. AUC value is often used as one of the most important evaluation indicators of binary classification model, which is widely used because it can distinguish the false high accuracy of the model due to randomness. Therefore, this study uses AUC value as a comparison standard. In recent years, the prediction model for abnormal white blood cell count after kidney transplantation has not been developed by other scholars. This study uses the research in the field of kidney transplantation that uses real world data to predict other targets as a comparison object. In 2021, Xue developed and verified the donor risk score system using the medical records of 1807 donors and 3599 recipients of kidney transplants from 29 medical centers in China, and the AUC value reached 0.7552. 20 In 2023, Quinino used seven commonly used machine learning methods to build a machine learning prediction model for the immediate transplant function after deceased donor kidney transplantation. Among them, the XGBoost classification prediction model obtained the best prediction effect with an AUC value of 0.78. 21 The AUC value of the final prediction result of this study reaches 0.7730, which is better than the final prediction result of Xue's study and roughly equal to the final prediction result of Quinino's study, which can verify the usability of the final results of this study. In addition, this study used five-fold cross validation in the training of the model, which effectively avoided overfitting. This allows the robustness of the results of this study to be further verified.
Discussion
Infection is a major cause of postoperative morbidity and mortality among kidney transplant recipients. 22 Based on Medicare claims data collected by the American Kidney Data System, the initial infection rate is estimated to be 45% in the first 3 years after kidney transplantation. 23 The most common type of infection is lung infection, followed by urinary system infection, upper respiratory tract infection, and surgical incision infection. Infection can be prevented to some extent. The way to effectively reduce infection after kidney transplantation is an important prognostic problem of kidney transplantation. According to past experience, whether the infection will occur after the operation is closely related to the patient's own basic physical condition, the dosage of immunosuppressive drugs, and other factors. 24 In this study, a total of 546 patients with kidney transplantation were finally included, and the diagnostic reports in their electronic medical records were obtained. The two-dimensional correlation table of whether the white blood cell count was less than 4*109/L 30 days after kidney transplantation and whether infection occurred 30 days after the electronic diagnosis report was drawn, as shown in Table 6.
Contingency table of leukocyte level and infection occurrence.

Chi-squared test was used to determine the correlation between the two factors, and the final Chi-squared value was 6.199, and the P value was .013 < .05. In conclusion, a significant correlation exists between the white blood cell count of patients 30 days after the operation below the lower normal limit and the occurrence of infection. Furthermore, patients with lower white blood cell than the lower normal limit are more likely to develop infection. If the perioperative examination index can be used to predict the long-term postoperative white blood cell level, then it can also effectively predict the possibility of infection.
In this study, LASSO algorithm was used to determine the variables that had the greatest effect on lower than normal count of white blood cells. The variables were as follows: the proportion of lymphocyte less than 1.1 within 30 days, blood type AB of recipient, gender, platelet CV, height, the mean value of white blood cells within 30 days, the proportion of neutrophils greater than 3.3, the proportion of white blood cells less than 4, age, and creatinine.
The variable characteristics of lymphocytes, neutrophils, white blood cells directly reflect the quality of the patient's own blood function, and it is highly correlated with the level of white blood cells 30 days after surgery. Among them, the proportion of lymphocytes less than 1.1 is significantly higher in the abnormal group, with an average ratio of 58.4%. In this study, lymphocytes are the first important factor to predict the lower than normal level of white blood cells after kidney transplantation. Recipients with blood group AB are more likely to have decreased white blood cell count. The proportion of the recipients with blood group AB is small in the total sample group, and they can accept all four blood types of kidney donors. This result is rarely mentioned in previous studies, and it is worthy of further study and discussion. Female patients are more likely to suffer from decreased white blood cell count after kidney transplantation. Previous studies mentioned that females are more likely to suffer from delayed graft recovery after surgery.25,26 In the total sample group of the current study, the proportion of female kidney transplant recipients is significantly less than that of male patients. However, the proportion of female white blood cells decreasing to normal levels is greater. The average height and weight of men are significantly higher than those of women. Thus, the larger proportion of women in the abnormal group accounts for the difference in height between the normal and abnormal groups. Thus, height is a higher ranking variable as well. One possible explanation is that no obvious difference exists in drug selection and dosage of postoperative immunosuppressive agents between male and female at present. Under the same drug dosage, female is more strongly inhibited due to the smaller size, and the decrease in white blood cells is more obvious. In future clinical treatment, different drug dosages can be arranged for male and female. Creatinine, the ratio of duration of tacrolimus within the effective concentration to the total time, whether a history of blood transfusion exists, and other variables are also among the top of all candidate variables. Blood glucose content and whether diabetes exists also have a certain effect on the drop of postoperative white blood cell to the normal level. Therefore, considerable attention should be paid to the changes in patients’ creatinine and blood glucose concentration in subsequent clinical treatment.
In this study, a total of 546 cases of data were included after screening. For the sample size of input data for machine learning models, it is generally considered that the data size of several hundred to several thousand is acceptable, but generally not less than 300. But sometimes there are examples of using small sample sizes to build machine learning models, For example, in 2020, Kyle R. Jackson used the data of 140 marginal deceased donor kidneys and transplant recipients to compare the prediction accuracy of the two donor kidney scoring systems.
27
There are also examples of using a large sample size to construct a machine learning predictive model. For example, Yunwei Zhang used the data of 3624 patients in 2023 to develop a prediction model for the graft survival rate of kidney transplantation.
28
In 2018, Richard D Riley mentioned a calculation method to meet the minimum sample size requirements in his study.
29
In this study, the total follow-up number was 546 people, the follow-up time was 1 year, the abnormal patients were 265, the abnormal rate was 46.89%, and the number of features included in the modeling was 20. The calculated EPP of this study is (546 × 1 × 46.89%)/20 = 12.8, which conforms to the rule of thumb that EPP is at least 10. Therefore, the sample size of this study is sufficient.
In the stage of sample establishment, considering the integrity of the data and the prediction effect of the model, the processing of missing values in this study will delete the data of cases with missing values in the candidate features. The reason for this is that the data used in this study is sufficient and complete. Even if the cases with missing values are directly deleted, the number of cases finally included in the model will still be 546. It can fully support the operation of the prediction model. However, for the data set with relatively small amount of data and poor data integrity, it is necessary to develop a machine learning missing value filling method with better effect than the traditional missing value filling method to ensure sufficient data amount.
Some reports on kidney transplantation and machine learning have pointed out the superior performance of RF, SVM, and XGBoost in this respect, and this study found that after sufficient feature engineering processing, including the feature extraction method based on duration proportion proposed in this study and LASSO regression feature screening, compared with the above several machine learning methods, MLP has a better prediction effect. The following is a discussion on this phenomenon from the perspective of algorithm characteristics: Compared with the above machine learning models, MLP has major disadvantages such as high overfitting risk, large training complexity and weak interpretibility. However, this study did not directly input all features into the model when building the model, but pre-used LASSO regression to sort and screen the importance of features. The number of features decreased from 85 to 20, which removed redundant information for the MLP model in advance, reduced the overfitting risk and training complexity of the model, and at the same time, the obtained feature ranking of the importance of the outcome clearly gave the 20 features with the highest importance and their importance scores, which improved the interpretability of the entire model. At the same time, the information obtained by the feature extraction method based on duration ratio proposed in this paper will bring more additional information to the model after being processed by MLP with more complex structure than other methods. Several major shortcomings of the MLP model are remedied, while its advantages such as strong feature learning ability and strong generalization ability for large-scale data sets and high-dimensional inputs compared with other machine learning models are maintained, making it obtain better prediction results.
It should be limited that all cases in this study were first-time kidney transplantation, and the causes of kidney failure and induction immunosuppressive agent were not recorded, which resulted in the fact that the causes of kidney failure, induction immunosuppressive agent, previous kidney replacement methods, and previous transplant history were not included in the study. The influence of these features on leukocyte abnormalities in patients after kidney transplantation is expected to be further studied.
Conclusion
The decrease in leukocyte level below the normal level is an adverse outcome after kidney transplantation. Thus, the feature that the duration of different variables in different intervals accounted for the proportion of the total observation time was introduced in this study. It could provide more predictive information than only extracting the mean and extreme values. Through statistical analysis and LASSO algorithm for feature selection, the time proportion of lymphocyte less than 1.1 within 30 days, blood group AB of recipient, gender, platelet CV, height, and other variables were found to have the greatest effect on the postoperative level of white blood cells. The results can be used as a realistic basis to remind doctors to study the internal relationship between these features and abnormal white blood cell count after kidney transplantation. Eight machine learning algorithms were used in all data sets for comparison, and the MLP model was determined to have the best effect. After the parameters of the divided training set were adjusted, a good predictive effect was achieved in the test set. Specifically, the AUC value of the model reaches 77.30%, which has a certain auxiliary effect on clinical treatment, can help doctors predict the risk of surgery, and pay more attention to patients with high risk of surgery in advance.
Among the features obtained in this study with the high ranking correlation with abnormal white blood cell count after kidney transplantation, the internal reasons and medical principles of some features related to the target need to be more comprehensive and specific experimental and modeling studies, such as recipient AB blood type, patient gender, and height.
Footnotes
Contributorship
All authors substantially contributed to preparation of the manuscript and gave final approval for publication.
Data availability
The data underlying this article cannot be shared publicly due to the data used in this paper concerns the personal privacy of hospital patients. The data will be shared on reasonable request to the corresponding author.
Declaration of conflicting interests
The authors declared no potential conflicts of interest with respect to the research, authorship, and/or publication of this article.
Ethics approval and patient consent
This study was approved by the Medical Ethics Committee of Tongji Hospital Affiliated to Tongji Medical College of Huazhong University of Science and Technology (REC number: EC-20211103-1002) with the approval document number TJ-IRB20231274, and the approval document also contains the approval of the request to exempt the subject from informed consent.
Funding
The authors disclosed receipt of the following financial support for the research, authorship, and/or publication of this article: This work was supported by the National Natural Science Foundation of China (grant number No. 72104085).
Guarantor
XL.