
Abstract
This study aims to identify factors influencing the success of sacrifice flies in US Major League Baseball. From baseball-tracking outputs of official games during 2023–2024, 3439 flyouts reaching >50 m from home plate when a runner was on third base with <2 outs were analyzed. A multiclass classification model was developed to predict results of runners at third base (i.e., stayed at third base, tagged out at home plate, or scored on a sacrifice fly) from batted ball kinematics, runner's sprint speed (SS), the fielder's arm strength (AS), and ballpark. Average probability scores were compared by systematically altering these inputs. The results show that (i) the model accurately predicted the runner staying at third and sacrifice flies (F-score ≥ 0.842) but could not predict tag outs (0.057), (ii) nearly all flyouts reaching <70 m from home plate would result in the runner staying on third base, whereas the runner usually would score when the flyouts reach ≥85 m, and (iii) the shortest flight distance required for a sacrifice fly could be expressed by a simplified linear function: distance = 87.2–3.1SS + 0.7AS. This function will help set targets for better decision-making and greater success of sacrifice flies.
Introduction
In baseball games, selecting an offensive strategy according to the game situation is critical for maximizing the probability of scoring. Since the first study was published showing the run-scoring distributions of teams in Major League Baseball (MLB) games in the United States (Lindsey, 1963), several studies have reported the influence on the expected run values of factors representing game situations, such as number of baserunners, the status of base loading, inning, and score differentials (Albert and Bennett, 2001; Albert, 2002; Tango et al., 2007). They reported that expected runs were highest in game situations with a runner(s) on second and/or third base with a low out count. Identifying and evaluating players based on statistics who can make base hits and advance runners, especially when the bases are loaded, have been a hot topic in sports journalism and baseball social media, particularly following the release of Michael Lewis's book, Moneyball. More recently, various analytical methods with artificial intelligence have been applied to baseball datasets (Koseler and Stephan, 2017), enabling more detailed investigations, such as using a machine learning method to estimate the effects of different batting strategies on team’s runs (Nakahara et al., 2023) to assist players and coaches for better decision-making in games.
The success of scoring in critical game situations is influenced by various factors, such as the offensive abilities of hitters and runners, the opposing team's defensive abilities, and environmental factors (e.g., wind effects). Since pitch-by-pitch data have been collected using baseball-tracking systems installed in all official MLB ballparks (MLB Advanced Media, no date e), new metrics and methodologies for evaluating each offensive and defensive play have been rapidly developed. For example, MLB has introduced various fielding-related metrics, such as the “outfield catch probability” (MLB Advanced Media, no date c; Petriello, 2017) and “arm value” metrics (MLB Advanced Media, no date b), which are designed to quantify outfielders’ ability to make catches and prevent extra bases. Moreover, with access to batted ball kinematics through the MLB database (https://baseballsavant.mlb.com/statcast_search), academic studies have been conducted to develop methodologies for optimizing fielder positioning to maximize defensive coverage area (Bouzarth et al., 2021; Easton and Becker, 2017; Murray et al., 2022). Although various metrics and methodologies have been developed to evaluate each play of players using ball-tracking data, few studies have provided practical information and insights about how to increase the likelihood of scoring in specific situations, such as when a runner is on third base with a low out count.
In closely contested games with a small score differential, in which a single run can have a substantial impact on the game result, the offensive team may select sacrifice plays to advance base runners, instead of aiming for base hits. When the runner attempts to advance to home plate and whether they score on a sacrifice fly should be explained by various factors, such as batted ball kinematics including the ball's flight distance from home plate, its hang time, and the horizontal angle of its landing location, the runner's sprint speed, and the fielder's ability. These various factors may make it difficult for runners on third base and third-base coaches to decide whether the runners should advance to home plate or stay on third in a given game situation. Although research continues to examine the influence of sacrifice plays on run production (Hirotsu and Bickel, 2019) and analyze strategic decision-making characteristics across various populations (Chuang et al., 2022), the influence of the factors on the runner's attempts and the success of sacrifice flies remains unexplored. Accordingly, in this study, we aim to describe batted ball kinematics for scoring in critical situations and examine factors that influence the success of sacrifice flies in MLB games. The findings of the present study will offer valuable insights for runners and third-base coaches to assist in suitable decision-making and increase the chance of scoring while reducing the risk of tag outs.
Materials and methods
The data collected in official MLB games were obtained from the MLB database (https://baseballsavant.mlb.com/statcast_search). The measurement system, known as StatCast technology (MLB Advanced Media, no date e), employs high-definition video (Hawk-eye, Hawk-Eye Innovations Ltd, Basingstoke, UK) and has been installed at all official MLB ballparks. This system measures the trajectories of pitched and batted balls as well as player's motions on the baseball field. MLB reported that the system can measure ball position with an error of smaller than 10 mm (Jedlovec, 2020). The data are publicly available for non-commercial use; thus, ethical approval was not sought for the present study.
Using the MLB database, we programmatically collected the dataset of the official games held during the 2023–2024 seasons. The data collected in the particular seasons were used because the base size changed from 15 to 18 inches square in 2023 (MLB Advanced Media, no date a), and MLB switched the measurement systems in 2020 (MLB Advanced Media, no date e). Of all batted balls recorded, we selected those occurring in game situations in which a runner was on third base with fewer than 2 outs, and the batted ball flew over the distance of ≥50 m and was directly caught by a fielder in both fair and foul territories (N = 3518). The records involving fielder errors were removed, so that 3439 batted balls were used for the subsequent predictive modeling. To describe the batted ball characteristics, the launch speed, vertical launch angle, horizontal landing angle, and flight distance from the home plate were extracted from the ball-tracking outputs (from this called exit velocity, launch angle, spray angle, and flight distance, respectively). The vertical exit velocity was defined as the component of the exit velocity in the vertical direction and computed from the launch angle and exit velocity. Negative and positive values of the spray angle indicate clockwise rotation (toward the first-base side) and anticlockwise rotation (toward the third-base side) from a straight line drawn from the tip of home plate to the center of pitcher's plate, respectively. The field was laterally divided into the foul territory of the left side (FL, spray angle: > 45°), left field of fair territory (LF: 15° to 45°), center field (CF: −15° to 15°), right field (RF: −45° to −15°), and foul territory of the right side (FR: < −45°). The variables representing the ballpark identifier (N = 30), the identifier of the runner on third base, and descriptions of the result showing which position player made a catch and whether the runner on third base was out at home plate were extracted from the system outputs.
Performance metrics, namely the runner's sprint speed and the fielder's arm strength, were collected from the leaderboard of the MLB database (https://baseballsavant.mlb.com/leaderboard/statcast). Sprint speed, as defined by MLB, represents the seasonal average of a player's sprint speed obtained from qualified runs (MLB Advanced Media, no date d). The qualified runs include situations that (i) a batter makes two or three-base hits, excluding the situations in which the runner starts on second base and advances on an extra-base hit, and (ii) a batter launches balls that are either weakly hit or topped. The fielder's arm strength metric was defined as throwing ability with full effort and was computed from the ball speed in the top 1–10% of hard throws as a player's seasonal performance. Since values for the fielder's arm strength metric were missing for 139 batted balls, missing values for a given case were replaced by the available value in another season or the average value across fielders in the same position.
In the present study, predictive modeling was applied to examine the influence of ball kinematics (i.e., spray angle, flight distance, and vertical exit velocity) and situational variables (i.e., arm strength, sprint speed of the runner on third base, and ballparks) on the corresponding results: (i) stayed on third base, (ii) tagged out at home plate, or (iii) scored on a sacrifice fly. The eXtreme Gradient Boosting (XGB) algorithm (Chen and Guestrin, 2016) was used to construct the predictive model. The XGB algorithm is a developed method based on the gradient tree boosting (Friedman, 2001) used for classification and prediction. It constructs a set of models in a stage-wise manner by adding a new tree that minimizes the errors between the class label predicted by the current ensemble and the true label. The final prediction is determined by summing the scores from all trees. For the model construction in the present study, the data collected during the 2023 season was used as a training set (n = 1737), and the data collected in the 2024 season was used as a test set (n = 1702). Hyperparameters were optimized using a 5-fold cross-validation method. The constructed XGB model outputs the probability score for each result, ranging from 0 to 1: the probability of the runner on third base staying (p(stay)), being tagged out at home plate (p(tag out)), or scoring on a sacrifice fly (p(sacrifice)). The prediction results were determined by the probability score of the result with the highest probability. To evaluate the predictive performance of the models, the F-score was calculated using the test set. False predictions, where the model incorrectly predicts the result, are referred to as “unpredicted stay”, “unpredicted tag out”, and “unpredicted sacrifice”.
A preliminary study was conducted to compare the predictive performance of the XGB algorithm with the other methods, namely multinomial logistic regression (MLR), support vector machine (SVM; Vapnik, 1995), k-nearest neighbor (kNN), and random forest algorithms (RF; Breiman, 2001). The results demonstrated that the XGB model outperformed the other methods, achieving an accuracy of 0.915 and an F-score of 0.617. In comparison, the accuracies for the MLR, SVM, kNN, and RF models were 0.905, 0.907, 0.850, and 0.911, respectively. Notably, the MLR, SVM, and RF models failed to predict tag outs.
To interpret each variable's contribution to the model's outputs, we applied SHapley Additive exPlanations (SHAP) analysis (Lundberg and Lee, 2017). SHAP values, derived from cooperative game theory, allocate contributions among variables by quantifying their impact on the prediction through comparisons of model outputs with and without each variable (Lundberg and Lee, 2017). The additive nature of the XGB algorithm enables the decomposition of each prediction into the contributions of individual variables, relative to the SHAP expected value. For a given prediction, positive SHAP values indicate that the variable made the predicted result more likely, whereas negative values indicate that the variable made the predicted result less likely. This approach helps understand the factors that drive a prediction and quantify the contribution of each feature to a prediction.
To evaluate the interactive influence of ball kinematics, sprint speed of the runner on third base, and arm strength of fielders, a simulation was conducted with the XGB model. A set of fly balls with identical distributions of vertical exit velocity and flight distance, a symmetric distribution across fair territory, and given metrics for runner's sprint speed and fielder's arm strength was created to use as input to the predictive model. A total of 92,340 fly balls comprising 19 spray angles (from −45° to 45° at 5° intervals), 18 flight distances (from 60 to 94 m at 2-m intervals), and the average values of the vertical exit velocity corresponding to the flight distance, 3 sprint speeds (8.1, 8.4, and 8.7 m/s), 3 arm strengths (26.0, 26.7, and 27.5 m/s) based on these interquartile values of the league, and 30 ballpark identifiers were systematically constructed. For this simulation, the input range of spray angles was set only to cover fair territory due to the limited number of batted ball records in foul territory. The average values of the probability scores were estimated and compared across different flight distances, sprint speed metric values, and fielder's arm strength metric values by systematically varying these inputs while holding the other factors uniform or constant.
All batted ball data that met the inclusion criteria were used for the analysis, so we showed the mean and standard deviation of the population. The frequencies of the prediction errors across areas were compared with Fisher's exact test. The Bonferroni correction was used to control multiple comparisons with statistical significance. All analyses were conducted using R statistical computing software (R Core Team, 2024).
Results
In the 2023–2024 seasons, 18,755 plate appearances were recorded in game situations in which a runner was on third base with fewer than 2 outs. Of those plate appearances, 4578 balls were launched at an angle of ≥10° (i.e., fly balls), and 75% of those resulted in run(s) made, whereas 5909 balls were launched at an angle of <10° (i.e., ground balls) and 65% of those resulted in run(s). Although hitting fly balls resulting in putouts on a non-sacrifice play rarely led to run(s) (4%), hitting ground outs created more chances of advancing runners and scoring runs (51%). In addition, batting average on balls in play (BABIP) was higher for fly balls (60%) than for ground balls (31%).
Figure 1 shows the data distributions of the flight distance and exit velocity for each batting result in each flight trajectory classification. The median values of the flight distance differed by ≥20 m/s for fly balls across the batting results (Figure 1(a)). In the fly balls, the exit velocity data were distributed similarly for balls resulting in sacrifice and base hits (Figure 1(b)), whereas the median value was 6-m/s higher (42 m/s; Figure 1(c)) for scoring plays than for non-scoring plays (36 m/s).
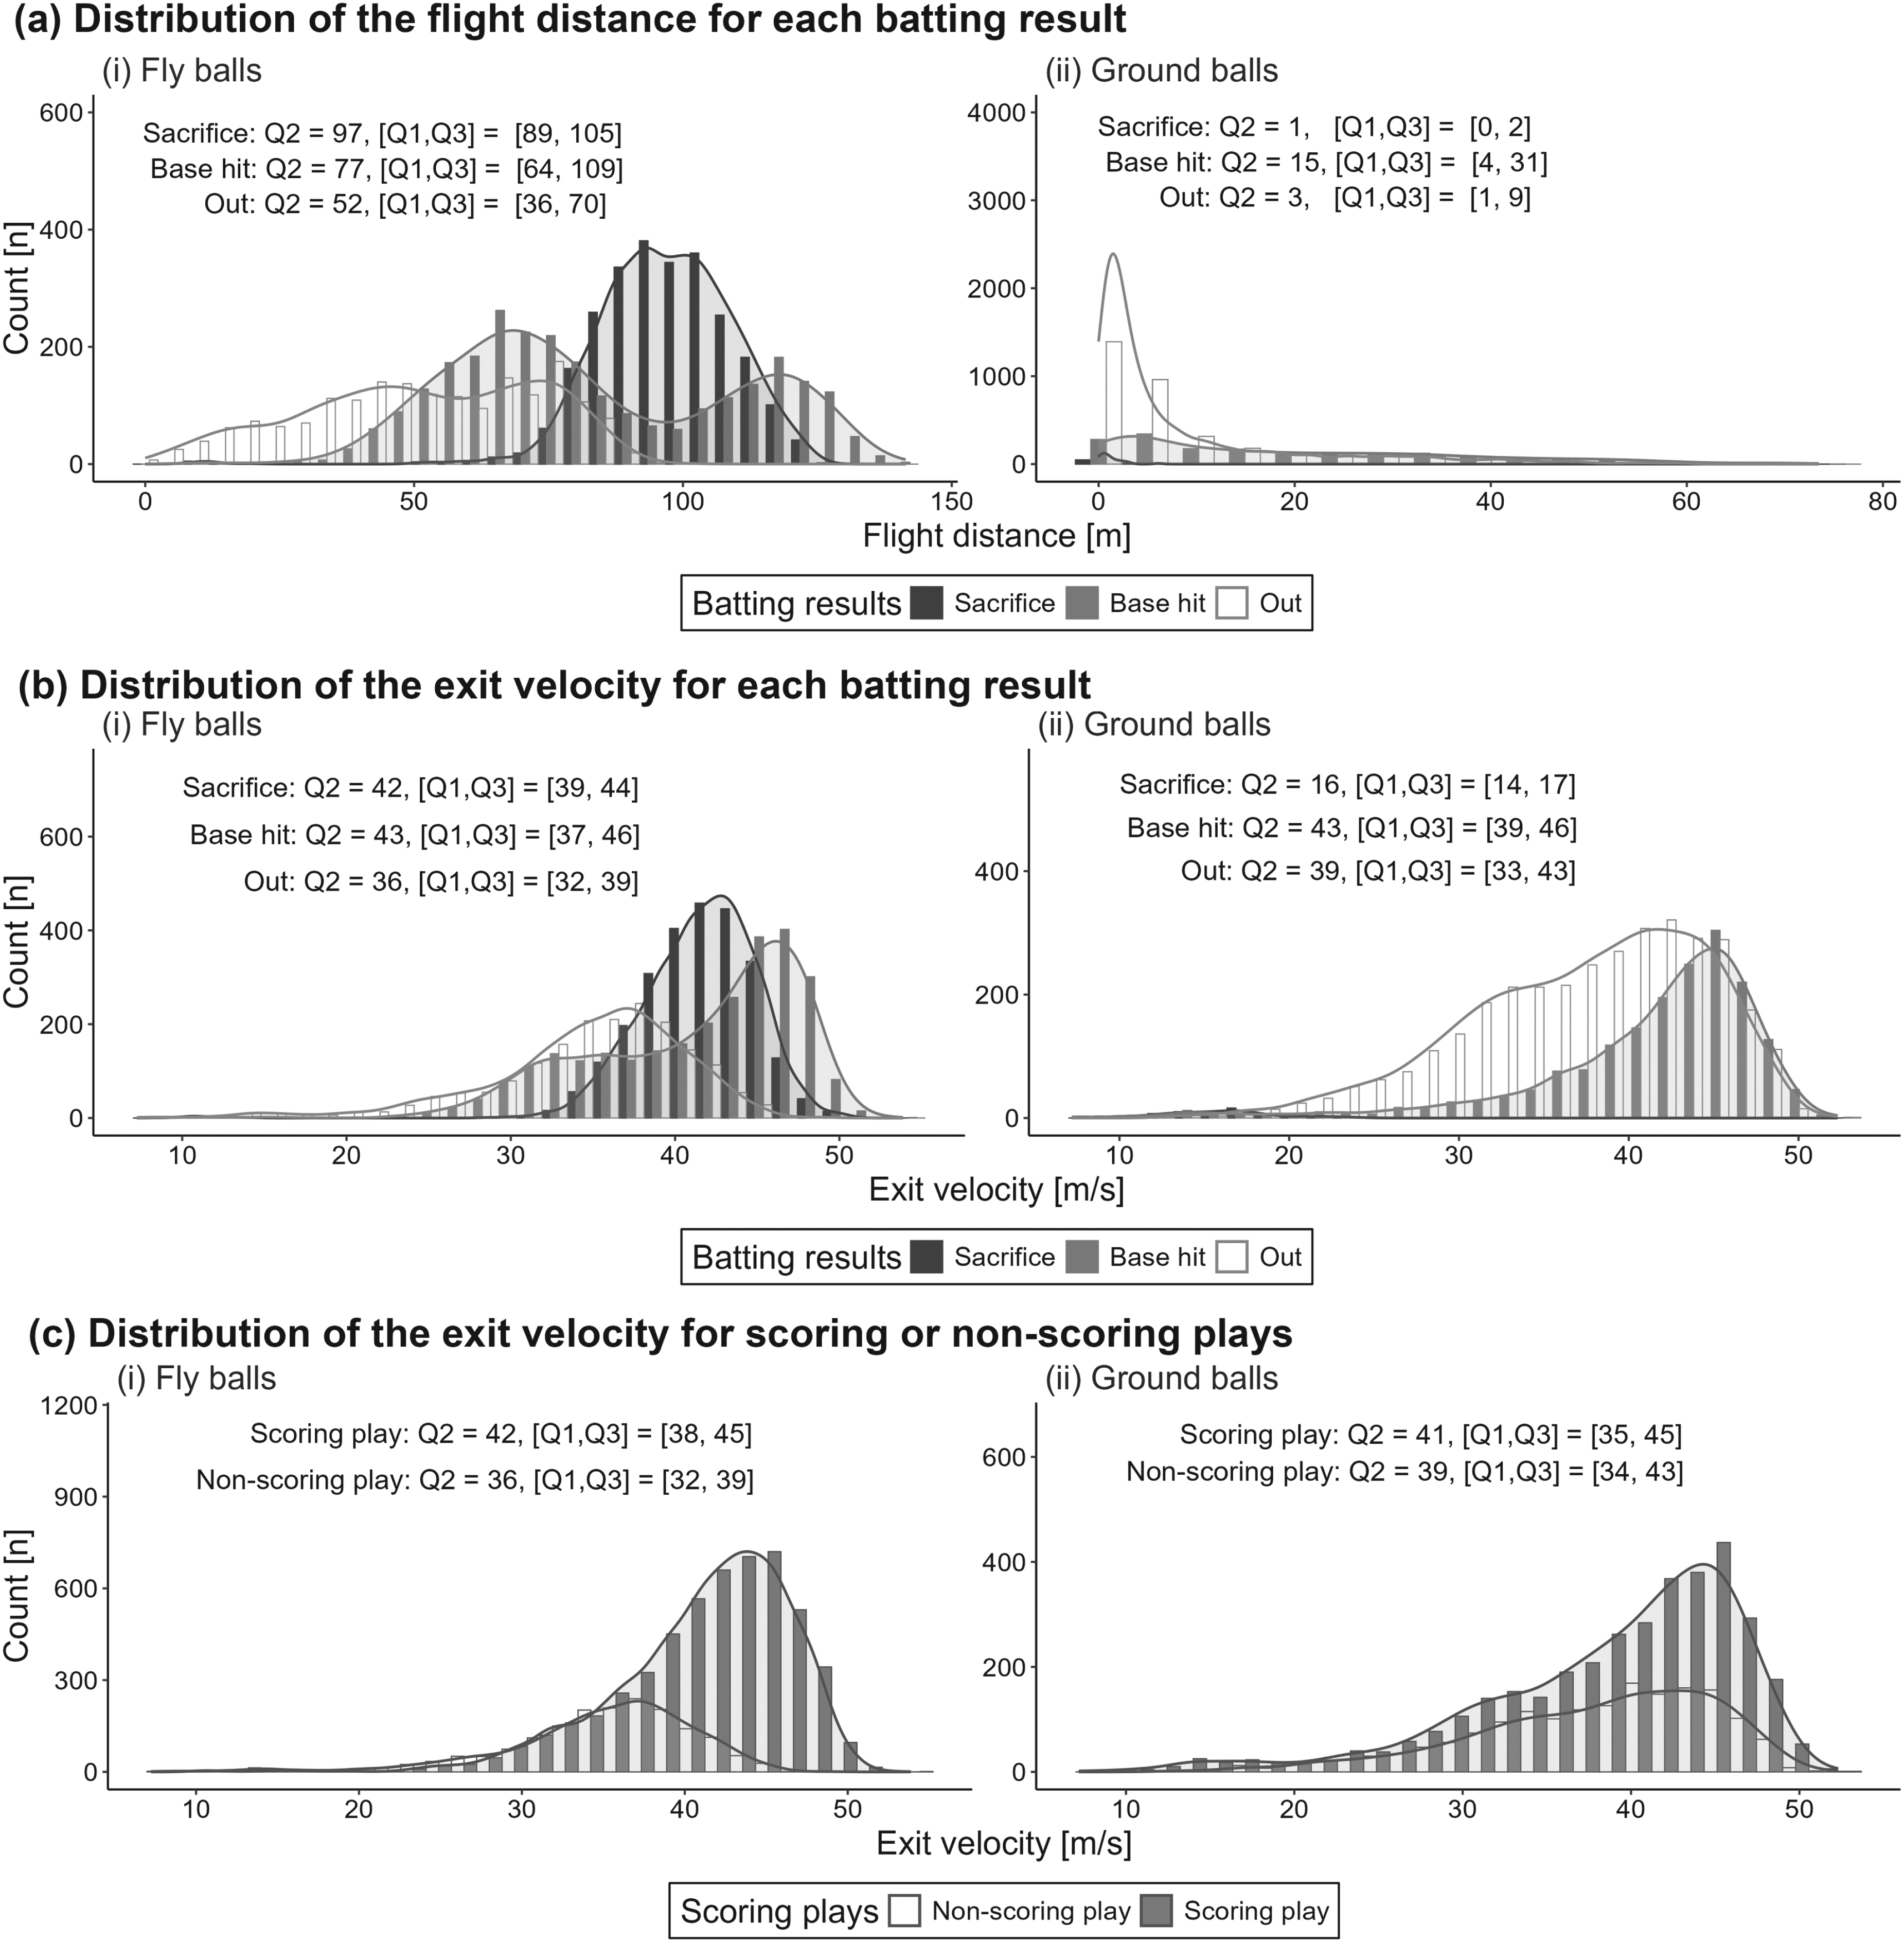
Data distribution of (a) flight distance and (b) batted ball speed for each batting result (i.e., sacrifice flies, base hits, or outs), and (c) batted ball speed in scoring or non-scoring plays for (i) fly balls and (ii) ground balls. Median (Q2), lower quantile (Q1), and upper quantile (Q3) are displayed.
A total of 6175 balls flying over >50 m resulted in 2657 base hits (43%), and 3518 outs (57%). After removing the records involving the fielder errors and fielder's choice, 2565 of 3439 flyouts (75%) resulted in runners on third base attempting to advance to home plate. In the other 874 flyouts (25%), the runner stayed on third base. Consequently, the runners scored on a sacrifice fly with a success rate of 97% (n = 2492), whereas 3% of attempts (n = 73) failed with the runner tagged out at home plate. Descriptive statistics of included variables in the present study are shown in Table 1.
Descriptive statistics for variables considered in this study according to result.
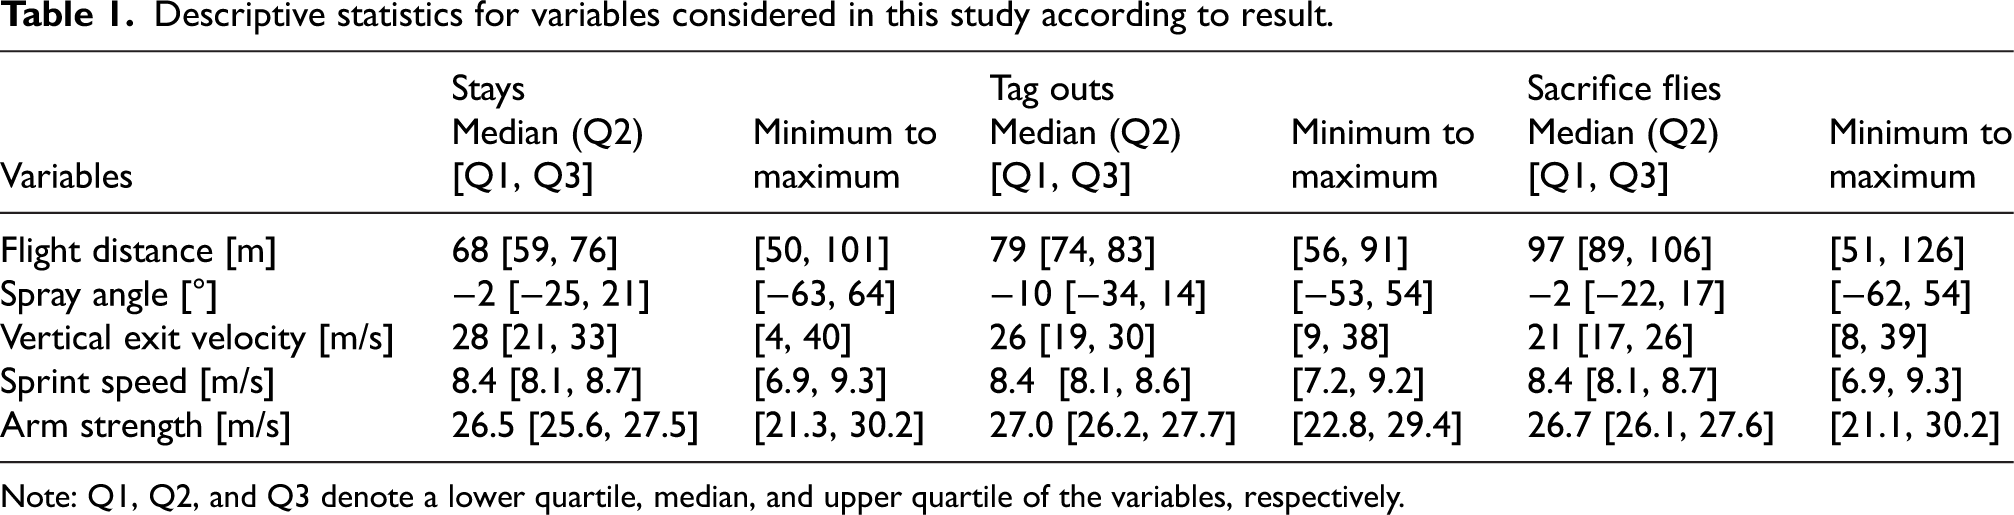
Note: Q1, Q2, and Q3 denote a lower quartile, median, and upper quartile of the variables, respectively.
In fair territory, runners advanced to home plate in nearly all instances (≥90%) when a fly ball reached a distance of ≥85 m from the plate, with a success rate exceeding 98%; in contrast, runners rarely attempted to advance to home plate (≤7%) when a fly ball reached <70 m from home plate. The rate of sacrifice flies was >88% for flyouts that reached ≥70 m. Flyouts were less frequent in foul territory (n = 118) compared with fair territory (n = 3321). Tag outs were found at distances of ≤91 m and ≤77 m from home plate in fair and foul territories, respectively.
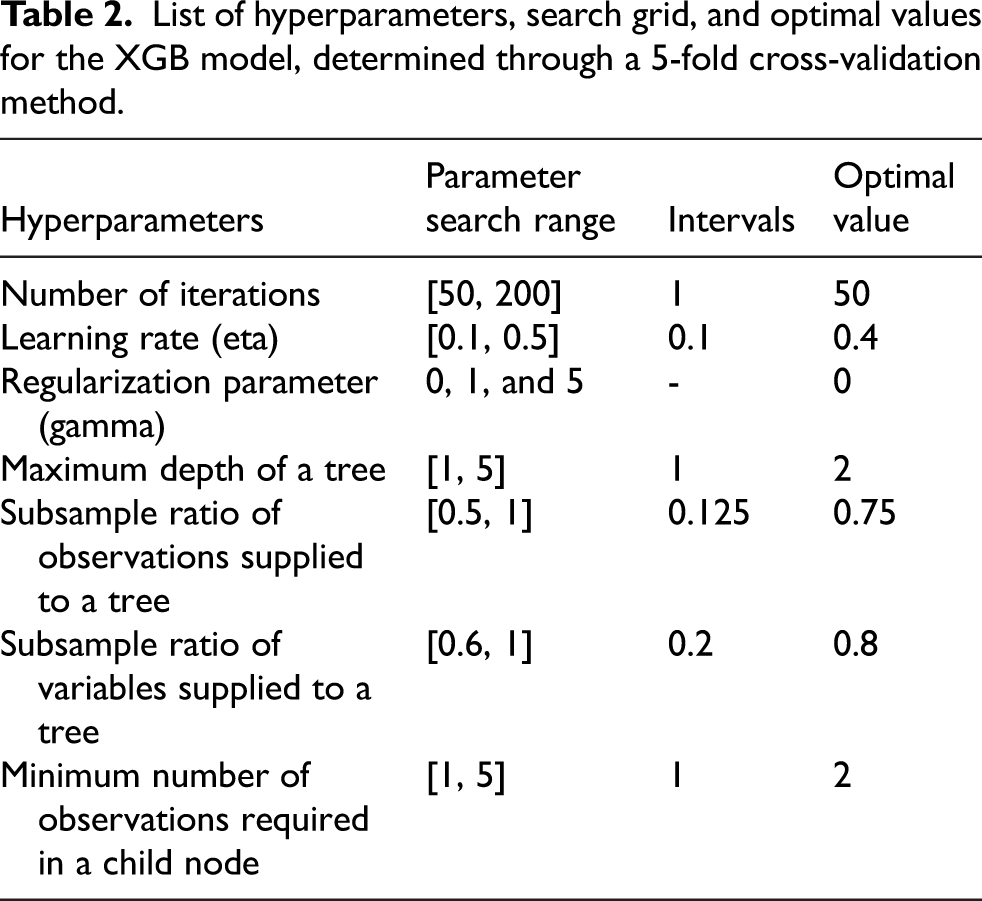
The optimal values of the XGB model determined by the 5-fold cross-validation method are shown in Table 2. The F-scores of the model were 0.842, 0.057, and 0.951 for staying on third base, tag outs, and sacrifice flies, respectively. Only two predictions were made for tag outs, and one of them was predicted correctly by the model. The prediction results showed the false predictions in a distance range of 75–80 m (47%; p < .001) more than in the other ranges (≤28%). The ratio of false predictions to total flyouts was significantly higher in foul territory (16%; p = .042) than in fair territory (8%). In addition, the ratio of false predictions was slightly lower in CF (6%) compared with LF (10%) and RF (9%) in fair territory, but significant differences were not found for any pairs (p > 0.120).
List of hyperparameters, search grid, and optimal values for the XGB model, determined through a 5-fold cross-validation method.
The variable importance from the SHAP analysis revealed that flight distance was the most influential factor for all runner's results, followed by spray angle and vertical exit velocity (Figure 2). The contribution of flight distance was lower in predicting tag outs than predicting stays and sacrifice flies. Figure 3 showed examples of predictions made by the XGB model for two different batted balls (Example A and Example B) to identify variables that drove a prediction and the contribution of each variable to a prediction through the SHAP analysis. The model correctly predicted that Example A would result in the runner on third base staying, while Example B would result in a sacrifice fly. In Example A, the flight distance, arm strength, and spray angle contributed to an increase in p(stay), while the sprint speed and vertical exit velocity had a negative contribution, making the stay less likely (Figure 3(a)). In Example B, the sprint speed and arm strength increased p(sacrifice), whereas the ballpark, flight distance, spray angle, and vertical exit velocity decreased p(sacrifice) (Figure 3(b)).
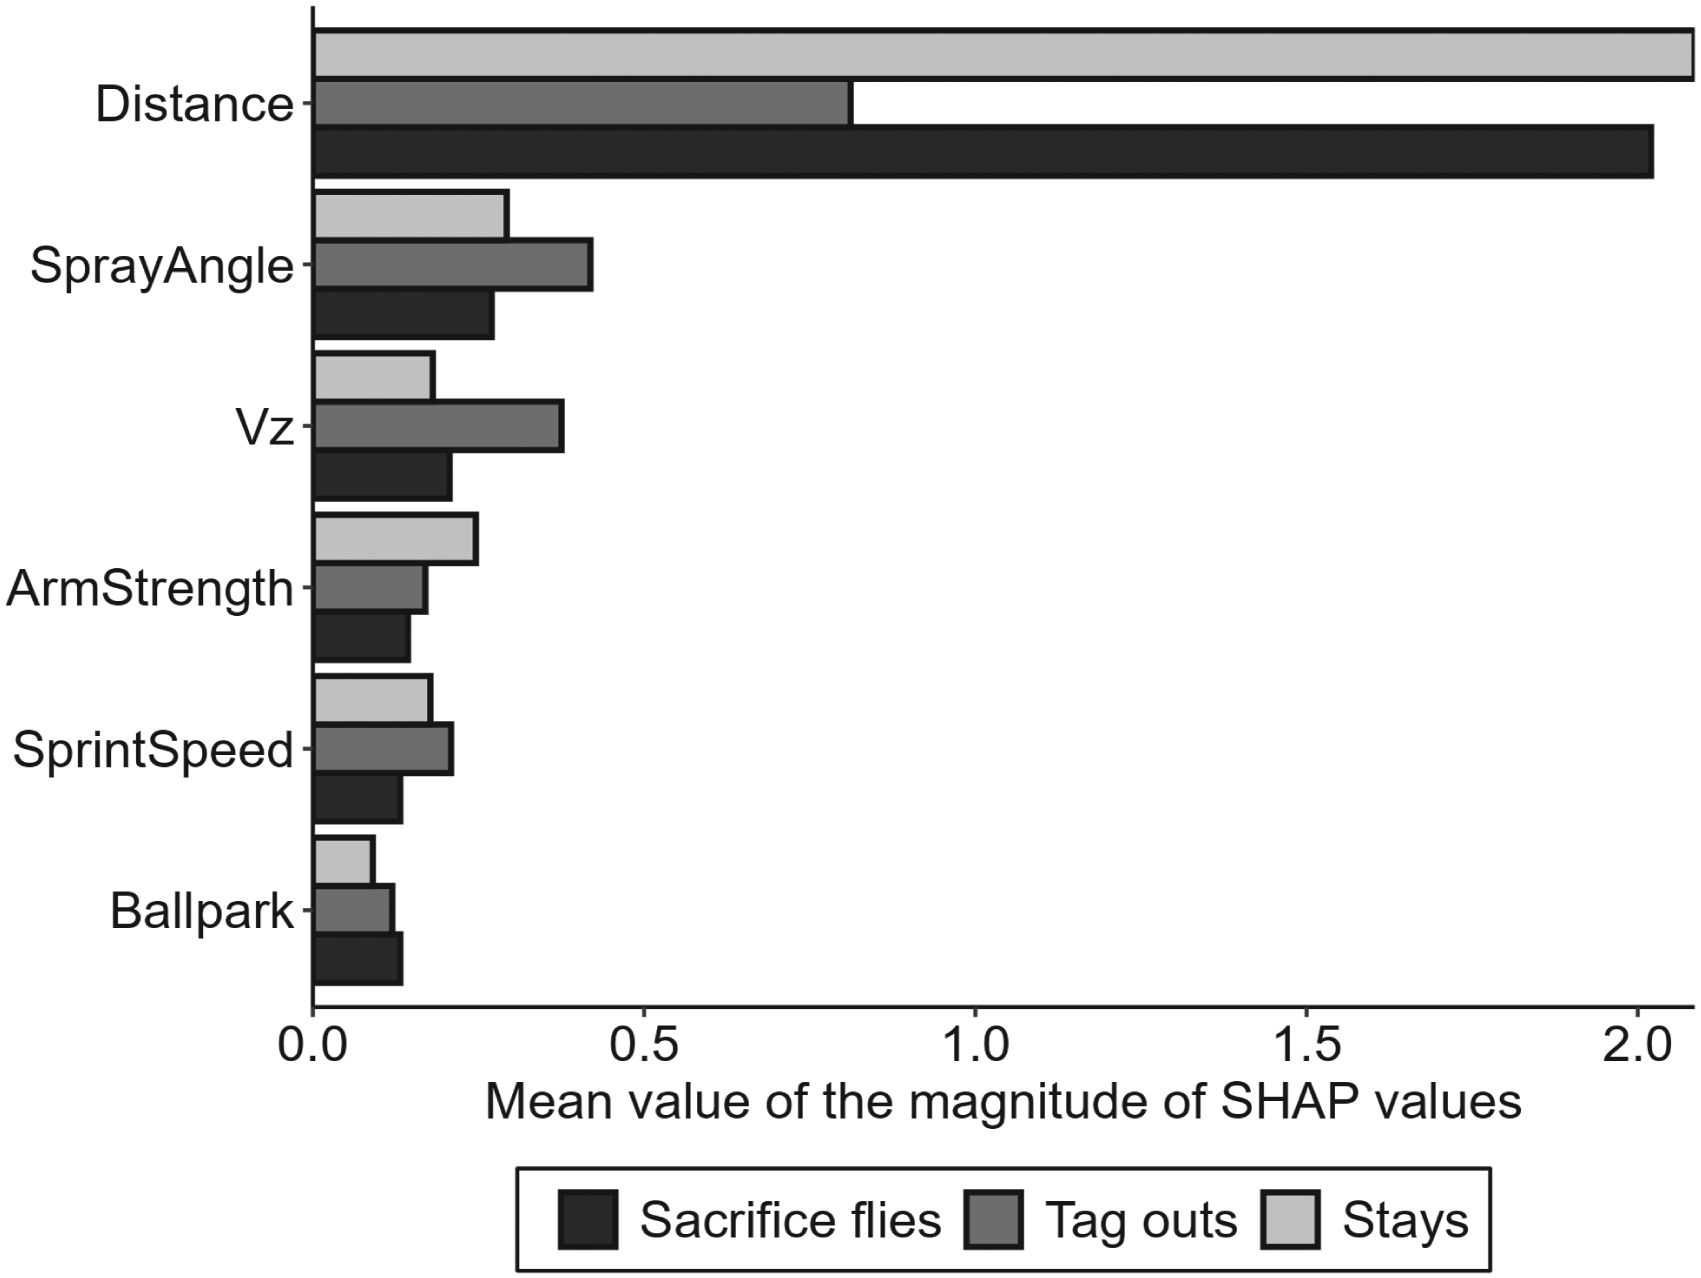
Variable importance plots of the model based on SHAP values, showing the average impact of each variable on the model's predictions across all batted balls for each runner's result. Vz indicates the vertical exit velocity.
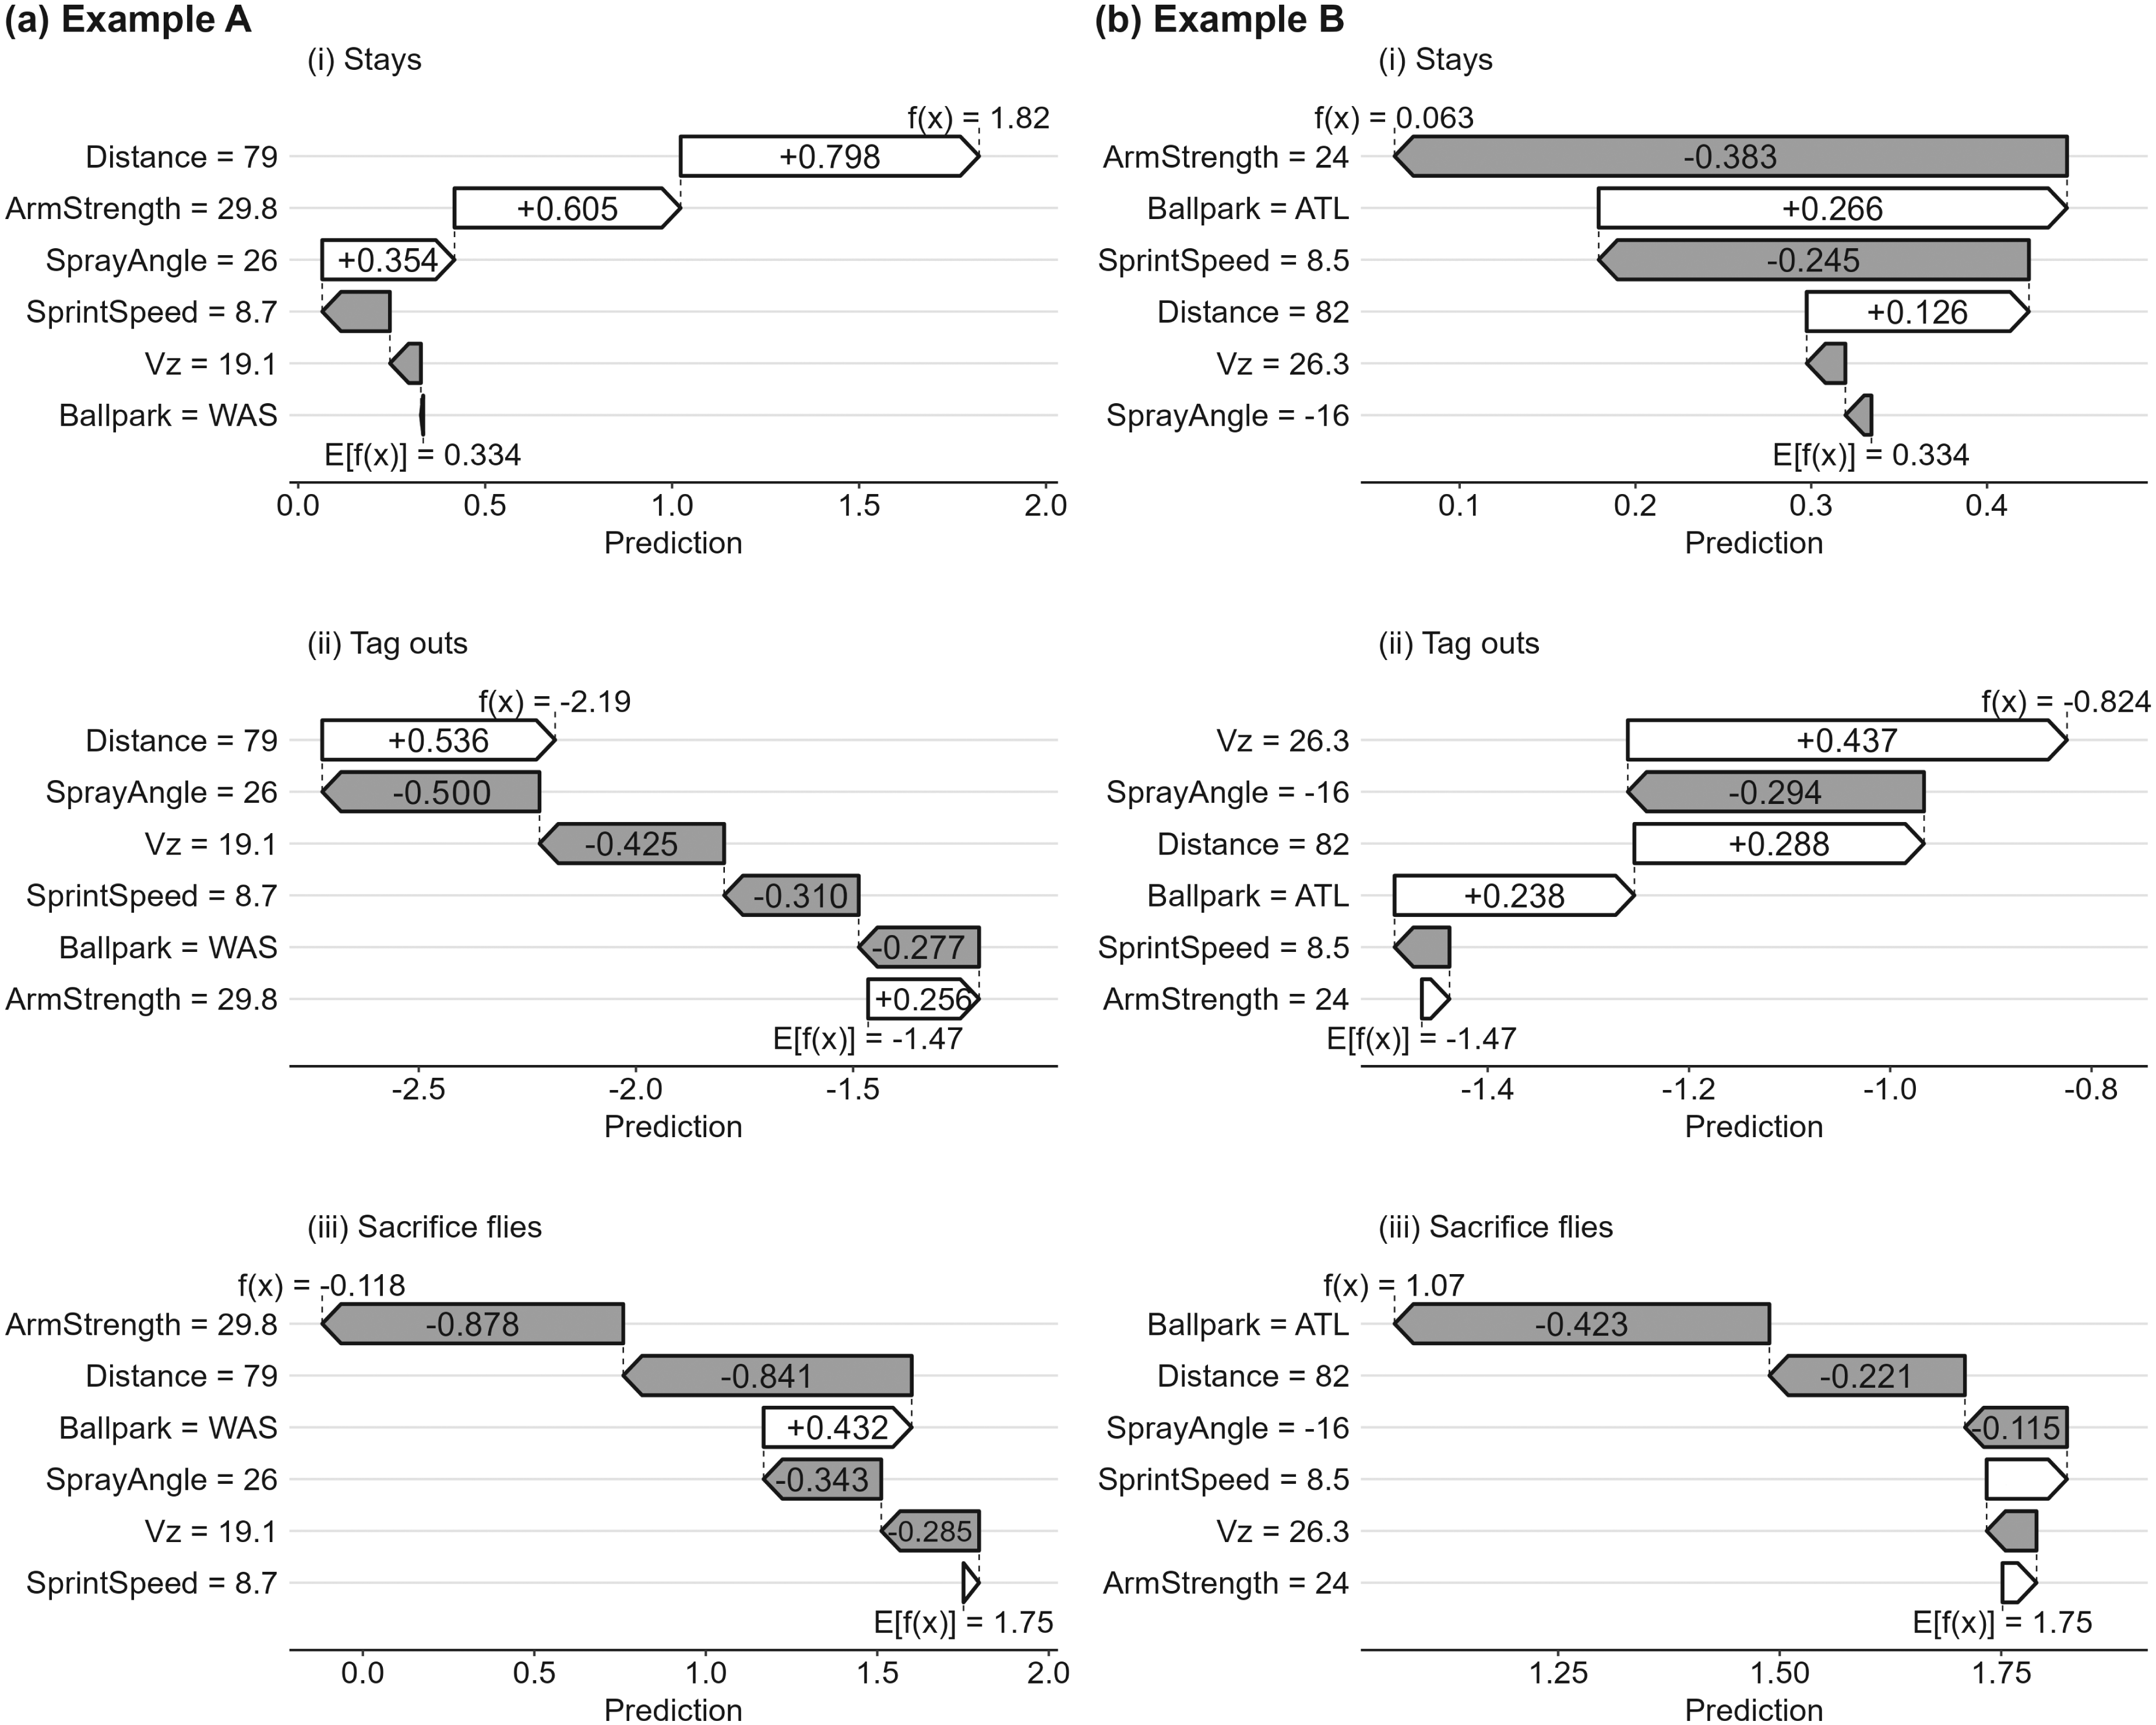
SHAP waterfall plot visualizing variable contributions to predicting (i) stays, (ii) tag outs, and (iii) sacrifice flies for two different samples. Each plot provides a detailed breakdown of how each variable influences a single prediction, starting from the expected SHAP value (E[f(x)]) to the final model output (f(x)). The expected SHAP value represents the model's mean probability for each runner's result if no variable was available for the current output (Lundberg and Lee, 2017). SHAP values for each variable are shown on bars, in which positive contributions increase the prediction value whereas negative contributions decrease it.
The simulation results showed that for the distance range of 70–85 m in fair territory, in which the runner's sprinting abilities might influence the strategic decision, p(sacrifice) in LF, CF, and RF were on average 1.4 times and 1.2 times higher for the runners with a speed of 8.7 m/s than for those with speeds of 8.1 m/s and 8.4 m/s, respectively (Figure 4(a)). In addition, runners with a speed of 8.7 m/s would successfully score on a sacrifice fly with an approximately 2-m shorter flight distance compared with those with lower sprint speeds. For example, when a flyout reaches 78 m, runners with a higher sprint speed would create opportunities for sacrifice flies across the field, whereas others would not. Meanwhile, opposing fielders with lower arm strength (26.0 and 26.7 m/s) showed 1.2–1.4 times higher p(sacrifice) than their counterparts with higher arm strength (27.5 m/s; Figure 4(b)). The flight distance showing a p(sacrifice) value of 0.5 differs across LF, CF, and RF as well as arm strengths. When a fly ball reaches 78 m in RF and LF, the runners would have a chance to score on a sacrifice, but runners may need to stay on third base for balls hit this distance to CF.
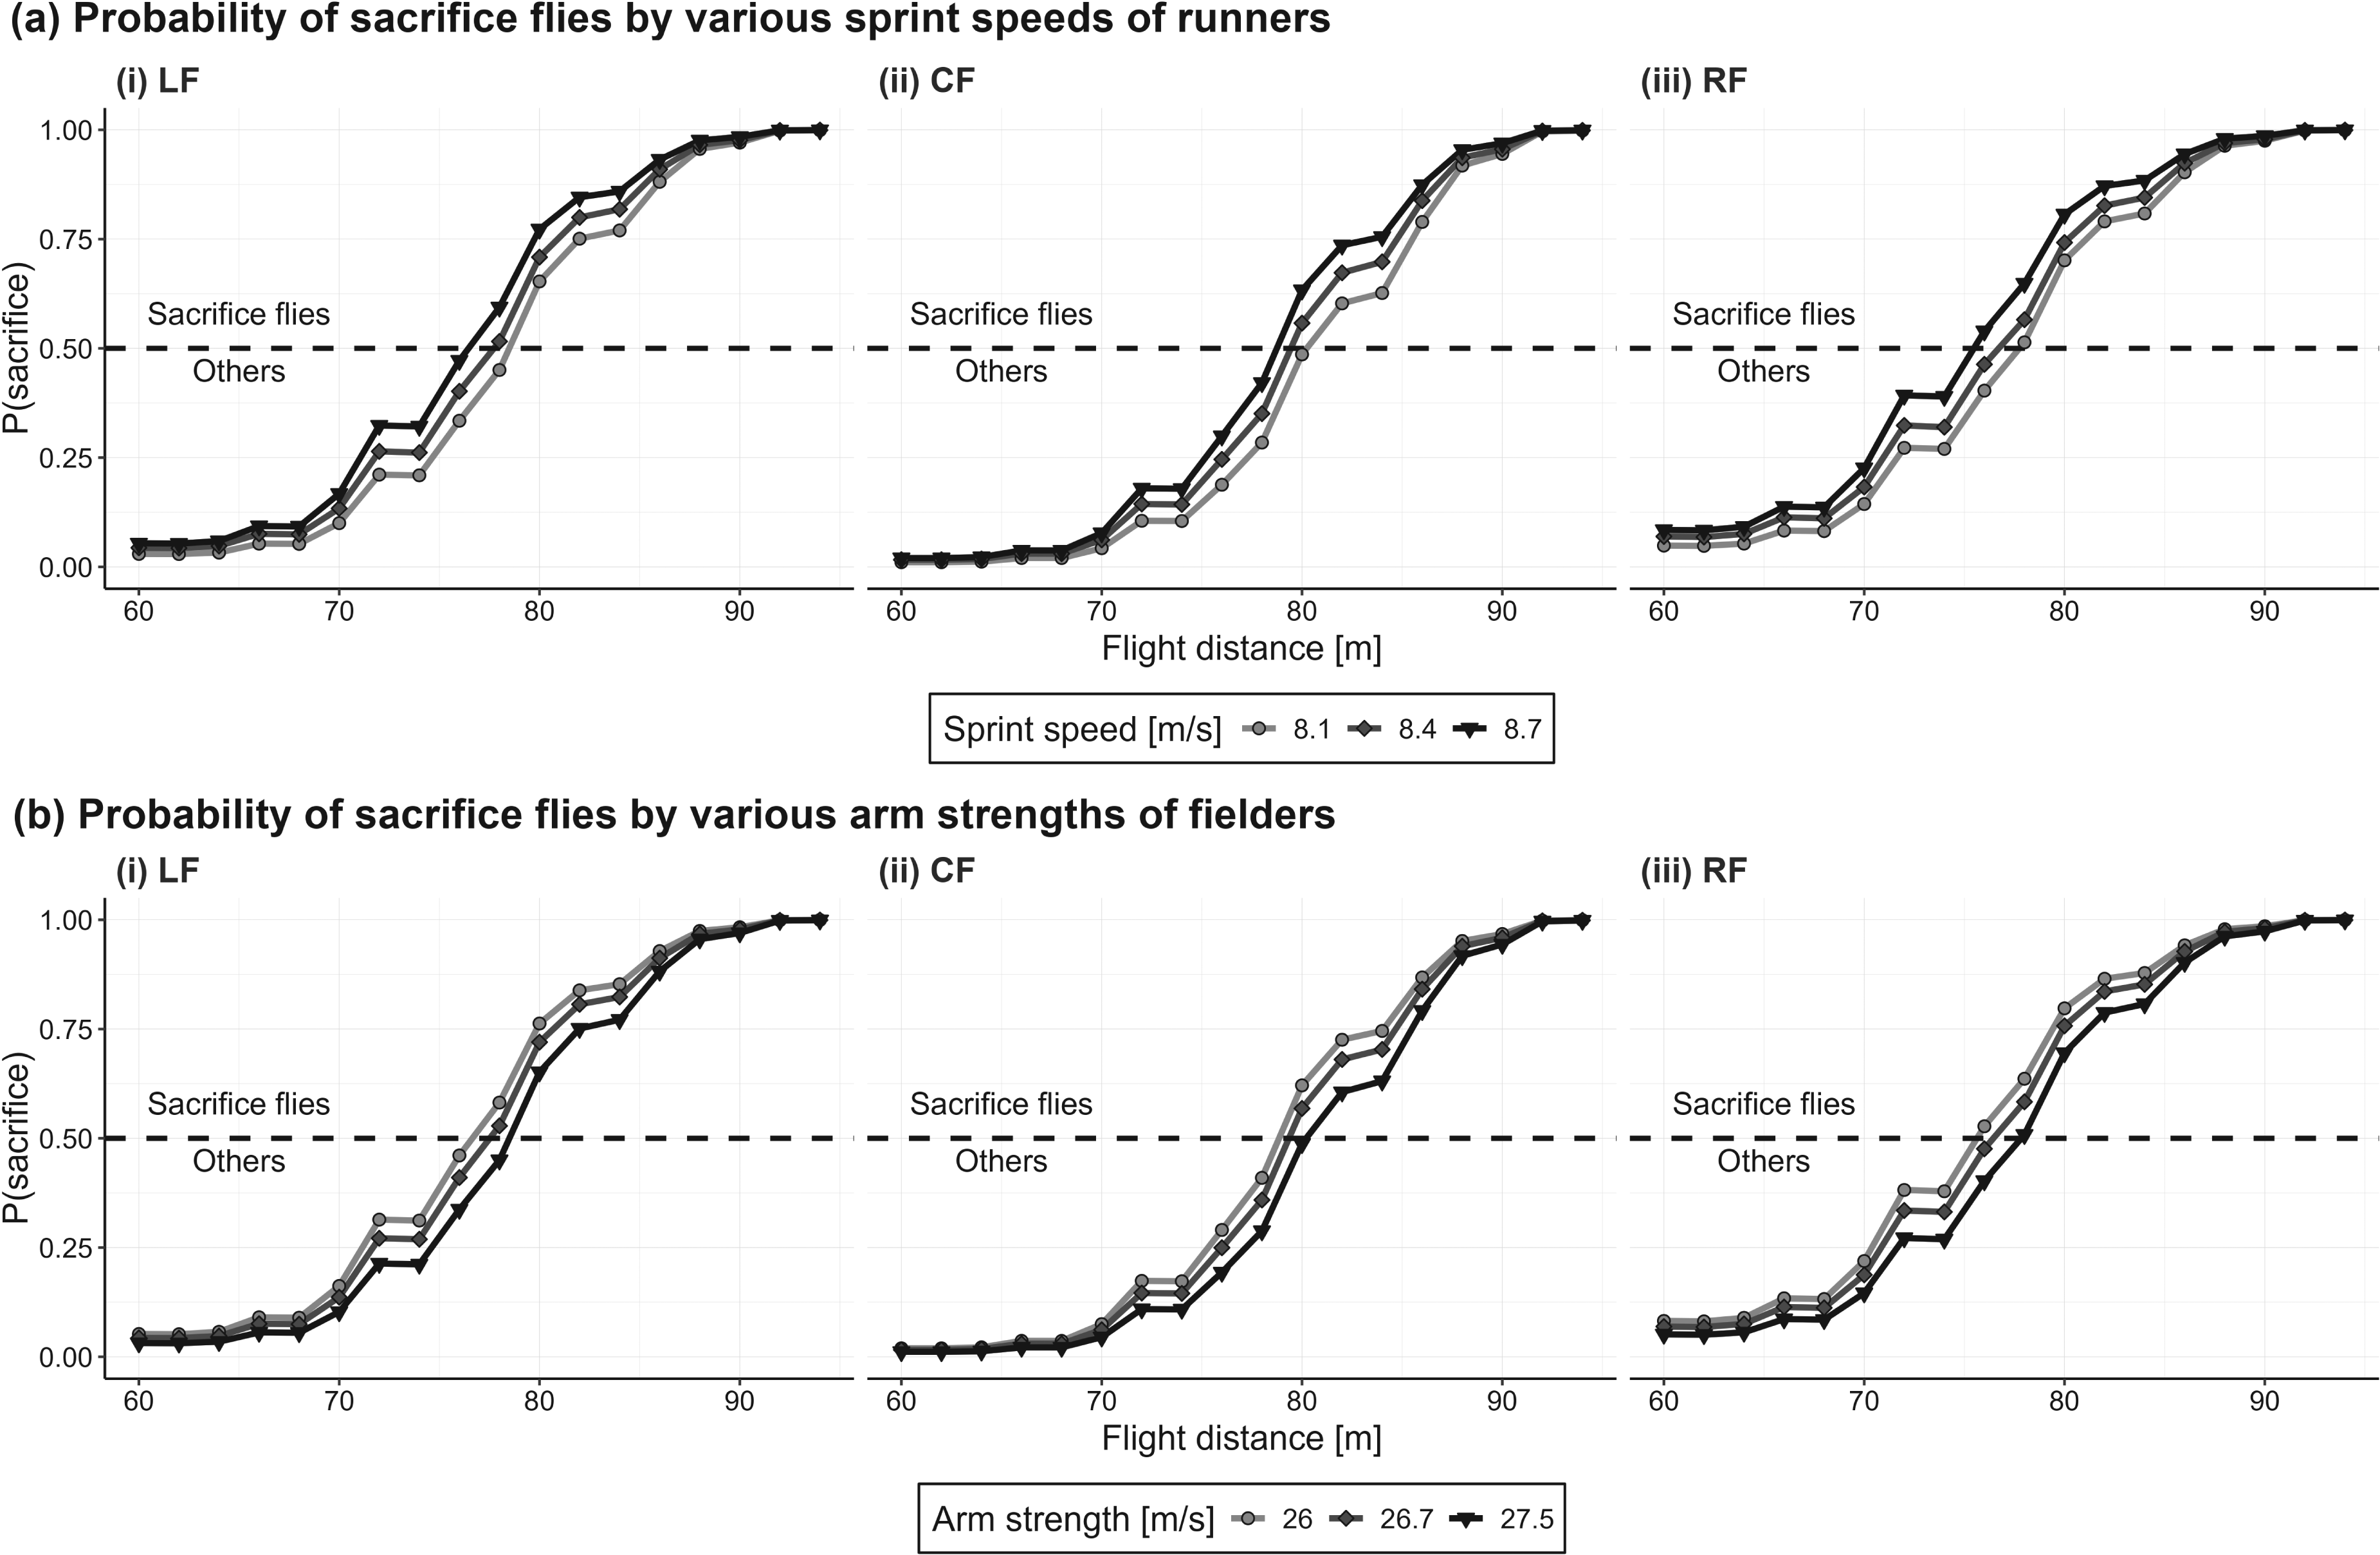
Average p(sacrifice) values for various flight distances when systematically varying the inputs of (a) the runner's sprint speed and (b) the fielder's arm strength while holding the other factor constant.
Discussion
This study aimed to describe batted ball kinematics for scoring in situations in which a runner is on third base with <2 outs and to examine factors that influence the success of sacrifice flies in MLB games. The results of the descriptive analysis showed that (i) hitting fly balls resulted in a higher ratio of base hits and runs compared with hitting ground balls in this particular game situation; (ii) nearly all flyouts (≥93%) reaching <70 m from home plate in fair territory resulted in the runners staying on third base; and (iii) ≥ 98% of the runners’ advances resulted in sacrifice flies when the flyouts reached ≥85 m in fair territory. Furthermore, the results of simulations showed that (iv) the model accurately predicted the runner staying on third base and the success of sacrifice flies (F-score ≥ 0.842), but could not predict whether the runner would be tagged out from the variables examined in the present study (0.057); (v) the flight distance was the most influential factor in model construction; and (vi) runners with a higher sprint speed (8.7 m/s) would score on a sacrifice fly with a 2-m shorter flight distance when compared to their slower counterparts (≤8.4 m/s), particularly evident when the fly ball reached approximately 80 m. These findings will help players and coaches make strategic decisions and increase the chance of scoring and achieving sacrifice flies.
The results of our analysis showed that BABIP was higher for fly balls (60%) than for ground balls (31%). In addition, the ratio of scoring plays to total batted balls was also higher for fly balls (75%) than for ground balls (65%) in the scoring opportunities. These results suggest that, to increase the chance of base hits as well as runs in this situation, hitting fly balls is advantageous over ground balls. This result aligns with previous reports featured in books and media of baseball (Lindbergh and Sawchik, 2019; Sawchik, 2017), showing the overall advantage of hitting fly balls over ground balls in MLB. Based on the previous reports and findings in the present study, the advantage of hitting fly balls over ground balls may be applicable in the specific game situation considered here in MLB.
The results in this study revealed that 97% of runners’ attempts resulted in sacrifice flies when flyouts reached >50 m. The high success rate might be attributable to several factors, such as conservative play by offensive teams. The offensive teams might have the runner advance only when they have a very high degree of confidence, thereby favoring conservative play and relying on a subsequent batter to make a base hit. The susceptibility of long-distance throws by fielders to external variables such as wind speed, field conditions, and the pressure of game situations might be another factor in the high success rate of sacrifice flies. Fielders might consider the risk of giving up additional runs if there is an error or the throw takes a bad hop, thereby favoring conservative defensive strategies over aggressive attempts at throwing out the runner. These offensive and defensive strategic decisions might increase the probability of sacrifice flies and also reduce the risk of tag outs at home plate.
The feature importance based on the mean SHAP values showed the importance of batted ball kinematics in model construction. The flight distance was the most influential factor in model construction, followed by the spray angle. The influence of the spray angle on the success of sacrifice flies might be attributable to the difficulties of fielding fly balls in foul territory, particularly plays made at or near the wall, compared to plays in fair territory. Tracking and catching a ball while considering the shape of the ballpark and distance from the wall might be challenging for fielders, especially on the visiting team, since field dimensions vary substantially across MLB ballparks (Monagan, 2014). The flight distance of flyouts necessary for sacrifice flies was higher in fair territory than foul territory across all flight distance ranges, so the spray angle of flyouts and corresponding fielder's plays should be taken into consideration when the runner decides whether to advance to home plate.
The simulation results showed that the runners with a speed of 8.7 m/s would score on a sacrifice fly with a shorter flight distance in comparison to those with lower sprint speeds. This advantage of runners with a higher sprint speed seems to be theoretically reasonable because the elapsed time to the instant that the runner reaches home plate should be less than 4.0 s (MLB Advanced Media, no date b). To estimate the shortest flight distance necessary for sacrifice flies with various values of runners’ sprint speeds and fielders’ arm strength, a simplified linear function was constructed based on the simulation outputs, as described in the materials and methods section: fly balls comprising 19 spray angles (−45° to 45° at 5° intervals), 18 flight distances (60 to 94 at 2-m intervals), and the average values of the vertical exit velocity corresponding to the flight distance as well as 5 sprint speeds (7 to 9 m/s at 0.5-m intervals), 6 arm strengths (25 to 27.5 m/s at 0.5-m intervals), and 30 ballpark identifiers were systematically constructed. These were entered into the XGB model to estimate p(sacrifice). Since p(sacrifice) tends to increase with flight distance (Figure 4), the shortest flight distance at which p(sacrifice) exceeds 0.5 was identified for each combination of arm strength and sprint speed. The result showed the estimated shortest flight distance, ranging from 76 to 84 m across various arm strengths and sprint speeds (Figure 5). A multiple linear regression analysis was then conducted to express the relation of the sprint speed and arm strength with the shortest flight distance. As a result, the following simplified linear function was constructed with the simulation outputs: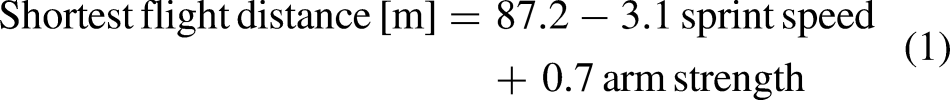
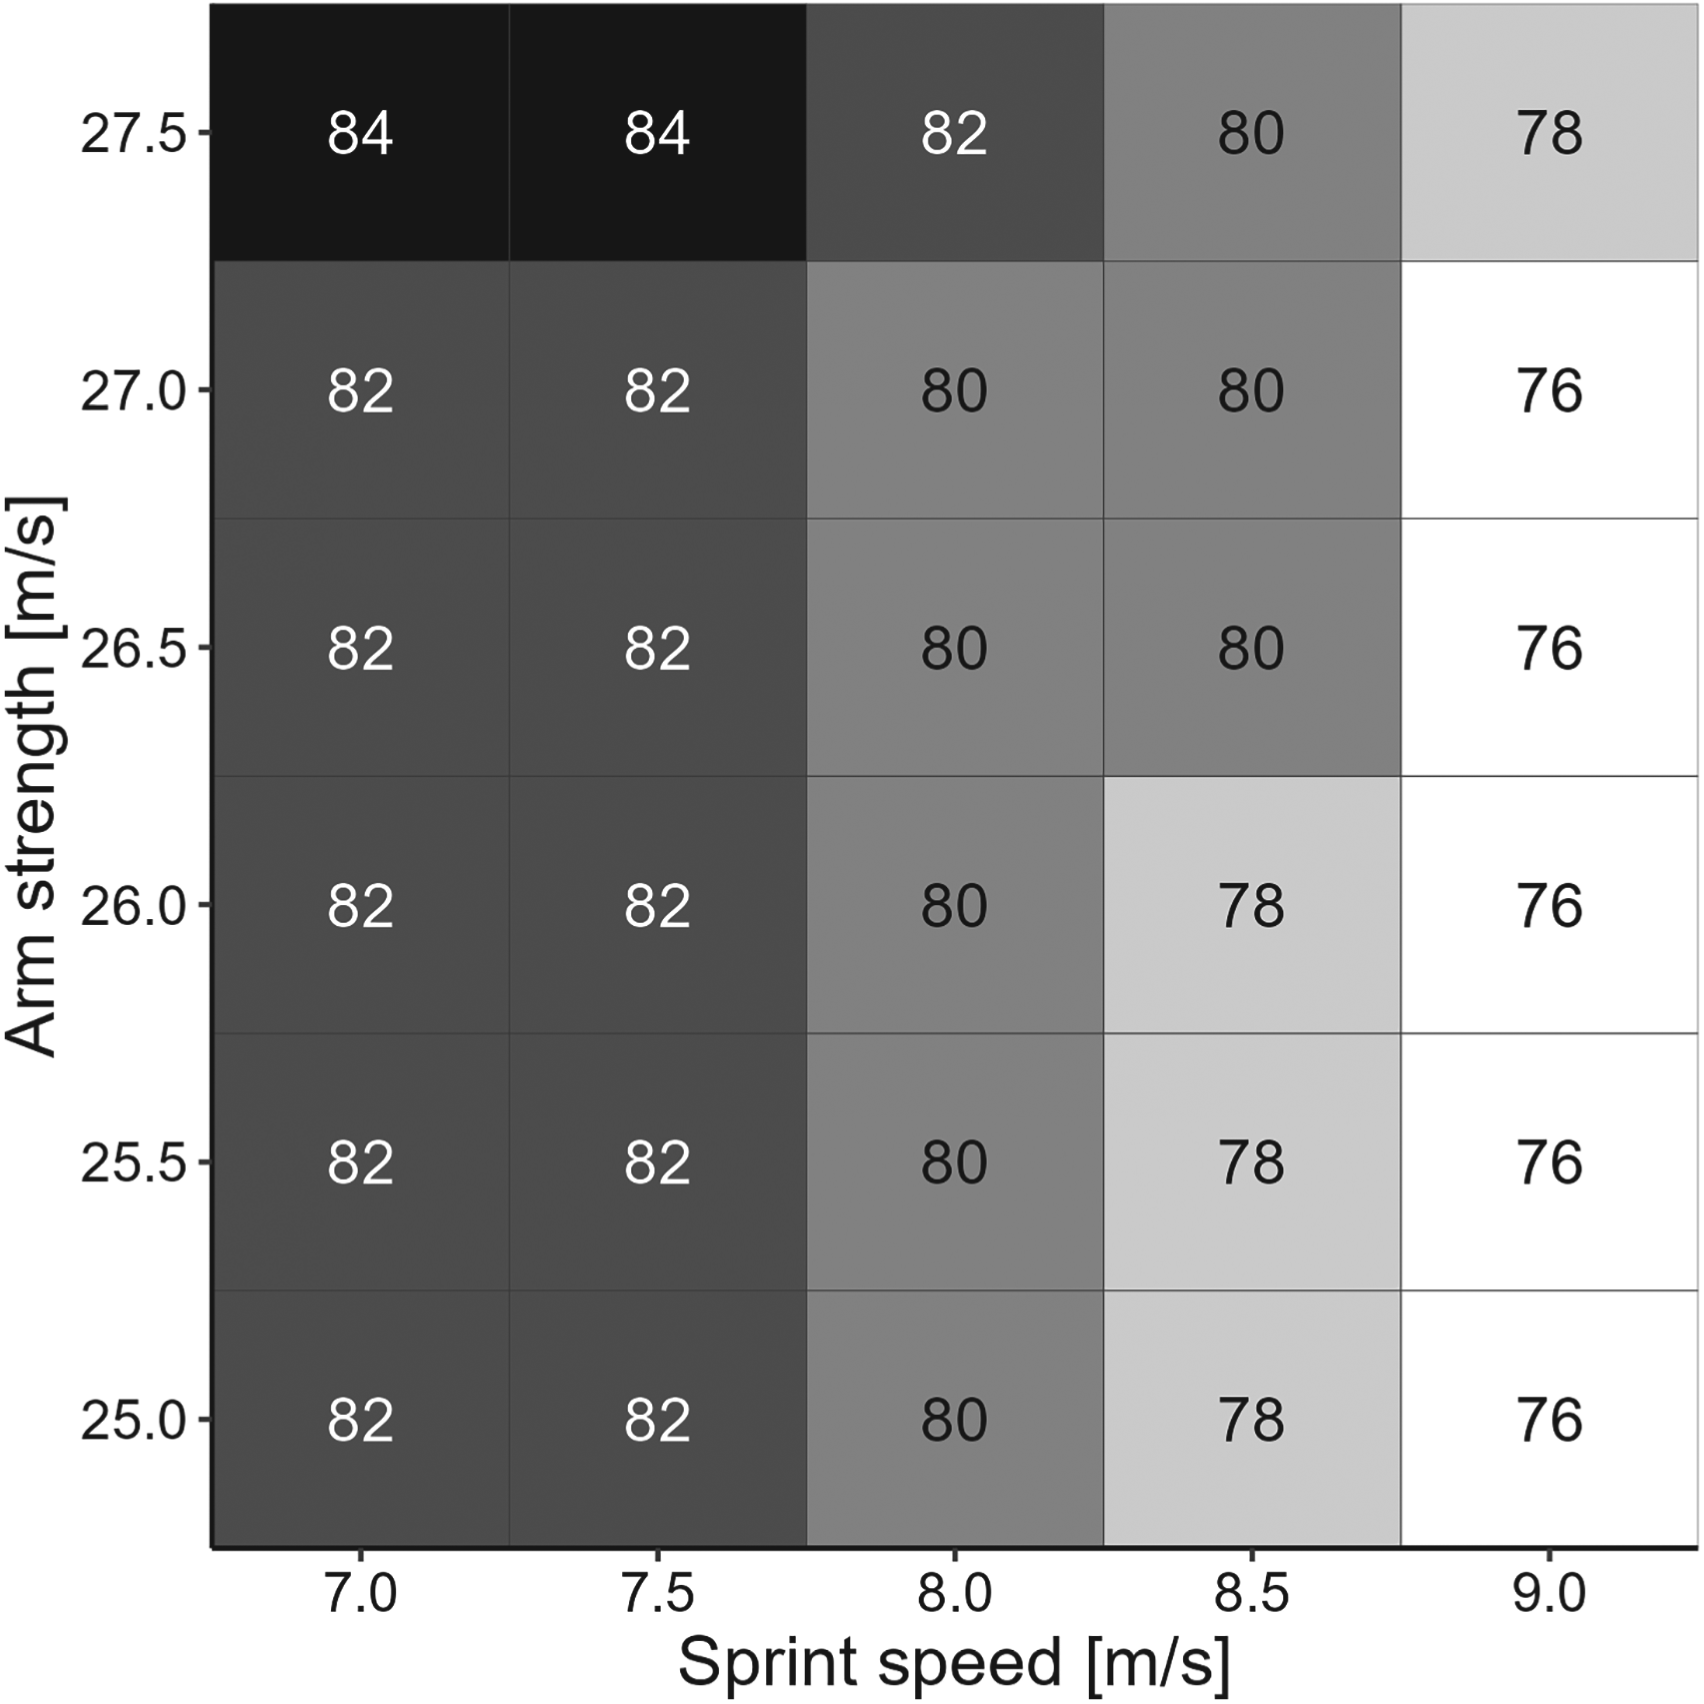
Estimated shortest flight distance required for sacrifice flies for a given combination of runner's sprint speed and fielder's arm strength.
In other words, the coefficients of the equation indicate that an increase of 1 m/s in the runner's sprint speed would reduce the distance necessary for sacrifice flies by 3.1 m (95% confidence interval (CI): −3.5 to −2.6), whereas an increase of 1 m/s in the fielder's arm strength would increase the distance by 0.7 m (95% CI: 0.3–1.1), holding the other variable constant (Table 3). These coefficients of the function will be helpful for players and coaches to set targets for better decision-making and greater success of sacrifice flies. Even for flyouts with a flight distance shorter than 85 m from home plate, in which the runner's attempts might not result in a sacrifice fly, runners should consider whether to advance based on their sprinting ability, visual cues of the batted ball kinematics, and the fielder's throwing ability.
Multiple linear regression analysis evaluating the relation of the spring speed and arm strength with the shortest flight distance for the success of sacrifice flies.
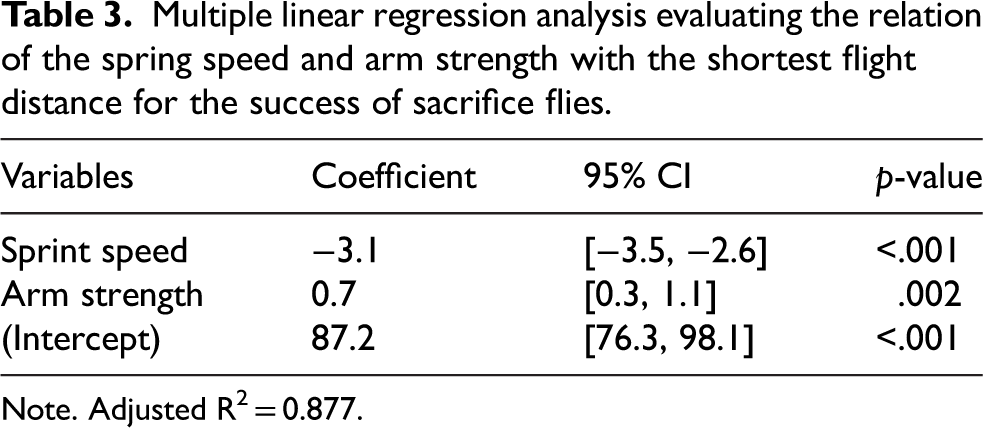
Note. Adjusted R2 = 0.877.
In the present study, the predicted probabilities were estimated based on all MLB game data that met specific inclusion criteria; thus, the probability score will offer an expected result for corresponding game situations in MLB games. In addition, evaluating the differences between actual and predicted results can provide valuable insights into factors causing the differences and can quantify the estimated positive/negative contributions of fielders for each play. We suggest that analyzing false predictions may reveal deficiencies or proficiencies in fielders’ performances and opportunities for further increases in the success of sacrifice flies. For example, a false prediction in which the model fails to predict the actual result of sacrifice flies, referred to as an “unpredicted sacrifice”, might indicate good decision-making by runners and coaches in the given game situation, whereas false prediction of sacrifice flies when the runner stayed on third base might indicate loss of a scoring opportunity. Here it is essential to acknowledge that the choice of model algorithm might have introduced bias into the distribution of false predictions, thereby affecting the results and their implications. To validate our findings and interpretations, we reconstructed predictive models using alternative algorithms, namely MLR, SVM, and RF algorithms and compared the distributions of false predictions between the XGB model and the other algorithms. The results showed that 67% of the false predictions made by the XGB model were also incorrectly predicted by all other models, whereas 1% of the false predictions were unique to the XGB model. This suggests that the false predictions from the XGB model were not solely due to the algorithm itself. Additionally, we reviewed game footage available in the MLB database (https://baseballsavant.mlb.com/statcast_search). Video analysis identified factors contributing to unpredicted sacrifices, such as inaccurate long-distance throws by outfielders and late throws caused by diving catches or backward catches by infielders, in which differences could be attributable to the defensive positioning of fielders for each play. In addition, factors related to the fielder's performance (e.g., quick and highly accurate long throws) were also identified as contributing to the unpredicted tag outs. These results support the validity of analyzing the false predictions when evaluating the decision-making and performance of runners and coaches as well as fielders in the present study.
The results of this study showed that the model accurately predicted the runner staying on third and sacrifice flies, whereas it could not predict the runner getting tagged out from the variables considered in the present study. The lower predictive performance in predicting tag outs might be attributable to the influence of confounding variables. Outstanding defensive plays, such as running up to the landing spot of a fly ball with the correct timing to add momentum to the subsequent throw, and quickly and accurately throwing a high-velocity, long-distance ball to the catcher at home plate, increase the chance of tag outs and cause inaccuracies in predicting tag outs from the given variables in the present study. Additionally, the sprint speed metric does not capture variations in ability across individual plays, so taking longer to reach home plate for reasons such as hesitation to advance to home plate, poor physical condition, or fatigue would potentially lead to inaccuracies in predictions. Player's abilities become especially critical in determining results with narrow margins, such as the success of sacrifice flies when the runner attempts to advance. These findings suggest the need for more granular, play-by-play data on runner's and fielder's performance to improve the accuracy of the predictive model.
Footnotes
Funding
The authors received no financial support for the research, authorship, and/or publication of this article.
Declaration of conflicting interests
The authors declared no potential conflicts of interest with respect to the research, authorship, and/or publication of this article.