
Abstract
Background and Objective:
Women carrying pathogenic DMD gene variants can develop muscle affection, such as muscle weakness and fat replacement. The long-term progression of the muscle involvement is unknown. This study investigates the 6.5-year changes in muscle function and -fat fraction in women carrying pathogenic DMD gene variants to enhance understanding of disease progression and its natural history.
Methods:
Muscle structure and -function were investigated at baseline and after 6.5 years in 34 women carrying pathogenic DMD gene variants (19 predicted to confer Duchenne Muscular Dystrophy (DMD), 15 Becker Muscular Dystrophy (BMD)). After a clinical evaluation, muscle fat fraction was assessed using Dixon MRI, muscle strength with isokinetic dynamometry, and muscle biomarkers with blood samples for creatine kinase and myoglobin.
Results:
Muscle fat fraction in the lower back, thigh, and calf increased significantly over 6.5 years. The average increases were generally less than 2%, but some carriers with significant baseline abnormalities experienced a more substantial increase in fat fraction, reaching as high as 31%. Although overall disease progression did not differ significantly between DMD and BMD carriers, all women who showed rapid progression were DMD carriers. Small but significant changes occurred in muscle strength and biomarkers.
Discussion:
The progression of muscle involvement in women carrying pathogenic DMD gene variants is generally slow. However, those with severe baseline abnormalities on MRI—often associated with a lower age of symptom onset—experience a more rapid progression of muscle fat fraction, suggesting that baseline MRI findings could help predict future disease progression in this population.
Introduction
Duchenne Muscular Dystrophy (DMD; OMIM #310200) and the milder Becker Muscular Dystrophy (BMD; OMIM #300376) are X-linked recessive allelic disorders caused by pathogenic variants in the dystrophin (DMD) gene. 1
The DMD gene encodes dystrophin, a protein essential for stabilizing muscle fibers during contraction by linking the cytoskeleton to the extracellular matrix. 2 Loss or reduction of dystrophin initiates cycles of muscle fiber necrosis and regeneration, accompanied by inflammation. As the regenerative capacity becomes exhausted, muscle fibers are progressively replaced by fat and fibrous tissue, ultimately leading to muscle weakness.3,4
In later stages, progressive weakness of the diaphragm and intercostal muscles causes respiratory decline, and dystrophin deficiency in cardiac muscle leads to myocardial degeneration and fibrosis with consequent cardiomyopathy—both critical complications of dystrophinopathy. 5
Although these disorders primarily affect men, women carrying pathogenic DMD gene variants can also develop symptoms such as muscle weakness, cardiomyopathy, and cognitive impairment.6,7
The severity varies widely,8,9 and may be influenced by factors such as X-chromosome inactivation patterns and genetic modifiers.10,11
The prevalence of muscle and heart involvement ranges widely from 2.5% to 81%12–14 for muscle involvement and 7% to 84.3% for cardiac involvement.7,8,15,16
This variability is due to differences in method, diagnostic criteria, and demographics. Genetic testing is key to identifying carriers, but it was not performed in the early study. Furthermore, skeletal involvement was measured using different techniques such as MRC grading, dynamometry, or MRI (detecting even subclinical changes), and cardiac involvement by echocardiography, ECG/Holter/scintigraphy, or CMR.
The long-term changes in muscle involvement over time are unknown. No study has comprehensively tracked muscle progression in women carrying DMD gene variants. Long-term follow-up is essential for identifying early functional decline and structural muscle changes, which could enable timely interventions, improve clinical outcomes, and pave the way for better predicting disease prognosis for carriers, whether symptomatic or not.
This study aims to track changes in muscle structure and -function over 6.5 years to provide novel insights into the progression of muscle involvement in women carrying pathogenic DMD gene variants.
Methods
Ethical approval
The study was approved by the Danish National Committee on Health Research Ethics (H-23007727) and was registered on Clinicaltrials.gov (Identifier: NCT05715957). The study was conducted in accordance with the Declaration of Helsinki, and all participants provided written informed consent.
Study design and participants
The study was initiated as a cross-sectional study in 2016, with 53 women carrying pathogenic DMD gene variants participating; 6.5 years later, they were asked to participate again for a follow-up visit. Carriers were identified through familial relationship to a genetically confirmed man or because they were followed in the clinic already. Pathogenic/likely pathogenic DMD variants were determined in accredited clinical laboratories using multiplex ligation-dependent probe amplification (MLPA) (copy-number) and next-generation sequencing with Sanger confirmation (sequence) and classified under ACMG/AMP criteria, and were reviewed by a clinical geneticist. Families were assigned to DMD or BMD by the clinical phenotype of affected men in the family; when uncertain, we consulted published reports and variant databases (HGMD, ClinVar, LOVD).
Participants underwent a medical history review, questionnaires, whole-body magnetic resonance imaging (MRI), and stationary isokinetic dynamometry. Two new outcome measures were added at the follow-up to better describe the phenotype: a six-minute walk test (6MWT) and forced vital capacity (FVC).
The inclusion criterion was participation in the previous cross-sectional study. 14 Exclusion criteria included contraindications for MRI (such as pacemakers or other implanted metal or magnetic devices), claustrophobia, and pregnancy.
Muscle MRI
We used a 3.0 T Siemens scanner (MAGNETOM Verio Tim System; Siemens AG, Erlangen, Germany) to perform a whole-body muscle MRI with T1-weighted and Dixon sequences.
Participants were positioned supine, headfirst, with a peripheral angiographic coil and a body matrix coil. The MRI protocol was the same as that used in the baseline study. 14
Using Horos™ V. 4.0 software, we manually outlined each muscle or muscle group. To ensure consistency, baseline and follow-up MRIs were displayed side-by-side during analysis, allowing for direct comparison of muscle outlines. Anatomical landmarks were used to ensure that the same slices were selected from baseline and follow-up scans.
One investigator (ZL) drew the initial muscle outlines, and a second investigator (NSP) independently reviewed them to ensure accuracy. Both investigators were blinded to the timing of the scans (follow-up vs. baseline).
We chose the fourth lumbar vertebra (L4), 50% of the femur length, and 33% of the tibia length to obtain the largest cross-sectional area (CSA) (Figure 1), along with the largest CSA for the adductor longus muscle and biceps caput breve muscle. At the L4 level, we outlined the multifidus and erector spinae. At the thigh level, we outlined the rectus femoris, vastus medialis, vastus lateralis, vastus intermedius, sartorius, adductor longus, adductor magnus, gracilis, semimembranosus, semitendinosus, biceps femoris, and biceps caput brevis muscles.
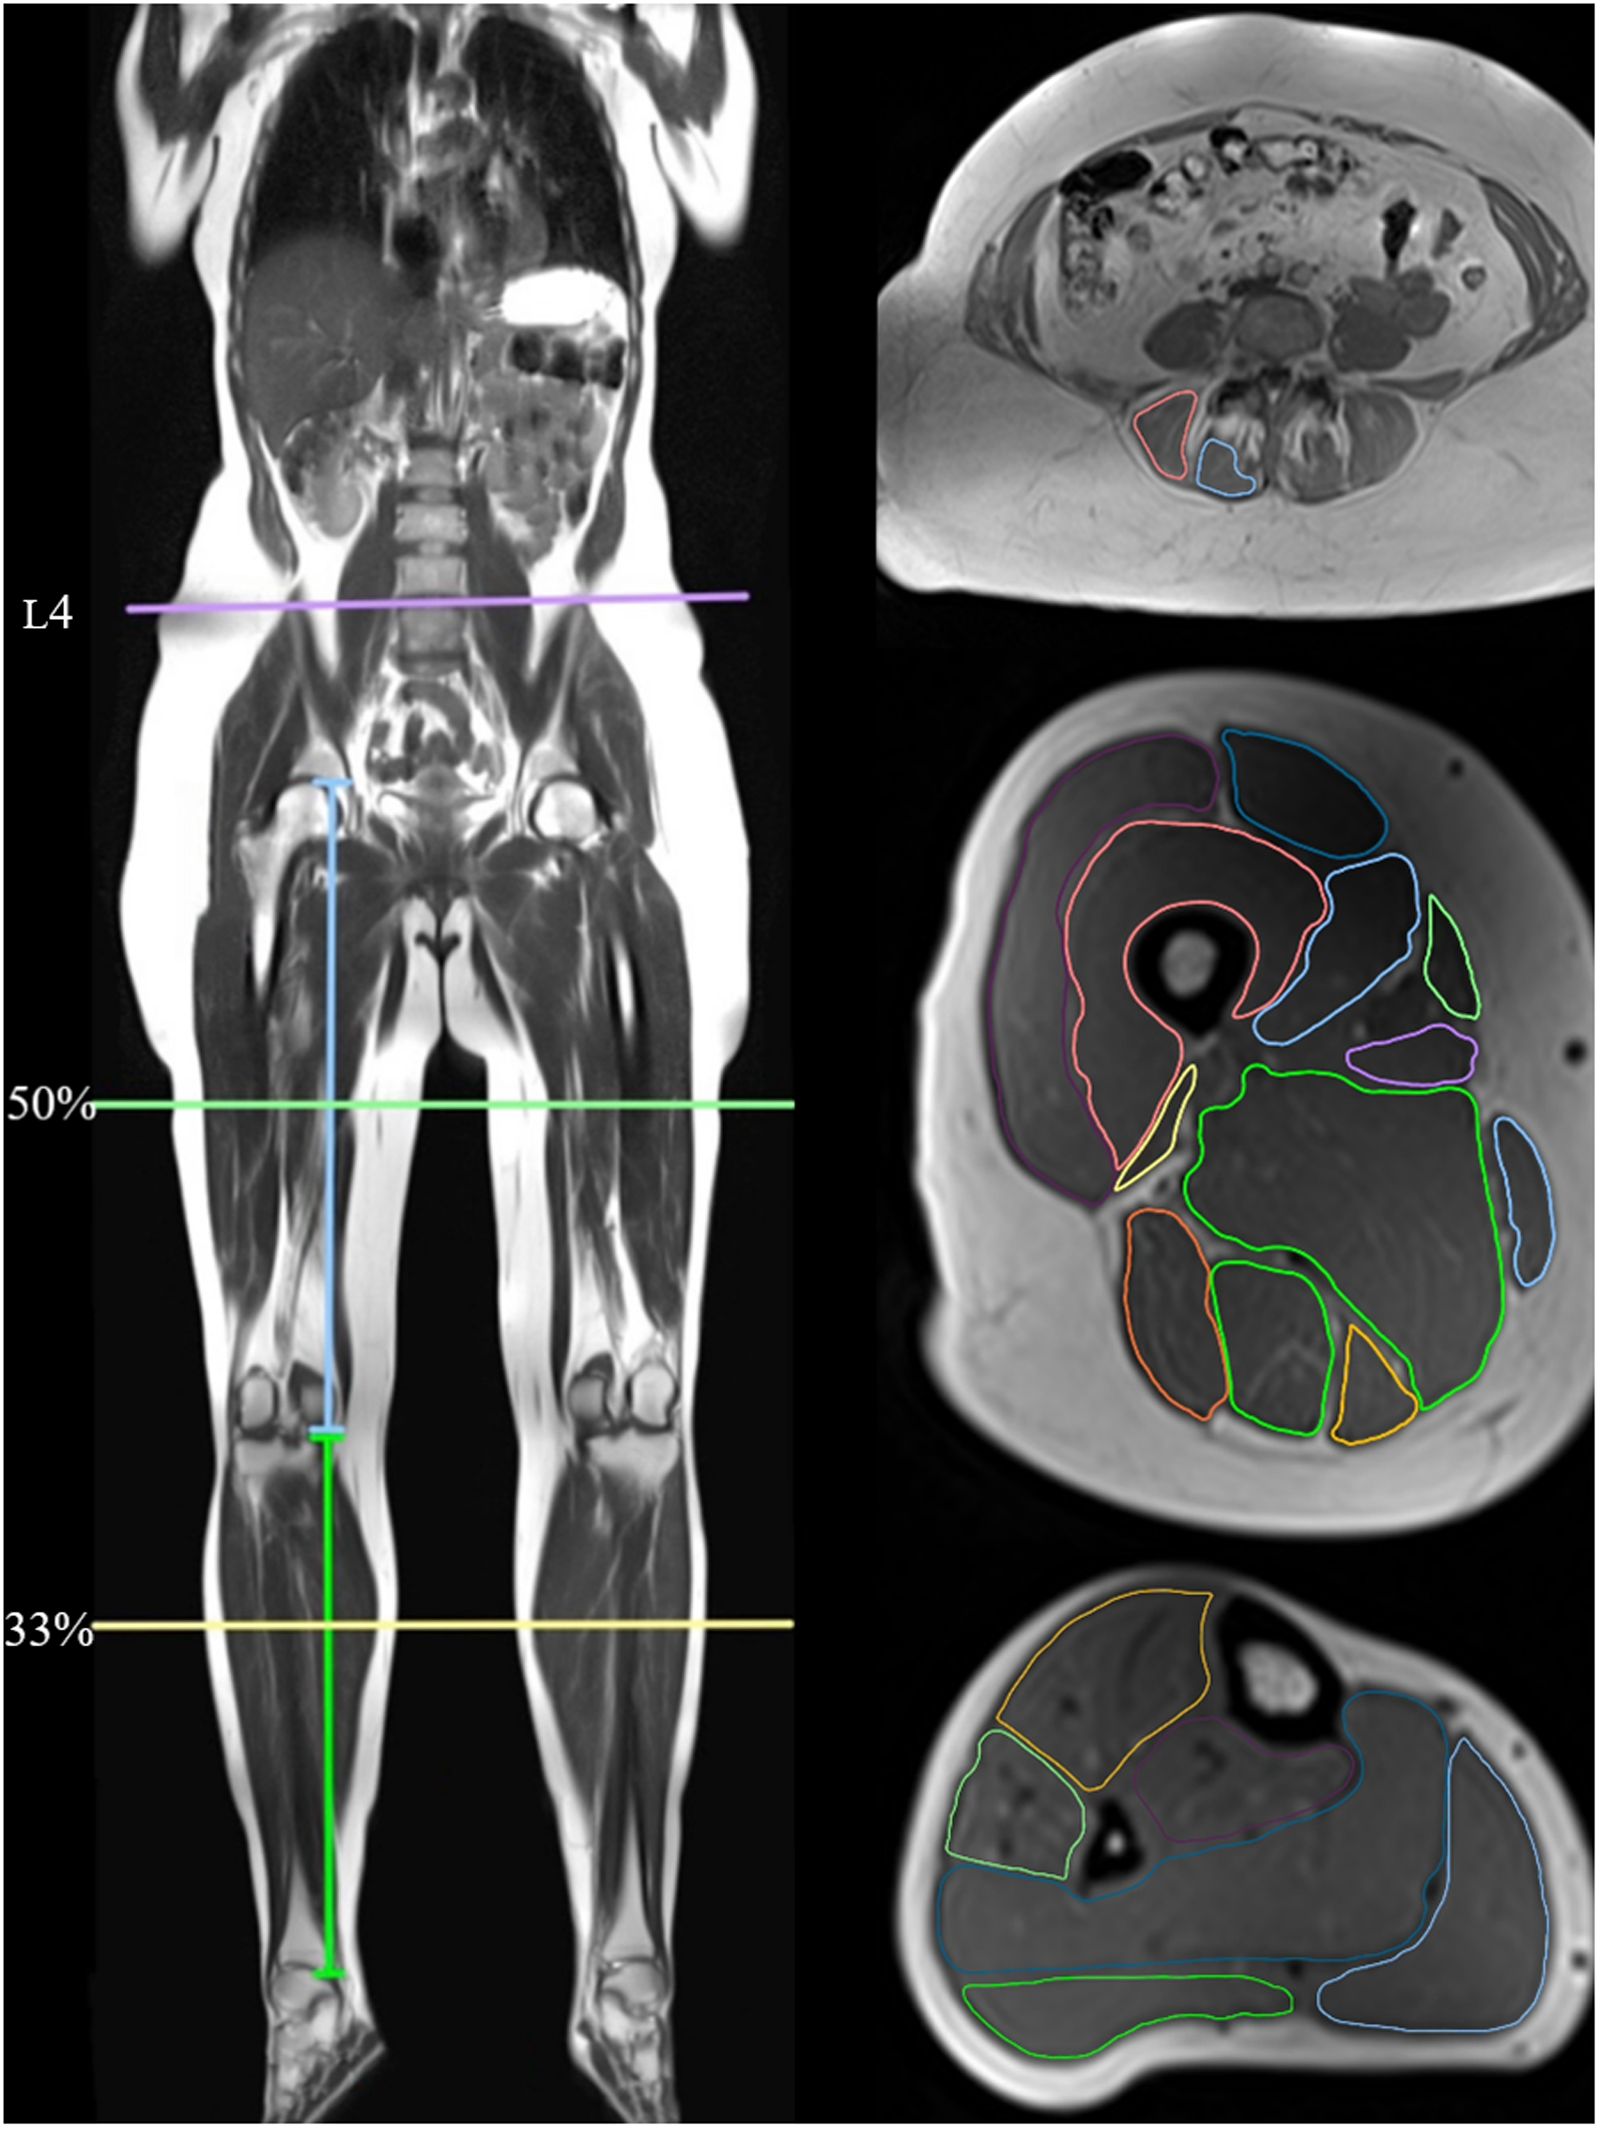
Magnetic resonance imaging locations of lower back and lower limb muscles.
At the calf level, we outlined the muscles of the anterior compartment (tibialis anterior, extensor hallucis longus, and extensor digitorum longus), peroneal group (peroneus brevis and peroneus longus), profundus group (flexor hallucis longus, flexor digitorum longus, and tibialis posterior muscles), and soleus, and the lateral and medial heads of the gastrocnemius muscles as individual muscles.
Muscle fat fraction (FF) was calculated using the formula: FF = (I fat / I in) * 100.
Muscle strength assessment
A stationary dynamometer (Biodex Medical System 4 PRO, NY, USA) was used to measure peak torque, representing maximal strength. The range of motion (ROM) during isokinetic tests was set wide to allow for maximal speed. Strength assessments of the right knee included isokinetic testing of knee flexion and -extension (ROM = 80°).
A standardized prerecorded voice provided instructions during each test. Each test consisted of eight repetitions per joint, with a 15-s rest interval between muscle contractions.
Medical history and physical assessment
The medical history assessment included questions about current symptoms, comorbid conditions, medications, and any changes since the last visit. All subjects completed self-administered questionnaires assessing pain severity, fatigue levels, and stair-climbing ability.
Pain severity was assessed at three anatomical sites—arms, lower back, and legs —using a visual analogue scale (VAS) ranging from 0 to 10, with higher scores indicating greater pain intensity.
Fatigue was measured using the Fatigue Severity Scale (FSS), a self-administered questionnaire, that included nine statements about fatigue. Each statement was rated on a 7-point Likert scale, with the total FSS score calculated as the average rating. A score ≥4 is indicative of fatigue. 17 This provided a measure of overall fatigue severity. Participants were also asked about their ability to walk stairs, with responses categorized on a 0 to 3 scale: 0) Unable to climb stairs; 1) Requires assistance (e.g., handrail); 2) Can climb stairs without handrail; 3) No impact on climbing stairs.
Participants underwent a 6MWT to assess the maximum distance they could walk on a flat, hard surface within 6 min, following American Thoracic Society (ATS) guidelines. 18 They walked back and forth along a 30-meter (m) marked corridor at their own pace. The total distance covered was recorded and compared to predicted values using a reference equation 19 : 6MWT (m) = (2.11 × height [cm]) − (2.29 × weight [kg]) − (5.78 × age [years]) + 667. FVC was assessed by spirometry (Vitalograph, Model 6300).
Statistical analyses
Statistical analysis was performed using GraphPad Prism 9 (GraphPad Software, San Diego, CA, USA).
Change over time in muscle FF across all muscles and change between the 6MWT and a reference material followed a normal distribution, and a paired t-test was conducted.
A log transformation (log(y)) was applied for variables deviating from normality. After transformation, the change over time in fatigue met the normality criteria, and a paired t-test was performed. Change over time in muscle biomarkers and muscle strength remained not normally distributed, and the Wilcoxon matched-pairs signed-rank test was used. The stair scale was also analyzed using the Wilcoxon signed-rank test.
The median difference and its bootstrapped 95% confidence interval (CI) were reported.
A t-test was used to compare differences in progression between carriers of DMD and BMD.
A heatmap was generated to visualize changes in each muscle. Statistical significance was set at P < 0.05.
Results
Participant characteristics
We invited all 53 carriers from the baseline study to participate in a follow-up assessment conducted after an average of 6.5 years (range 5.9 to 7.1 years).
Of the 53 carriers, 34 accepted the invitation, and 31 completed a follow-up MRI scan.
The remaining 19 carriers who did not participate in the follow-up study had the following reasons: two passed away (causes of death unavailable; both were DMD carriers, ages at death approximately 80 and 50 years), one was misdiagnosed, 12 declined participation (due to time constraints or personal reasons), and four were unreachable.
Baseline MRI analysis of the 19 carriers who declined showed that 11 had mild, 5 had moderate, and 3 had severe muscle FF levels.
The muscle FF in the thigh of participants who declined to participate was comparable to that of the included participants, with a similar average muscle FF of around 13%.
The 34 included participants had a mean age of 54 years (SD = 13) (Table 1). A variant associated with DMD was found in 19 participants and with BMD in 15 participants.
Characteristics of the women carrying pathogenic DMD gene variants at follow-up.
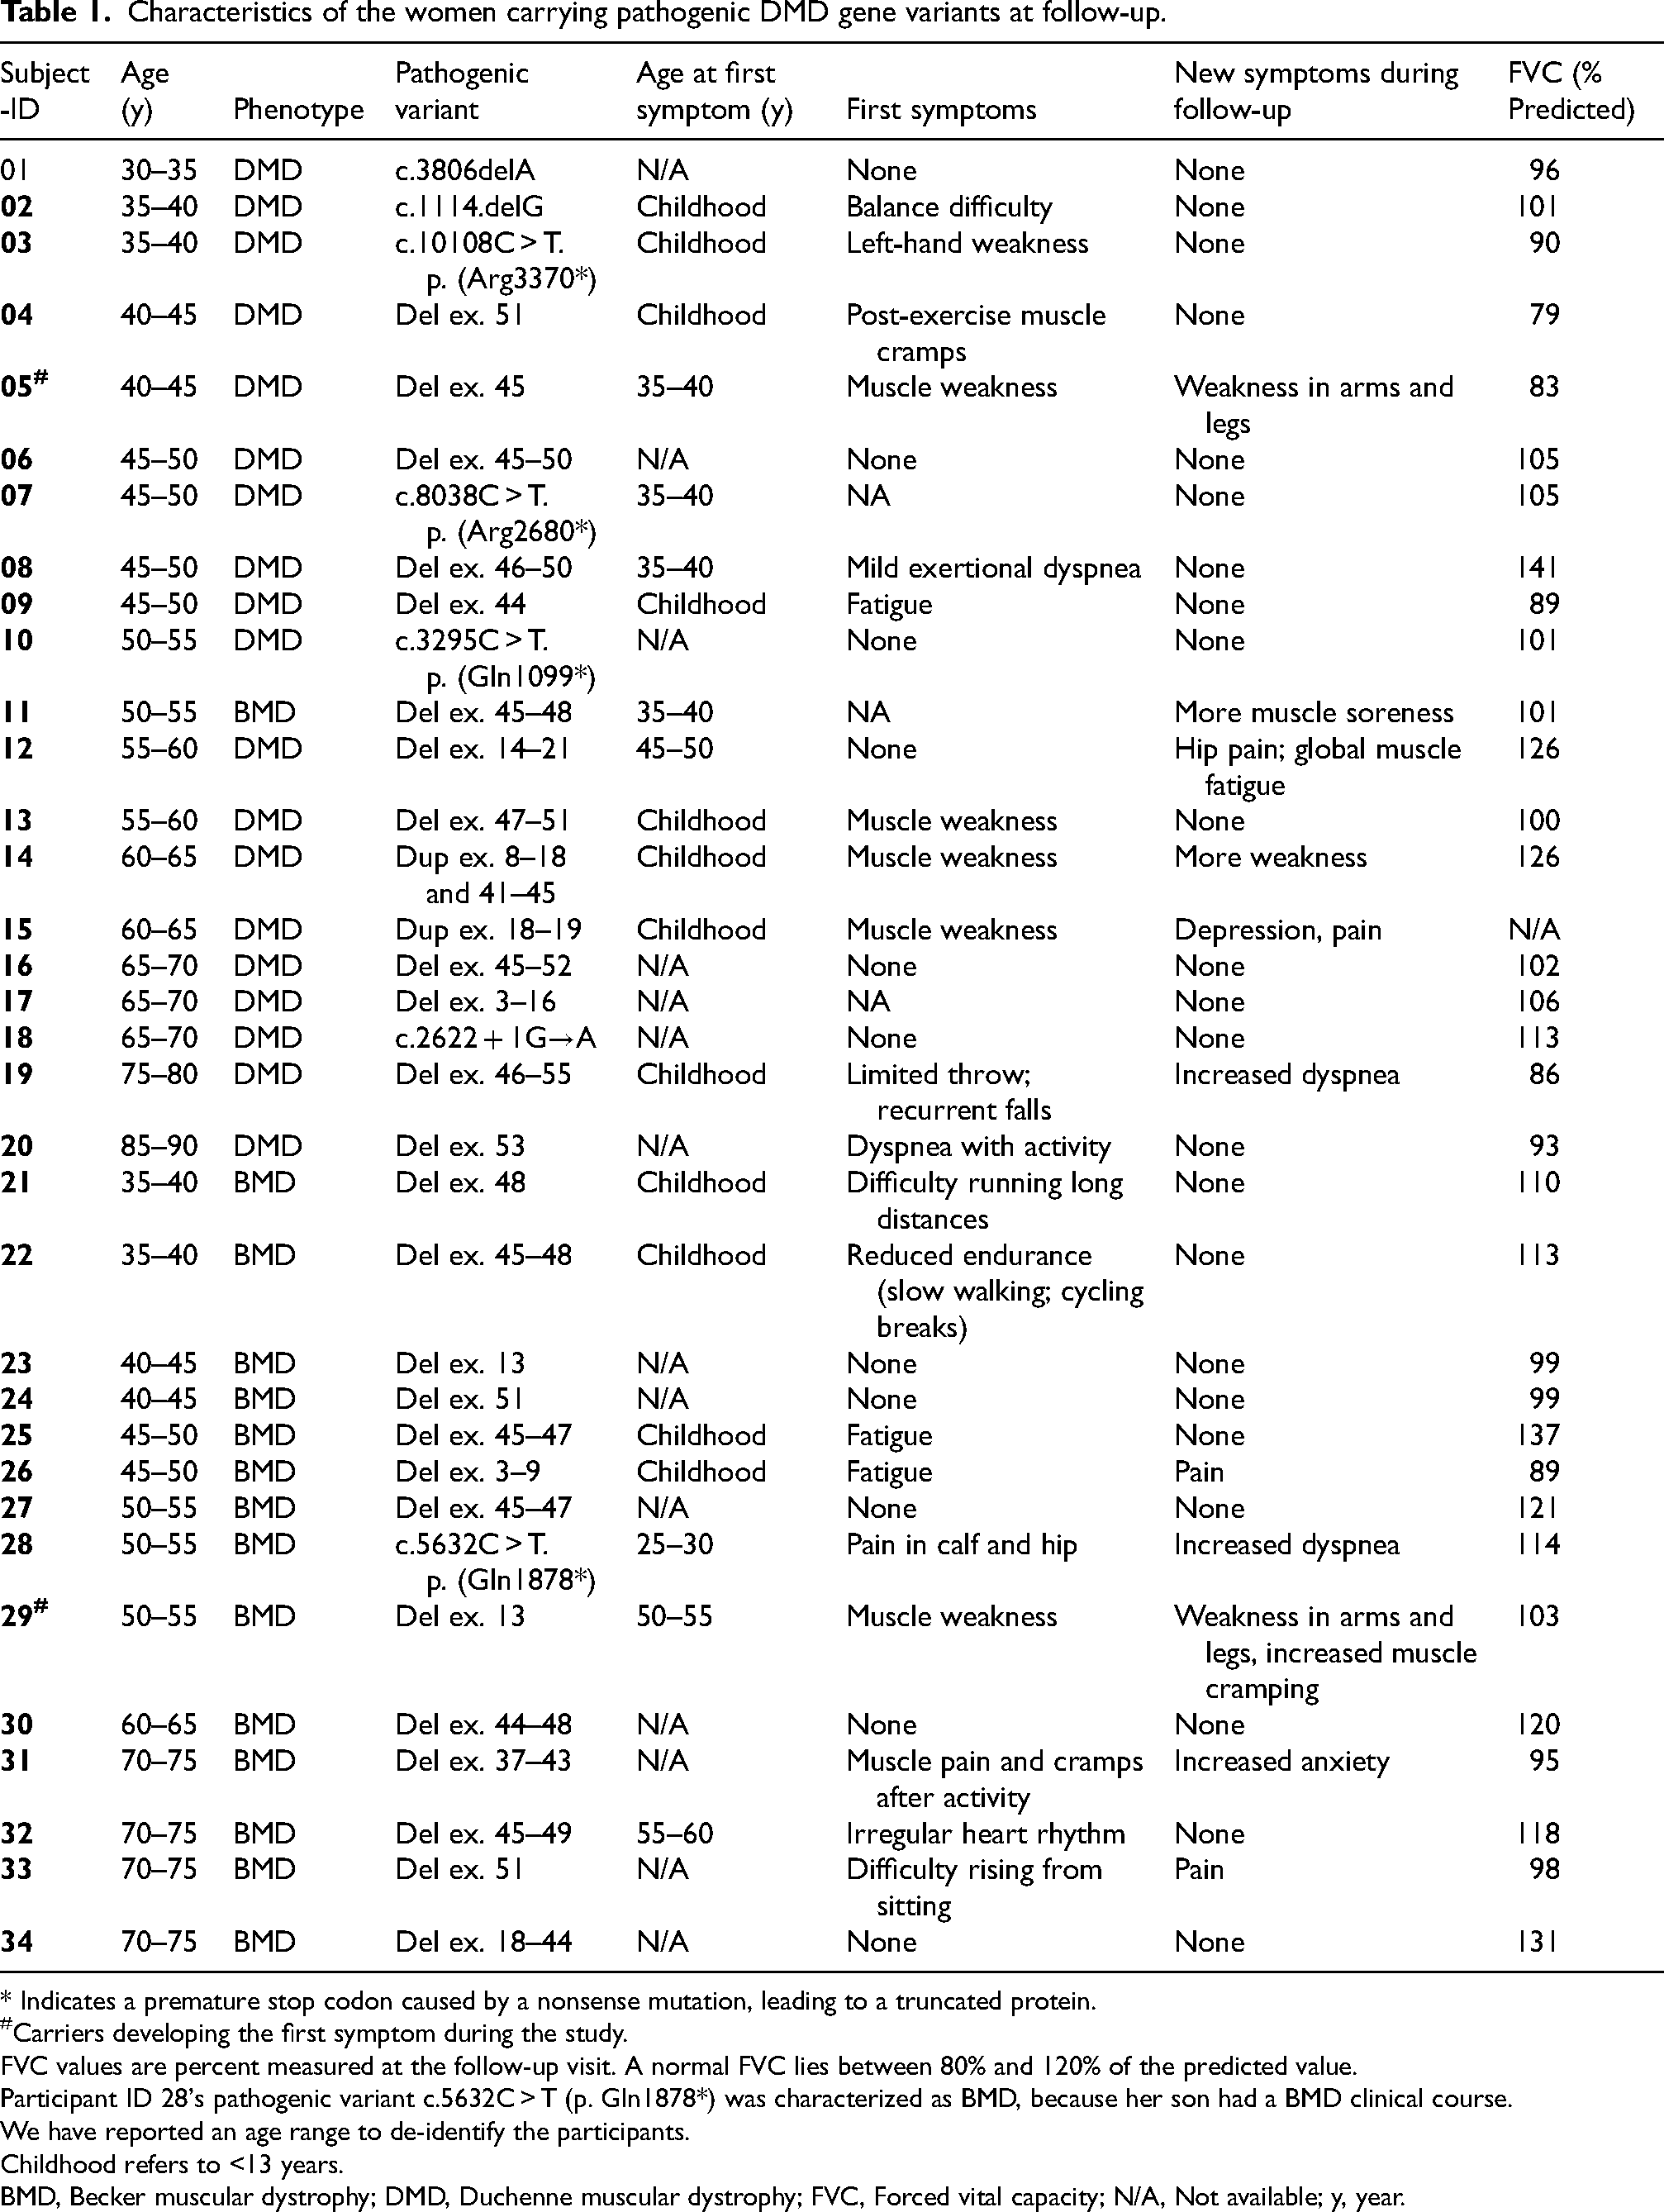
* Indicates a premature stop codon caused by a nonsense mutation, leading to a truncated protein.
Carriers developing the first symptom during the study.
FVC values are percent measured at the follow-up visit. A normal FVC lies between 80% and 120% of the predicted value.
Participant ID 28's pathogenic variant c.5632C > T (p. Gln1878*) was characterized as BMD, because her son had a BMD clinical course.
We have reported an age range to de-identify the participants.
Childhood refers to <13 years.
BMD, Becker muscular dystrophy; DMD, Duchenne muscular dystrophy; FVC, Forced vital capacity; N/A, Not available; y, year.
Muscle fat fraction
The muscle FF increased significantly in most muscles over time (Figure 2). A notable increase in muscle FF was observed in the lower back muscles (particularly the erector spinae) and the posterior thigh and calf muscles. The anterior compartments of the thigh and calf generally showed no significant changes.
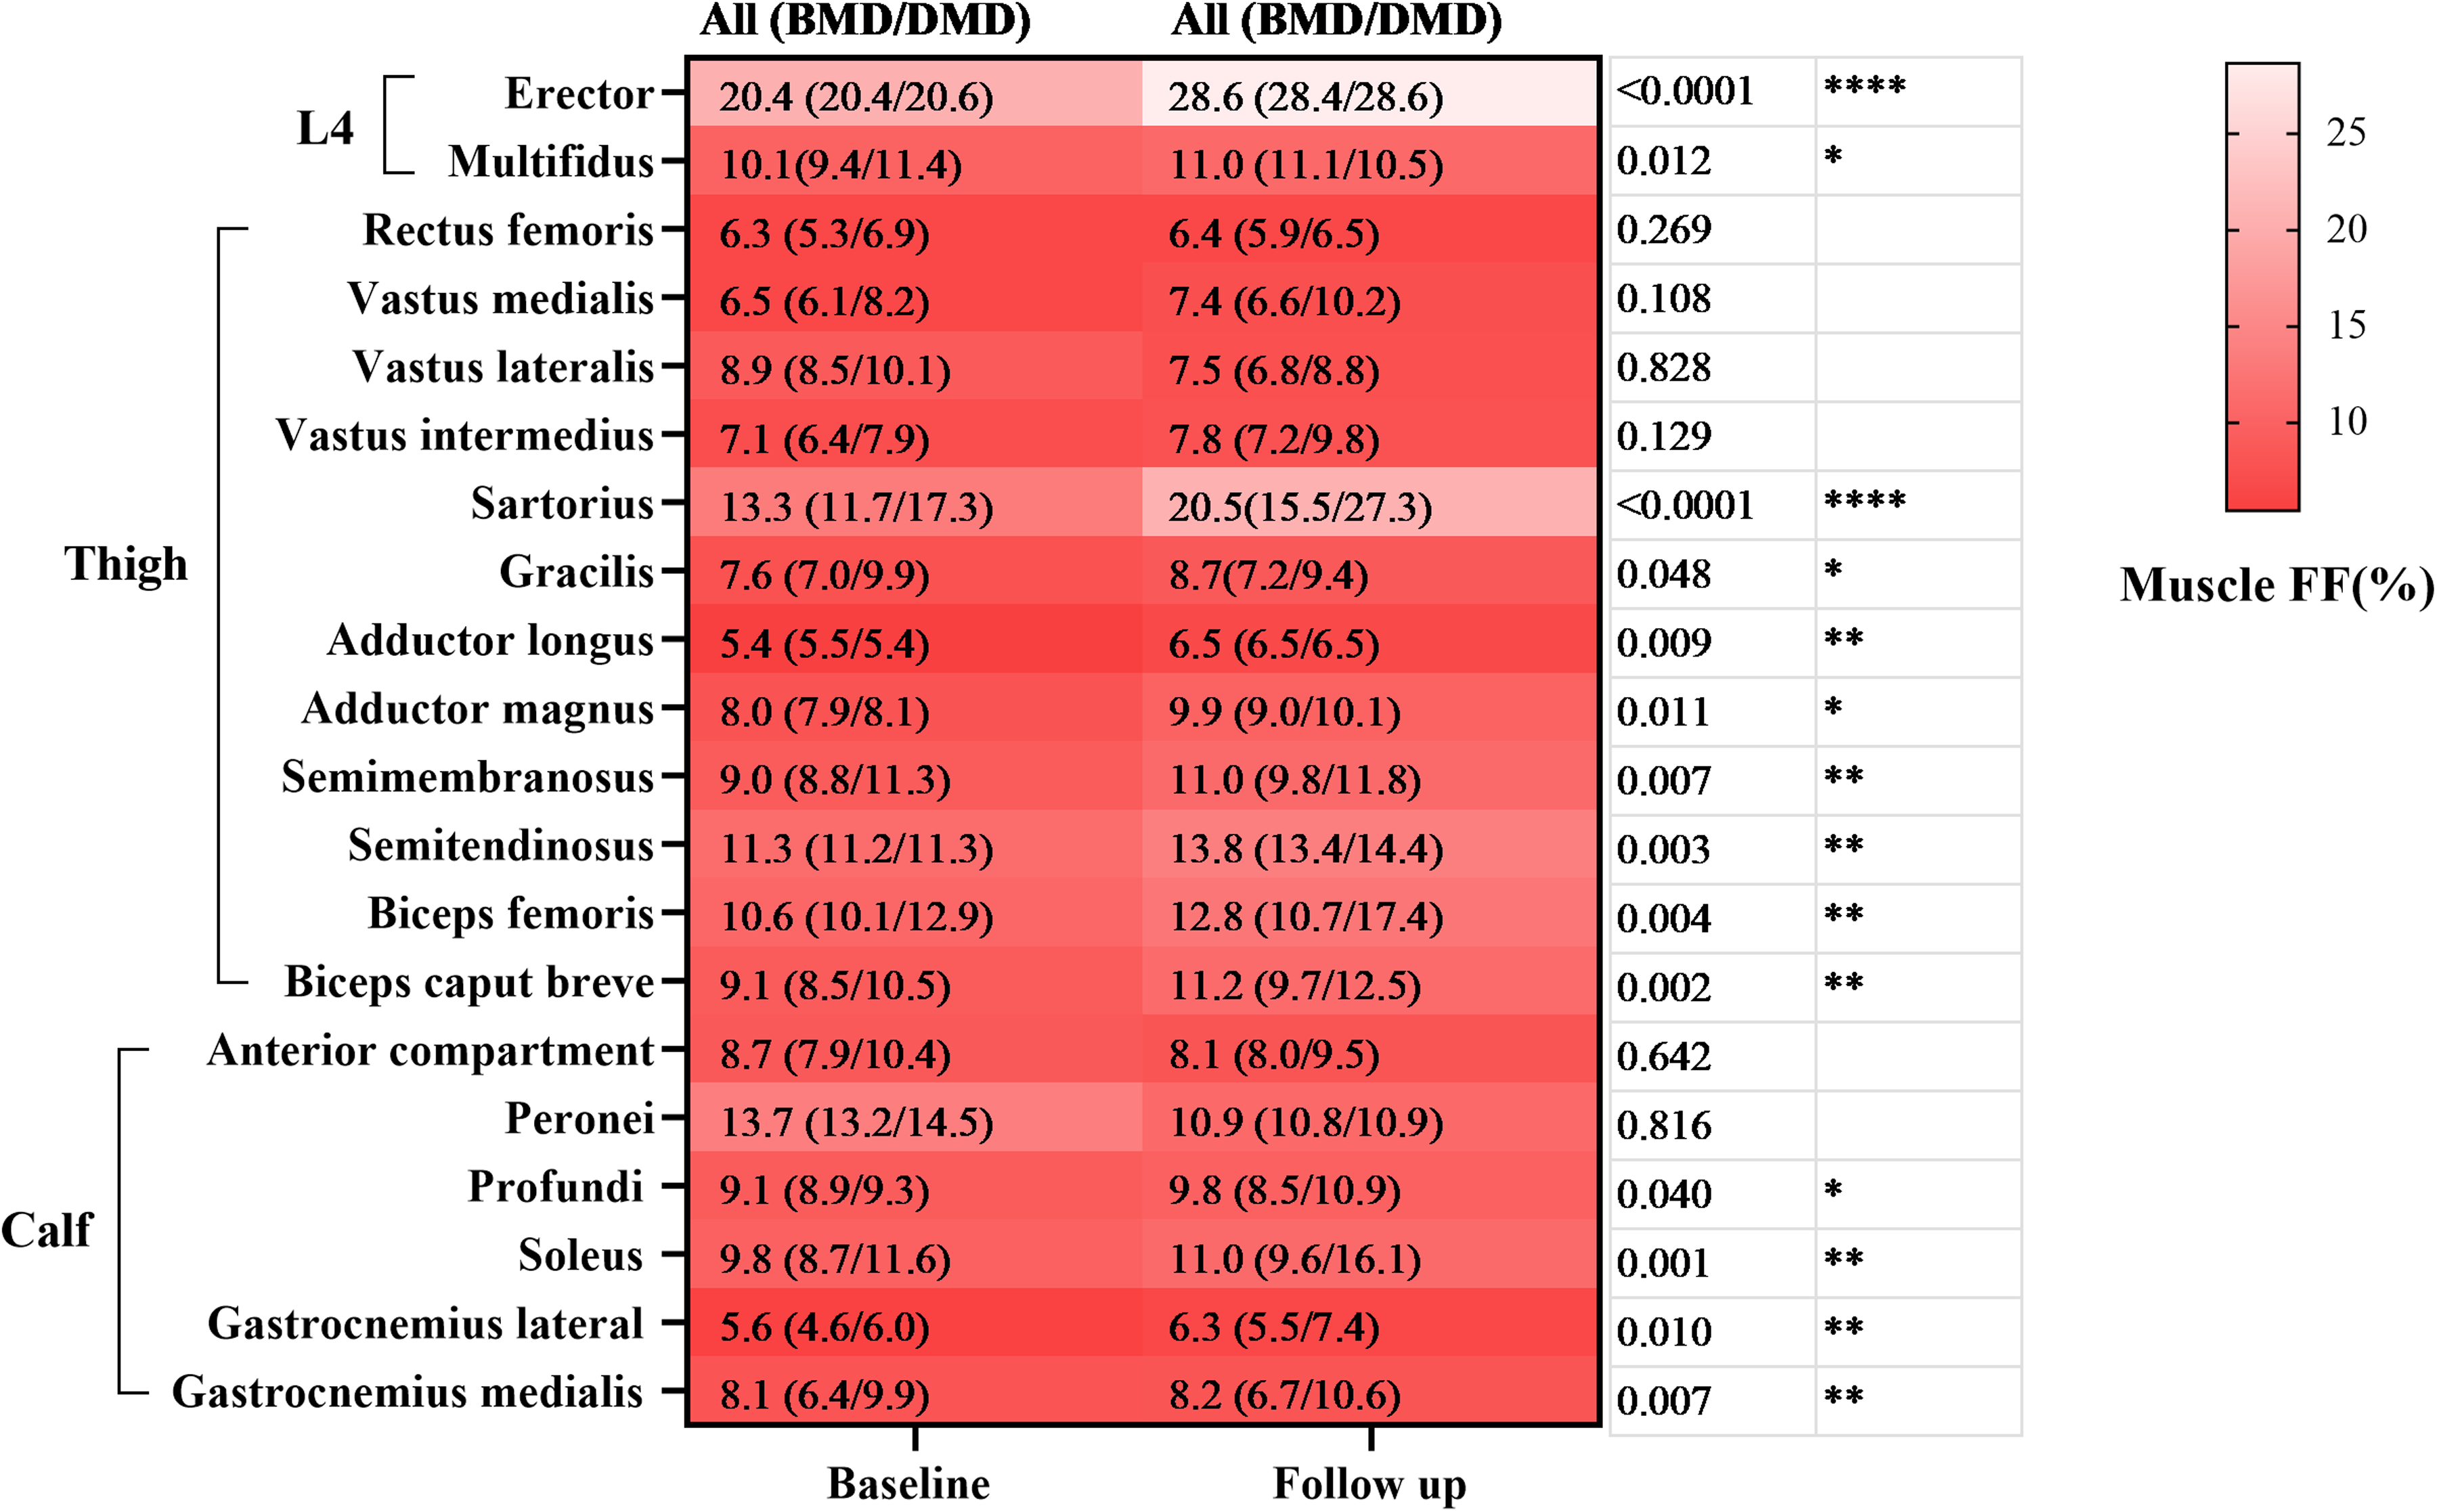
Heatmap of muscle fat fraction (%) at baseline and follow-up. The comparisons (p-values) correspond to the difference in the total group from baseline to follow-up. *: P < 0.05; **: P < 0.01; ****: P < 0.0001. FF: Fat fraction, L4: Lumbar 4.
Although most muscles showed an increase in muscle FF, the overall change was minimal in most individuals. A few individuals showed faster progression.
To better describe the fast-progressing carriers, we grouped the carriers into fast and slow-progressing groups, according to a progression of muscle FF of more or less than 1% per year in the thigh (Figure 3A, B).
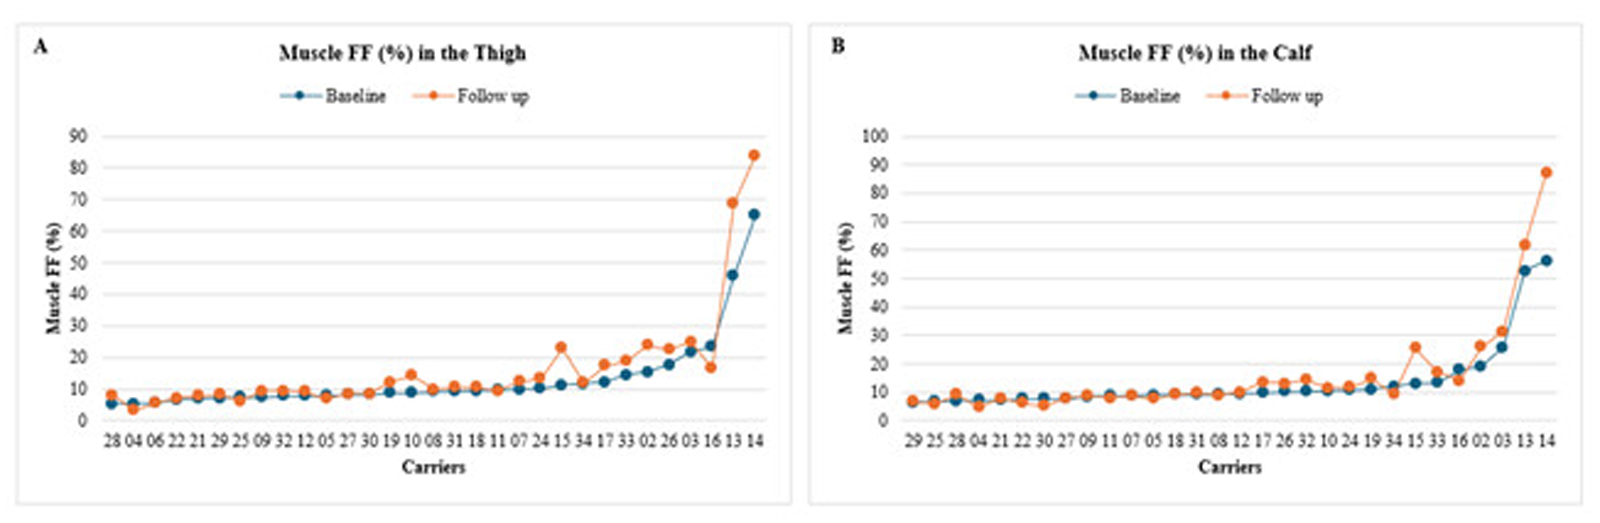
Changes in thigh (A) and calf (B) muscle fat fraction over time. Participant numbers on the X-axis correspond to those in Table 1, and participants are ordered after increasing muscle fat fraction at baseline.
Four of the 31 carriers (13%) were fast-progressors, with a median muscle FF increase of 15.4%.
The fast-progressors generally had a higher baseline muscle FF than the slow-progressors.
Carriers with high baseline muscle FF were symptomatic (e.g., muscle weakness in MRC).
In the slow-progressing group, we observed a small but significant increase in total thigh muscle FF over 6.5 years, with a mean increase of 1.3% (95% CI: 0.30–2.30, P = 0.013).
No significant differences in progression were found between DMD and BMD carriers in the thigh (P = 0.114) or calf (P = 0.116); however, all four fast-progressors were DMD carriers.
Symptomatic or asymptomatic carriers based on the presence of muscle weakness (asymptomatic n = 12; symptomatic n = 19). Muscle FF did not differ between symptomatic and asymptomatic carriers at the thigh (P = 0.159) or calf (P = 0.062).
Ordering carriers by age and plotting thigh FF at baseline and follow-up showed no clear age-related trend (Figure 4).
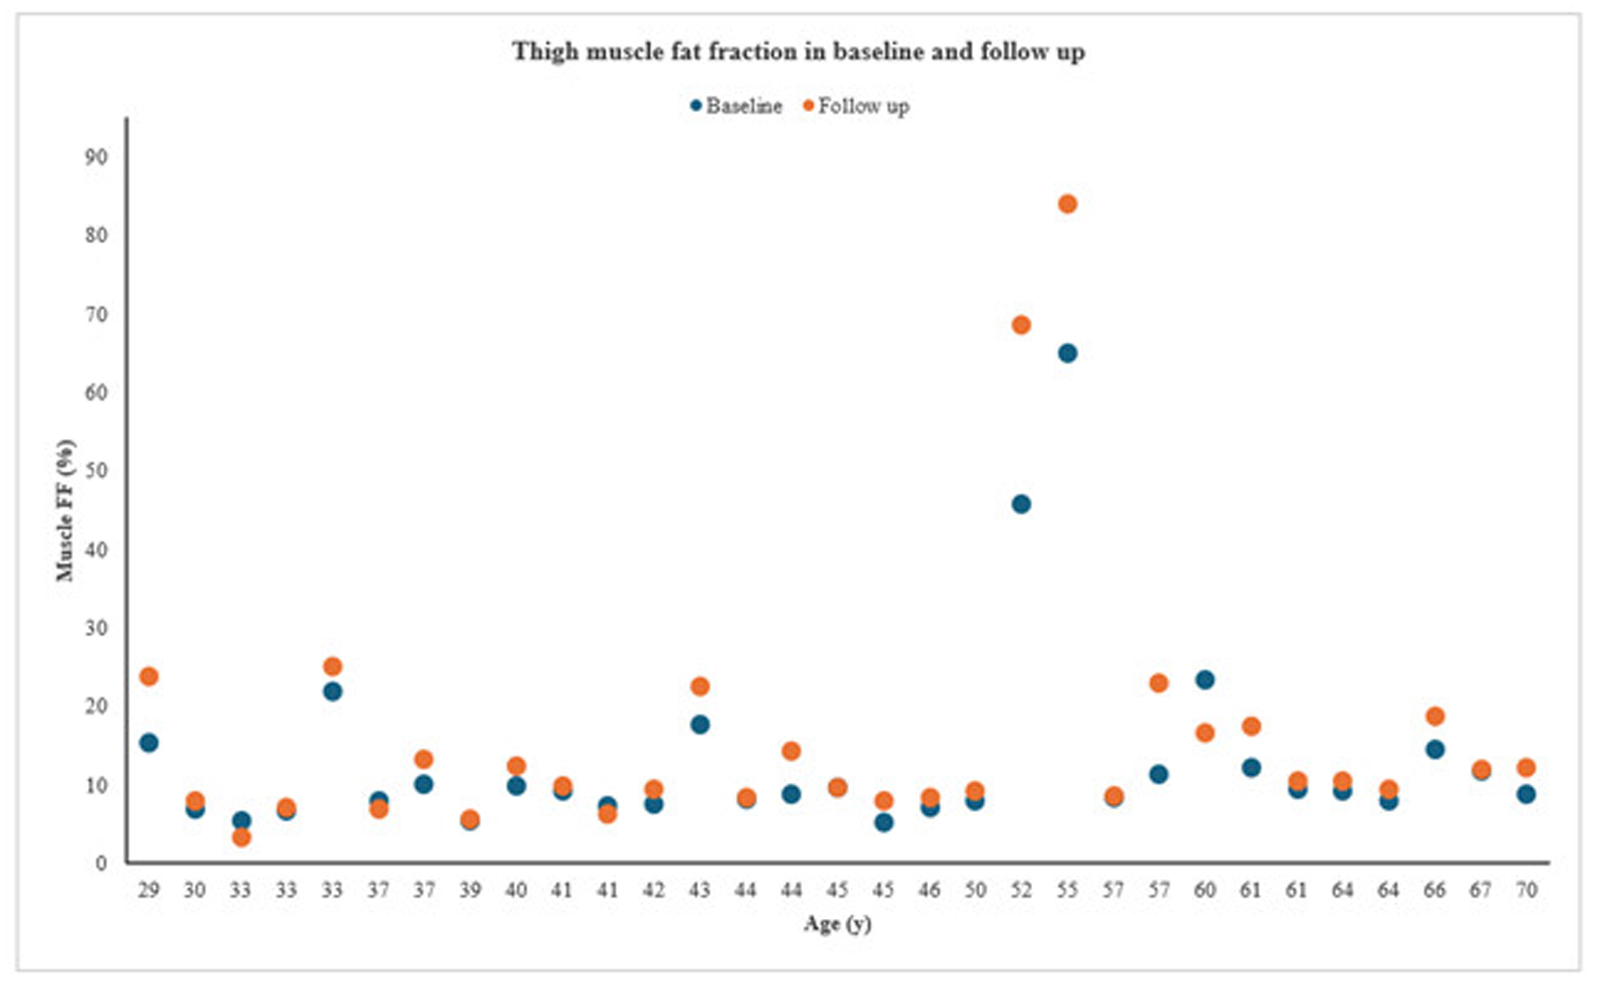
Thigh muscle fat fraction by age at baseline and follow-up. FF, fat fraction; y, year.
Only one participant (No. 16) experienced decreased muscle FF in both the thighs and calves. She reported extensive exercise and a minor weight loss during the 6.5-year follow-up (Figure 3A, B).
Muscle strength
The knee extensors showed a significant decrease in muscle strength at follow-up, with a median difference of −11.4 Nm (95% CI: −17.4 to −6.5, P < 0.001). No significant changes were observed in the knee flexors (P = 0.624).
There was no significant difference in strength over time between DMD and BMD carriers in knee extensors or flexors, with P = 0.328 and P = 0.786, respectively.
The fast-progressing group did not show a more prominent decrease in muscle strength than the slow-progressing group.
Clinical assessment
There was no significant difference in fatigue scores between baseline and follow-up (P = 0.218) (Figure 5B). The mean fatigue score is 3.45 at baseline and 3.27 at follow-up.
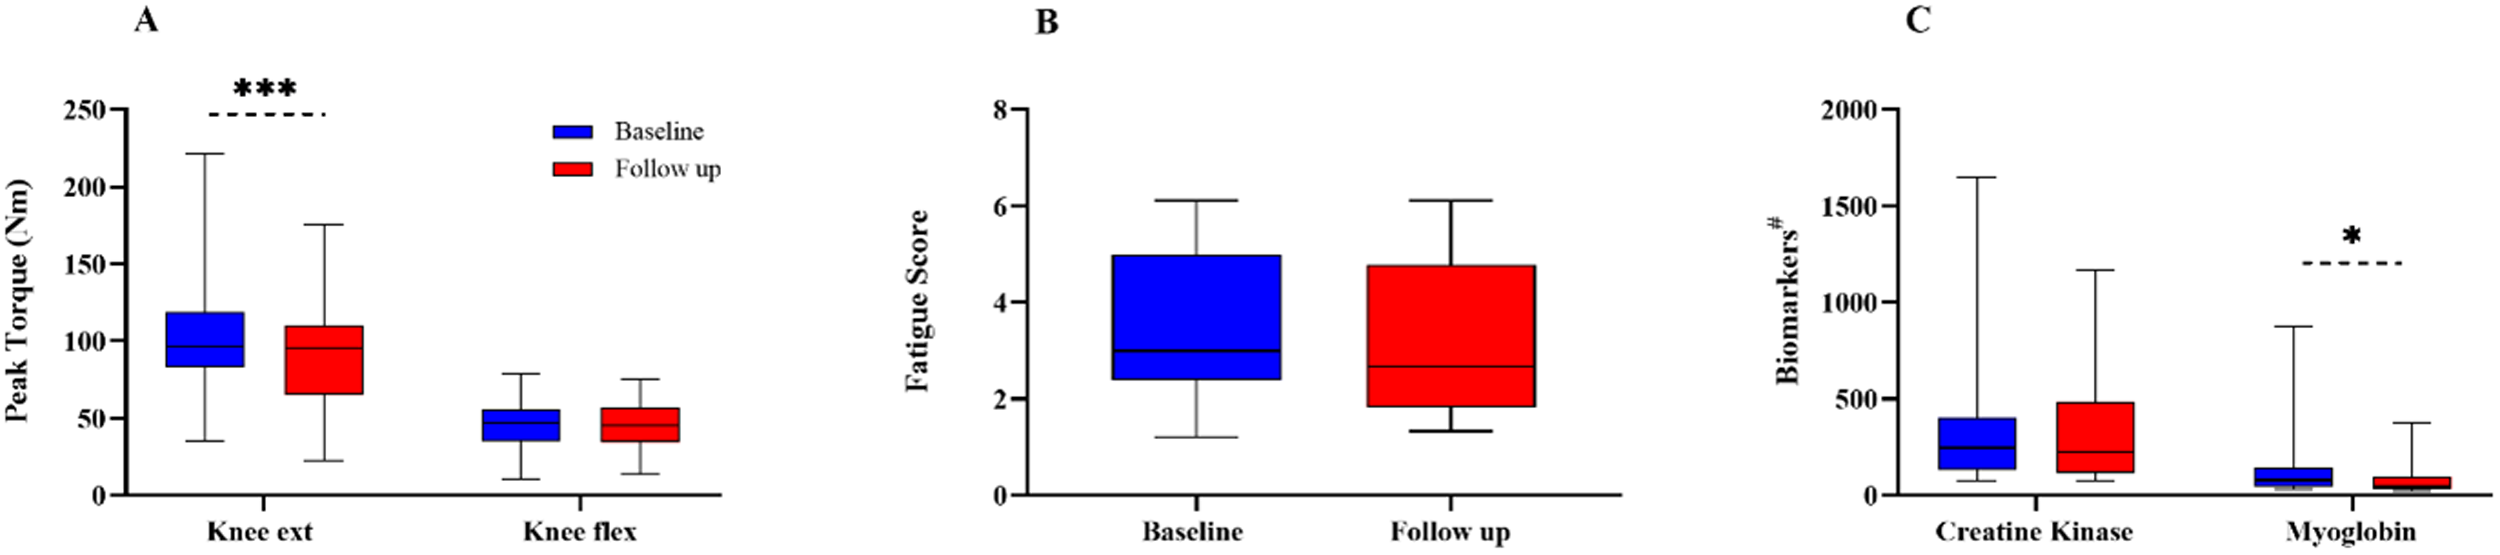
Changes in peak torque (A), fatigue score (B), and muscular biomarkers (C) between baseline and follow-up. *: P < 0.05; ***: P < 0.001. #: Units, Creatine Kinase in U/L, Myoglobin in μg/L. ext.: extensors; flex.: flexors.
A significant decline was observed in the ability to walk stairs between baseline and follow-up (P = 0.016). A decline was seen in 7/34 carriers (21%), of whom two participants (No. 02 and 15 in Table 1) belonged to the fast-progressing group.
Two participants developed their first symptom during the follow-up period; muscle weakness was the first symptom for both. Five participants developed pain in the arm, lower back, or leg during the follow-up visits.
Two carriers reported increased dyspnea, but lung and heart function were normal, suggesting a subjective rather than physiological cause.
Myoglobin levels significantly decreased, with a median difference of 20 μg/L (95% CI: 12.12 to 102.64, P < 0.0001). Although myoglobin levels decreased, they remained above the normal range of 19–49 μg/L.
Creatine kinase levels remained stable throughout the follow-up period (P = 0.439) (Figure 5C).
Six-minute walk test
6MWT distance in carriers did not differ significantly from the predicted distance in healthy-matched individuals at the group level, P = 0.058 (mean difference: −34.9 meters; 95% CI: −71.0 to 1.3) (Figure 6).
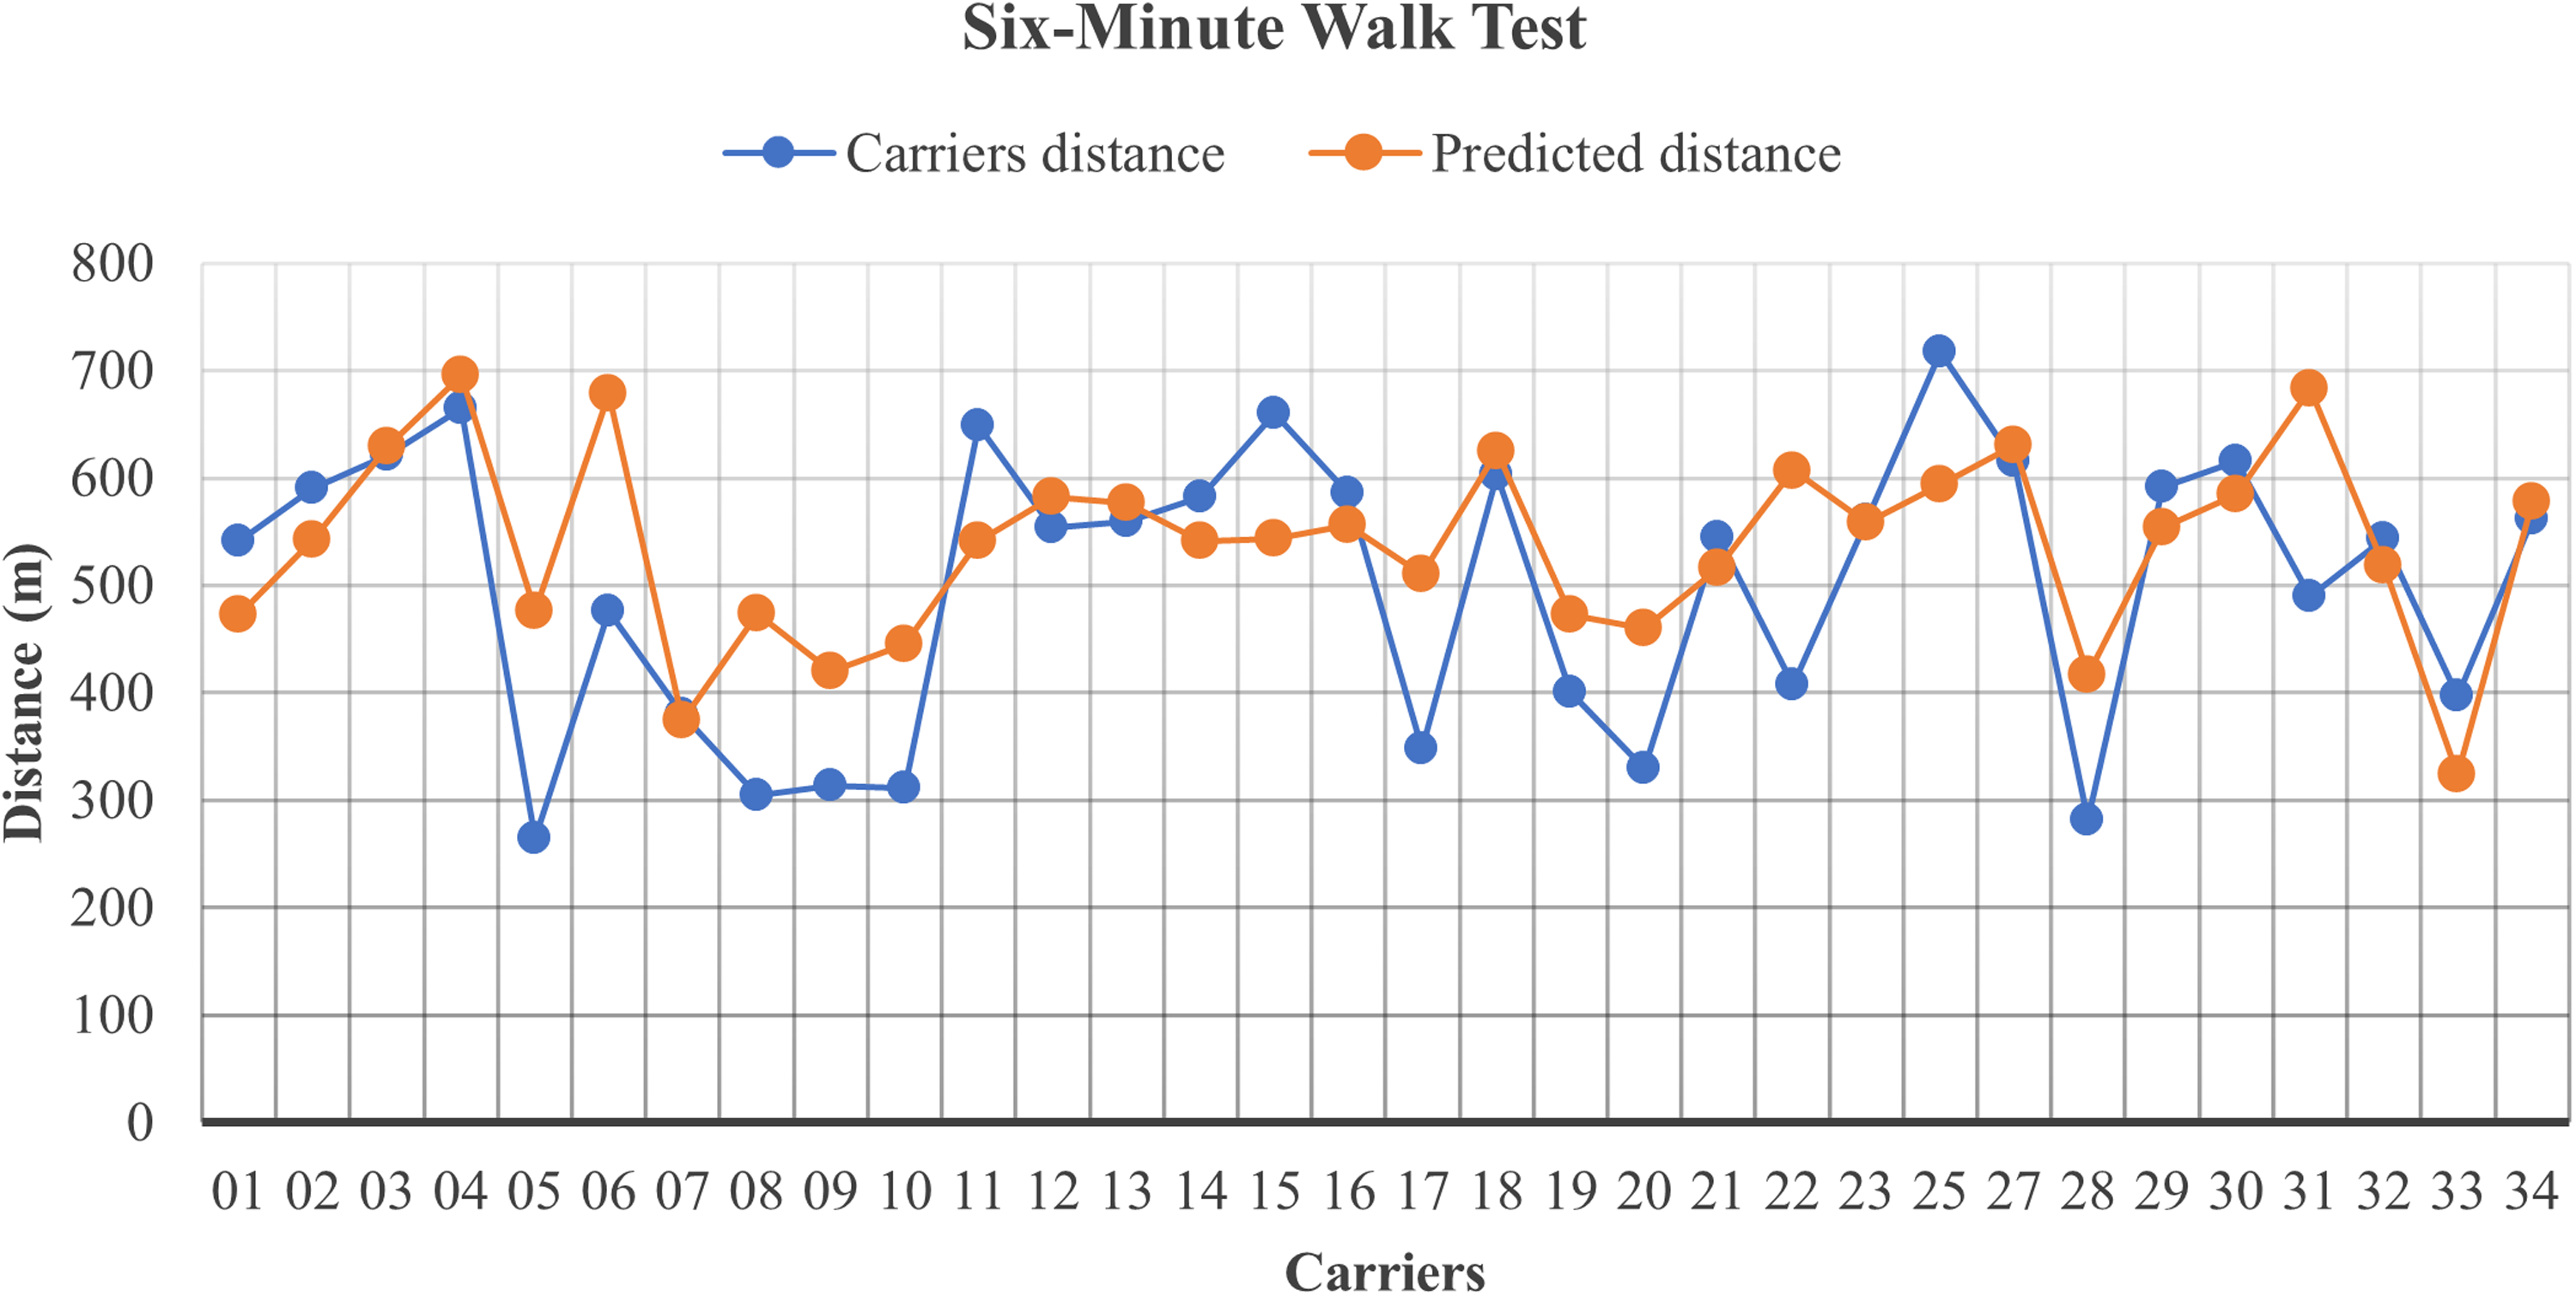
Comparison of the carriers’ Six-Minute Walk Test results with the predicted distance.
However, 10/32 (31%) carriers had a 6MWT distance below 100 m of the predicted value. Among these carriers, three showed a large decrease in the 6MWT distance, with values below 200 m, of whom one was from the fast-progressing group.
Forced vital capacity
A reduced FVC was found in only one carrier (Table 1). She had a muscle FF at both baseline and follow-up below 5.5%. Therefore, the low FVC is unlikely to be caused by respiratory muscle weakness.
Discussion
Predictors of fast progression
We found an overall minimal increase in muscle FF over 6.5 years in women carrying a pathogenic DMD gene variant. A key observation is that carriers with high baseline muscle FF showed fast progression. This suggests that initial muscle FF levels may help predict future disease severity, making it an important predictor of prognosis.
Genotype could be another predictor: all fast-progressing carriers had a variant predicted to cause DMD in men. Still, overall, there was no difference in the progression of muscle FF between carriers of pathogenic DMD variants predictive of DMD and BMD. This apparent disparity likely relates to an additional condition for pathogenicity besides genotype, for example, differences in X-chromosome activation, which is known to differ among women. 20 The interplay between genotype (BMD vs. DMD variant) and pattern of X-chromosome activation in female carriers of pathogenic DMD variants is a field that needs investigation.
Finally, among the four fast-progressors, all had childhood onset, suggesting that early onset may be associated with a higher risk of faster disease progression. Thus, high muscle FF, a genotype predicted to cause DMD, skewed X-chromosome activation pattern, and early onset of disease are potential predictors of a fast-progressing phenotype.
Pattern of muscle involvement and age-related changes
In all carriers, the muscles affected and progressing the most followed the same pattern of muscle involvement seen in men with BMD, 21 particularly involving the gluteus maximus, adductor magnus, and vastus lateralis.
We grouped carriers by thigh FF progression: a mean increase <1.0% per year was slow progression.
The muscle FF naturally increases with age in healthy individuals by approximately 0.2% per year in the thigh and calf muscles, corresponding to around 1.2% over six years. 22 The average muscle FF increased by 1.3% over 6.5 years in the slow-progressing group. Hence, the progression of fat replacement in carriers with slow progression is likely due to age-related changes rather than disease-induced degeneration, pointing to a good prognosis.
While muscle FF can rise with age and disease duration, in our cohort, several younger carriers—including childhood-onset cases—also showed marked involvement, indicating that age alone does not explain the pattern.
Muscle strength declined in the knee extensors, while no decline was observed in the knee flexors, despite MRI showing the opposite, with increased muscle FF in the flexors and not the extensors. Furthermore, muscle strength declined at the same rate in the fast-progressing and slow-progressing groups. This discrepancy between imaging and functional testing warrants further consideration.
The Biodex dynamometer is generally considered reliable, 23 but the decrease in knee extensor strength (11 Nm) is small. In the follow-up tests, some carriers used a different machine with updated software, which may have introduced measurement variability. Differences in calibration, resistance settings, or mechanical alignment between machines could influence torque values. 24
Additionally, age-related strength decline is a possible explanation, as studies report that even healthy individuals over 40 may experience strength losses ranging from 1.5% to over 5% per year. 25 Finally, reduced physical activity, especially during the COVID-19 pandemic, may lead to atrophy and functional impairments, particularly in muscle groups that are less actively engaged during everyday activities.
Slow to no progression in clinical findings
Most carriers showed no clear clinical decline during follow-up. However, 7 carriers (21%) experienced a decline in their stair-climbing ability, including 2 from the fast-progressing group.
In addition, some carriers classified as slow-progressing developed new symptoms during the 6.5-year follow-up.
These findings suggest that although most carriers remained clinically stable, a small subgroup may experience functional decline, potentially due to early-onset symptoms or non-disease-related factors.
There was a significant decrease in myoglobin over the 6.5 years. However, myoglobin naturally decreases with age, due to loss of muscle, and fluctuates with the physical activity period, therefore, this finding is unlikely to have clinical significance.
Respiratory insufficiency has not been reported to be a big issue in carriers of pathogenic DMD variants, and, when present, appears to be limited to very few women with a DMD-like phenotype and severe generalized skeletal muscle weakness. 26
This suggests that pulmonary follow-up, after an initial assessment of normal lung function, is not needed in most carriers.
Six-minute walk test (6MWT)
Unlike other measures in this study, the 6MWT was only performed once during the follow-up period.
There was no statistically significant difference in 6MWT distance between carriers and the predicted values for age- and sex-matched healthy individuals, suggesting that carriers generally maintain ambulatory ability at the group level.
However, 10 of the 34 carriers performed below the expected range, including only one from the fast-progressing group.
Limitations
This study has several limitations that warrant consideration. First, there is a potential for selection bias. Among the 53 carriers identified, 19 (36%) declined to participate. This level of attrition could introduce bias; however, the average thigh muscle FF among non-participants was approximately 13%, similar to that of those included in the study. Only four fast progressors were observed — all DMD carriers — so larger studies are needed to determine whether this finding applies more broadly. Finally, the absence of a non-carrier control group limits comparisons with normal aging.
Conclusion
Our findings show that women carrying pathogenic DMD gene variants with high baseline muscle FF are more likely to experience disease progression. while most carriers show a minimal and stable progression in muscle FF over 6.5 years. This indicates that baseline muscle FF could serve as an important marker for prognosis and monitoring. Despite general preservation of ambulatory function, some carriers experienced reduced muscle strength, new symptoms, or functional decline, emphasizing the importance of individualized follow-up.
Footnotes
Abbreviations
Acknowledgements
The authors thank the participants and clinical staff at Rigshospitalet for their valuable contributions.
Author contributions
ZL, NSP, and JV contributed to the conception and design of the study. ZL, NSP, HJ, FF, and TAS were involved in data acquisition. ZL performed data analysis, drafted the manuscript, and prepared the figures. NSP and JV critically revised the manuscript for important intellectual content.
Funding
The authors received no financial support for the research, authorship, and/or publication of this article.
Data availability statement
The data supporting the findings of this study are not publicly available due to ethical restrictions and patient confidentiality. De-identified data may be available from the corresponding author upon reasonable request.
Conflict of interest
None of the authors has any conflict of interest to disclose.