
Abstract
Background:
In Myotonic Dystrophy type 1 (DM1) patients, ankle muscles are affected early and this impairment is reported to be a good biological marker for longitudinal studies.
Objective:
To characterize the ankle dorsiflexion (DF) and eversion (EV) maximal isometric muscle strength changes in adult DM1 patients over 5 years using a standardized handheld dynamometer protocol and the Myoankle method, compare the changes measured with both methods and to the standard error of measurement, and verify the relationship between ankle muscle strength and gait performance.
Methods:
The maximal isometric muscle strength of ankle DF and EV in DM1 patients from Quebec and Lyon was assessed at baseline, 18, 36 and 60 months using a handheld dynamometer (HHD) protocol and the MyoAnkle method.
Results:
There was a decrease of torque in DF/EV of 36.0% /31.3% and 27.7% /35.5% for the Quebec and Lyon cohorts respectively (p≤0.01), but not in a linear way. In most cases (82.5%), the changes observed were greater than the standard error of measurement. DF torque measures taken by the two methods (HHD and MyoAnkle) were highly correlated (rp = 0.97–0.98, p < 0.001).
Conclusion:
Muscle strength ankle impairments are clinically meaningful in DM1 and can be accurately monitored using quantitative testing to measure the efficacy of therapeutic trials.
INTRODUCTION
Myotonic dystrophy type 1 (DM1) is a multisystem disorder that demonstrates variable symptoms and rates of muscle weakness. The assessment of muscle strength in DM1 is mainly performed by manual (MMT) or quantitative (QMT) muscle testing [1]. MMT does not require any equipment and is generally performed according to agreed upon protocols [2]. MMT is most often rated on a five-point scale such as the Medical Research Council (MRC) scale or its 10-point scale variant, the modified MRC scale [3]. However, MMT has shown significant methodological flaws in terms of reproducibility and sensitivity to change, which does not allow one to draw firm conclusions on the profile of muscle strength impairment [1, 4–6]. MMT reproducibility and sensitivity to change has been questioned, for both clinical outcomes and the evaluation of the effectiveness of interventions [1, 4–6]. When addressing DM1, a validated scale, the Muscular Impairment Rating Scale (MIRS), has also been designed to define the level of muscular impairment using five stages [7]. This scale is primarily based on the assessment of muscle impairment by MMT of proximal and distal muscles in the upper and lower limbs [7]. The MIRS is frequently used in clinic to summarize muscle impairments as well as in studies to classify subjects. However, its use as a main endpoint for measuring short-term changes in muscle strength impairments in DM1 over time cannot be considered as this tool has been rather used as a classification system and not as a primary outcome for clinical follow-up. Furthermore, a major challenge in rare diseases studies is to have access to sufficiently large cohorts. Multicentre study is a great option to enlarge cohorts, but it requires the use of a standardized protocol with good metrological qualities to ensure the accuracy of data collected. In DM1, maximal muscle strength could also hypothetically be influenced by myotonia, but as it is an integral part of the muscle strength production process, it is difficult, if not impossible, to distinguish the voluntary muscle strength component from the total muscle strength recorded.
Muscle weakness is considered one of the main problems in DM1 with a clinical picture characterized by limbs’ weakness often reported as progressing from distal to proximal [8–10]. The progression of weakness in the lower limb is therefore often worse in the distal muscles such as in the ankle, where ankle dorsiflexors (DF) and evertors (EV) are affected early in the disease [5, 11]. Weak DF may lead to bilateral foot drop, and eventually to falls due to tripping. As reported by Hammaren et al. in a cohort of men and women with DM1, the foot DF was the most affected muscle group and dynamic balance tasks including the Timed Up and Go (TUG) and Step Tests showed correlations with pronounced weakness of the ankle DF [12]. Moreover, the ankle DF force only was shown to correlate with the number of falls. They concluded that assessing the ankle muscle strength and the time difference in different walking speeds is important to detect risk of falling in DM1 individuals. As for the EV, they are the best protection for a near-maximally inverted ankle at footstrike, they act in synergy with the ankle DF to stabilise the foot-ankle complex during weight bearing activities and they may compensate for a lack of dorsiflexion [13]. Therefore, these two muscle groups are key muscles involved in physical activity limitations in DM1, and they can be used to identify the individuals who are most likely to fall or need orthotic devices. The accurate measurement of muscle strength impairments at the ankle on the short term would also be extremely useful to assess the efficacy of therapeutic trials aimed at reducing loss of independence, physical activity limitations and restrictions to participation.
In a previous cross sectional study design, we characterized the maximum isometric torque of ankle DF and EV in DM1 patients using hand held dynamometer (HHD) quantitative muscle testing [5]. In this later study, we have shown that our HHD protocol has good to excellent inter-rater reliability between all three testers (Pearson correlation coefficients (rp) ranging from 0.70 to 0.93 and 0.72 to 0.94 for ankle dorsiflexion and eversion, respectively). Also, the Standard Error of Measurement (SEM) was as low as 1.0 Nm and 1.3 Nm for the ankle dorsiflexion and eversion, respectively. The objective of this 5-year multicenter longitudinal study was to characterize, using our standardized HHD protocol, the profile of changes of the maximal muscle strength of the ankle DF and EV in adult DM1 patients at baseline, 18, 36, and 60 months. Our secondary objectives were to: compare the magnitude of strength changes overtime between sites and to the SEM, verify if these changes were linear or not; and verify the relationship between the strength at baseline and the loss of strength 5 years later, and analyze the agreement between the strength measured with our HHD protocol and a standardized force plate system called the MyoAnkle that was specifically developed for assessing muscle strength impairments at the ankle joint in neurodegenerative conditions [14]. Finally, we also wanted to verify the relationship between ankle muscle strength and gait performance.
MATERIALS AND METHODS
Participants
DM1 patients were recruited from the neuromuscular clinics of the Institut de Réadaptation en Déficience Physique de Québec and Hôpital Pierre Werteimer for patients from Lyon. Inclusion criteria were: to be 18 years old or older, to have weakness of the ankle DF as assessed by manual muscle testing, to have a DM1 diagnosis confirmed by molecular testing, and to be able to take part in quantified muscle strength assessment. Patients with infantile or congenital form of the disease, cognitive impairments, Body Mass Index ≥ 30 kg/m2, excessive daytime sleepiness (Epworth score >10), pregnant women, pulmonary deficiencies (FVC <50% predicted value) and other diseases that might lead to permanent physical limitations were excluded from the study. At the inclusion in the study, all DM1 patients recruited were tested using the 0–5 manual muscle testing scale. A convenience sample of DM1 patients in Quebec (Canada) and Lyon (France) with different levels of muscle impairments was recruited in the study. Patients were enrolled from the medical chart based on the manual testing scores of the DF to ensure a wide distribution of muscle impairment from mild to severe. The Ethics Review Board of the Institut de Réadaptation en Déficience Physique de Québec for Quebec and the Hôpital Pierre Werteimer (Groupement Hospitalier Est) for France approved the project. Written informed consent was obtained from all participants prior to the examination.
Procedures
The maximal isometric muscle strength of ankle DF and EV of DM1 patients from Quebec and Lyon was assessed at baseline (T1), 18 (T18), 36 (T36), and 60 (T60) months by one evaluator in Quebec and one evaluator in Lyon with a Chatillon push-pull hand-held dynamometer (FCE-500, Ametek TCI Division, Chatillon Force Measurement Systems, Florida, USA). All physiotherapists received the required training on the standardized HHD protocol we used, which was previously thoroughly described [15]. laquoGravity eliminatedraquo positions were used for each muscle group. Both ankle DF and EV were tested with the subject supine with a small roll under the knee to allow 5–10° degrees of knee flexion, ankle maintained at 90° of flexion. Isometric make tests were used and standard verbal encouragement was given during each maximal contraction. Two trials were completed for each muscle group, and the mean of the two trials was used for the final analysis. When more than 10% difference was noted between the two trials, a third one was completed and the mean of the two nearest trials was used for the final analyses. When testing at T18, T36, and T60, the tester was blinded to the subject’s strength values obtained at previous sessions.
As DF was previously measured by one of the co-authors (JYH) to establish normative data with healthy subjects using a force plate system called MyoAnkle [14], we wanted to verify the relationship between the two methods when assessing DM1 patients. We also wanted to compare the DF torques and the DF torque changes measured over a two-year period (36 to 60 months) between our HHD protocol and this standardized force plate system. Essentially, this MyoAnkle consists of an aluminium plate below which are held two load cells (model AG100; Scaime, France) on which strain is applied through a non-elastic strap going through slots in the plate. The subject is seated in a plinth adjustable to the height of the subject in order to obtain 90° of flexion at the hip, knee, and ankle joint. The top of the foot is then tightly strapped to lock the ankle and the subject is asked to pull up against the strap to dorsiflex the ankle. During the test, the evaluator is using one hand to firmly stabilize the knee by pushing downward to avoid the heel to move up away from the force plate. The additional testing with the MyoAnkle was only performed in Quebec City at T36 and T60 because of the limited availability of the MyoAnkle prototype. For all muscle groups and both methods, the units of force in Newton were multiplied by the corresponding lever arm, measured in metre, to calculate the maximal isometric torque in Newton-meters (Nm).
The 6MWT was conducted in the Quebec cohort at T1 and T60 in an enclosed, quite corridor, over a distance of 50 meters from end to end, as per the ATS guidelines [16]. The patients were instructed to walk from end to end, covering as much ground as possible in 6 minutes. Individuals were told that they may rest if they become too short of breath, or tired to continue, or have too much pain but to resume walking when they are able to do so. The test ended when the 6-minute duration test was reached. Distance walked in 6 minutes was measured and reported in meters. A greater distance indicates a better performance.
Data analysis
Descriptive statistics are presented as mean and standard deviation or median and range (min-max) depending on the normal distribution or not of the data, or on the number of participants (n, %). Participants were compared in terms of age, disease duration, and number of CTG repeats using the Mann-Whitney U Test. Repeated measures ANOVA with Tukey’s significant difference post hoc tests was used to verify significant statistical differences between times for FD and EV strength results for each centre. Pearson correlation coefficients were used to verify the relationship between the strength at baseline and the percentage of strength lost at 5 years. Simple linear regressions were used to determine the relationships between the maximal strength for ankle DF and EV at baseline and the loss of strength over 5 years. For the Quebec cohort, maximal DF torques and torque changes over a 5 year period obtained with the HHD quantitative muscle strength assessment were plotted respectively against the scores and changes obtained with the MyoAnkle strength assessment to verify the relationship of the two methods. Bland & Altman plots were conducted to analyze the agreement between the two methods. The differences between scores of the two methods were plotted against the mean scores of these two methods. The 95% limits of agreement (mean±1.96SD) were also added to see the level of absolute agreement between both methods. Spearman correlation coefficients were used to verify the strength of the relationship between ankle muscle strength and walking performance as measured with the 6MWT. Statistical analysis was performed using IBM SPSS Statistics for Windows, Version 21.0 (Armonk, NY: IBM Corp), and significance was set at α<0.05 except for multiple comparisons where a more conservative alpha value was used (α<0.01).
RESULTS
Participants
Forty-nine DM1 patients (23 from Quebec and 26 from France) were assessed at baseline. Twenty-three DM1 patients, 7 from Quebec and 16 from Lyon, were lost during the 5-year follow-up period. In the Quebec cohort, five abandoned for personal reasons and two died while in the Lyon cohort, five died and eleven stopped participating. The 26 remaining DM1 patients originated from twenty-five families; 24 families have one affected member and one family had two affected individual evaluated. Baseline characteristics of DM1 patients are summarized in Table 1; age (p = 0.356), disease duration (p = 0.342), and number of CTG repeat expansion in the blood (p = 0.107) were similar in patients originated from Quebec and Lyon. The only difference between the two populations is the gender with a lower number of females in the Lyon’s cohort.
Characteristics of DM1 participants for Quebec and Lyon cohorts that were followed throughout the five-year period of the study
*For the Quebec cohort, there was a progressive attrition of the number of patients (time of assessment) as follows: 23 (baseline), 19 (T18), 16(T36) and 16 (T60). **For the Lyon cohort, the progressive attrition of the number of patients (time of assessment) was as follows: 26 (baseline), 21 (T18), 12(T36) and 10 (T60).
Ankle muscle strength in DM1 patients
The maximal strength of 16 patients (16 right ankles) from Quebec and 10 patients (10 right and 10 left ankles = 20 ankles) from Lyon was assessed at baseline (T1), 18 (T18), 36 (T36) and 60 (T60) months. As shown in Fig. 1, a decrease of the torque value was observed at 5 years in ankle DF/EV of 36.0% /31.3% and 27.7% /35.5% for the Quebec and Lyon cohorts, respectively. A one-way repeated measures ANOVA was conducted to compare strength at the four measurement times. There was a significant effect of time for both DF (p = 0.001) and EV (p = 0.012) of the Quebec cohort, and DF (p < 0.001) and EV (p = 0.001) of the Lyon cohort. As reported in Fig. 2, overall, 82.5% of all cases for which a decrease was observed, the change was greater than the SEM estimated at 1.0 (DF) and 1.3 Nm (EV). The decrease of strength was not linear as the magnitude of torque changes observed at the different evaluations was varying within and between cohorts and individuals.
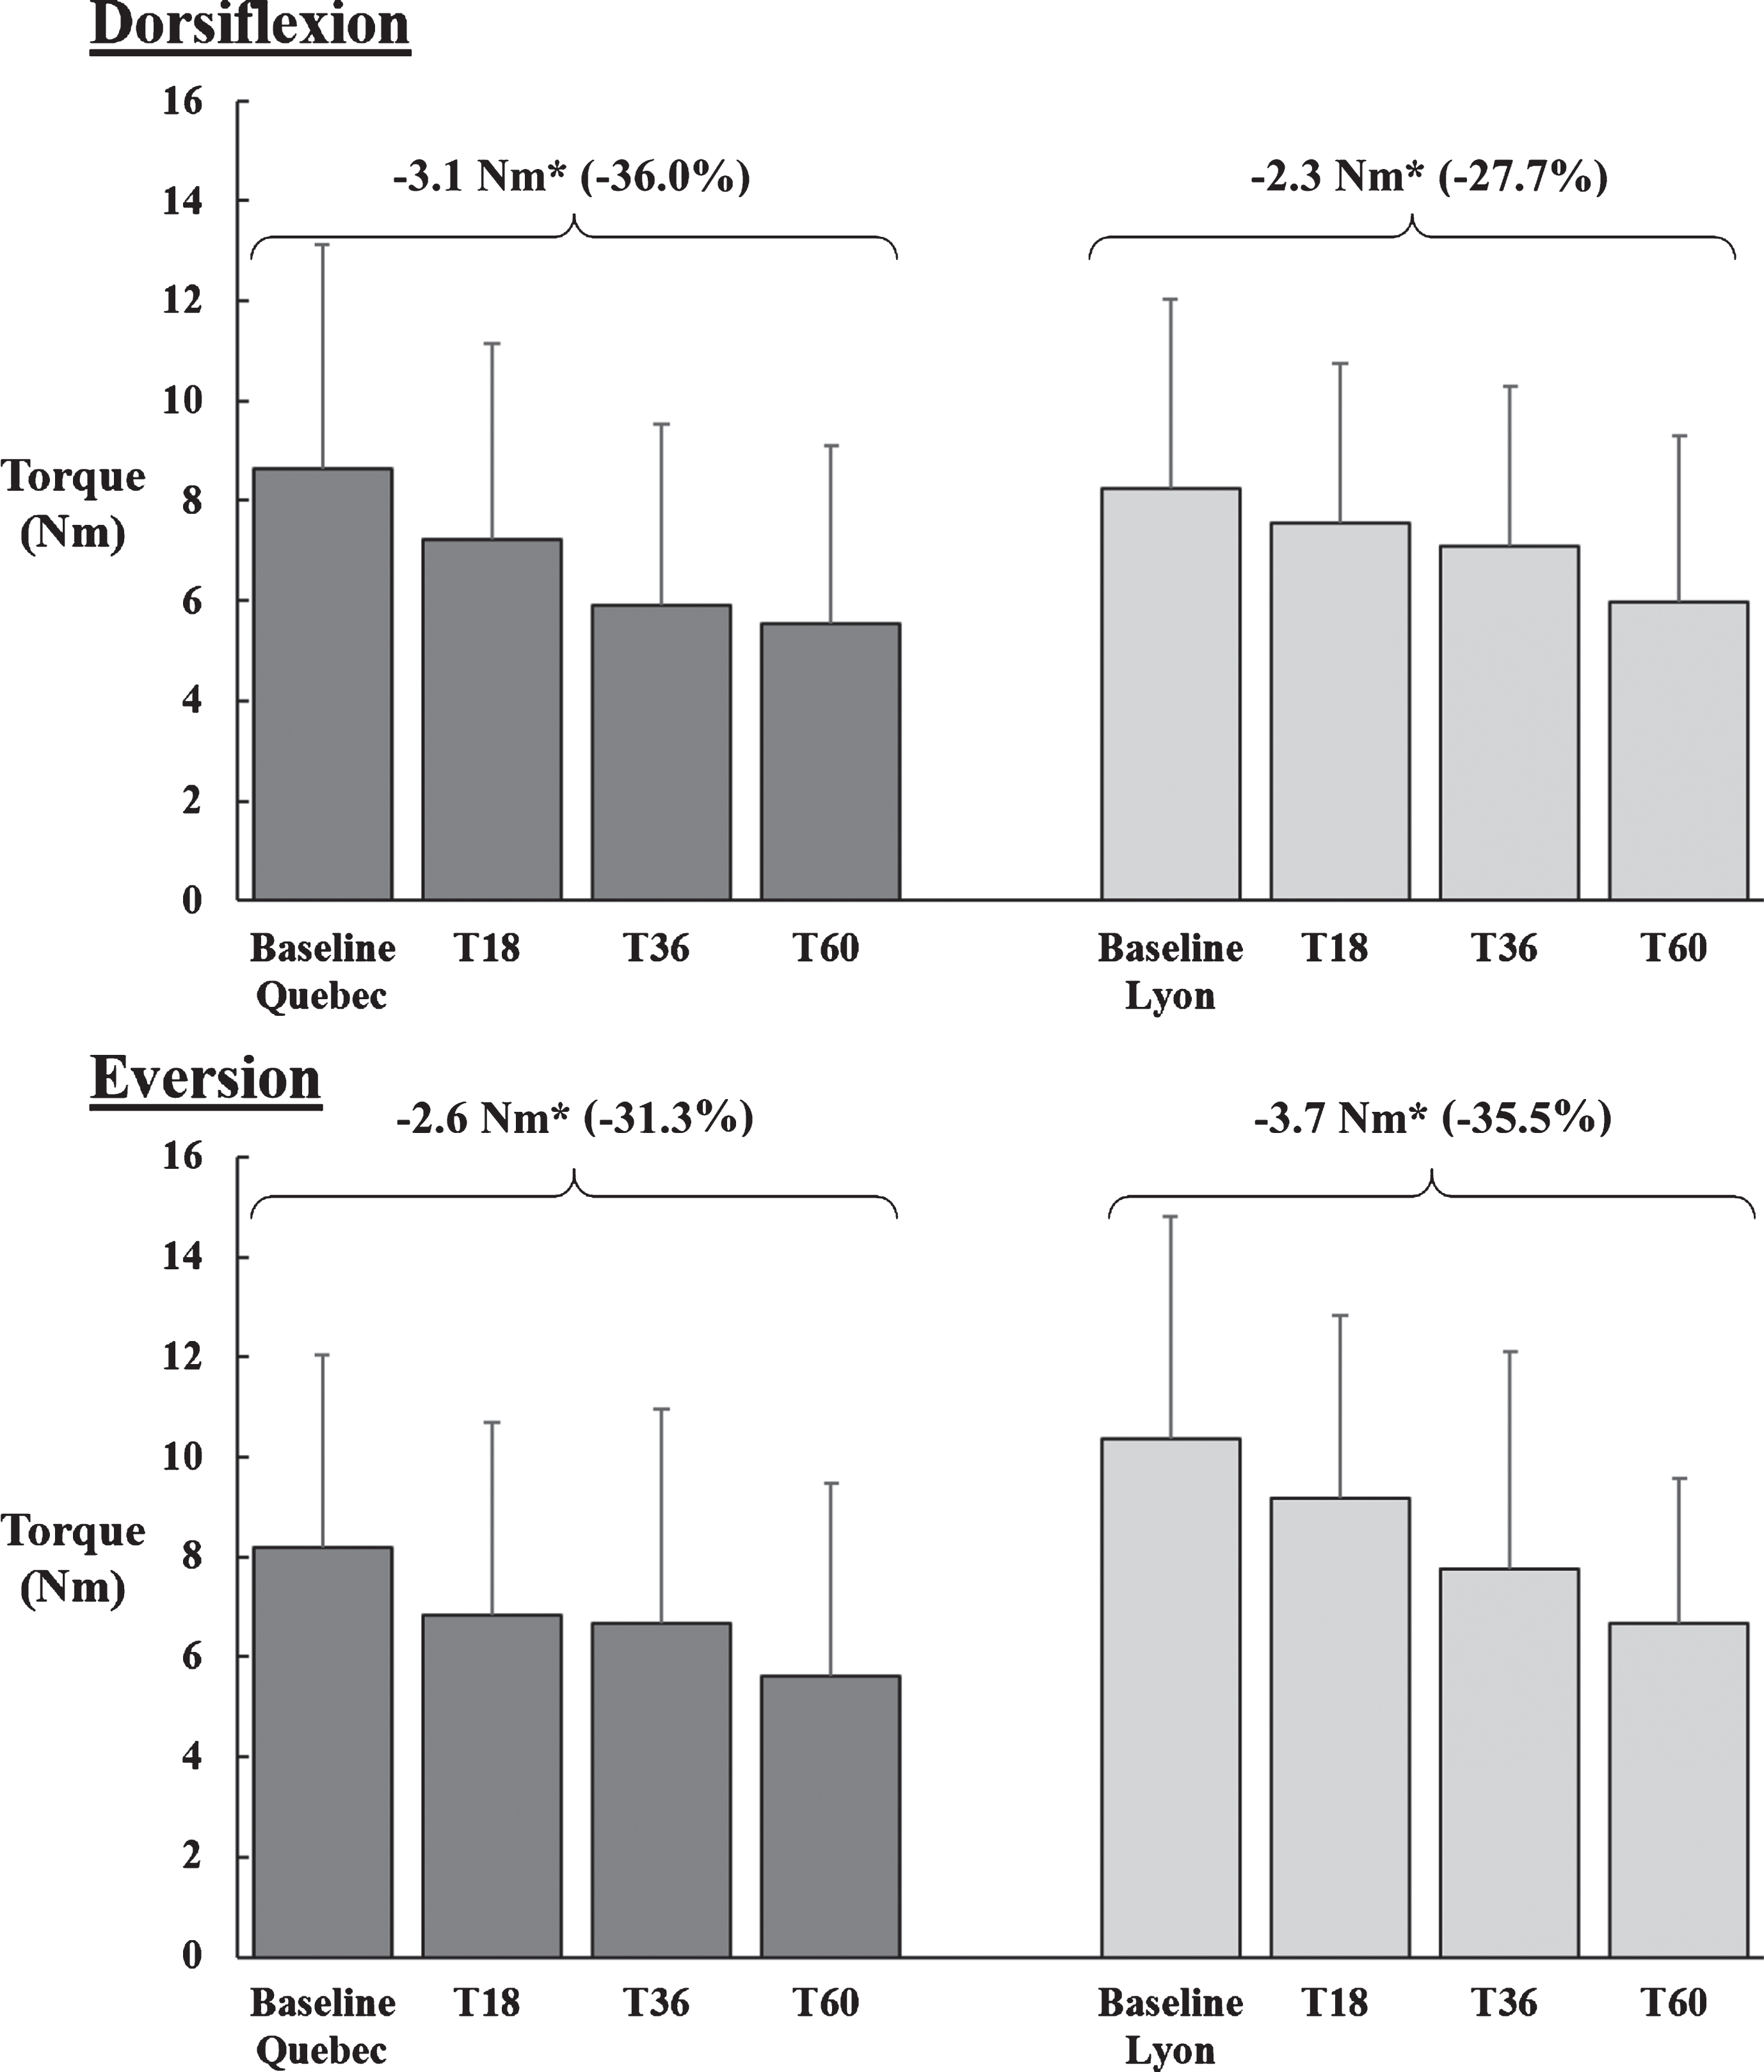
Mean maximum isometric muscle strength in Nm and corresponding standard deviations in dorsiflexion and eversion at baseline, 18 (T18), 36 (T36) and 60 (T60) months. The significant differences between baseline and T60 are indicated by an asterisk (* = p < 0.05).

Torque changes in Nm in dorsiflexion () and eversion ( ) at 5 years (Y axis) for the series of ankles measured from baseline to 5 years (X axis). The grey area represents the widest SEM of 1.3 Nm for the eversion, which is inclusive of the dorsiflexion SEM of 1Nm. The negative values indicate the loss of strength in Nm relative to baseline.
As seen in Fig. 3, a correlation was found between strength at baseline and the total loss of strength over 5 years. When looking at the loss of strength in percentage at five years (Fig. 3b), there was a positive relationship between the strength at baseline and the percentage of strength lost 5 years later for both DF (rp = 0.58; R2 = 0.33; p < 0.05) and EV (rp = 0.40; R2 = 0.16; p < 0.01). This relationship is stronger when looking at the strength loss in absolute values in Nm (Fig. 3a) but mainly for the DF (rp = 0.67 / R2 = 0.45 p < 0.01) compared to EV (rp = 0.69 / R2 = 0.07 p < 0.01); the stronger the subject at baseline in DF, the more important the absolute loss of strength at 5 years in Nm.

 )(rp = –0.27; rp = 0.40).
Only 13 participants of the Quebec cohort performed the 6MWT. The mean difference in the total distance walked between baseline (T1) and follow-up (T60) was 17.7 m. A trend, but no significant association, was found between strength at T60 and the total distance walked, stronger subjects walking a longer distance (DF rs = 0.51, p = 0.074; EV rs = 0.50, p = 0.086).
Comparison of HHD and MyoAnkle methods
As seen on Fig. 4, DF torque measures taken by both HHD and MyoAnkle methods were highly correlated at T36 (rp = 0.97, p < 0.001) and T60 (rp = 0.98, p < 0.001) and, consequently, the torque differences between these two time periods as measured by the two methods was also highly correlated (rp = 0.99, p < 0.001). Bland & Altman plots of the data obtained from all paired samples of ankle dorsiflexor strength tested with the HHD and the MyoAnkle were analysed. As seen on the Fig. 5, most of the differences between the two methods of measurement (HHD and MyoAnkle) remain within±2 Nm, and the difference between the two methods does not increase when higher forces values are measured. The variability seems consistent across the graph as shown by the scatter around the mean difference.
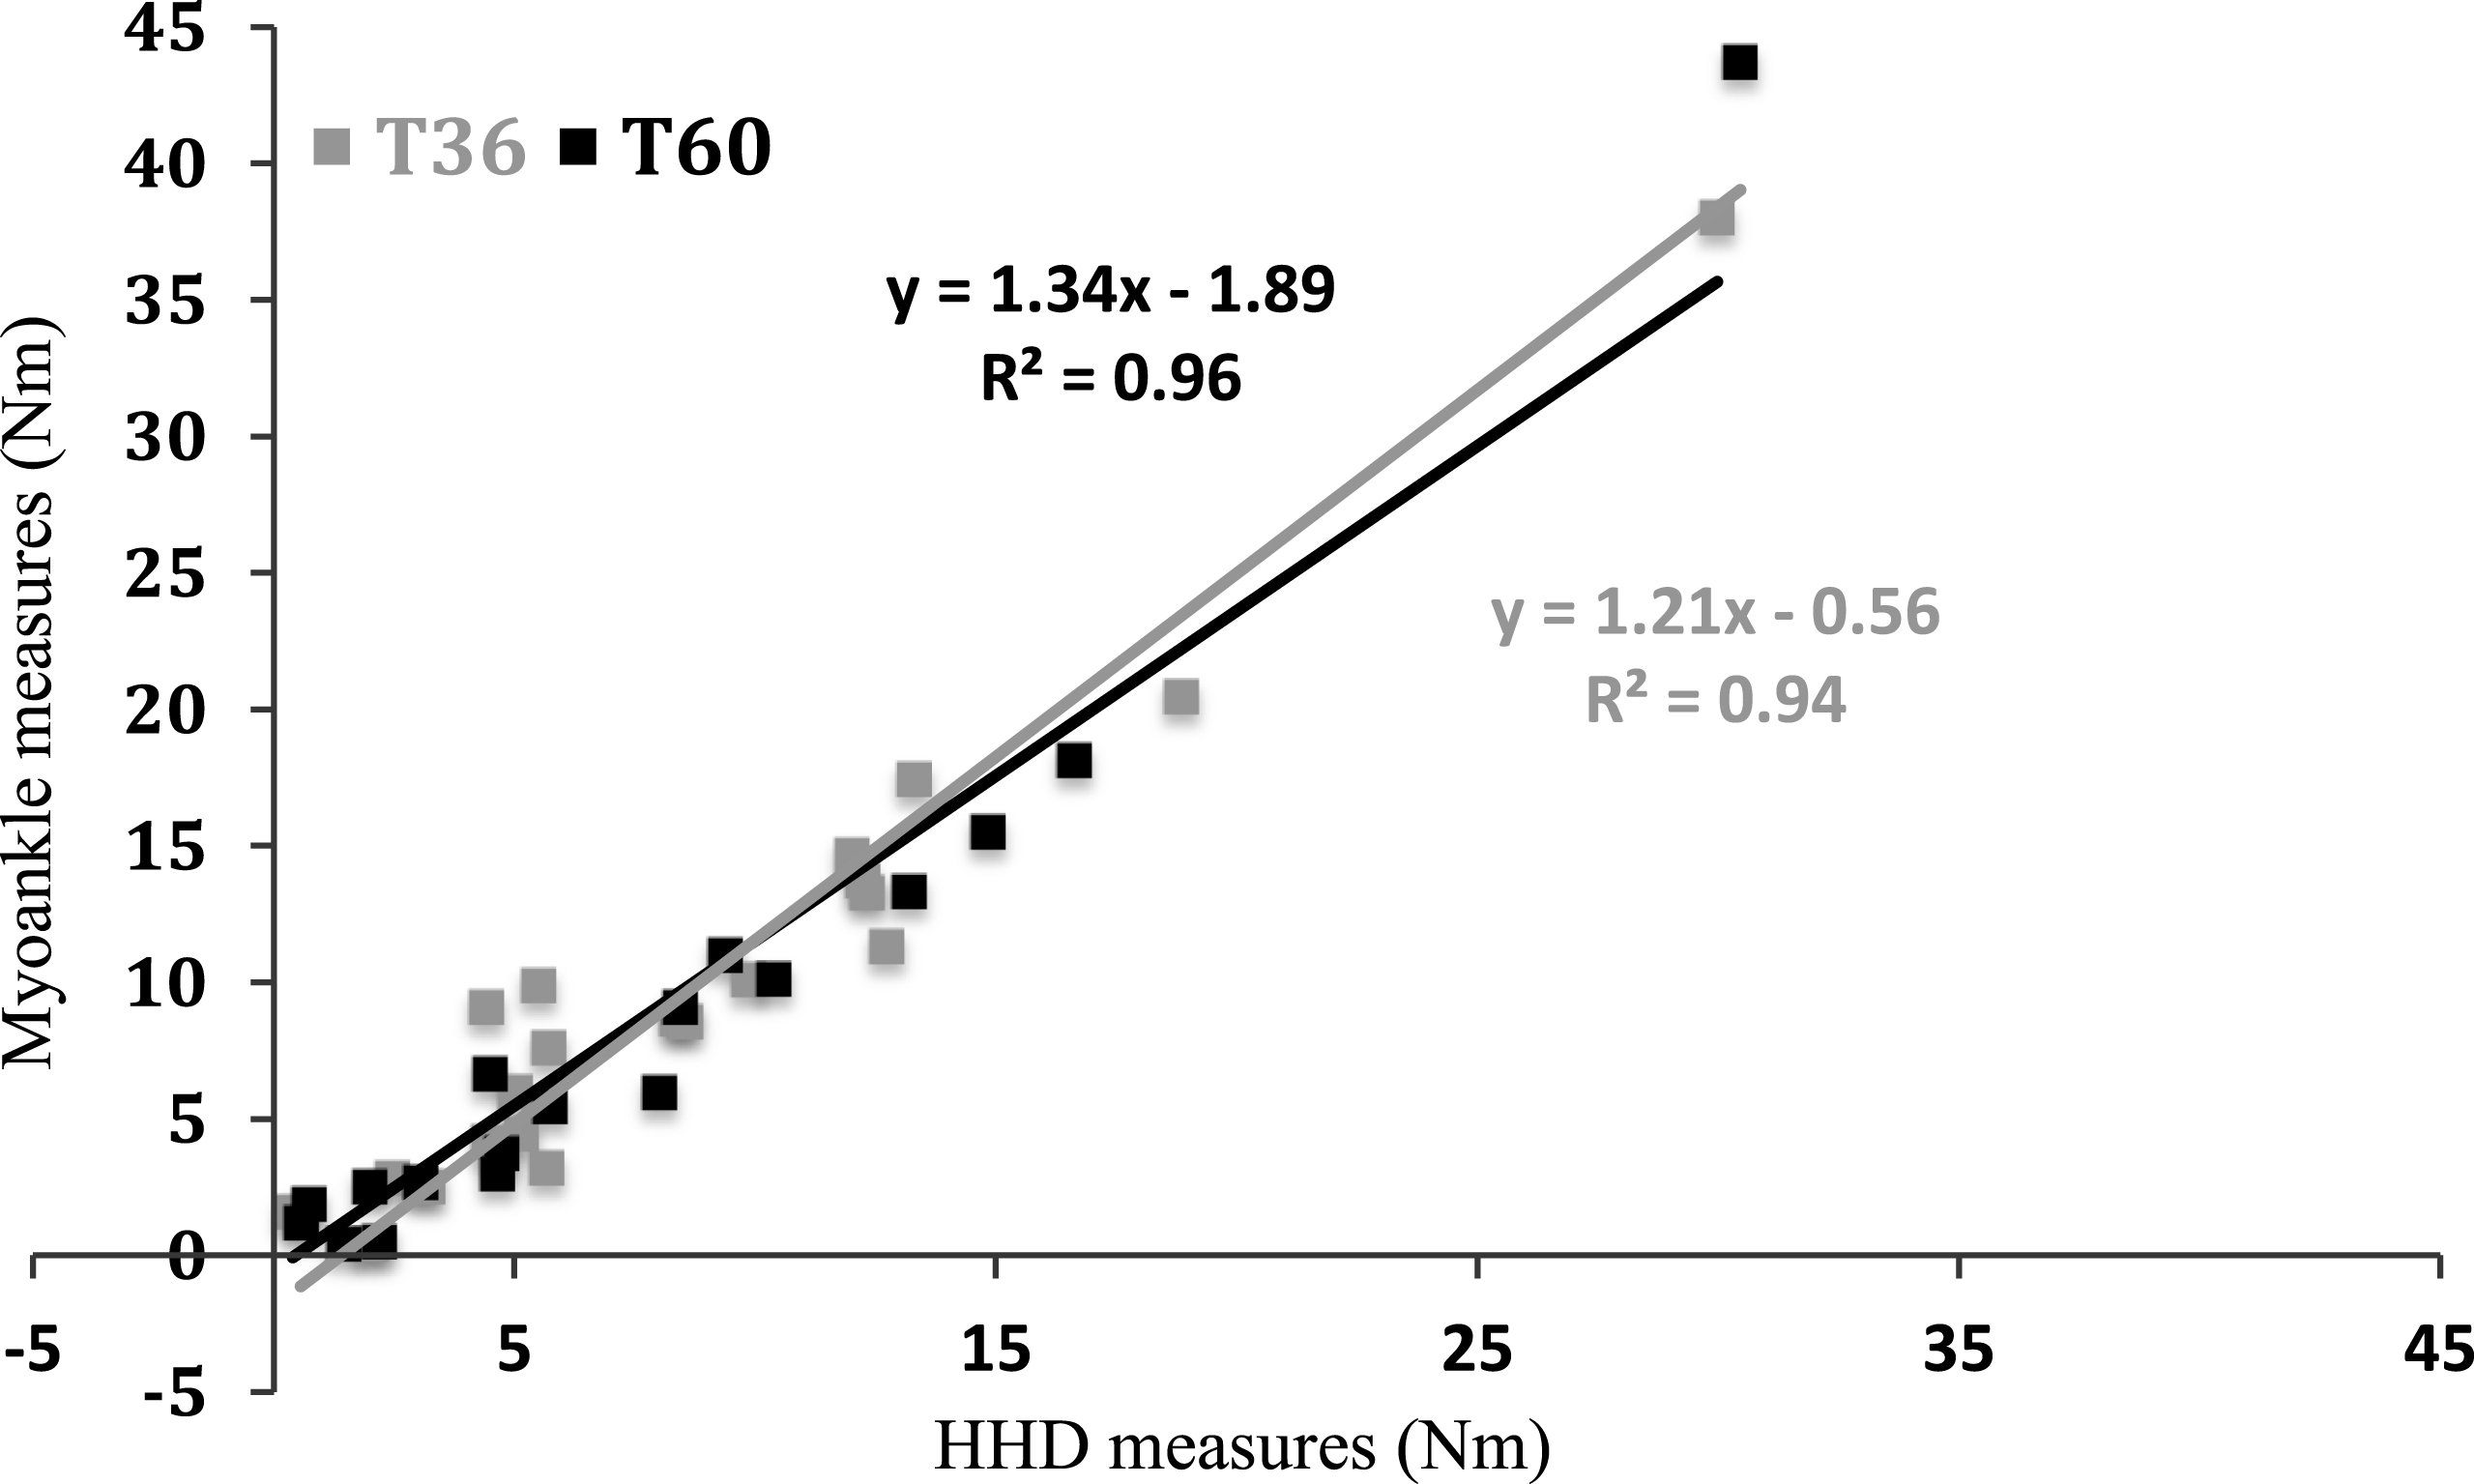
Relationships between the HHD protocol (X axis) and the standardized force plate system (Y axis) for the ankle dorsiflexors for Quebec as estimated with simple linear regression. The equation and coefficients of determination R2 are indicated.
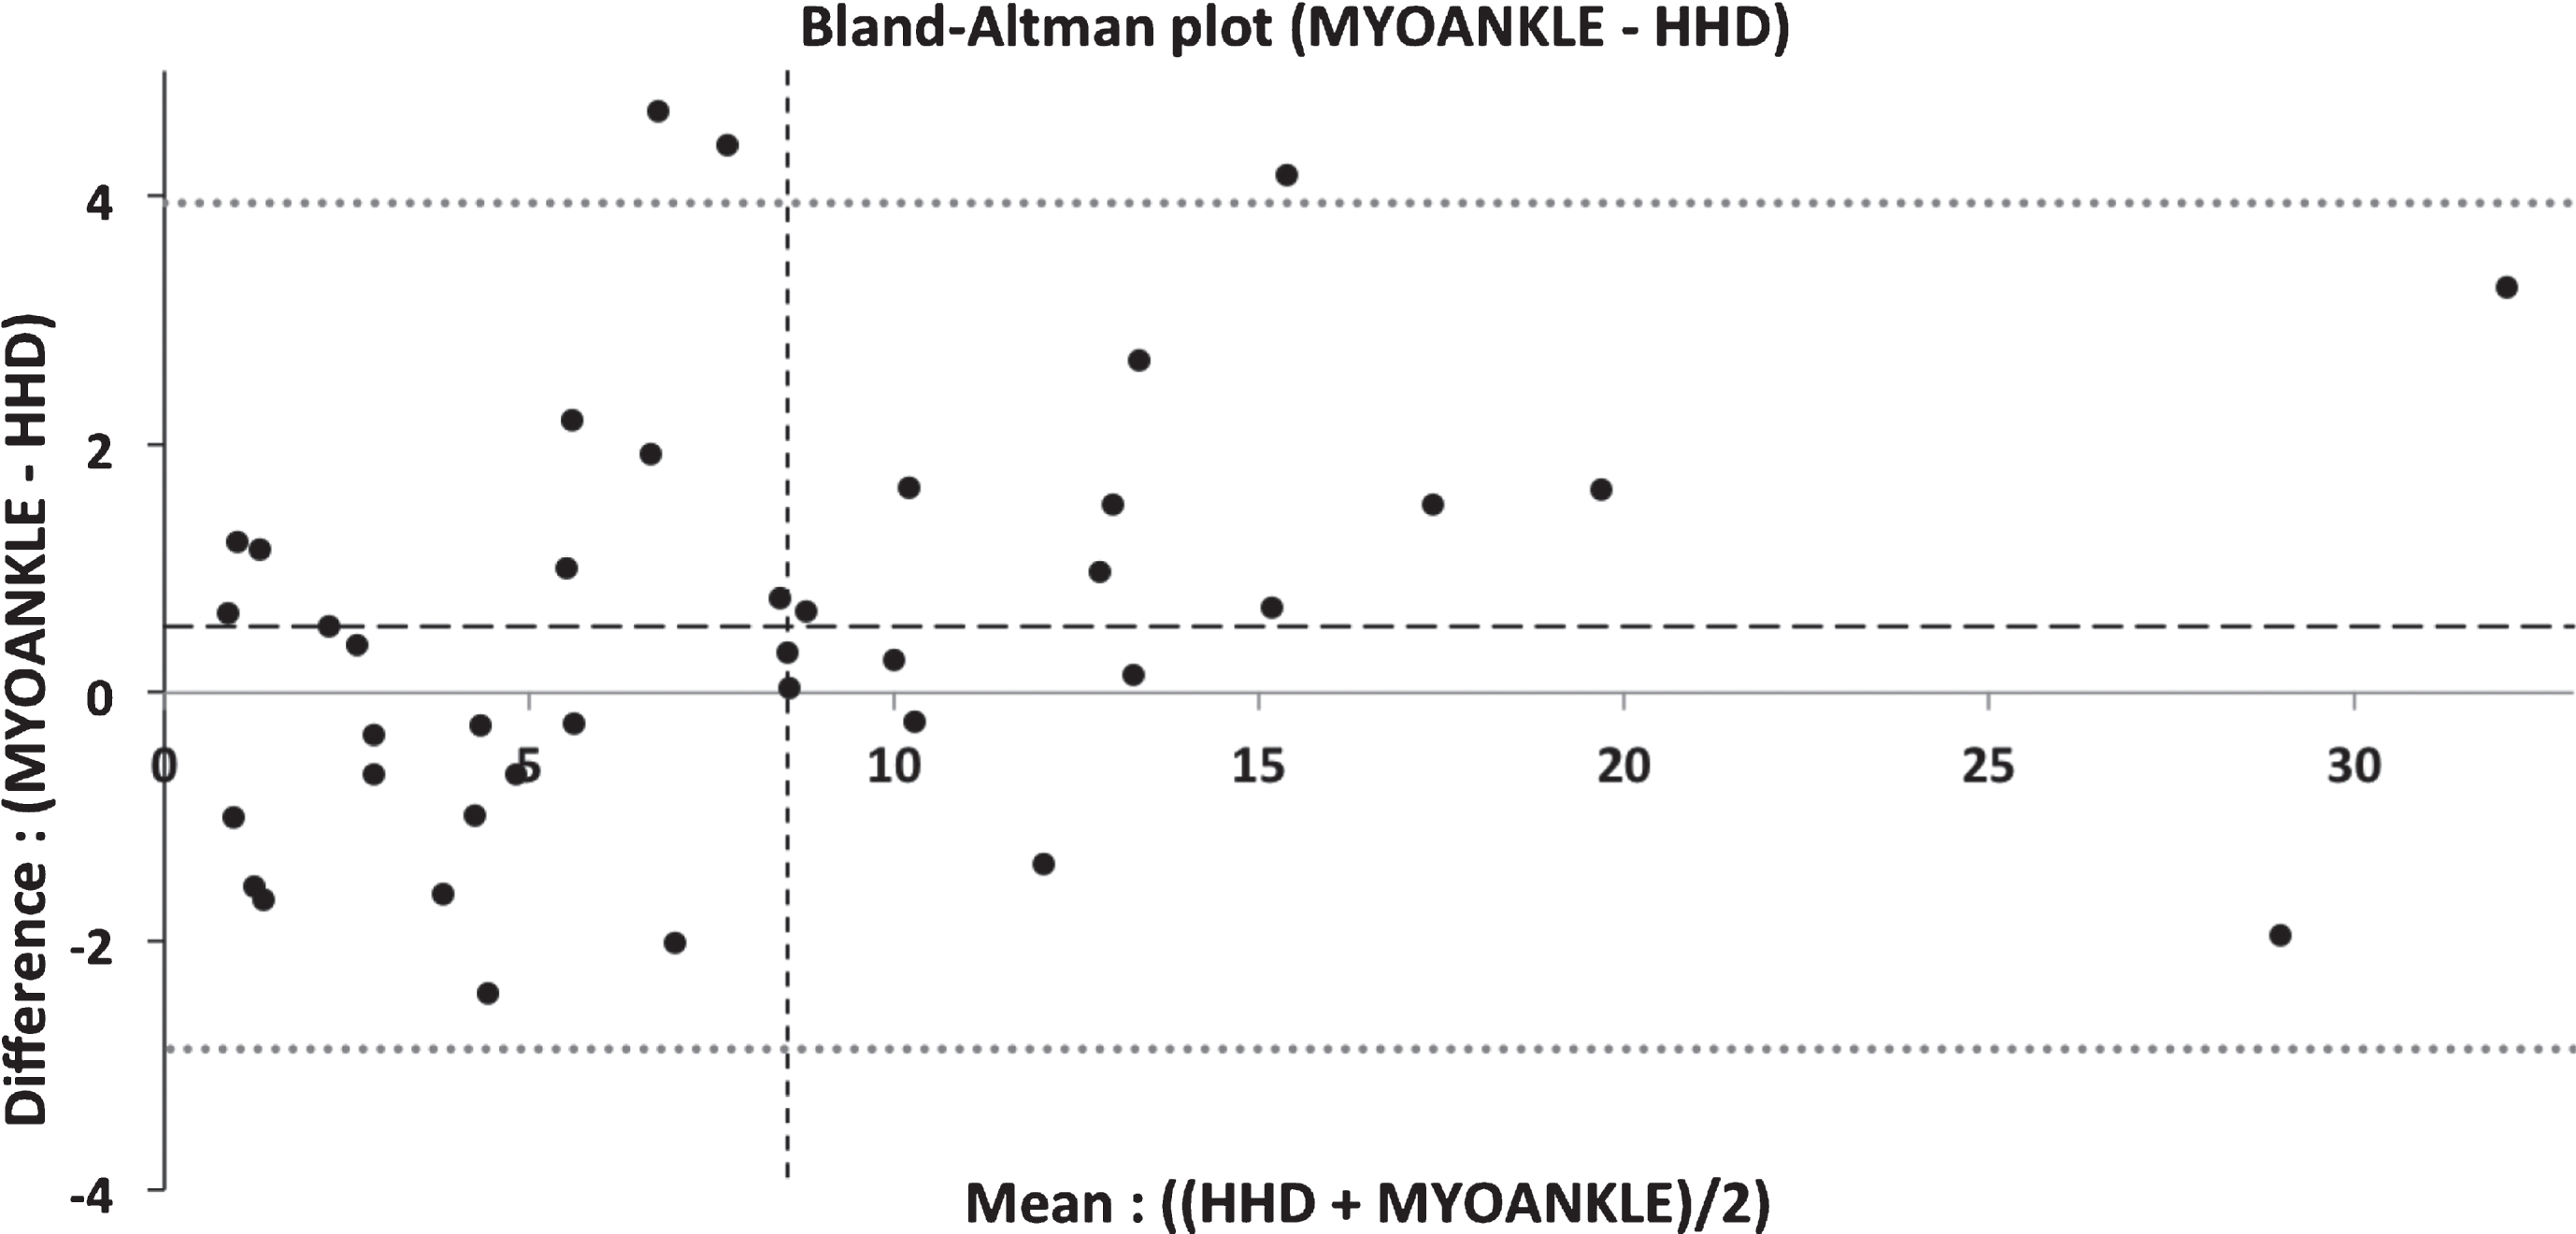
Bland-Altman plots of the data obtained from all paired samples of ankle dorsiflexion (DF) strength tested with the HHD methods and the MyoAnkle. The data reported is for T36 and T60. The central dotted line and the two upper and lower dotted lines on the figure represent the mean of the differences between the two methods and the mean±2 standard deviations, respectively. The X-axis indicates the mean DF strength from both methods for each participant while the Y-axis shows the DF strength differences between the two methods for each participant.
DISCUSSION
DM1 is a complex disease with a large spectrum of symptoms and impairments, but strength loss is a major one. Loss of isometric muscle strength at the ankle in both DF and EV was never documented over a 5-year period using quantitative hand-held dynamometry. Mathieu et al. have estimated the overall loss of strength to be between 1 and 3% per year. In the present study, although the loss of strength was not linear, the mean lost was estimated of being about 6% per year [9]. Hammaren et al. also reported ankle DF muscle strength loss over a five-year period using a HHD (Mecmesin Basic Force Gauge 1000N, Chauvin Arnaux Group) [12]. The changes reported by this group relative to baseline force were median –6% to –18% overall and the decline was most pronounced in the ankle dorsiflexor muscles, with a mean decrease of 12%. However, in their study, they did not use a true isometric method but they rather used the “break” method, which is known to be less reliable and putting participants at a higher risk or injuries than make tests [17, 18]. Also, using the break test implies that the evaluator is pushing with a force that exceeds that of the person being evaluated, resulting in a break test (eccentric condition) and therefore a higher production of force [17, 19]. The large variability in the data reported by in Hammaren’s study may also be explained by the variability in the exact placement of the dynamometer. In their study, Hammaren et al. measured force in Newton. However since the exact dynamometer location was not detailed, it is difficult to determine if it was indeed placed at the exact same spot each time. Even a small change in the length of the lever arm would directly impact on the force produced in Newton by the patient, especially at the ankle, as the lever arm is fairly small. Reporting force in Newton does not take into account the lever arms and does not allow a proper comparison between studies and even between subjects within the same study. Unfortunately, our two protocols being much different, it is not possible to compare the values obtained although the main common finding remains a significant loss of ankle DF strength over a five-year period.
Strength loss values observed for ankle DF and EV in most of participants with the HHD were beyond the SEM reported for these two muscle groups, meaning that changes observed in strength reflect a true clinical change in the participants’ condition. The use of a valid and reliable protocol to detect low sub-maximal muscle impairments in DM1 patients is essential to characterize the natural history of muscular involvement and measure the efficacy of short-term therapeutic trials in multicenter studies. The method used to assess muscle strength must be simple, easily standardizable, reliable (repeatable and reproducible), with no floor and ceiling effects. It must be easy to perform for the clinician and it must be sensitive enough to allow the early detection of muscle weaknesses. Assessment of ankle muscle strength has been shown to be an effective and accurate measure, in addition to be simple and feasible in research as well as in clinical settings. Results obtained with this method highlight the relevance to also use it in clinical trials, where the capacity of instruments to detect small changes is crucial for the success of these studies.
Another important point to take into consideration is that clinical trials usually take place on multiple sites. In this study, results showed that loss of muscle strength at the ankle was similar between both cohorts at two different sites (Quebec and Lyon). The HHD method has proved to be a good way to assess small changes during multi-site study, provided that the assessment protocol is highly standardized (participant and dynamometer positions, instructions, etc.). Based on the current results, if we consider that a significant clinical change of ankle DF strength over 18 months should be of 2 Nm (twice the SEM), it would require a sample size of 34 patients to obtain a statistical power of 80%, with a type one error of 0.05 and a medium effect size of 0.5 (G*Power 3.1.7).
The moderate to strong relationship between the muscle strength at baseline and the total loss of strength at 5 years highlights the importance of being able to identify the most susceptible patients to rapidly losing muscle strength, particularly in the context of future therapeutic trials. The present results do not allow us to conclude that systematically, for all muscle groups, the strongest patients at baseline, will always lose more strength (in absolute values) but clearly, for the ankle DF, the strongest patients at baseline are the ones that are losing more strength 5 years later. In terms of percentage, the mean loss of DF strength at 5 years for the two sites was 31.9% and for some patients, the magnitude of loss was reaching as much as 50 to 79% of the initial strength. Although the relationship baseline strength-loss of strength at 5 years does not seem as strong for the ankle EV, the mean loss of strength at 5 years for this muscle group for the two sites was in the order of 33.4% indicating a significant impairment. Stronger patients are more prone to lose strength in absolute values but when related to their remaining strength, weaker patients lose more strength when expressed in relative values. This has already been observed in other neuromuscular disorders [20]. Surprisingly, these important impairments at the ankle did not translate into a significant lower distance covered during the 6MWT at 5 years compared to baseline. The present study only reporting muscle impairments at the ankle, it may be suspected that other proximal muscles such as the hip flexors could have provided an efficient compensating mechanism to maintain a good physical performance to the 6MWT.
In this study, we compared the HHD and MyoAnkle methods. Results showed similar results using the two methods. As shown on the Fig. 5, the average discrepancy between methods is fairly low with a difference of 0.53 Nm, a value that is not large enough to be considered clinically important. The limits of agreement (dotted lines) are narrow but very slightly skewed towards the positive values, which suggest that the MyoAnkle method may provide values slightly higher than the HHD method. This small difference may be explained by the difference in the knee joint angle (extension in HHD versus 90 of flexion for the MyoAnkle) and patient positioning during the tests, which may allow for a better heel support for the patient. However, overall, the points on the Bland-Altman plot of the HHD and the MyoAnkle methods are scattered above and below zero, which suggests that there is no consistent bias of using one approach versus the other for measuring the ankle DF strength. The variability is also consistent across the graph, as the scatter around the bias line does not get larger as the average gets higher.
The MyoAnkle method is novel and very promising since it allows minimizing the impact of the evaluator on the results. This device also allows for the assessment of the ankle plantarflexors, which is not currently possible with the HHD method. It also allows a high standardization of the protocol that is easy to reproduce requiring a minimal training for the evaluators. This equipment, although available upon request, is however not yet commercially available, it may require calibration and is a dynamometer system that can only be used for the ankle DF and plantarflexion. On the other hand, the use of a HHD requires a specific training and a sufficient learning curve to ensure the evaluator has fully integrated the proper skills set. The HHD used must also offer the optimal ergonomic design to ensure an efficient use for all muscle groups. However, the HHD is simple to use, fairly inexpensive, and since it is commercially available, all sites can acquire the same device and receive the same training. The push-pull HHD in combination with the use of non-elastic straps can also be used to assess all muscle groups of the upper and lower limbs [15].
CONCLUSION
Over a short period of time, muscle strength changes at the ankle in DM1 can be detected using a standardized and quantified muscle strength assessment protocol. The profiles of muscle strength changes overtime measured in the present study in Quebec and Lyon are very comparable, suggesting that a standardised HHD protocol with known SEM can be use with confidence for multicentre studies. The chosen method should be dictated by the objective of the research project, the equipment available, the research design and the muscle groups targeted. Using different quantitative methods may allow drawing similar conclusions although the methods may not be implicitly interchangeable.
CONFLICT OF INTEREST
The authors have no conflict of interest to report.
Footnotes
ACKNOWLEDGMENTS
The authors would like to thank all patients who participated in this study and their relatives as well as the French Myotonic Dystrophy group (AFM) and the Réseau de Médecine Génétique du Québec (RMGA). This work was supported by a grant from the AFM-Téléthon (France) to Dr J. Puymirat. We also would like to thank the retired physiotherapists Joanne Saulnier (Canada) and Jean-François Remec (France) who recorded the muscle strength.