
Abstract
Making decisions based on data is evolving in higher education worldwide. Higher education institutions (HEIs) in China are also adopting this trend of data-driven decision making to improve the quality standards in higher education. However, the data-driven decision making (DDDM) approach has recently evolved in China, and the data based decision-making models are still immature. Therefore, this study investigates the DDDM approach of Chinese HEIs through an established theoretical data model lens to highlight some of its immaturities and weaknesses for improvement. The study analyzes the DDDM approach in Chinese higher education by exploring the data-mining practices of a case study university. A leading Chinese university has been taken as a sample case study. The multiple interviews have been taken at both faculty and university levels to explore the DDDM practices. The results suggest that the Chinese university DDDM approach is consistent with the established Bakers model. However, the scope of data mining is limited in some areas when compared with the theoretical model. The university is also behind in using advanced applications and software required for DDDM. The results of this study highlight the DDDM approach in Chinese higher education and some of its immaturity. The results can be used to improve the DDDM approach in Chinese HEIs further to ensure more effective and efficient decision-making.
Introduction
Data-driven decision making (DDDM) is a new approach for making decisions based on data instead of human judgment (Namoun & Alshanqiti, 2020). The trend of DDDM was introduced in the business environment where business organizations were making informed decisions based on data (Jarke & Breiter, 2019). This technique proved effective for businesses in gaining a comparative advantage by making more accurate and effective decisions (Frick, 2014). According to McAfee et al. (2012), businesses making decisions based on data made more profits than other businesses. Rapid digitization worldwide also creates a feasible environment for the DDDM approach (Li & Zhai, 2018). Due to its effectiveness, several Higher Educational Institutions (HEIs) also adopted this trend and introduced various kinds of DDDM systems and models in academic settings (Jones et al., 2020; Nguyen et al., 2020).
The DDDM trend in HEIs is increasing in China (Ru, 2022). The internal structure of higher education in China are undergoing unprecedented profound changes since the last decade (Piracha et al., 2022). The management adopting new data based approaches for decision making (Sahibzada et al., 2022). The introduction of DDDM in the academic environment also proving effective in ensuring the quality of management decisions (Teng et al., 2022). Various Chinese HEIs have adopted different DDDM models to make informed decisions based on data in the academic environment (Bian & Wang, 2021). However, as the DDDM approach in Chinese HEIs has recently evolved, the models of DDDM in Chinese HEIs are still immature (Yafeng et al., 2021). Therefore, this study analyzes the Chinese HEIs approach of DDDM to understand and highlight weaknesses by investigating the decision making practices of a case study university. The DDDM practices of a Chinese university are compared with the Bakers model for HEIs. The Bakers model of DDDM is a standardized model of decision making for HEIs, and using this model as a lens would help in understanding the deficiencies presented in the DDDM approach of Chinese HEIs.
Study Objective
The study is centred on analyzing the DDDM approach used in Chinese higher education. The study’s key purpose is to analyze the level of the DDDM approach used in the Chinese HEIs and to highlight immaturities and weaknesses to make suggestions for improvement. Therefore, this study analyzes the DDDM approach of HEI with an established model of DDDM known as the Bakers model. This model is well established and used in the western higher educational context and is considered one of the best models of DDDM for higher education. Analyzing the DDDM approach of Chinese HEIs through the lens of Bakers model highlights certain immaturities and weaknesses currently present in the Chinese higher education system, and improvement on these weak areas will further improve the DDDM approach of Chinese HEIs in future.
Literature Review
Data Trend in Education
The role of data in educational decision-making is increasing worldwide (Kalim, 2021). To catch up with this trend, educational institutions are developing new models and methods to create and store various kinds of data (Wang, 2016). As a result, many HEIs collect data regularly using different systems (Gummer & Mandinach, 2015). However, the data gathering systems allow the administration to have more data about different aspects of HEIs, which does not necessarily mean that this data alone will lead to improvement (Pardos, 2017). Marsh and Farrell (2015) imply that data alone does not guarantee effective decision-making. The effective and efficient utilization of these data requires HEIs to use proper analysis and actions framework to get a better outcome, i.e., student outcome, improvement in instruction, and academic publications (Nguyen et al., 2020). This necessitated the trend of developing and adopting different data modelling paradigms (Li & Zhai, 2018).
Evolution of the DDDM Approach
Over the years, various kinds of DDDM models and frameworks have been introduced for HEIs (Gill et al., 2014; Romero & Ventura, 2007). In the beginning, most of the DDDM models for HEIs were used in a limited scope, i.e. forecasting student numbers, monitoring and evaluating students and faculty attendance (Hung et al., 2012; Mandinach & Gummer, 2015). These systems helped evaluate the performance of staff and faculty and identify the need for new classrooms and programs in the near future (Scheffel et al., 2014). However, the basic models offered little benefit to the HEIs as these systems were not designed to have a clear data visualization format for various levels of decision-making (Jones, 2019). Hence, researchers have proposed different frameworks and models to be used more effectively in HEIs (Gill et al., 2014; Romero & Ventura, 2007).
Various studies in the past have listed the steps and process of transforming data for decision making, i.e. models for data use (Earl & Katz, 2006); the data team procedure (Schildkamp & Handelzalts, 2011); and the data-wise improvement process (Boudett & Steele, 2007). Lai and Schildkamp (2013) gave a comprehensive framework for educational data transformation. Figure 1 depicts the process framework given by the authors: Process of data transformation.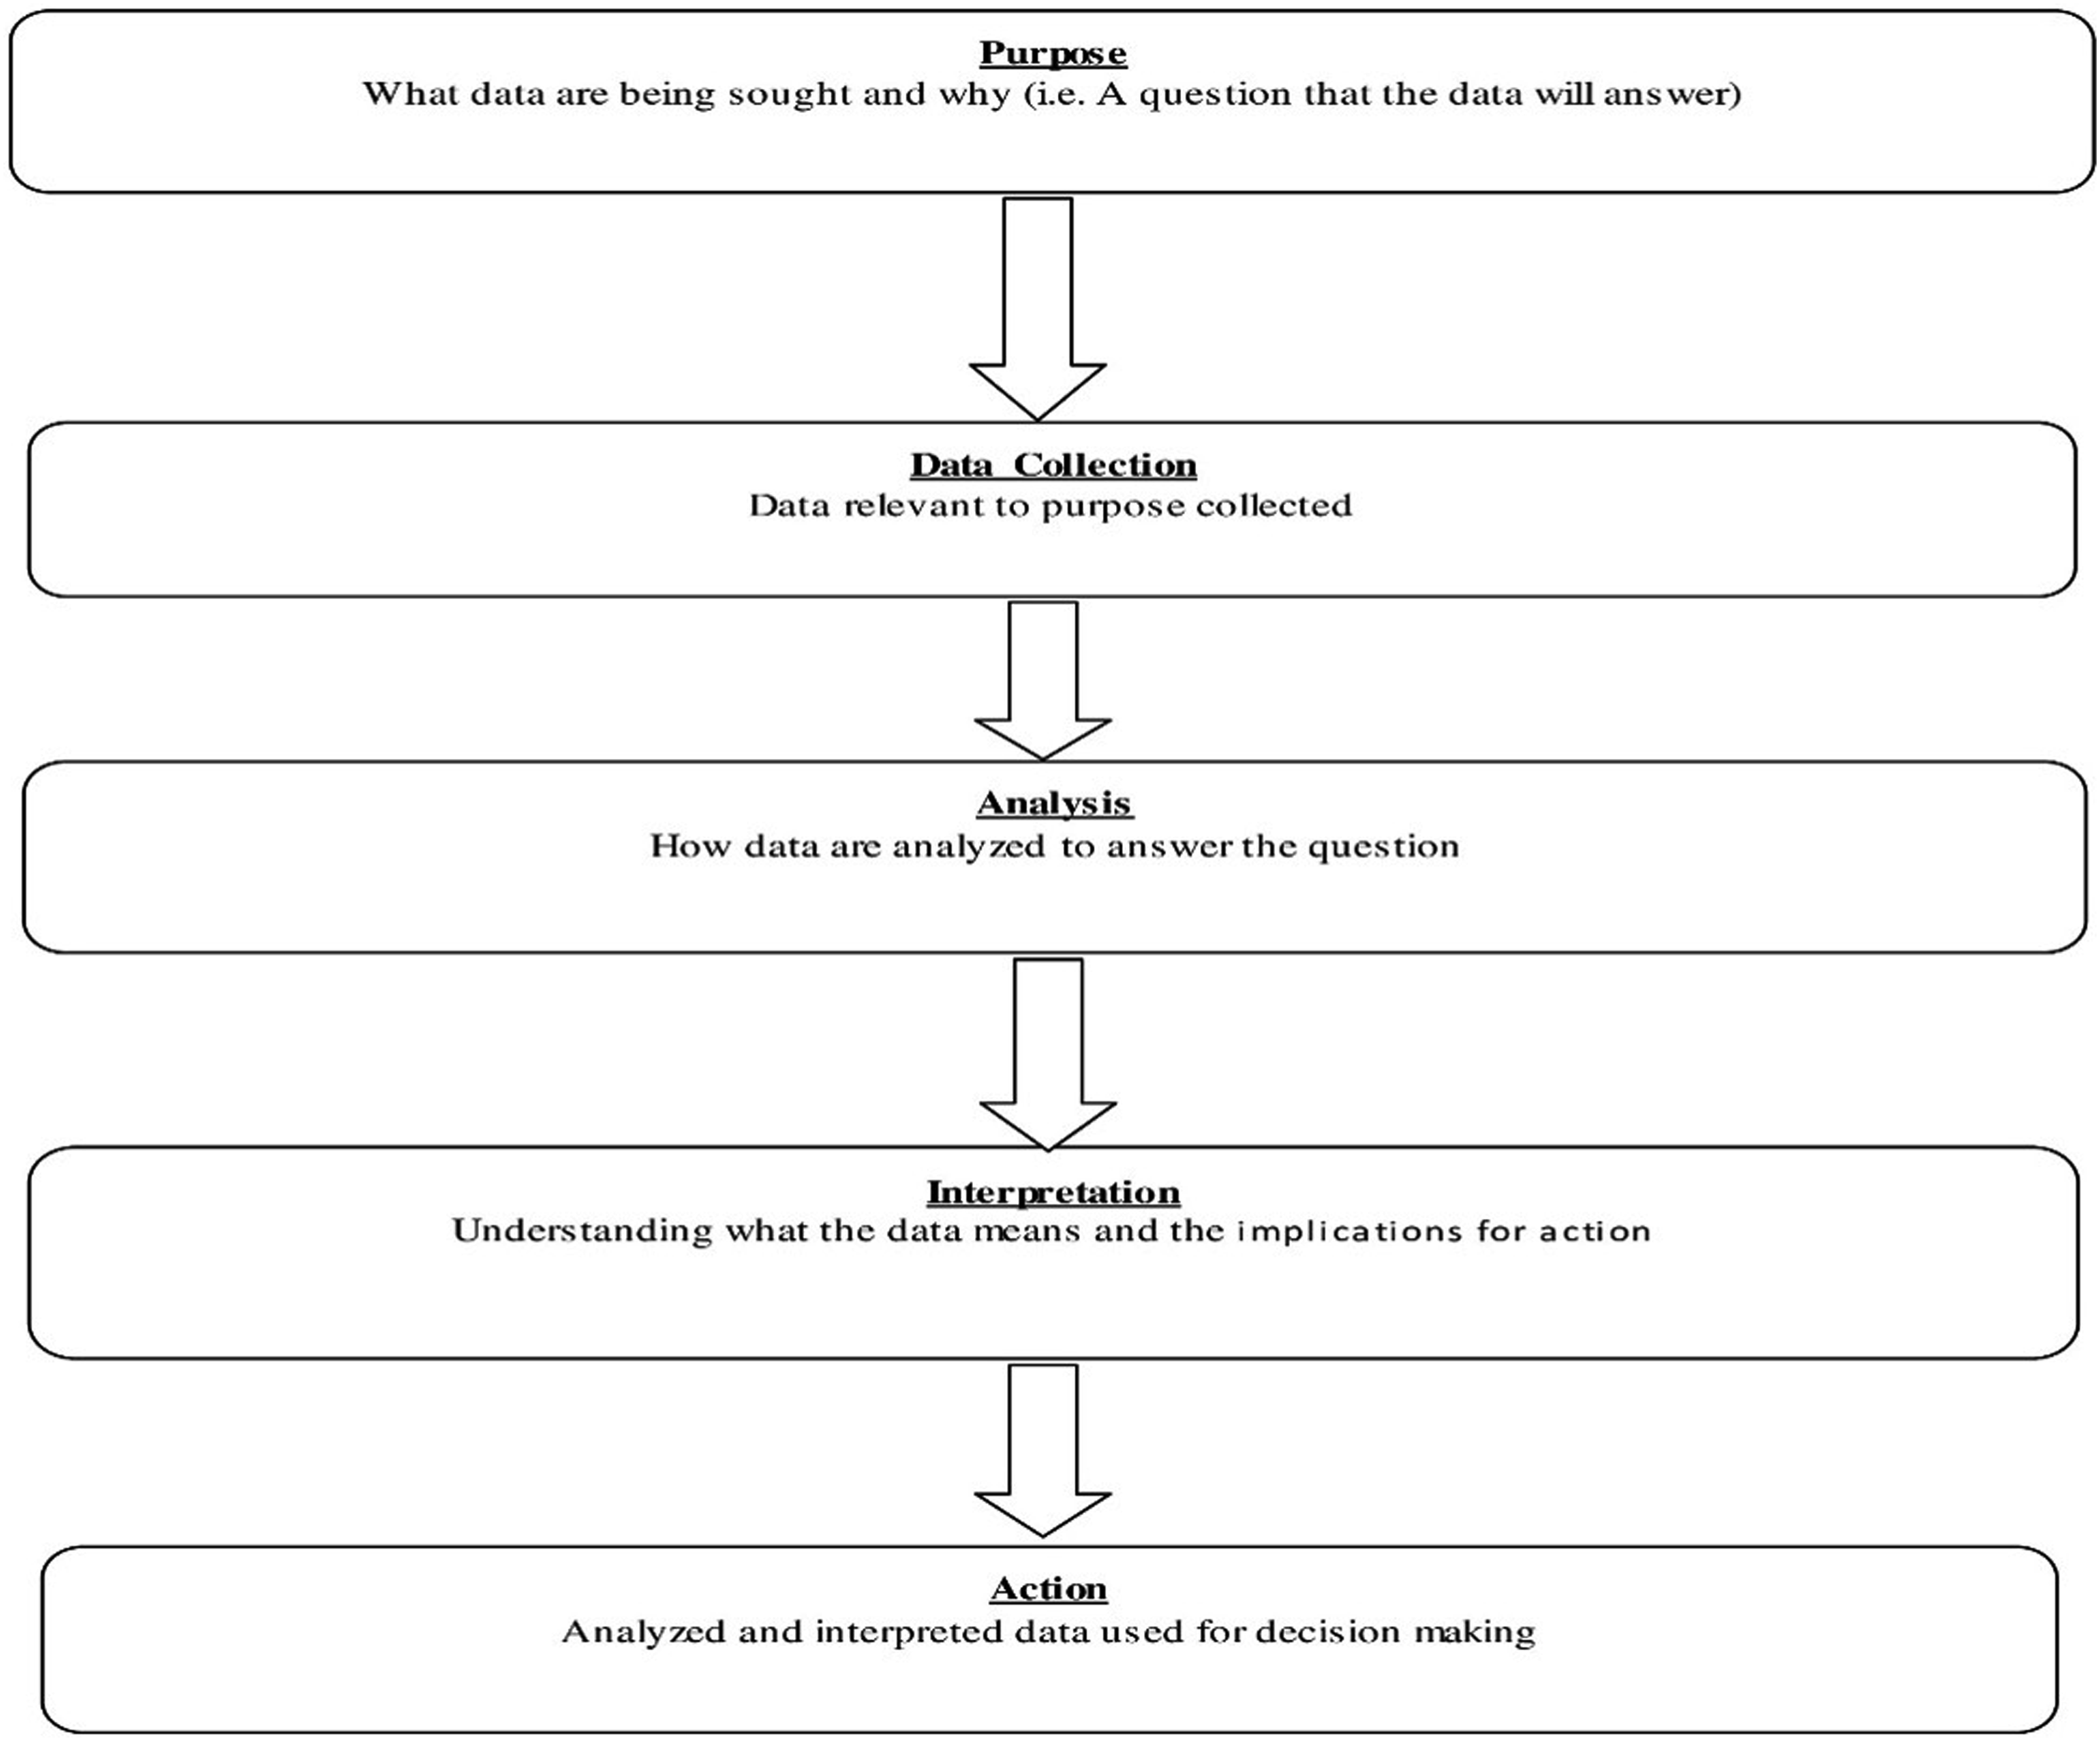
As depicted the Figure 1, the data transformation process begins with a clear purpose of what data are being sought and why. The second step is to collect the data as required. The third stage is to analyze the data for the purpose of making information from this raw data. The fourth step is to interpret the generated information for decision-making. Finally, the actions are taken, and the results are evaluated based on these actions. This comprehensive process framework describes the process of taking action based on data step by step. However, how to collect data and how and what kind of analysis needs to be done needed more frameworks ad models.
As the applications of data usage increase in the educational environment, many systems have been adopted by HEIs to collect more data regarding different entities (Marsh & Farrell, 2015; Udupi et al., 2016). However, the effective utilization of educational data for decision-making requires action frameworks. (Kerr et al., 2006). Various researchers have given different kinds of DDDM frameworks for more effective data analysis in the HEI context (Gill et al., 2014; Romero & Ventura, 2007). Below is the Figure 2 is an example of the action framework of Data for HEIs: Applying data analysis in educational institutions.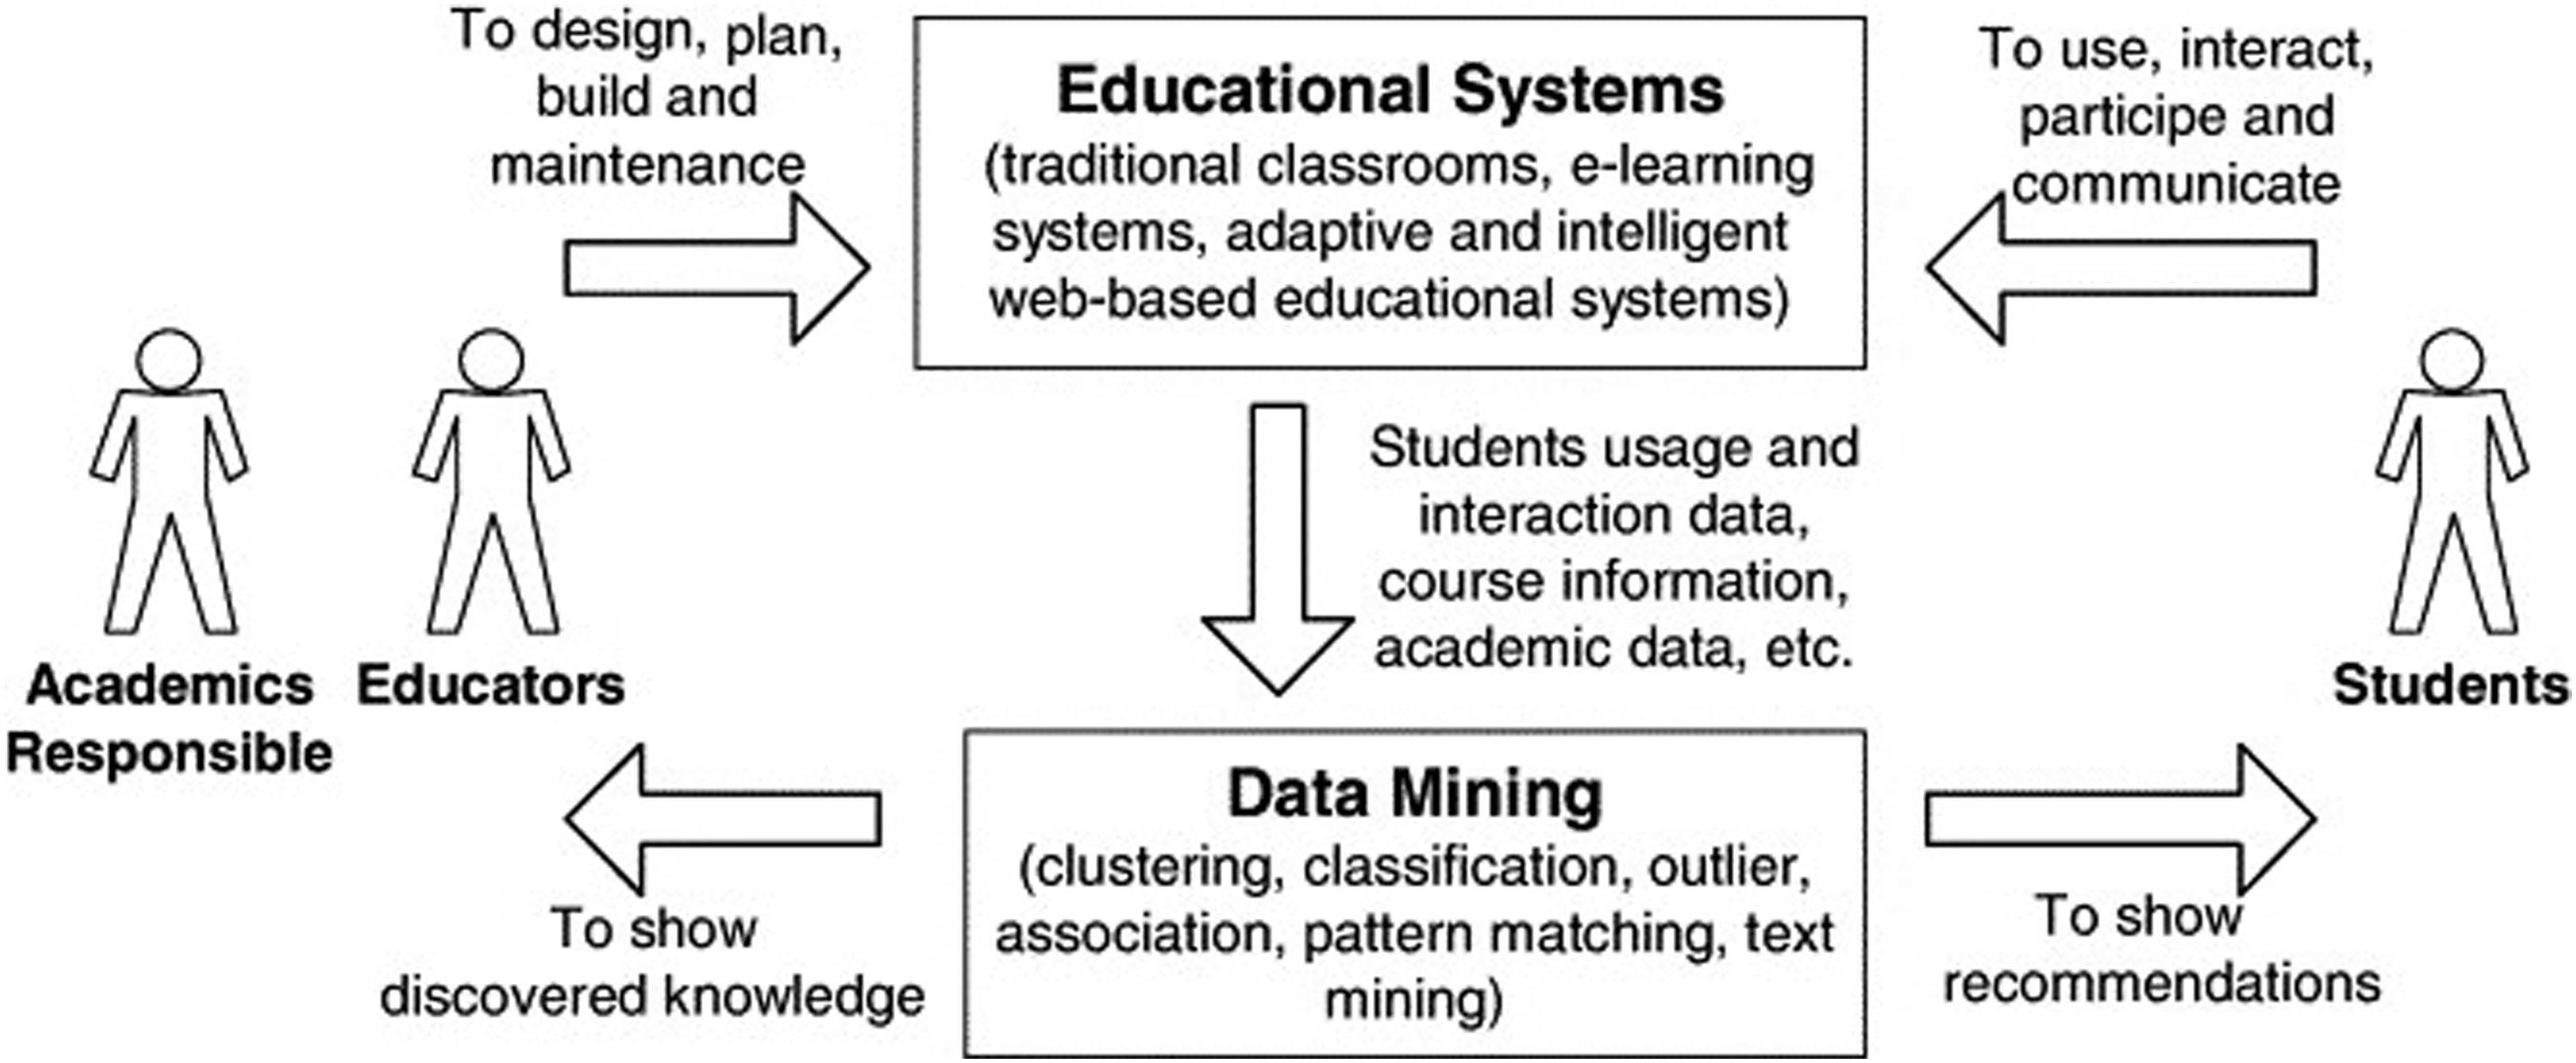
The framework given by Romero and Ventura (2007) shows systematic ways HEIs can use data for decision-making to improve the processes in an educational environment. As depicted in the Figure 2, on one end of this framework are educators, responsible for ensuring quality management in education. On the other side of this framework are the students, the key stakeholders in the educational environment. The framework describes that students’ interaction in the educational systems creates opportunities for data mining, which can produce valuable information and knowledge for educators to improve the educational processes. The framework also emphasizes designing, planning and maintaining educational systems to ensure quality interaction between students and the systems.
Similarly, with the rise in this trend, researchers also developed models to show how and what kind of data mining should be used in the educational environment (Baker, 2010; Bilici & Özdemir, 2022; Jones, 2019; Sagebrush Corporation, 2004). Educational data models have proven to be very effective in ensuring the better utilization of educational data for decision-making (Kazi et al., 2014). HEIs data models also use students' assessment data and relevant background information to make informed decisions about planning instructional strategies for various groups of students (Jones, 2019). Therefore, the scope and variety of educational data have also increased over time because of these new model developments (Bilici & Özdemir, 2022; Orr et al., 2020). Among various data models for HEIs, Baker’s model is considered one of the most comprehensive models for HEIs (Chaushi et al., 2015). Therefore for this study, the researchers have chosen this model as a base model for comparison with Chinese HEI’s DDDM approach.
Baker’s Model for DDDM
Baker (2010) developed a DDDM model for HEI to follow. The author stated that although educational data has been in use for a while by different universities, the methods for making discoveries within unique kinds of data are yet to be developed (Baker, 2010). The Bakers data model is simple yet very comprehensive for HEIs to follow (Chaushi et al., 2015). The model categorizes educational data mining into five categories: data prediction, data clustering, relationship awareness, data discovery, and data refinement. Below is the explanation of this model:
Data Prediction
Data Prediction is estimating a particular aspect of educational data using already available data (Baker, 2010). This method helps HEIs estimate future enrollment and the need for different resources and materials in future in order to best prepare for it (Romero & Ventura, 2007). Different tools and methods can be used to predict the future in educational settings, i.e. the number of new enrollments, the need for new staff and other resources etc. These estimations help HEIs proactively improve the learning and teaching process (Muehlenbrock, 2005).
Data Clustering
Creating groups within sets based on homogeneity is called data clustering (Baker, 2010). These kinds of grouping help categorize data into identifiable groups. These individual groups then were easier to analyze and could be separately studied for better understanding. The clustering of data helps in more accurate prediction of the different characteristics of data, enabling educational institutions to reach efficacy and effectiveness in university processes (Luan, 2002).
Relationship Awareness
Discovering the relationship between two data sets and naming those relationships is known as relationship awareness of data (Baker, 2010). Using relationship awareness, the institutions can predict causal relationships between variables. In relationship awareness, experts can identify patterns in the student’s behaviour that impact their performance at the end of the term. Once these causal patterns are identified, predicting and controlling students’ behaviour generates better results (Romero et al., 2004).
Data Discovery
Data discovery is creating new data using already available data through clustering or relationship awareness (Baker, 2010). Creating new data helps improve the student’s learning process, establishing the basis for decision-making when designing or modifying a course or teaching approach and manipulating or gaming the system by analyzing complex structures (Walonoski & Heffernan, 2006).
Data Refinement
The process of cleansing data to make it more understandable for human judgment is known as data refinement (Baker, 2010). For this purpose, different visualization methods have been used by HEIs to refine data in more presentable ways. Mazza and Milani (2005) developed a tool called GIZMO (graphical interactive student monitoring system) that allows academic staff to monitor students more clearly by examining their online learning system’s social, cognitive and behavioural aspects.
Methodology
To understand the DDDM practices in Chinese HEIs, this study adopted a case study design that employs a qualitative method. The Southwest University of China has been taken as a sample case for this study. A case study allows the researcher to examine the phenomenon in context (Farquhar, 2012). The advantage of using qualitative inquiry is that the researcher can deeply understand a key concept or idea studied (Creswell, 2018).
Instrument Design
An interview guide was structured following the Bakers model themes. A semi-structured interview guide was used to explore the current practices of SWU, as interviews allow the researcher to gain an in-depth understanding of the subject matter (Gaffas, 2019). The interview guide contained a list of prepared open-ended questions to explore the practices of SWU.
Sampling, Interview Protocols and Procedures
A purposive sampling technique was used to recruit the two respondents for the interview. The consent of the participants was gained by formally asking them at first. The researcher then scheduled an appointment with the two heads of the data management offices. The medium of interviews was English. The Data Management office heads from the faculty and university levels were interviewed to gain an in-depth understanding of the DDDM practices of SWU. The researcher interviewed each of the two respondents for 20–30 minutes. Interviews data were then later transcribed verbatim.
Data Collection and Analysis
All the interviews were conducted in English and audiotaped after consent was gained. Established protocols related to DDDM of SWU were identified as the standard practices in SWU. The analytical tool used for the coding of themes was the MAXQDA software. The SWU practices related to DDDM models are compared with the Bakers models of DDDM, which has been considered one of the best models of DDDM for HEIs.
Analysis
Data Collection
SWU collects data regularly to create information for decision-making. The data ranges from teaching observations to student evaluation and feedback regarding different services received. The SWU has two kinds of database management systems in place. First is the Data Management (BDM) office at the faculty level, and the second is the Quality Assurance and students management system at the University level. The Offices regularly collect and uses the following data:
Teaching Observations
The Data Management (BDM) offices at the faculty level collect data about teachers regularly. Some electronic systems are in place to monitor teachers' attendance, and data about publications, conferences and training is collected using online systems. Every teacher updates their publication and conference presentation using that online system which automatically compiles and transfers these data to the BDM office. The reports have then been generated on these records regularly, and Deans and vice deans then make decisions based on these data reports to perform further actions.
Student Evaluation
The faculty collects students’ information regularly to evaluate students’ performance. The student’s grades and scores in different tests regularly been updated in the data sets by the BDM office to keep track of the student’s performance. Further, after each term, students must fill out an online form to complete their achievements (publications, conference papers) and academic grades. The information produced through this data is then later used to evaluate students' performance and give them some rewards or warnings.
Other Surveys
SWU also conducts other surveys to collect data from teachers and students. Teachers give feedback regarding the training programs they have attended in a year. At the same time, students gave their feedback regarding academic and non-academic services they received at SWU. These data are then later analyzed, and information is generated at the university level to make decisions based on this information to improve the services in the university further.
Reporting and Data Analytics Tools
There are two kinds of data analytics tools used by SWU. One is the information management system used at faculty levels. The second source is the Quality management system used at the university level. The international college responsible for managing international students’ affairs also collects data regularly using WeChat surveys. The information management system creates information specified in the program for data analyses. Besides that, SWU uses excel spreadsheets and SPSS as tools to create information from the raw data.
SWU in Bakers’ Model
Data Prediction
SWU collects data on both faculty and university levels for prediction. The quantitative data collected on two levels has been used to predict different aspects of students' and teachers' performance. The data prediction provides valuable information to the university to prepare its resources for the coming future. “It is mainly the quantitative data we collect from our staff and students. The data collected then be used for various kinds of predictions related to student and teacher performance and the need for new resources for the coming semester and years. For example, the need and feasibility of new courses to be offered in the new semester based on students' predicted enrollment, the need for new teachers, classrooms and other resources. The student's performance is based on attendance, and the faculty performance in terms of published articles is based on the number of office hours spent in the university” [Faculty level]. “We use the data for prediction, for example, outcomes of course learning, achievements in future, and enrollment for next year. We can predict the performance of our university and different departments through these predictions. The data predictions help in policy making of different aspects of resource management. We can predict the need of different departments and the resource allocation to different departments through data. The recruitment policy for new human resources needed in future, all these predictions helps in understanding the need of future and helps in better coordination with the government and ensures the timely acquisition of funds from the government ”[University level]
Data Clustering
Data clustering in SWU has been done according to the various characteristics of international students and the number of terms offered in a year. These data clusters then provide a clear picture of progress and comparison among different groups within one data set. The university is also planning to integrate a new database management system to utilize and cluster different databases to make decisions efficiently and effectively. The data clusters created by faculty provide information to Deans of faculty, and separate data clusters have been created by international colleges to correctly cluster data based on nationality, regions, course interval, etc. “Yes, we have an integrated educational management system, and some systems are still in the integration process. At present, our university has many systems, for example, Educational administration system, scientific research system, that we use to cluster data by defining certain characteristics in data.” [Faculty level] “We cluster data by the feature of data, for example, counting statistics, interval data, and ratio data. These data clusters are used extensively for planning purposes, i.e. students with merit-based scholarships, students with partial scholarships, and students from different regions, to understand the current student enrollment and offer new scholarships for different region students”. [University level]
Relationship Awareness
The university identifies different patterns in the student’s behaviour that impact their performance at the end of the term. However, SWU correlates already established relationships in literature to measure the impact of one variable on another. This type of mining includes identifying relationships between attendance and grades, scholarship types and students performance, number of hours spent in laboratory or office room and faculty research outcome. “Yes, we can make correlations based on data set, for example, the correlation between learning motive (attendance) and course performance. Also, we used correlation based on office time spent by teachers and number of papers published in a year.” [Faculty level] “We try to correlate the performances of different teachers based on their qualifications and university background. Sometimes our overseas faculty performs better than the locally graduated faculty, so the faculty's educational background also gave us a new relationship of performance. Students' performance of different regions and ethnic backgrounds have been analyzed to measure the differences.” [University level]
Data Discovery
SWU tries to discover new data trends by understanding and comparing various data sets. For example, the faculty management system tries to compare the performance of students learning online compared to students attending face-to-face classes. For instance, despite having similar attendance rates, the difference in the performance of different sets of students has been noticeable. These relationships were discovered by analyzing a larger group of data sets. However, the scope of data discovery in SWU is limited, and despite having a database management system at two levels, very few discoveries have been made. “Yes, we try to find correlation among data sets based on instructions given by university deans and vice deans. Beside that, we normally try to analyze data based on already established relationships". [Faculty level] “Sometimes we try to compare students' performance based on nationality or region to create a new kind relationship of students’ performance with their ethnicity or regional background”. [University level]
Data Refinement
For data refinement, SWU still uses some conventional tools and software, i.e. SPSS and excel sheets. These are very basic techniques for data visualization, which SWU is following. There is a need to apply better strategies and advanced tools and software to fully understand the nature of data and identify data hidden in the dataset, which might present valuable information for the management. “Yes, we use Figures and tables to visualize data through Excel sheets and SPSS software.” [Faculty level] “We refine data using the excel worksheets and categorize international students' data based on counting statistics, interval data, and ratio data.” [University level]
Discussion
The DDDM approach of Chinese university (SWU) has been analyzed through two structured interviews. The university is using data for decision-making at both the faculty and university levels. The data ranges from teaching observations to student evaluation and feedback regarding different services received. The SWU has two kinds of database management systems in place. First is the Data Management (BDM) office at the faculty level, and the second is the Quality Assurance and students management system at the University level. The Offices regularly collect data from faculty, staff and students to use in the DDDM system. The faculty-level data management offices handle the data related to students and teachers to provide information about students' and teachers' performance progress. At the same time, the university-level data management office collects and processes data at the departmental level to provide information for policy guidelines as per the needs of different departments and the university vision. The advantage of using data management offices at multiple levels (faculty level, university level) is that it provides more valuable and timely information to the decision makers working on the department level and to the higher authorities of the university.
The DDDM approach of SWU has been analyzed through the lens of Baker model. The Bakers model categorizes higher educational data mining into five categories: data prediction, data clustering, data awareness, data discovery, and data refinement. In the data prediction category, SWU regularly collects data for predicting different aspects of students' and teachers' performance. In the data clustering category, SWU uses different data clusters to analyze the progress and compare different groups within one data set. The university has also utilized new database management software to make decisions efficiently and effectively. In data awareness, the university identifies different patterns in the student’s behaviour that impact their performance at the end of the term. This includes attendance and grades, scholarship types and student performance, hours spent in laboratory or office room, and faculty research outcome.
Meanwhile, the scope of data discovery and data refinement in SWU is limited, and despite having a database management system at two where SWU still uses some conventional tools and software, i.e. SPSS and excel sheets. These are very basic techniques for data visualization which SWU is following. There is a need to apply better strategies and advanced tools and software to fully understand the nature of data and identify data hidden in the dataset, which might present valuable information for the management.
The qualitative analysis revealed that SWU has started using data for decision making and has placed various database management systems to make informed decisions based on data. The university is doing data mining very efficiently in three aspects; data prediction, data clustering, and data awareness. However, in the data discovery and refinement category, SWU needs to catch up compared to the Bakers model. Furthermore, the software and tools used for data mining and analysis could be more advanced. Various researchers state that the trend of making informed decisions based on data is increasing in Chinese higher education (Bian & Wang, 2021; Ru, 2022; Teng et al., 2022). However, as stated by Yafeng et al. (2021), the scope of DDDM in Chinese HEIs is still immature as it is recently evolved. The analysis of this study also revealed some of these weaknesses’ such that data mining in the areas like relationship awareness, data discovery and data refinement is significantly immature. Relationship awareness has normally done only with the already established relationship of the variables. Data discovery is also minimal, and despite having a database management system at two levels, very few new discoveries have been made. So, there is a need to apply better strategies and advanced tools/software to understand the nature of data fully. Finally, the data collection procedures also highlight that database management offices are only run by IT (Information Technology) professionals with little knowledge of the educational literature. This limitation of professional competencies in data mining also limits the scale and effectiveness of the DDDM approach (Baig et al., 2020; Fiofanova, 2021).
Conclusion and Recommendations
Conclusion
The study attempted to link a theoretical Model for DDDM to a real case scenario in Chinese higher education. This comparison gave an overview of the DDDM approach in Chinese higher education. The results explore that SWU uses data mining on a comprehensive level, and the DDDM approach is very consistent with the Baker model. However, the scope of data mining is limited, especially in relationship awareness, data discovery and data refinement aspects. Improvement in these aspects can help improve the informational reports and further helps in making more effective and efficient decisions. Moreover, the applications used for data analysis are very old, and there is a need to use advanced tools and software to make more of the data. Advanced tools and techniques can help utilize those data more effectively for decision making. Also, the BDM offices are controlled by IT professionals with little to no educational research background. Introducing the proper educational researcher in those offices can help improve the analysis and further enhance the quality of DDDM. Adding an educational expert to those database management offices may help better utilize the collected data.
Recommendations and Limitation
The study provides an overview of the DDDM approach in Chinese higher education. The results explore certain immaturities in the DDDM approach of Chinese HEI. More focus on these weak areas can overcome these immaturities and can further improve the DDDM approach of Chinese HEIs. However, the study uses a case study of only one university. Further research can include more universities to present a bigger picture of the DDDM approach in Chinese higher education and can highlight more weak areas for improvement. More case studies in this area will provide more useful information for Chinese higher education policymakers to take measures to improve the effectiveness and global competitiveness of Chinese HEIs.
Footnotes
Acknowledgements
We thank the deans of Data management offices (DMO) for allowing us to take interviews and get insights about the DDDM practices of that university (SWU).
Declaration of conflicting interests
The author(s) declared no potential conflicts of interest with respect to the research, authorship, and/or publication of this article.
Funding
The author(s) received no financial support for the research, authorship, and/or publication of this article.
Informed consent
Participants were Heads of the data management offices and were verbally asked.
Data availability
Data will be available on demand.