
Abstract
An automated high-throughput flow injection analysis electrospray mass spectroscopy system was developed in-house for the purity estimation of tens of thousands of multiple parallel synthesis samples from the Novartis Pharma Combinatorial Chemistry programme. A Visual Basic application called Rack Viewer enables the sample submitting chemists to inspect their spectroscopic results in a fast, direct and easy way. Within RackViewer, a novel 3-D display of an entire 96-well rack's mass spectral ion current highlights systematic patterns in the combinatorial chemistry synthesis. In addition the system was adapted to allow the seamless incorporation of 96-well racks containing liquid chromatography fractions into the high-throughput analysis queues.
The introduction of combinatorial chemistry methodology to accelerate drug discovery has had a large impact on the analytical techniques within pharmaceutical companies, especially on mass spectroscopy. Three years ago, an avalanche of samples from laboratories performing multiple parallel synthesis confronted the Novartis Pharma MS group and obliged the development of a high-throughput flow injection mass spectroscopy (FIA-MS) system with concomitant networked reporting of synthetic purities.
The samples arrive in the MS lab in 96-well Micronic racks. They are generally of solid-phase origin, and in relatively high concentration. Parallel to their physical delivery, files describing each rack are deposited on a central NT server by the combinatorial chemist using his/her SYNTHMAN building block dispensing software. The files are then called by the MS operator and UNIX script files then automatically build the ICIS analysis page methods; also included is the automatic set up of the MS parameters.
Two Finnigan SSQ 7000 mass spectrometers are used; each is controlled by a DEC AXP 3000/300 workstation under the OSF/1 V3.2D operating system running ICIS v8.2.2. Two Ethernet interfaces connected each workstation to a SSQ 7000 and the Novartis LAN, respectively. Both workstations shared a common disk area as a network file system. The autosampler used was the eight-rack capacity CTC HTS PAL, driven from the MS workstation. ESI without any ‘up-front’ collision induced dissociation declustering was used, rather than ApCI, as ESI gas clustering is preferable to the risk of unanticipated fragmentation induced by ApCI. The mobile phase was 70:30 CH3CN:H2O v/v.
Measuring tens of thousands of samples per year immediately poses the question as to how to extract, render and reduce the purity estimates and avoid ‘data interpretation fatigue’ for the client. A supplementary question is how to mine for hidden features in the MS results. Although the default screen depictions use colourisation, the detailed numerical results and spectra should also be easily accessible (a mouse-click away). To accomplish this a Visual Basic program called RackViewer was developed which offers several views of the data i.e. Overview, Spectra, Chromatogram and 3-D Map, again all separated by only a mouse-click. Indeed the Novartis RackViewer has some advantages over commercial 96-well ‘rack browser’ software, illustrated by the following examples.
On selecting a new rack the chemist is presented with the purity estimates (%RICsum has isotope breadth and includes gas-adduct ion current) resembling the overall success of the sequential solid-phase combinatorial chemistry synthesis. These values are graded into red, amber and green divisions which are used to colour the individual wells of the rack (Fig. 1). Detailed results are visible either in a skating text box, activated when the cursor lies over a well, or in the Spectrum view accessible by double-clicking on wells. In addition a colouring scheme that reflects the ion intensity of the spectra allows the combinatorial chemist to quickly perceive patterns in the release of synthetic material from the solid-phase.
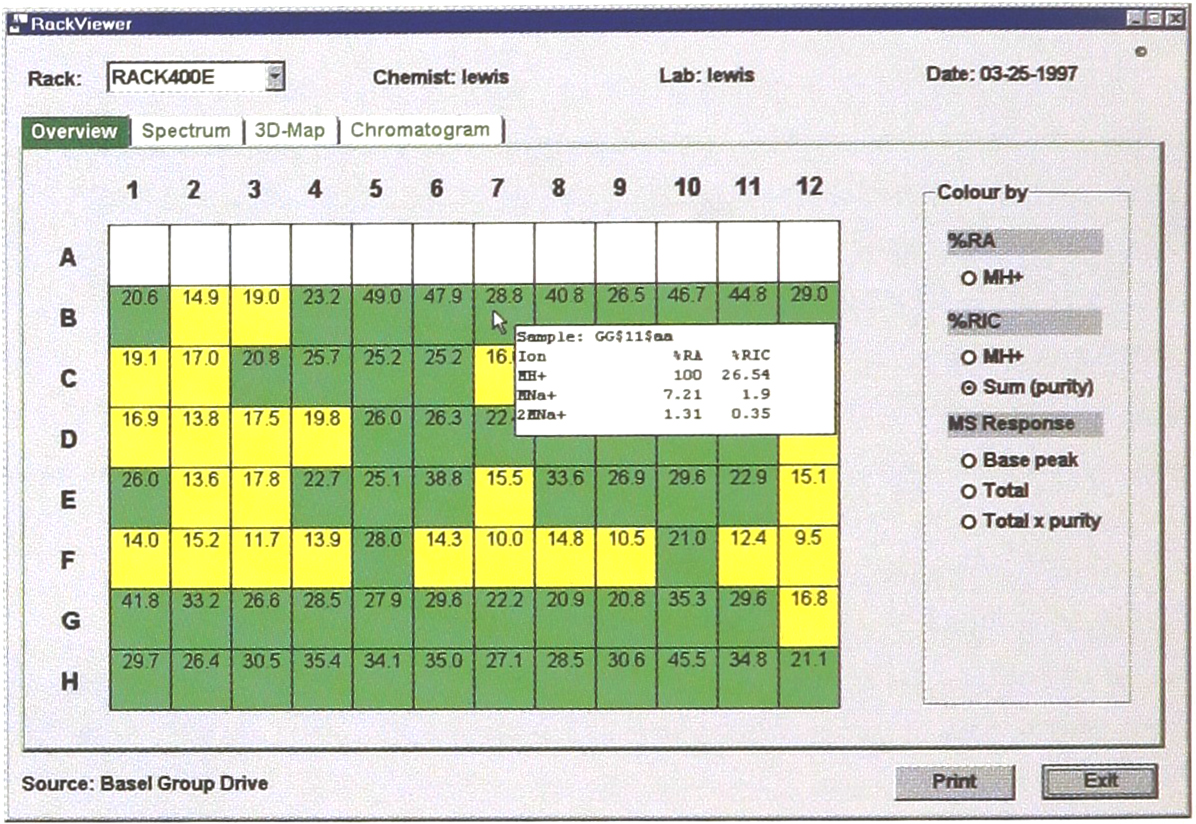
The primary window Overview depicts the 96-well rack purities with the wells coloured in green (high purity), amber and red.
Additional information about the partial success of individual synthesis steps is evident in the ‘impurities' in the ESI spectrum. However this latter reaction information is effectively hidden from view by the very large number of analysed samples. To reach this useful data, the RackViewer 3-D map provides a bird's eye depiction of each rack's complete ion current. Colourisation of ‘forbidden loss’ and ‘forbidden gas-adduct’ zones, (non)normalisation to expected monoisotopic molecular weight, colourisation of ionisation intensity and sorting by row or column are used in combination to highlight systematic MS patterns (Fig. 2).
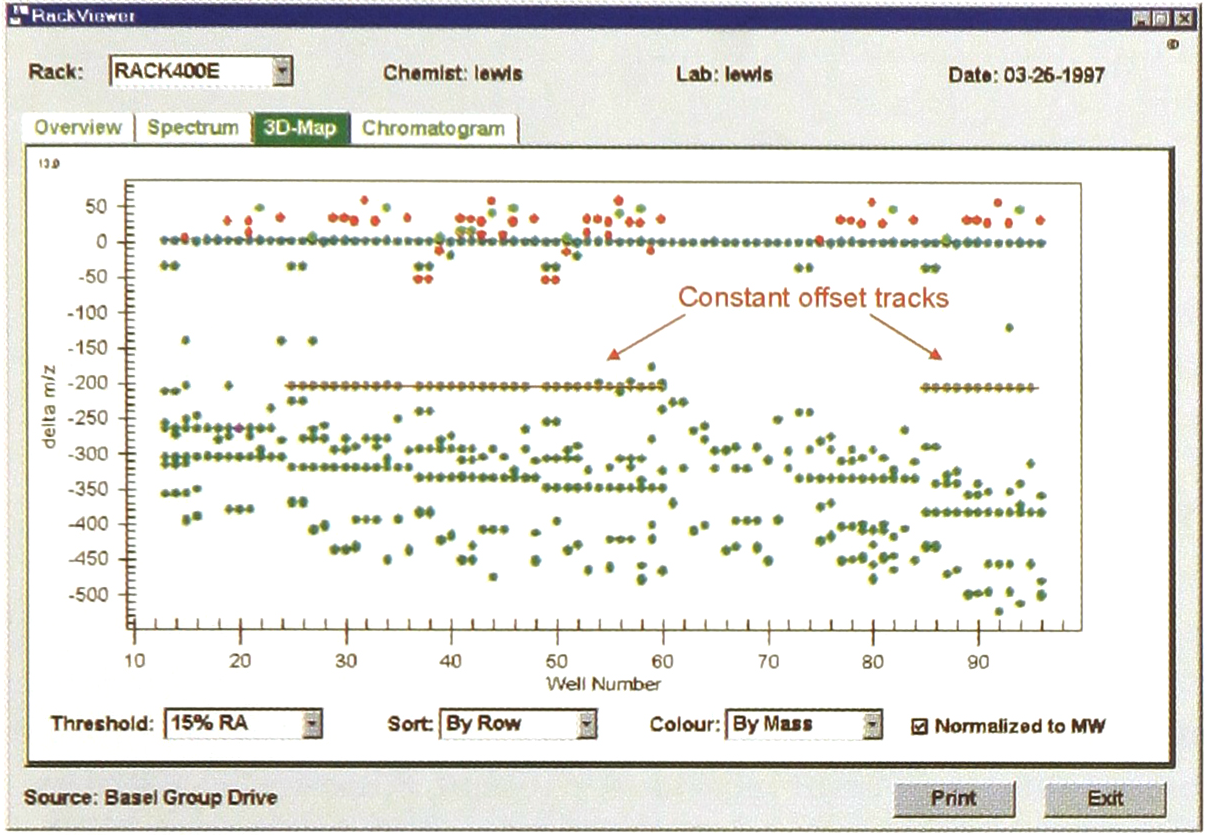
3-D map of entire 96-well current with y-axis m/z values normalised to expected molecular weight; synthetic inefficiencies show up as horizontal tracks. Spectra are accessible by a mouse click on any point. Colours indicate ions in the pseudo-molecular region (cyano), gas adduct regions (bright green), those not ascribable to either known gas adducts or allowed fragmentation losses (red) and others (dark green).
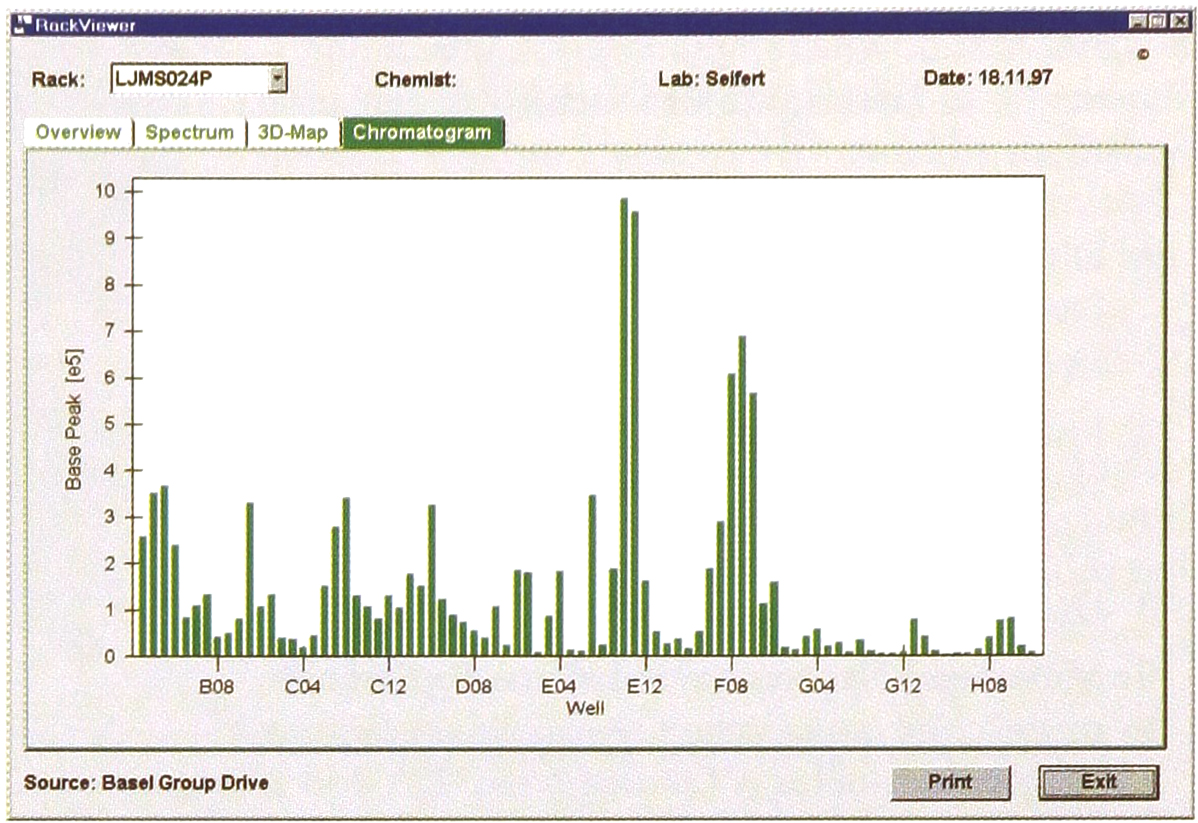
Chromatogram plot (RackViewer) of semi-preparative RP column purification of combinatorial chemistry peptoid. Results were available < 5 min after measurement, to chemist in Vienna, via Basel network. Spectra are accessible by a mouse click on any histogram bar.
In our experience catastrophic synthetic failures are rare. Rather this particular 3-D map typically illustrates how this rack's final end-product purities (∼30–40%) are a sequential accumulation of various events. This depiction pinpoints the location of one family of events i.e. synthetic inefficiences.
Besides serving the combinational chemists there was a constant demand to incorporate a smaller number of samples for HPLC-MS, into the sample queues on the same mass spectrometers. There were two major stumbling blocks, in the speedy delivery of these HPLC-MS results to the chemists i.e. HPLC optimisation delays and secondly the automatic reduction of the HPLC-MS results ‘for easy consumption’.
The adaptation of the FIA-MS/RackViewer system for LC fraction analysis i.e ‘Chromatogram’ plots, solved some of these problems, although chromatographic resolution and sensitivity were traded off. However the chemist is able to use his own LC column and elution conditions. The 96-well racks with the LC fractions can then be both seamlessly integrated into the concatenated methods lists in the Finnigan ICIS ‘Analysis’ page which constitute the high-throughput sample queue and into the physical queue positions on the multi-rack autosampler. So the chemists quickly get back LC fraction MS results via the RackViewer application; they then decide if a more resource intensive on-line HPLC-MS analysis is needed. A final advantage is that chemists browsing through their LC fraction results, do not necessitate the obligatory speedy transfer of very large HPLC-MS data files from a central server.
A major justification for mass spectrometers in central pharmaceutical MS labs. is their potential high sample loading. However the case for these generally expensive mass spectrometers as highly cost-efficient analytical servers is weakened without concomitant express delivery of easy-to-view spectra to the chemists' workbench PCs. Spectra viewing software, operating over networks and designed/customised by in-house computing specialists to add value to the results, allows this. High-throughput analytics on very large sample numbers is relatively recent and has been generally sponsored by industrial scale multiple parallel combinatorial chemistry. In this context, classical time consuming analytics seems neither practical nor practiable. Rather fast analytics, reported directly to the initiating chemists within 24 hours, appears the best way forward.