
Abstract
In recent years tandem mass spectrometry has made a substantial impact on the sequence analysis of peptides (1). In this process peptide ions are dissociated in a collision cell to produce a collection of fragment ions. The m/z values of the fragment ions are determined in the second mass analyzer. Fortuitously, peptide ions fragment primarily around the amide linkages or peptide bonds in a manner that produces a ladder of sequence ions. This method of analysis for peptides has several advantages; high throughput and sensitivity, the ability to analyze peptides contained in mixtures, and lastly the ability to observe covalent modifications to the structure.
Despite all these advantages the ability to attain high throughput analysis of tandem mass spectrometry data of peptides is limited by the time-consuming nature of the data interpretation. The recent emphasis on genome sequencing as a method to study organisms has stimulated the development of computational methods for the analysis of tandem mass spectra based on sequence information present in databases (3-5). In this paper a high throughput data analysis approach for rapid characterization of peptides based on database searching is described. This analysis is also suitable for any peptide-based analysis where a set of potential sequences can be predicted and stored as a database.
Results and Discussion
Tandem mass spectrometry has always had the potential for high throughput data acquisition. Even greater levels of efficiency and throughput have been created by embedded processors that allow real time data dependent decisions and process automation. This ability to react to data as it is acquired has produced large increases in data acquisition efficiency as well as provided a means for intelligent, automated operation of the tandem mass spectrometer. Such improvements in data acquisition efficiency also necessitate better data analysis methods to process and review the data. A high throughput automated data analysis system has been built and implemented for the analysis of peptide tandem mass spectra and the subsequent identification of proteins.
To illustrate the high throughput analysis for the tandem mass spectra of peptides, the identification of proteins in a mixture enriched from Haemophilus influenzae is illustrated. The mixture of proteins is proteolyzed to create a large mixture of peptides. This mixture is then analyzed by automated LC/MS/MS and the data analyzed by the cross-correlation analysis software, SEQUEST.
The protein mixture used in this experiment was obtained from H. influenzae. and fractionated by ion exchange chromatography. An instrument control program was written for the tandem mass spectrometer (Finnigan MAT, San Jose, CA) that acquires an MS/MS scan for the most abundant ion in a mass scan. The instrument acquires four scans and reverts back to a mass scanning mode to find then next peak. A tandem mass spectrum can be acquired about once every 6 seconds. Other types of scan modes common to triple quadrupole mass spectrometers, such as parent ion scans or neutral loss scans, can also be used to trigger the product ion scans (5). In this sample, 122 tandem mass spectra were acquired (Figure 1).
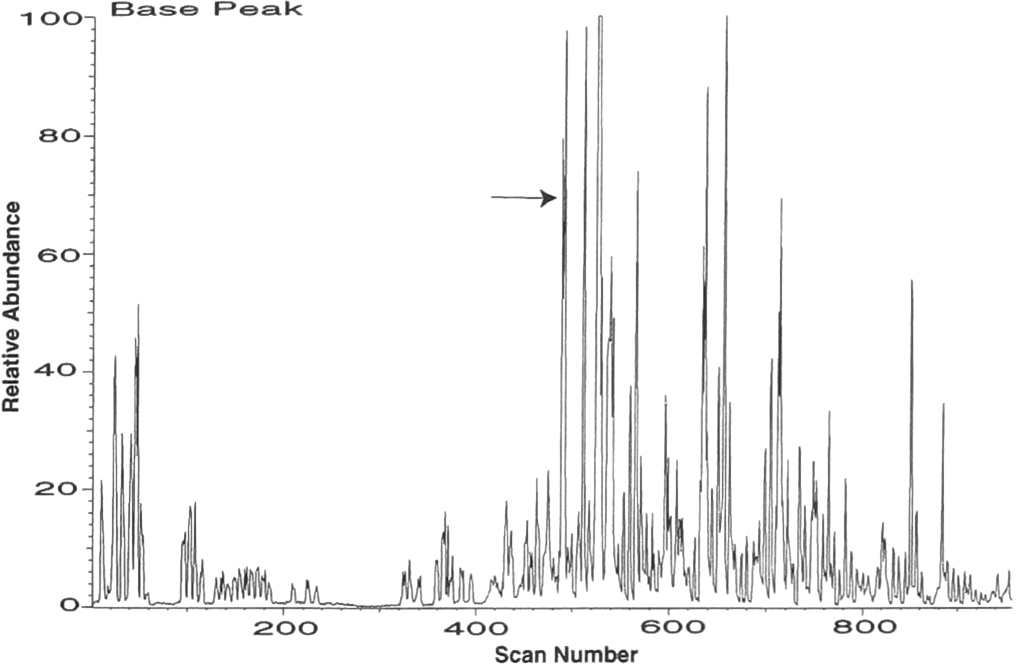
Micro-column liquid chromatography electrospray ionization tandem mass spectrometry of a trypsin digestion of a mixture of proteins enriched by strong anion exchange chromatography from H. influenzae. Automated tandem mass spectrometry was performed during the analysis, and 122 tandem mass spectra were collected. The arrow points to the scan region of the tandem mass spectrum shown in Figure 4.
The tandem mass spectrometry data is then processed for analysis by stripping out duplicate spectra and calculating the m/z values for peptide precursor ions (3). The tandem mass spectra are then “interpreted” and proteins identified by scanning amino acid sequences in the database to find linear combinations of amino acids, proceeding from the N- to the C-terminus, that are within some tolerance of the mass of the peptide represented by the tandem mass spectrum. The mass tolerance is one of several methods that can be employed to limit the sequences considered during the search. Sequence selection can also be guided by the cleavage-specificity of the protease used to create the peptide, including consideration of incompletely digested peptides from either side of the primary sites, or it can be performed with no assumptions about how the peptide was created. The fragment ions for an amino acid sequence are predicted and compared to the tandem mass spectrum. Fragment ions that are within +/-1 of the values predicted from the sequence are considered a match. The abundances for the matching ions are summed as described in Eng et al. (3). Under conditions where enzyme or species information is not incorporated into a search multiple sequences will be found matching a spectrum. We have incorporated a second novel scoring step to provide a sensitive, objective comparison of sequence to spectrum.
To evaluate and compare the amino acid sequences retrieved from the database to the tandem mass spectrum, we have developed a novel procedure based on a powerful signal processing method. To do this a method to reconstruct model or theoretical tandem mass spectra was developed. After a tandem mass spectrum has been reconstructed it is compared to the query tandem mass spectrum by using a cross-correlation function, a signal processing method used to compare the coherence of two signals (9, 10).
This is performed, in effect, by translating one signal across another. The normalized cross-correlation value has provided an excellent figure of merit to identify correct answers and flag false positives. When a difference greater than 0.1 is observed between the normalized cross-correlation value of the first and the second-ranked sequences then the first answer is usually correct (3). A small difference in the DCn value is also observed when the first two answers have a high degree of sequence similarity. By manipulating aspects of the search parameters a tolerance to errors in the database can be incorporated into a search.
The SEQUEST software has been designed to operate in a batch processing mode, where all the tandem mass spectra from a single analysis are analyzed without intervention by an operator. Coupled with automated LC/MS/MS this is a very efficient and highly effective method to acquire and then analyze data. Review of the data quickly becomes the next major bottleneck. To improve information management we developed a series of tools for reviewing the data output of SEQUEST using computer software that can interpret hypertext markup language. Search summary results for the H. influenzae protein mixture LC/MS/MS analysis are displayed in Figure 2. The first column identifies the file name the spectrum originates from and the scan numbers co-added to generate the spectrum for analysis.
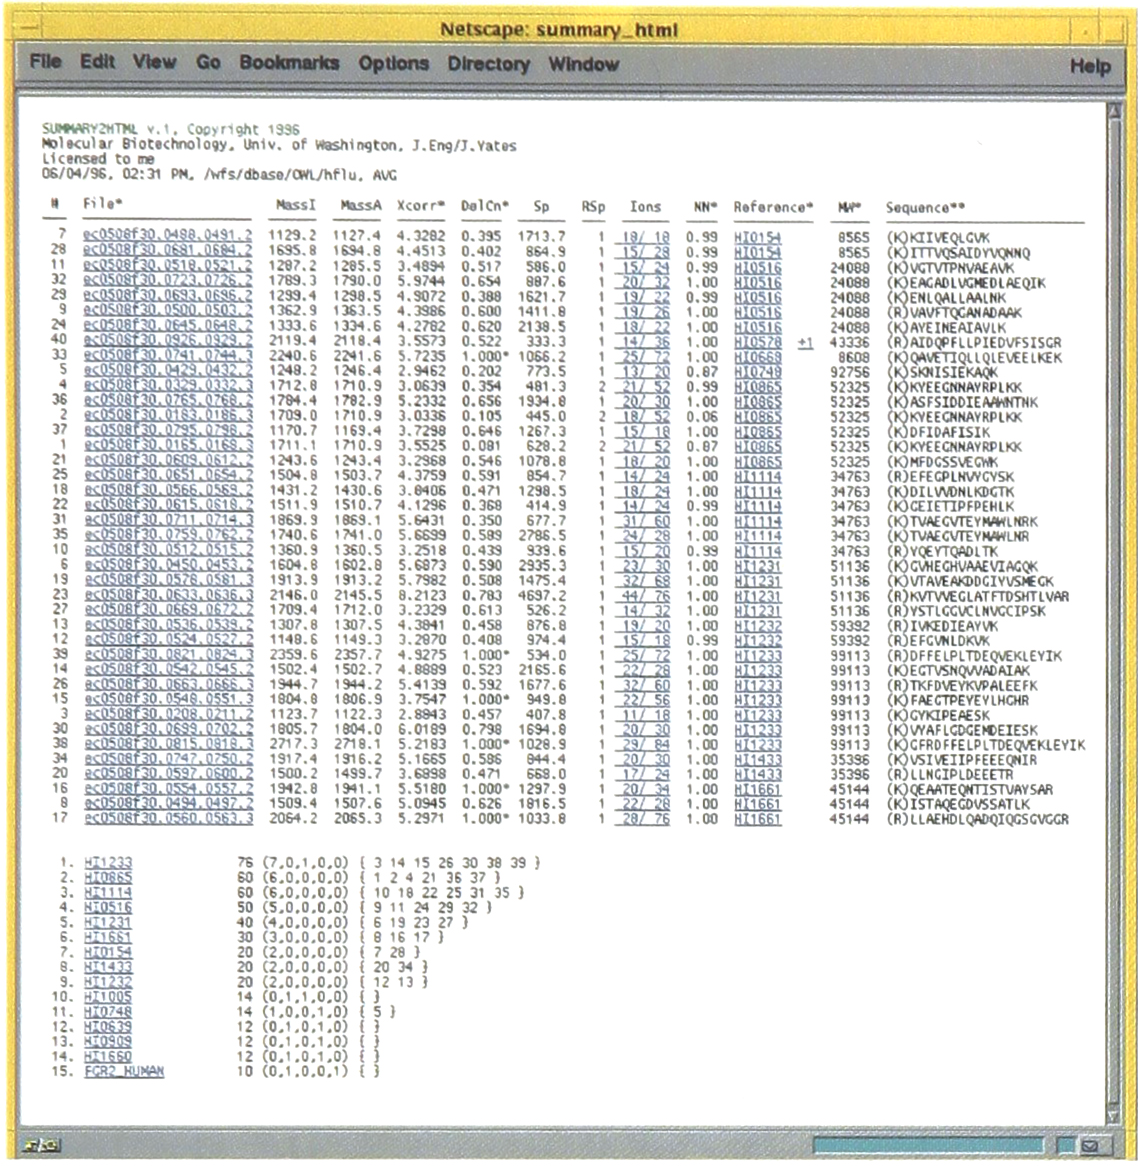
Shown is the summary output for the search of the H. influenzae database using the tandem mass spectra obtained in the analysis shown in Figure 1. A description of the columns and headings is provided in the text.
These names are linked to the original search data and by clicking on a particular filename the original search output can be viewed as shown in Figure 3. The columns MassI and MassA are the values of the input mass calculated from the spectrum and actual mass calculated from the sequence, respectively. The next four columns supply detailed information about the search results where Xcorr, DelCn, Sp, and Rsp give the cross-correlation result, difference in the normalized Cn value for the first and second answers, preliminary score and the rank based on preliminary score, respectively. The next column supplies the ratio of sequence ions predicted versus those found in the experimental tandem mass spectrum. The values in this column are linked to program that will display the tandem mass spectrum and identify the sequence ions within the spectrum. This is shown in the Figure 4.
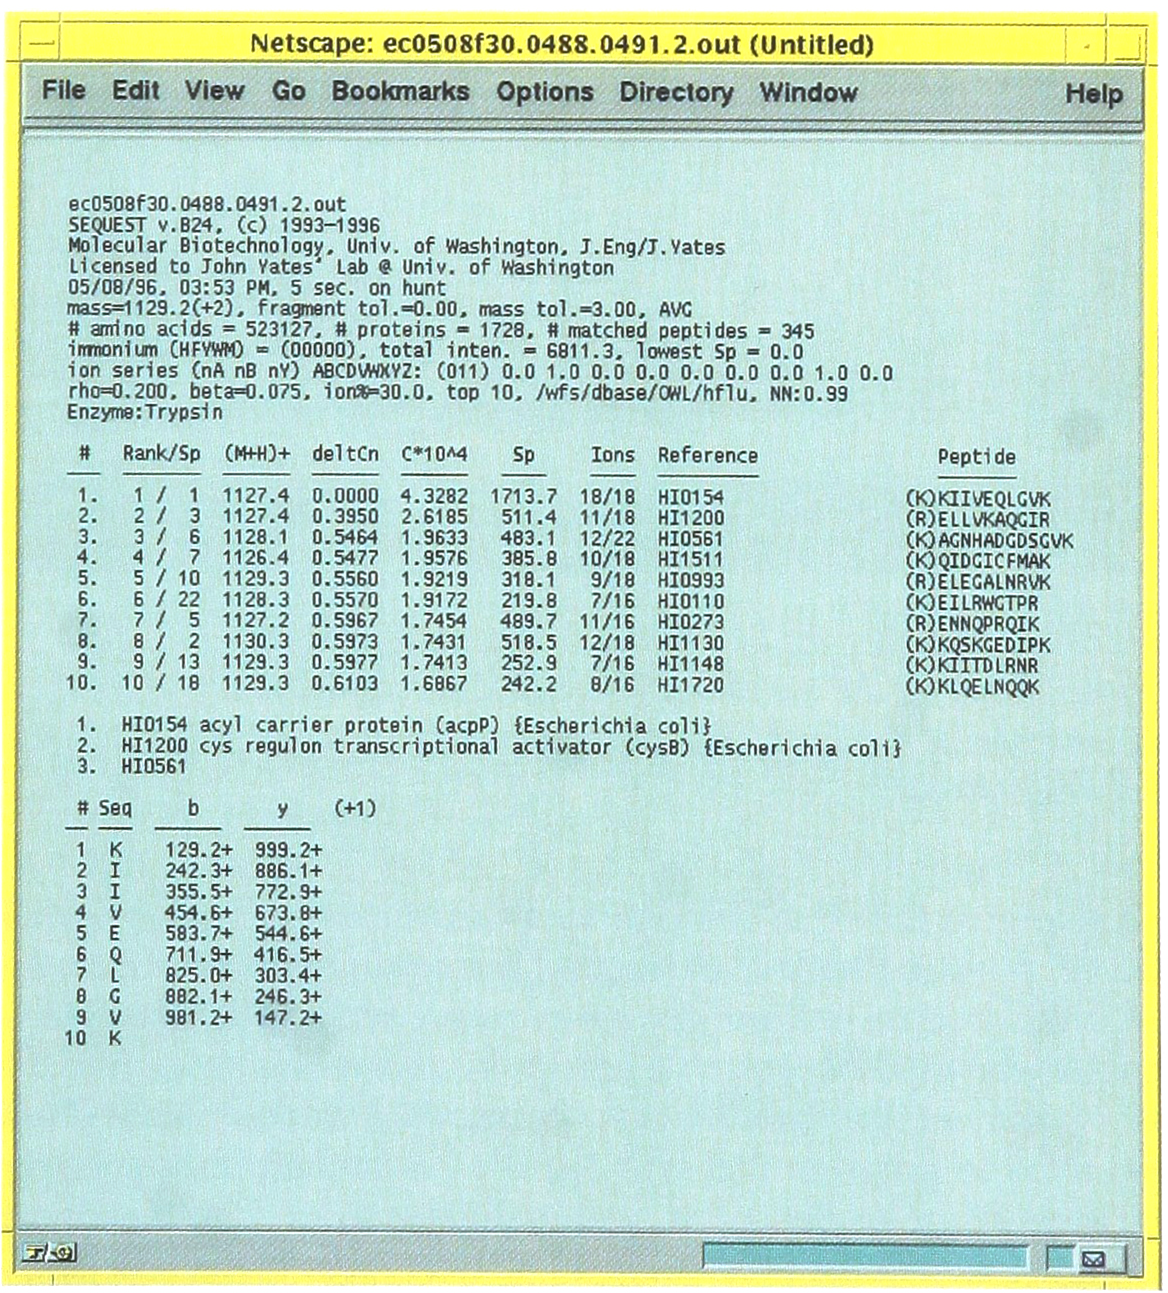
Following the link from the File designations displayed in the first column (Figure 2), the information for individual searches of tandem mass spectra can be found. This is useful to determine if a close score is the result of identifying two closely related sequences.
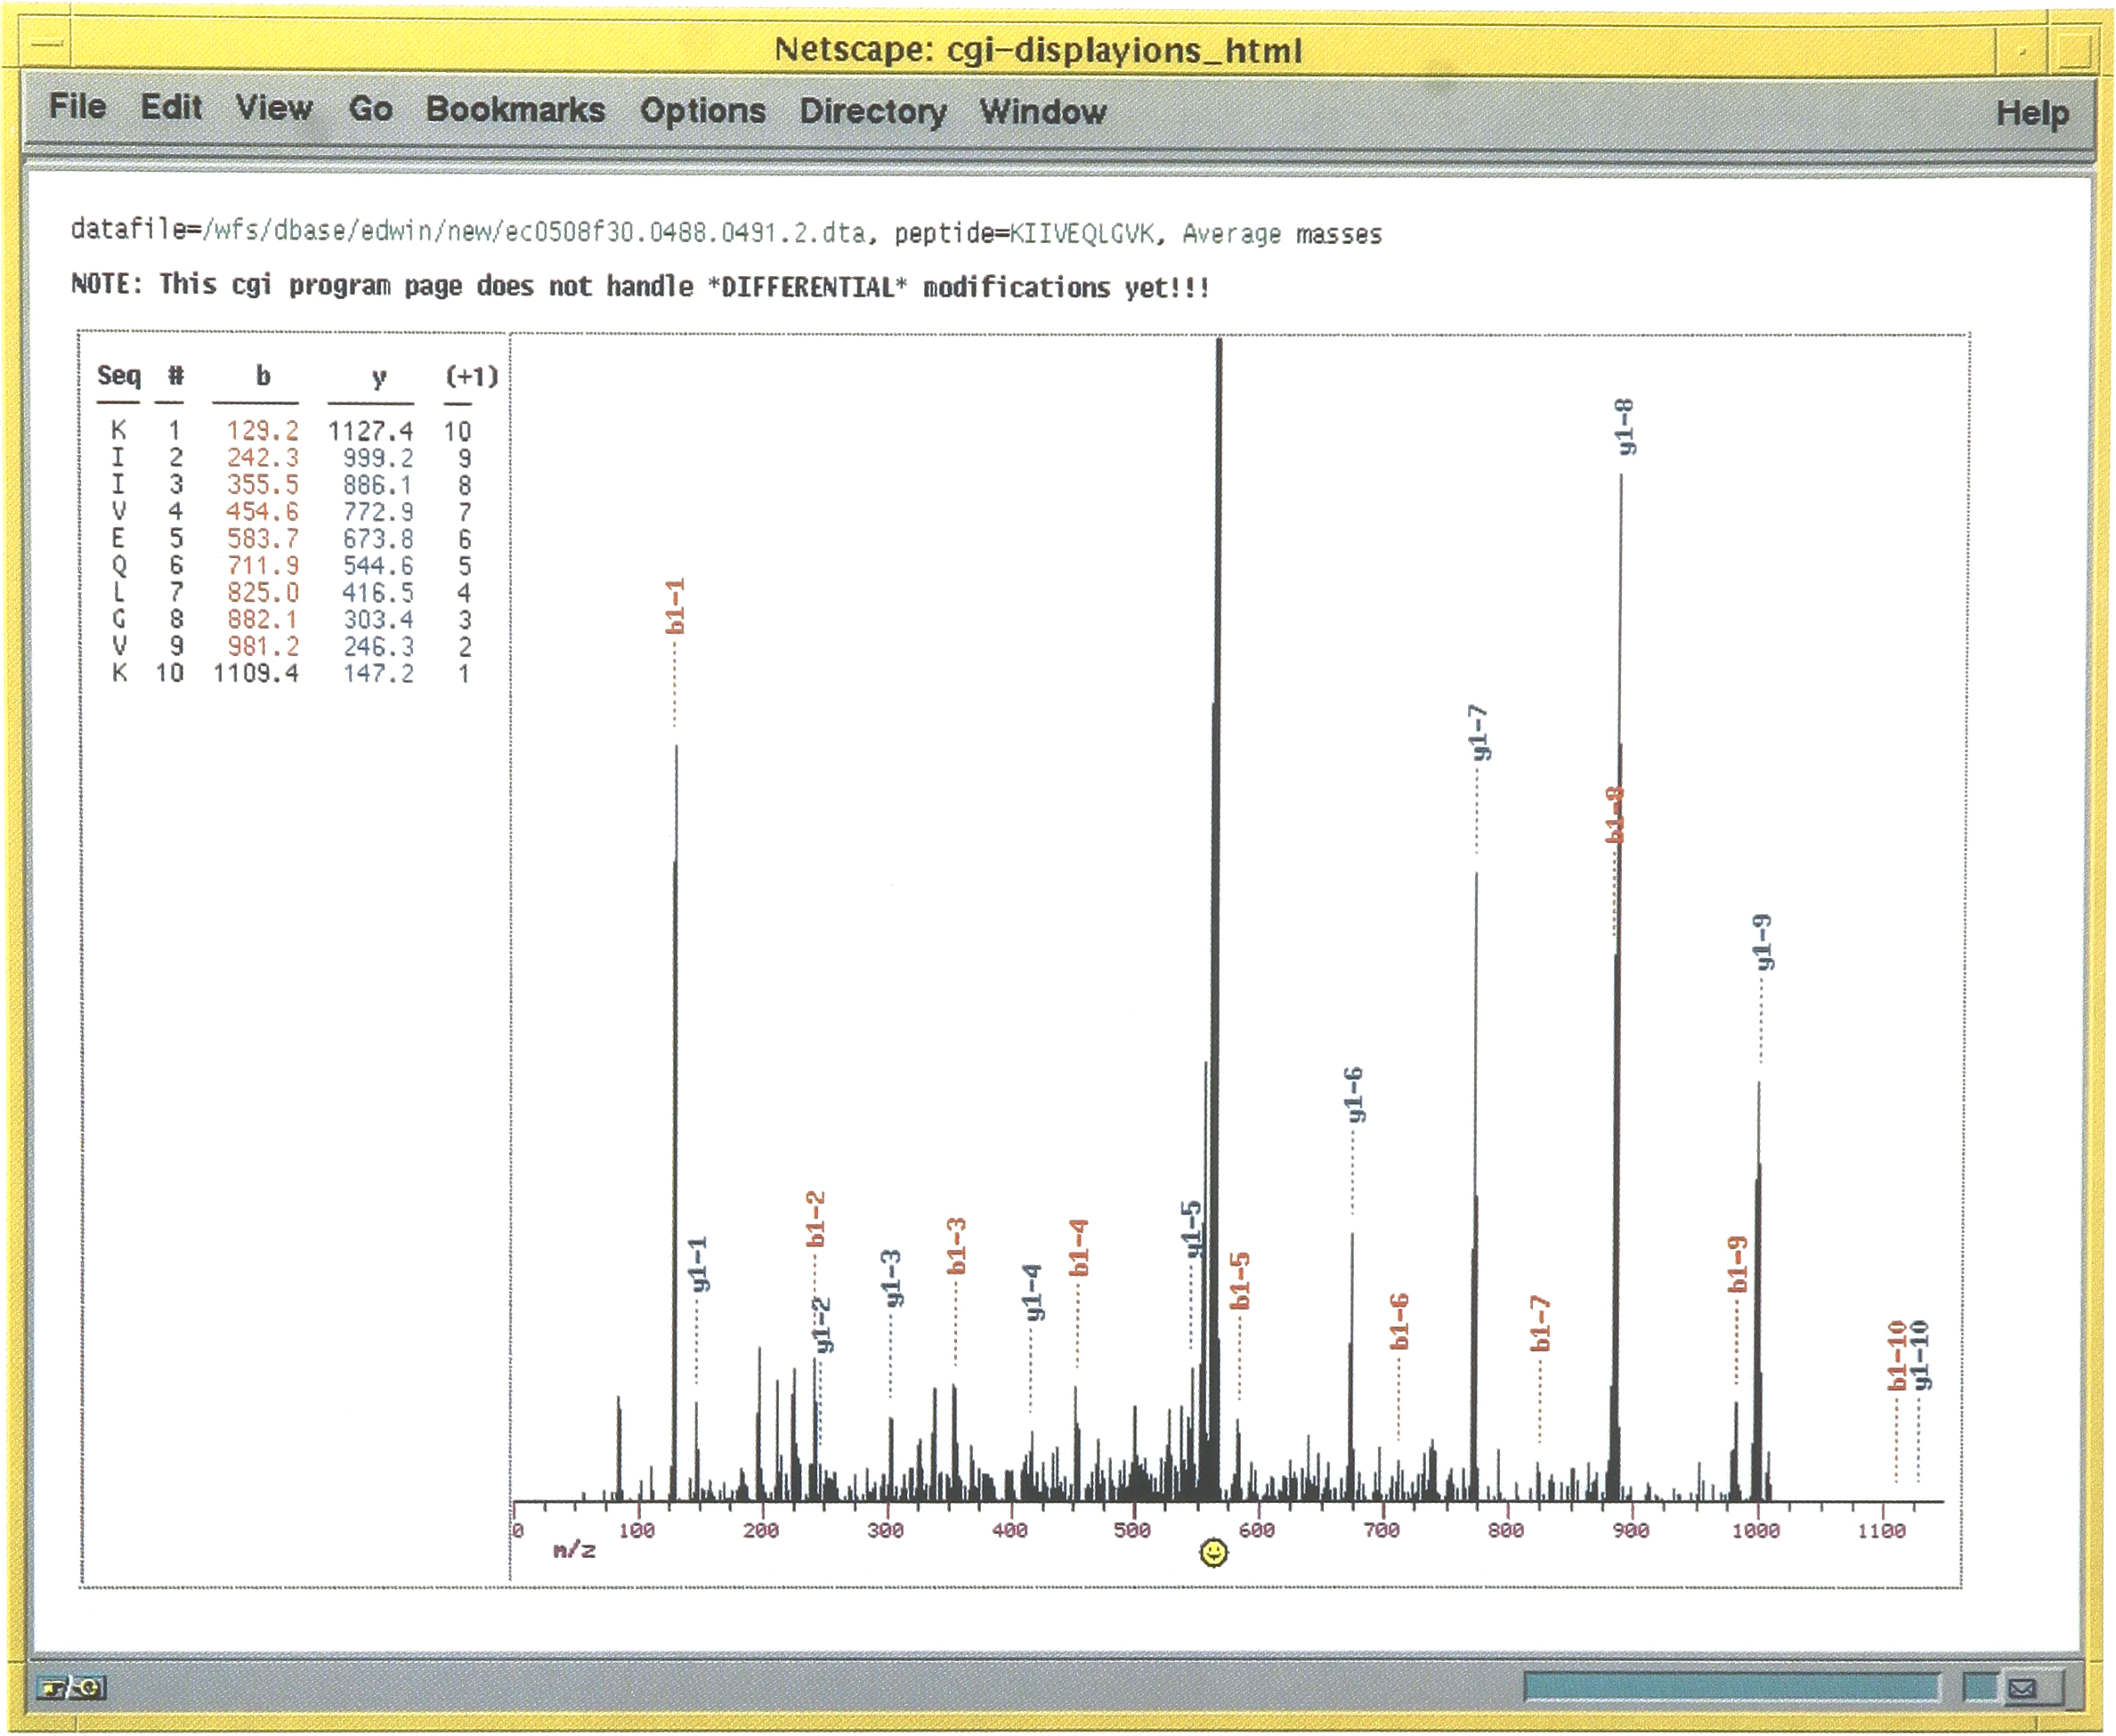
Following the link from the Ions column shown in Figure 2 the tandem mass spectrum used in the search can be found. The predicted fragment ions for the top ranking sequence are shown to the left of the spectrum. The position of the fragment ions within the spectrum are indicated with the type of sequence ion. This information is displayed in different colors; red and blue for N-terminally and C-terminally related fragment ions, respectively.
A neural net has also been trained to evaluate the search output results and this score is shown in the next column. A high score indicates a correct result and a low score indicates the search failed to find a good match. The organism reference number is shown in the next column and is linked to a program to display the full protein sequence as well as the amino acid sequence matched to the tandem mass spectrum. A sample output is shown in Figure 5, Within this display a link to the SWISS-PROT database is present to obtain additional information about the sequence. If the spectrum matches the same amino acid sequence that exists in more then one entry this is shown to the side of reference number. By clicking on this value all the protein sequences are displayed. This allows a quick visualization of the protein sequences to determine if they are different entries of the same protein or similar protein sequences.
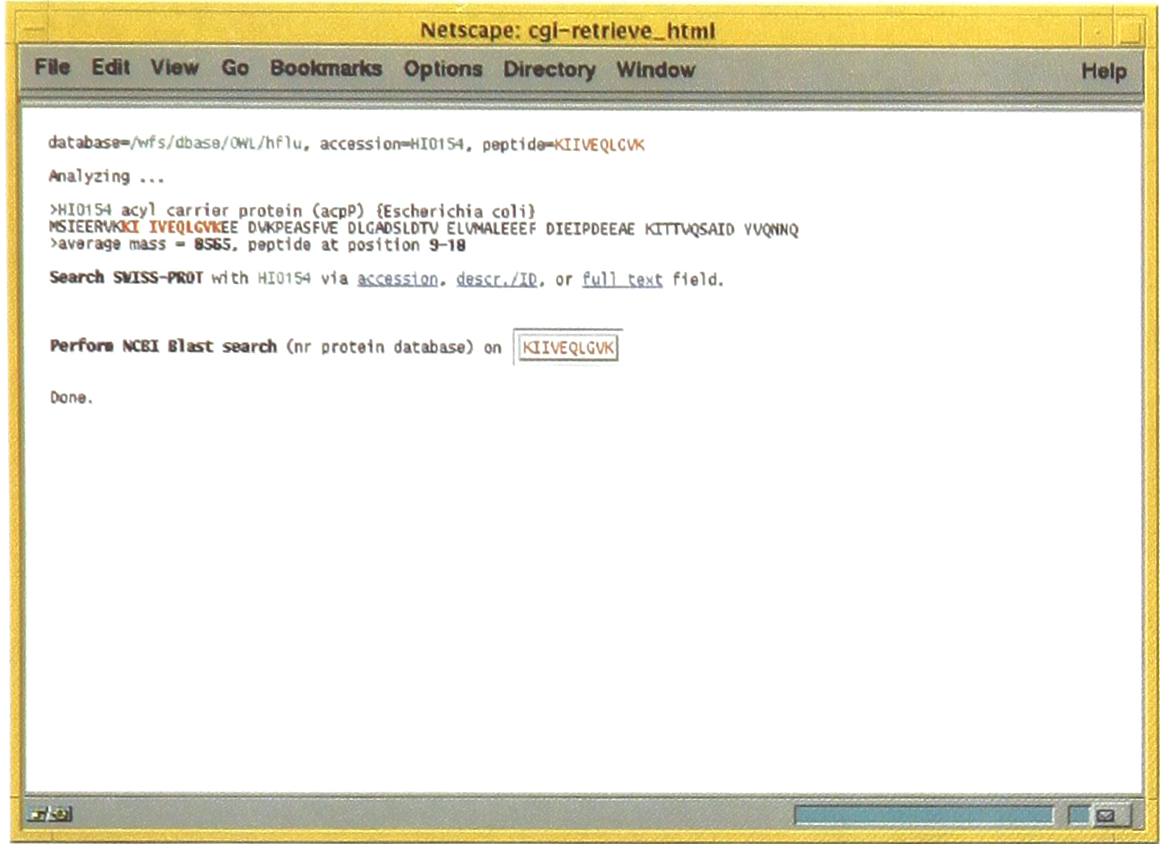
Following the link from the Reference column shown in Figure 2, the full sequence of the protein identified can be viewed. Within the full sequence the amino acids represented in the tandem mass spectrum is shown with a different color. For this search result the sequence KIIVEQLGVK is highlighted in red.
The final two columns show the molecular weight of the protein calculated from the database sequence and the sequence of the peptide. At the bottom of the page the identification information is consolidated showing how many peptides were found from each protein. By following this link, as shown in Figure 6, a visual display of the sequence information matched to the full protein sequence is produced. A full view of the amount of sequence information acquired for each of the proteins in the mixture can thus be obtained. This data evaluation method greatly improves the throughput of data analysis. Furthermore by creating output files that can be read by Web browsers such as Netscape or Internet Explorer, data evaluation can be performed on any computer capable of running the browser. This process has greatly improved our ability to evaluate search results.
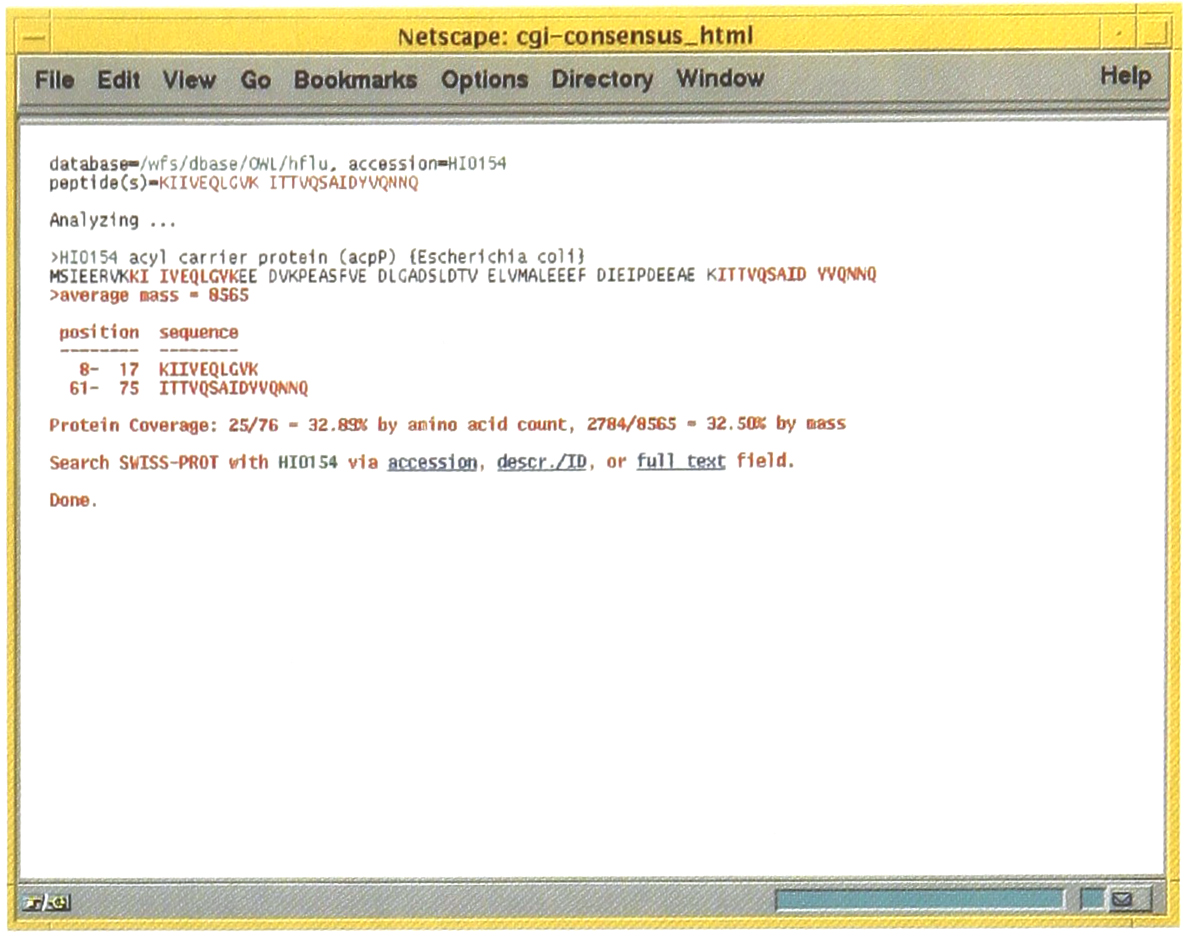
Following the link from the information shown at the bottom of Figure 2, a visual summary of all the tandem mass spectra matching to a particular protein sequence can shown. A synopsis of the amount of information obtained is shown as well as links to the SWISS-PROT database to obtain sequence annotation information.
Conclusion
The concepts and methods developed for the analysis of the tandem mass spectra for peptides should be transferable to other types of molecules to facilitate rapid compound screening.
First the ability to automatically acquire tandem mass spectra greatly improves the efficiency of data acquisition over manual input of information to select and dissociate precursor ions during an analysis. The cross-correlation function provides a powerful and sensitive method to compare tandem mass spectra of peptides to libraries or sequences in databases. By combining these methods a streamlined, automated, and rapid approach for the characterization of molecules is possible.