
Abstract
We reported a rapid, convenient, and easy-to-use genotyping method for hepatitis B virus (HBV) based on the smartphone at point-of-care (POC) settings. To perform HBV genotyping especially for genotypes A, B, C, and D, a smartphone is used to image and analyze a one-step immunoassay lateral flow strip functionalized with genotype-specific monoclonal antibodies (mAbs) on multiple capture lines. A light-emitting diode (LED) positioned on the top of the lateral flow strip is used to shine the multiple capture lines for excitation. Fluorescence detection is obtained with a smartphone whose camera is used to take the fluorescent images. An intelligent algorithm is developed to first identify each capture line from the fluorescent image and then determine the HBV genotype based on a genotyping model. Based on the pattern of the detection signal from different samples, a custom HBV genotyping model is developed. Custom application software running on a smartphone is developed with Java to collect and analyze the fluorescent image, display the genotyping result, and transmit it if necessary. Compared with the existing methods with nucleic acid analysis, more convenient, instant, and efficient HBV genotyping with significantly lower cost and a simpler procedure can be obtained with the developed smartphone POC HBV genotyping method.
Keywords
Introduction
Typical liver-related diseases, including hepatitis, liver cirrhosis (LC), and hepatocellular carcinoma (HCC), can be caused by hepatitis B virus (HBV). 1 In total, 10 HBV genotypes are recognized globally to date, 2 and among them, genotypes A, B, C, and D are identified in China, especially with dominant genotypes B (36%) and C (51%). 3 It has been demonstrated that the risk of liver disease progression (LC and HCC), the rate of chronicity, and the antiviral treatment response are all related to the specific HBV genotype. 4 Therefore, it is of important clinical significance to determine the HBV genotype for efficient long-term chronic hepatitis B (CHB) clinical antiviral treatment based on the disease progression condition, which is inherently related to the HBV genotype. 5
Since the first HBV genotyping method based on entire gene sequencing was reported in 1988, different methods, such as reverse hybridization or line probe assay, direct genome sequencing, multiplex nested PCR, real-time PCR, oligonucleotide microarray chips, restriction fragment polymorphism, and microfluidic loop-mediated isothermal amplification chip with giant magnetoresistive sensors, have been developed for HBV genotyping.6–12 Because the existing methods rely on nucleic acid analysis to determine the HBV genotype, they are normally time-consuming due to the complicated procedures, including sample processing, nucleic acid amplification, labeling, detection, and analysis.
For one-step lateral flow immunoassay (LFIA), once the sample is applied onto the strip, reaction occurs on the test and the control lines when the sample migrates along the strip, until the result becomes readable after a few minutes.13,14 The extremely simple detection process makes the low-cost LFIA highly suitable, especially for rapid or screening test at point-of-care (POC) settings.15,16 Besides the traditional qualitative detection mode, quantitative detection can also be obtained with LFIA when its performance is improved, which further extends its application area. 17
Because of the small size, cost efficiency, simple operation, and highly integrated functions, smartphones with powerful microprocessors, efficient embedded operation systems, and functional cameras have become one of the best candidates for miniaturization of the diagnosis devices at POC settings.18,19 With integrated optical components, smartphones are able to successfully detect biomarkers or other targets through fluorescent signal or visible gray images.20,21 Alternatively, it is possible for a smartphone to cooperate with other functional modules with the Bluetooth in an integrated diagnosis system. Smartphones with custom application software are able to collect and analyze detection signal, obtain the detection result, display and save the result, and transmit it through the communication network if necessary. Smartphone-based diagnosis has been applied to paper- or liquid-based target detection, or even microfluidic-based analysis. 22
In this article, a rapid and convenient HBV genotyping method based on the smartphone has been developed to perform HBV genotyping, especially for genotypes A, B, C, and D, with a one-step fluorescent LFIA strip. The lateral flow strip is functionalized with genotype-specific monoclonal antibodies (mAbs) on multiple capture lines to selectively capture viral surface antigens through immunoassay reaction from samples with different HBV genotypes. When the multiple capture lines on the lateral strip are shined by a light-emitting diode (LED) with a specific wavelength, a smartphone is used to collect the fluorescent image of the lateral flow strip with its own camera. With an intelligent algorithm, first each capture line is identified from the fluorescence image, and then its fluorescent signal distribution is analyzed to determine the genotyping result. A custom HBV genotyping model is developed based on the pattern of the detection signal from samples with different HBV genotypes. The utility and performance of the smartphone POC HBV genotyping method with different working conditions are fully evaluated and demonstrated.
Material and Methods
Lateral Flow Immunoassay
Based on the immune specificity of HBV viral surface antigens from different HBV genotypes, an easy-to-operate one-step LFIA was developed for HBV genotyping. Lateral flow strips, which were functionalized with genotype-specific mAbs on multiple capture lines, were used to selectively capture viral surface antigens from samples with different HBV genotypes. The lateral flow strip has been evaluated thoroughly with a big sample bank, and its functionality has been proved to be comparable to that of classical consensus sequencing methods. 23 As shown in Figure 1 , there are in total six capture lines on the nitrocellulose membrane of the lateral flow strip, where the genotype-specific mAbs 2B2, 16D12, 6H3, and 3E6; goat anti-HBsAg polyclonal antibodies; and streptavidin were respectively immobilized on the a, b, c, d, T, and Ctrl capture lines. To confirm the feasibility and accuracy of HBV genotyping with the lateral flow strip, systematic evaluation of the specificity of genotype-specific mAbs has been performed, with early experiments on lateral flow strips. 23
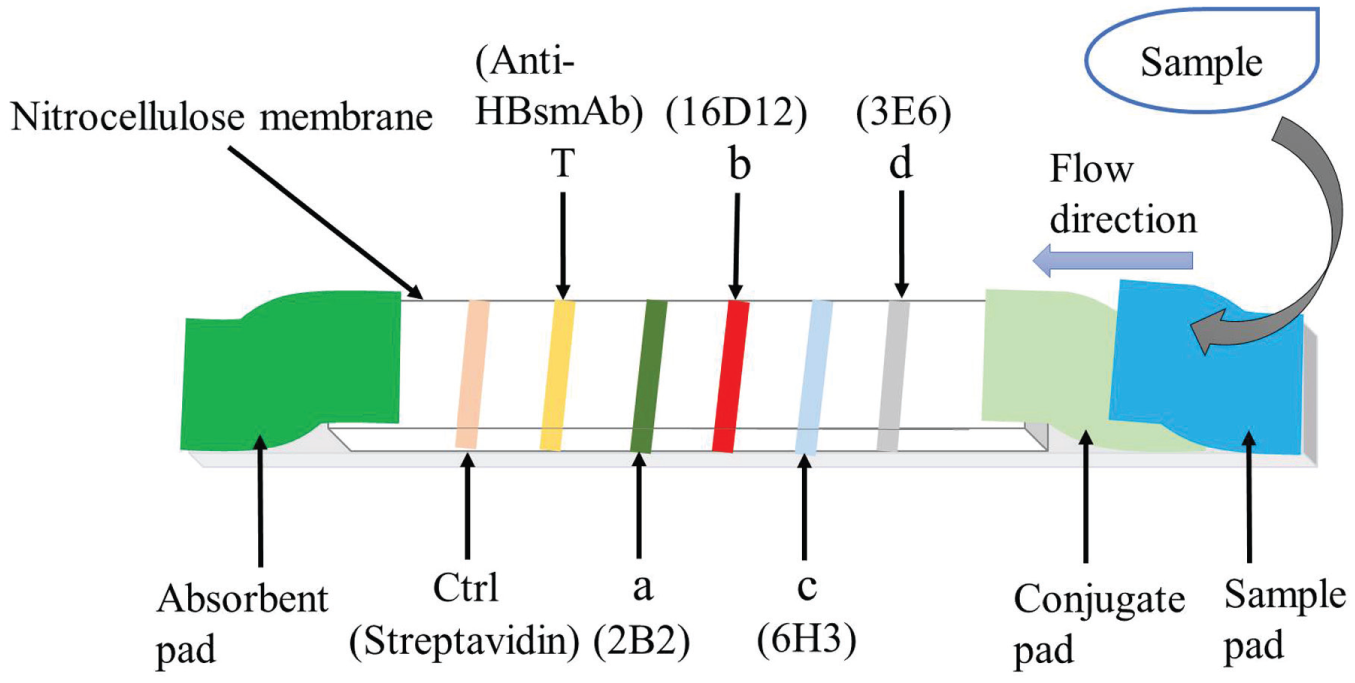
Immunoassay lateral flow strip.
Similar to typical lateral flow strips, HBV genotyping strips were composed of a backing, sample pad, conjugate pad, nitrocellulose membrane, and absorbent pad. Especially on the conjugate pad, an anti-HBsAg mAb and biotinylated bovine serum albumin (BSA), both of which were conjugated to Fluoro-Max fluorescent nanoparticles (excitation at 333 nm and emission at 613 nm), were stored in dry form after dilution in a blocking reagent with BSA. Based on the specific immune bioreactivity between the immobilized genotype-specific mAbs and the viral surface antigens from different HBV genotypes, HBV genotyping can be obtained based on the detection signal pattern of the lateral flow strip.
Smartphone HBV Genotyping
A smartphone-based HBV genotyping system was developed, as shown in Figure 2 . A smartphone with normal configuration, for example, type 2A (MI, XiaoMi, China) here, can be adopted in the developed system. An ultraviolet (UV) LED (500 mA) with a specific wavelength (365 nm), whose working current was regulated by a smartphone through a microcontroller was used to shine the multiple capture lines for excitation from the top of the lateral flow strip. Meanwhile, the fluorescence signal image of the lateral flow strip was collected by a smartphone with its own camera through an optical filter. To prevent the disturbance from environmental light, all components were put into an enclosed box except the smartphone sitting on its top side.
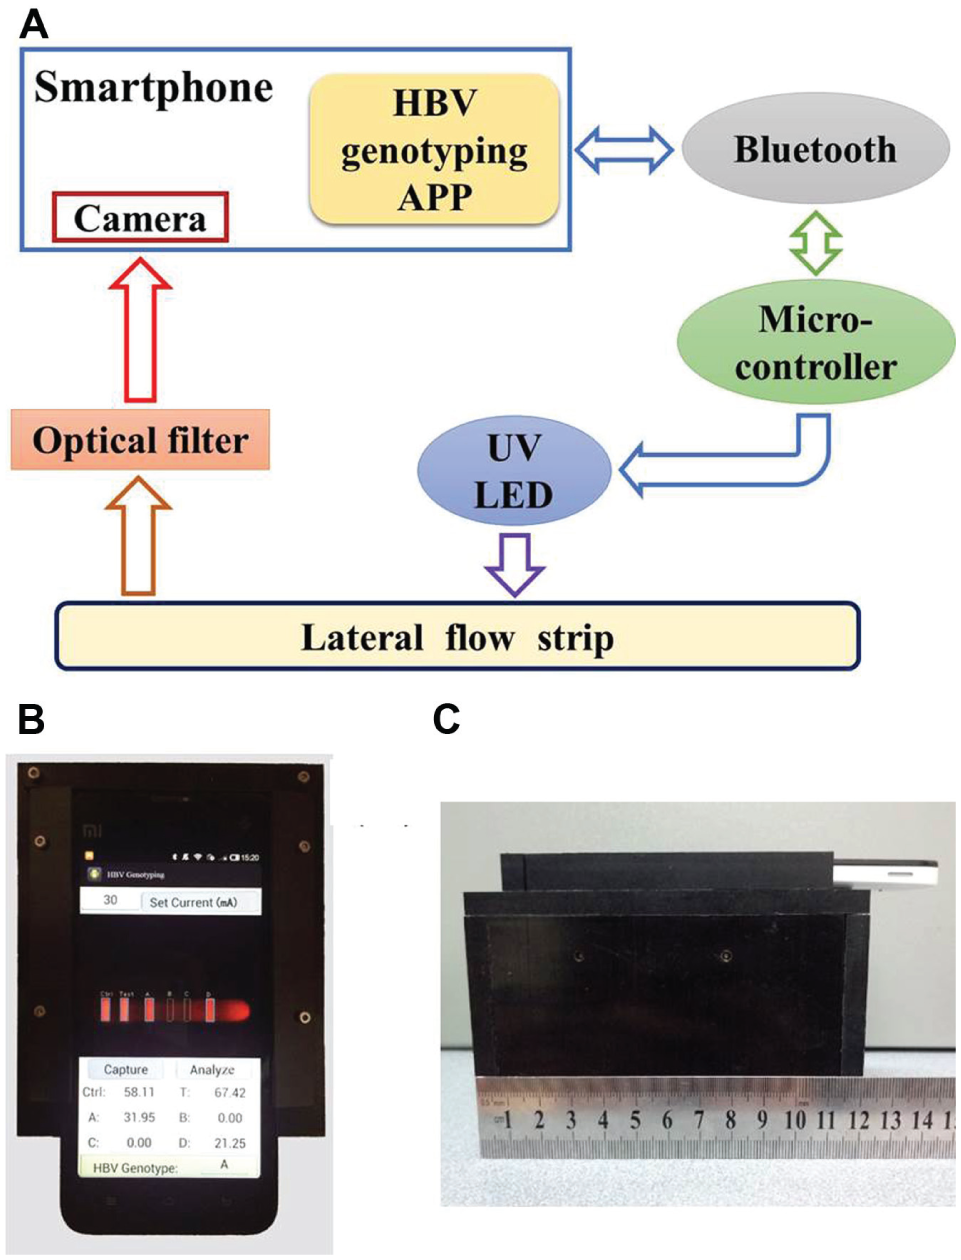
Smartphone HBV genotyping system.
As shown in Figure 2 , HBV genotyping was performed by operating the custom application software (APP) through the smartphone’s touch screen after the incubated lateral flow strip was put into the device. The fluorescence signal image was analyzed by the APP until the HBV genotype was determined based on an intelligent HBV genotyping model. The Bluetooth-based communication was established between the smartphone and the microcontroller to easily adjust the working current of the UV LED for optimal excitation. As a handheld device, the smartphone HBV genotyping system can be assembled with components costing less than $50, especially when a secondhand smartphone is adopted.
Image Analysis for HBV Genotyping
Because the HBV genotype is determined by the fluorescence signal distribution of multiple capture lines on the lateral flow strip, it is important to first identify each capture line accurately and then extract its signal intensity amplitude properly. For image analysis, the original fluorescence signal image ( Fig. 3A ) was first converted into a gray image ( Fig. 3B ), as shown in Figure 3 .
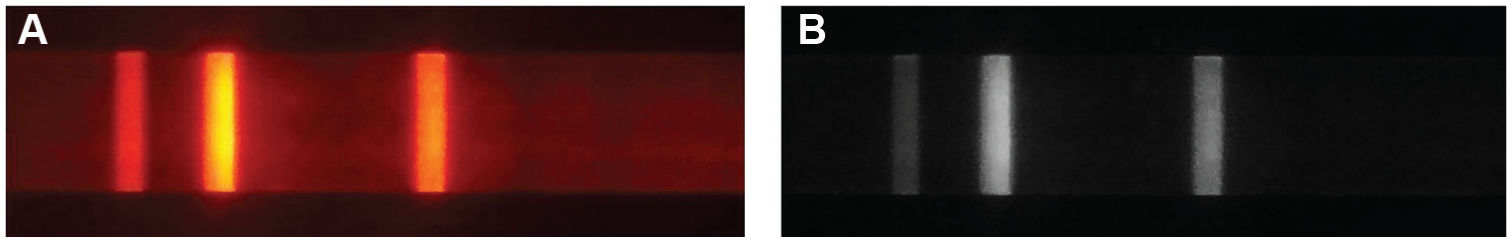
Typical fluorescence image of a lateral flow strip with multiple capture lines. (
The multiple capture lines on the lateral flow strip were first identified by an image-analyzing algorithm, and then their relative gray values (RGVs) were resolved based on the characteristics of the gray image. For image processing, an edge searching algorithm was used to identify the separate boundaries for a total of six capture lines. Before analysis, the lateral flow strip was divided into six subsearching regions, respectively corresponding to the six capture lines.
In principle, it is reasonable to use the Sobel operator for capture line searching when its boundary characteristics are significant. However, because of the background fluorescence from the nitrocellulose membrane of the lateral flow strip, there normally is a transitional area between each capture line and its adjacent background, especially when the fluorescence signal of the capture line is relatively weak. Therefore, an optimized Sobel operator was adopted to improve the accuracy of capture line searching. In the improved algorithm, an RGV, which is obtained by subtracting the background gray value from the original gray value, is used to represent the gray value for each pixel.
As shown in Figure 4A , each capture line was searched within the predefined subsearching region with the width of W pixels and height of H pixels. Each capture line area was located by finding the position with the maximal gray value within the searching region. As shown in Figure 4A , instead of using just one pixel, the average gray value of a certain number of pixels from a center symmetric template was introduced for position searching. The cross-shaped template with the width of a pixels and the height of b pixels is beneficial to improve the accuracy and robustness of position searching.
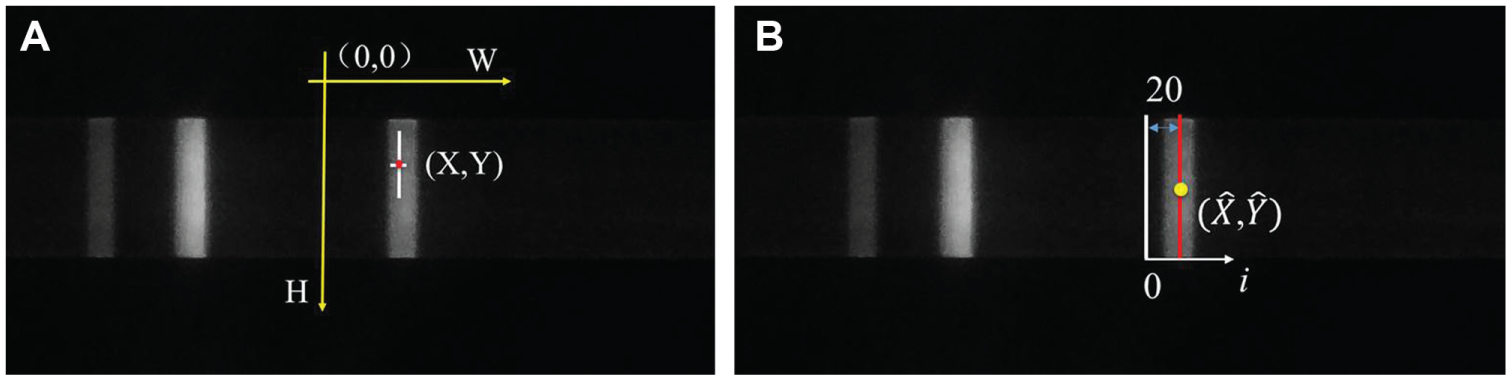
Algorithm for capture line searching. (
The gray value of all pixels in the template is defined as 255. The average gray difference f(X, Y) at position (X, Y) is defined as follows:
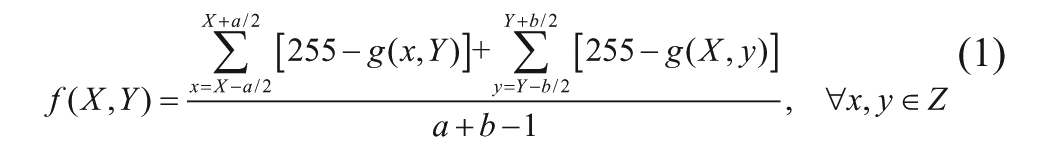
where

After the position of the capture line area was identified with the maximal gray value, the next step was to determine its boundary. As shown in
Figure 4B
, because the physical width of a capture line was set to 20 pixels, for position
First, for each column within the searching area, for example, the i-th column, the approximated average gray difference, S(i), was calculated with the Sobel operator. Then, S_aver, the average value of all S(i) for a total of 20 columns within the searching area, was calculated. The potential positions for the left boundary were recognized among these specific columns, for example, the i-th column when the following condition was satisfied:

The starting position for the left boundary of the capture line area was regarded as the k-th
As shown in Figure 5 , image processing with both the normal and the optimized Sobel operators were compared. The precision of boundary searching for a capture line with the optimized algorithm was better than that of the normal one. As shown in Figure 5A , for the normal algorithm, even parts of the background were regarded as capture lines B and C, which were separately marked with two solid rectangles. As shown in Figure 5B , the nonexistent capture lines B and C were successfully marked with two dotted rectangles by the optimized algorithm, and their RGVs were set to 0.
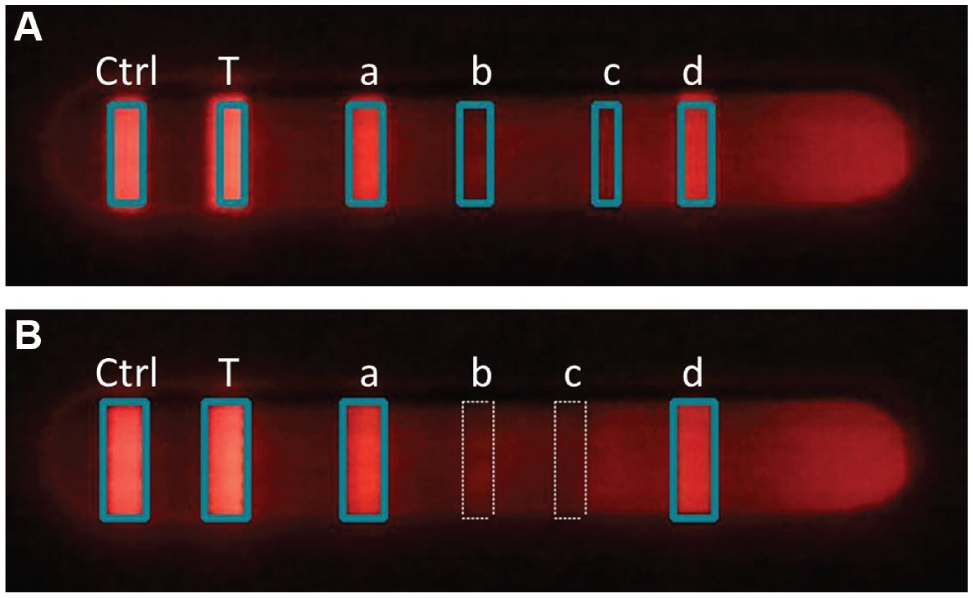
Image processing with the (
HBV Genotyping Model
Based on the immune bioreaction, viral surface antigens from HBV samples with different genotypes are selectively captured by the genotype-specific mAbs respectively immobilized on different capture lines on the lateral flow strip. Accordingly, parts of capture lines show detection signal, while the rest show no signal. As shown in Figure 6 , an HBV genotyping model for smartphone genotyping was developed. HBV genotype can be determined based on the pattern of the fluorescence signal distribution of multiple capture lines on a lateral flow strip, for example, RGV amplitude distribution (RGV(Ctrl), RGV(T), RGV(a), RGV(b), RGV(c), and RGV(d)) of multiple capture lines of a fluorescent signal image. Each case (cases 1–9) with one group of columns represents one type of signal pattern corresponding to one genotyping result, and one column in each case represents the signal amplitude of one capture line on the lateral flow strip. Two different threshold values, which defined the reasonable RGVs to respectively differentiate the Ctrl/T lines (5 is used) and the capture lines a–d (4 is used) from the background, were obtained from experiments.
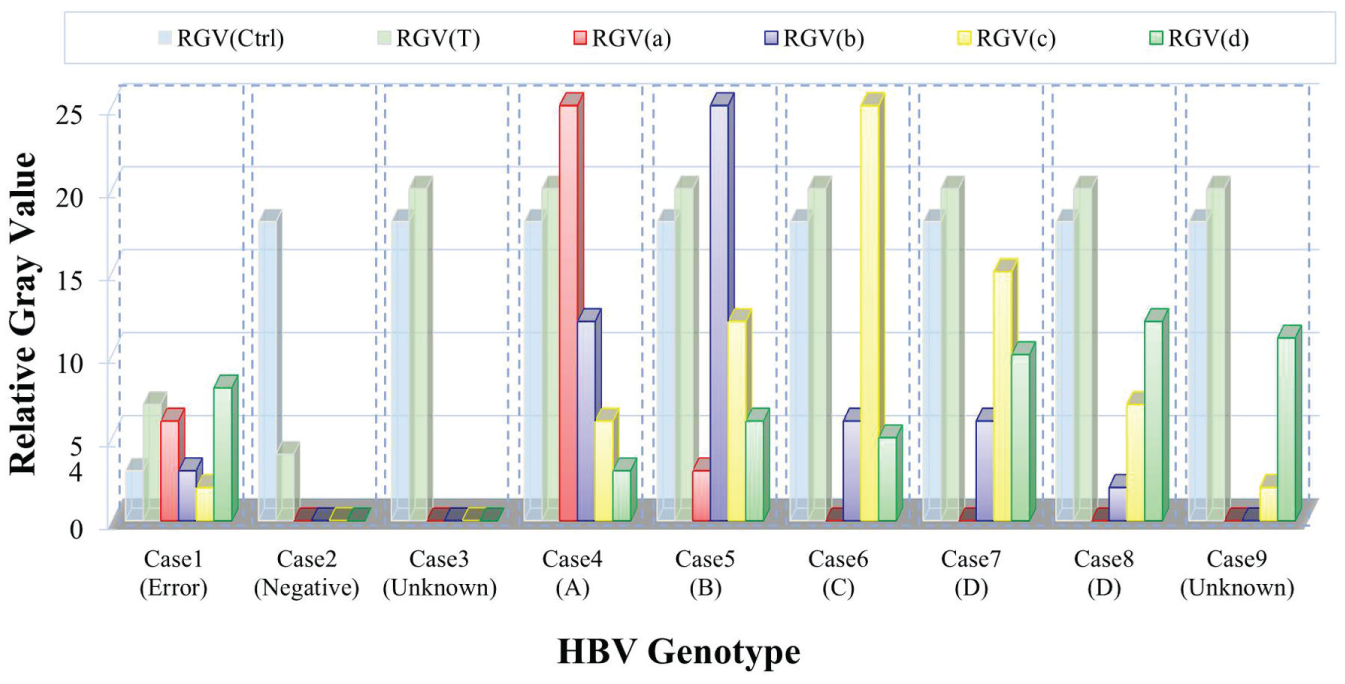
HBV genotyping model based on image analysis.
The HBV genotype is determined based on the genotyping rule described in Figure 6 instead of by simply comparing the signal amplitude of one capture line with the cutoff value. As shown in Figure 6 , for case 1, RGV(CTRL) < 5 means that the test is a failure (Error) because the control line signal is lower than the threshold. For case 2, RGV(CTRL) > 5 and RGV(T) < 5 mean that the test is successfully negative because the T line signal is lower than the threshold. For case 3, RGV(CTRL) > 5, RGV(T) > 5, and RGV(a, b, c, d) < 4 mean that the genotype is undifferentiated (Unknown) because the maximum signal of the four capture lines (a–d) is lower than the threshold. For cases 4 and 5, RGV(CTRL) > 5, RGV(T) > 5, and RGV(a/b) > 4 mean that the genotype is A (A) or B (B) when RGV(a) or RGV(b) is the maximum signal among the four capture lines (a–d). For case 6, RGV(CTRL) > 5, RGV(T) > 5, RGV(c) > 4, and RGV(c) > 4 × RGV(d) mean that the genotype is C (C) when RGV(c) is the maximum signal among the four capture lines (a–d). For case 7, RGV(CTRL) > 5, RGV(T) > 5, RGV(c) > 4, and RGV(c) < 4 × RGV(d) mean that the genotype is D (D) when RGV(c) is the maximum signal among the four capture lines (a–d). For case 8, RGV(CTRL) > 5, RGV(T) > 5, and RGV(c) > 4 mean that the genotype is D (D) when RGV(d) is the maximum signal among the four capture lines (a–d). For case 9, RGV(CTRL) > 5, RGV(T) > 5, RGV(d) > 4, and RGV(c) < 4 mean that the genotype is undifferentiated (Unknown) when RGV(d) is the maximum signal among the four capture lines (a–d). In particular, there is cross-reactivity between HBV genotypes, for example, C and D, and to obtain the accurate genotyping result, the cross-reactivity is solved by the HBV genotyping model based on the signal distribution of multiple capture lines on a lateral flow strip. Because of the natural property of the lateral flow strip, no reasonable HBV genotyping result can be obtained with the developed system for special types of HBV samples with cocirculated genotypes C and D. Since the quantity of this special type of HBV sample is quite low, the developed system focuses on the majority of normal HBV samples with a single genotype (A–D) in China.
Results and Discussion
Experiment with Different HBV Genotypes
In total, six types of test samples, which included four highly positive HBV serum samples with genotypes A–D (HBsAg concentration >100 IU/mL), one highly positive sample with an unknown genotype (HBsAg concentration >100 IU/mL), and one negative sample, were used in the experiment. Once an 80 µL sample was applied onto the sample pad of the lateral flow strip, the fluorescent signal was detected by a smartphone after incubation for 20 min. The working current of the UV LED was set to 40 mA through the microcontroller by the smartphone before detection. As shown in Figure 7 , all the samples with different HBV genotypes were classified successfully.
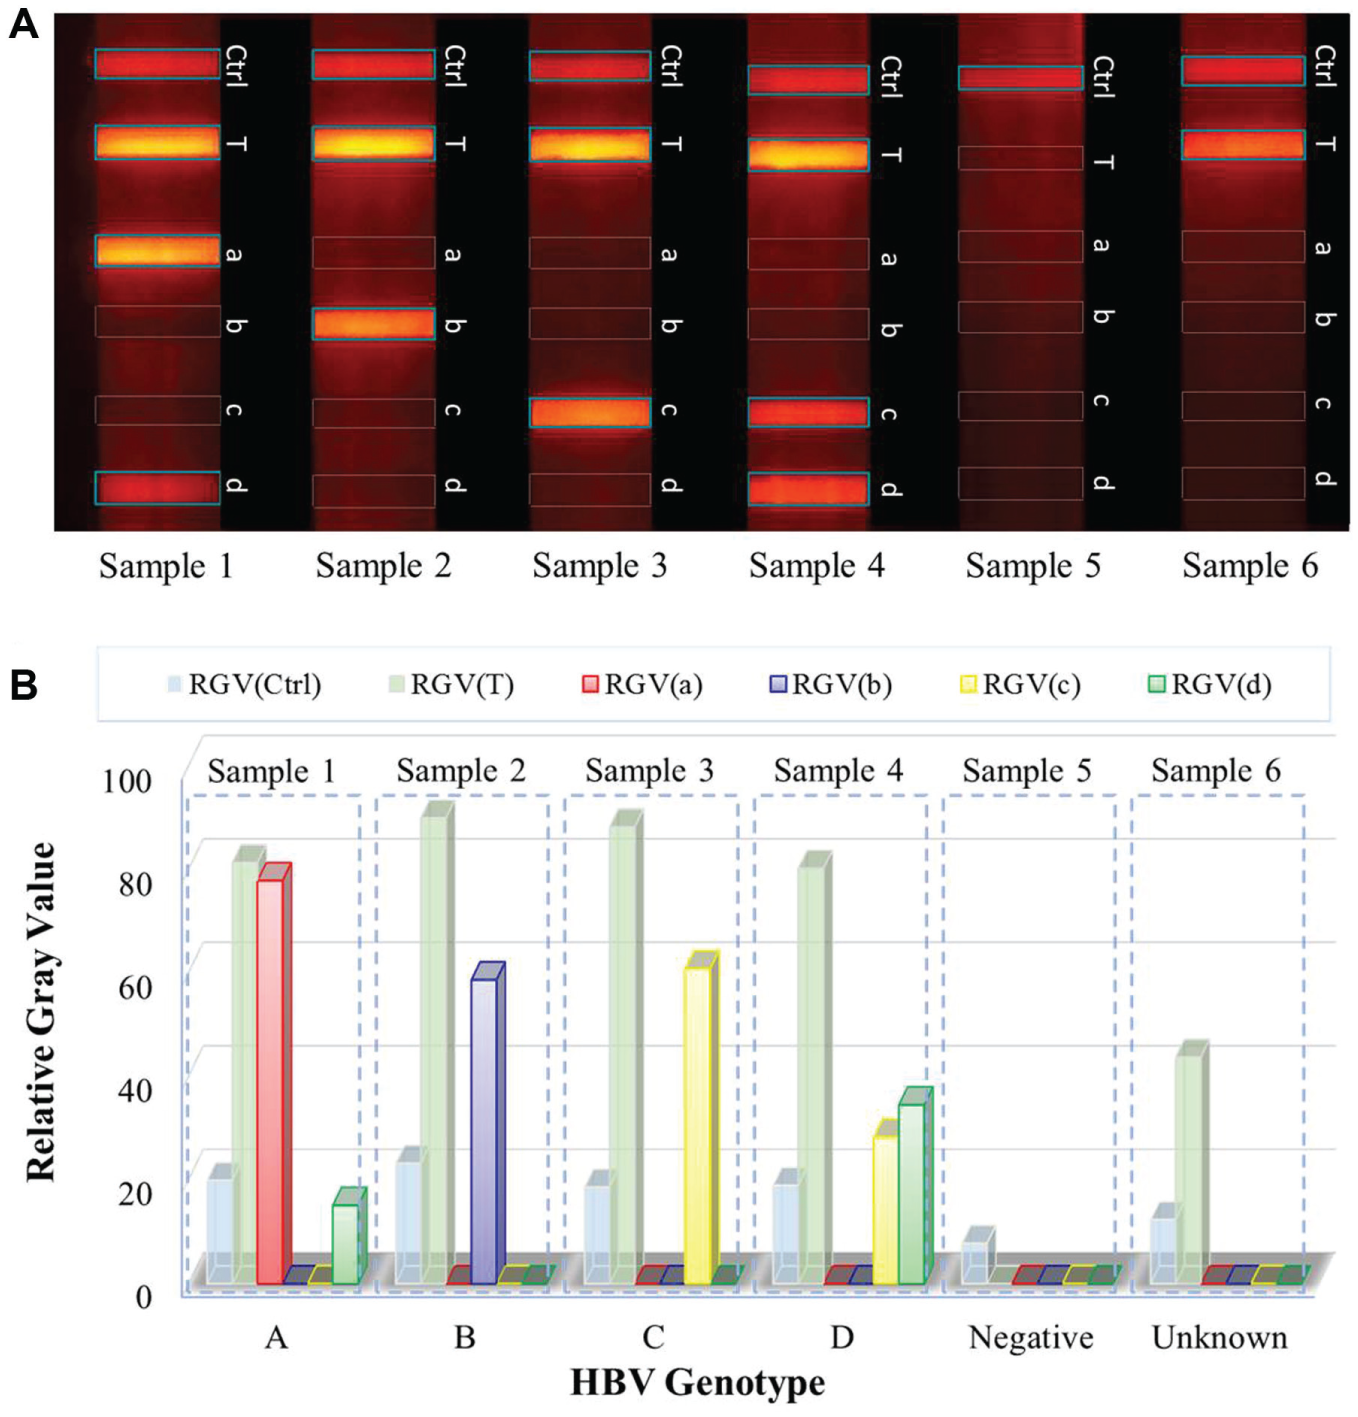
Experiment with smartphone HBV genotyping.
Each experiment was repeated at least three times, and similar experimental results were obtained. As shown in Figure 7B , the HBV genotype can be successfully determined based on the pattern of the RGV signal distribution of the multiple capture lines on the lateral flow strip. Based on other experimental results (data not shown), it was found that the analytical sensitivities (limits of detection of HBsAg) of the smartphone HBV genotyping method for genotypes A, B, C, and D were around 2.5, 5, 5, and 10 IU/mL, respectively, which met the requirement for clinical application.
Experiment with Different Working Conditions
To find the optimal working condition with smartphone HBV genotyping, experiments with different working current values for the UV LED were performed and compared. An HBV-positive sample (genotype B) with a concentration of less than 50 IU/mL was used in the experiment. As shown in Figure 8 , when the working current of the UV LED was continually changed from 50 to 5 mA, different HBV genotyping results were obtained with the same sample.
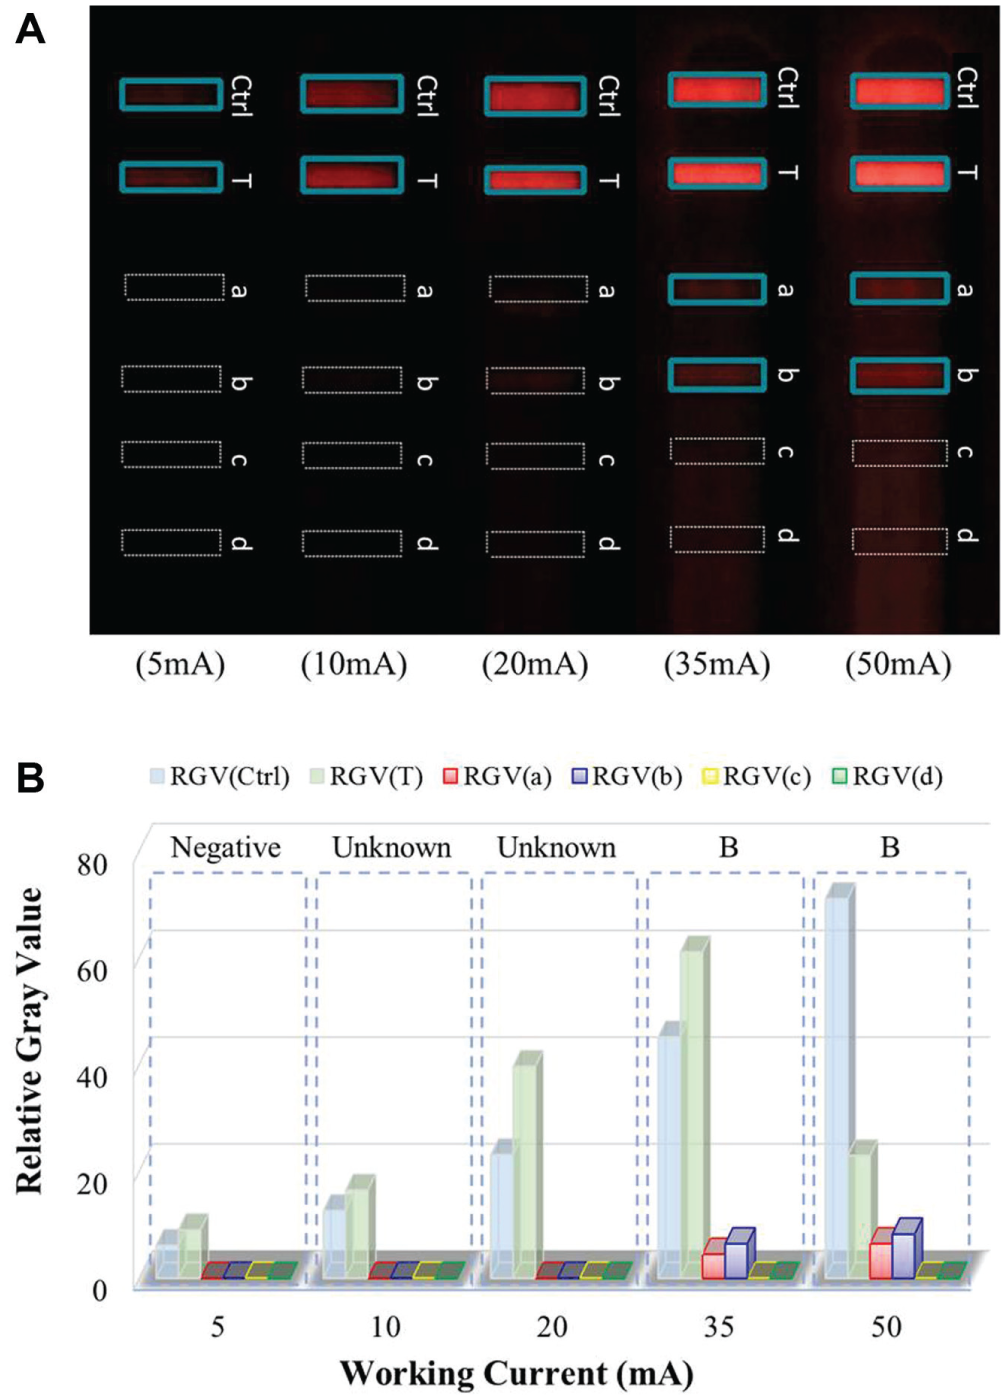
Smartphone HBV genotyping with different working conditions.
As shown in Figure 8 , when the working current of the UV LED was not less than 35 mA, successful HBV genotyping was obtained; otherwise, for 20, 10, or 5 mA, false genotyping results were obtained by the smartphone HBV genotyping. With the flexibility of current setting for the UV LED, low-concentration samples can be successfully detected with high repeatability and reliability by increasing the working current of the UV LED.
Conclusions and Outlook
A fast and low-cost HBV genotyping method based on a smartphone and fluorescent LFIA strip has been developed for POC diagnosis. Functionalized LFIA strips with immobilized genotype-specific mAbs on multiple capture lines are used to selectively capture viral surface antigens from samples with different HBV genotypes. A smartphone is used to collect and analyze the fluorescent image of the LFIA strip until the HBV genotyping result is finally determined based on a genotyping model. In particular, HBV genotypes A, B, C, and D can be differentiated properly with the developed HBV genotyping model. The fluorescent image of the LFIA strip is obtained by a smartphone with its own camera. The fluorescent signal distribution of different capture lines on the LFIA strip is analyzed by the application software running on a smartphone. The HBV genotyping result is displayed on the smartphone and can be transmitted to medical agencies through the communication network if necessary.
With the one-step fluorescent LFIA strips, HBV genotyping can be conveniently obtained by a smartphone within 20 min, which is much shorter than the time it takes the existing methods with nucleic acid analysis. The smartphone HBV genotyping device can be assembled with components costing less than $50, especially when a secondhand smartphone is adopted. Based on qualitative diagnosis, the smartphone genotyping method is able to perform rapid, simple, convenient, and low-cost HBV genotyping with satisfied sensitivity, repeatability, and accuracy, which is quite useful to extend the application for HBV genotyping, especially in POC settings. The smartphone POC platform, with the critical characteristics of portability, low cost, and simple operation, is making on-site diagnosis more convenient, instant, and efficient.
Similarly, genotyping for other diseases can be performed on the smartphone POC genotyping platform with LFIA strips. Besides the functionality of imaging and analysis with its own camera and application software, the smartphone is also able to track the geographical distribution of different genotypes with the capability of communications and GPS recording, which is beneficial to statistically analyzing population genotype based on big data.
Footnotes
Acknowledgements
The authors disclosed receipt of the following financial support for the research, authorship, and/or publication of this article: The work was supported by the National Natural Science Foundation of China (81371711), the Fundamental Research Funds for the Central Universities (ZZ1329, YS1404), and the Key Research Fund of Science and Technology of Fujian Province (2014Y0073).
Declaration of Conflicting Interests
The authors declared no potential conflicts of interest with respect to the research, authorship, and/or publication of this article.