
Abstract
Characterization of gene expression is a central tenet of the synthetic biology design cycle. Sometimes it requires high-throughput approaches that allow quantification of the gene expression of different elements in diverse conditions. Recently, several large-scale studies have highlighted the importance of posttranscriptional regulation mechanisms and their impact on correlations between mRNA and protein abundance. Here, we introduce Edwin, a robotic workstation that enables the automated propagation of microbial cells and the dynamic characterization of gene expression. We developed an automated procedure that integrates customized RNA extraction and analysis into the typical high-throughput characterization of reporter gene expression. To test the system, we engineered Escherichia coli strains carrying different promoter/gfp fusions. We validated Edwin’s abilities: (1) preparation of custom cultures of microbial cells and (2) dynamic quantification of fluorescence signal and bacterial growth and simultaneous RNA extraction and analysis at different time points. We confirmed that RNA obtained during this automated process was suitable for use in qPCR analysis. Our results established that Edwin is a powerful platform for the automated analysis of microbial gene expression at the protein and RNA level. This platform could be used in a high-throughput manner to characterize not only natural regulatory elements but also synthetic ones.
Background
Gene expression quantification has become an essential step to understand a multitude of biological processes.1,2 Accurate characterization often involves high-throughput approaches, which enable the rapid analysis of different regulatory elements. In fact, gene expression profiling coupled with high-throughput methods has been used not only in research, but also for industrial 3 and diagnostic purposes. 4 Usually, expression analysis experiments are based on techniques to measure mRNA or protein abundance at population5,6 or, more recently, at the single cell level.7,8 These techniques can be used to measure global changes at the transcriptional (microarrays, RNA-seq) or protein (proteomic approaches based on mass spectrometry) level.9,10 Although these approaches are good for screening purposes, the precise characterization of regulatory elements usually requires further verification using more sensitive and quantitative assays. 11 Other tactics can be used to measure the expression of specific elements, such as those based on the PCR, termed quantitative PCR (qPCR), or specific promoter/reporter gene fusions.12,13 These procedures have been utilized to understand the performance of specific bacterial genes in different conditions14,15 and characterize the strength of different promoters using them individually 16 or in combination. 17 Recently, several large-scale studies highlighted the importance of posttranscriptional regulation mechanisms and their impact on the correlation between mRNA and protein abundance.8,18 Integrated data, corresponding to different levels of regulation, would be necessary to completely understand the performance of each regulatory unit at a defined condition. Consequently, technologies that can couple gene expression analysis at these two different levels could facilitate the characterization of functional regulatory elements. Besides, as gene expression constantly changes in order to adapt to environmental and intracellular perturbations, 19 its quantification across a dynamic range becomes indispensable. In the case of microbial cells, gene expression is usually quantified at one or several time points of the growth curve. Therefore, automatic monitoring and/or propagation of microbial cell growth is also desirable for gene expression experiments.
In the past years, high-throughput systems that allow bacterial 20 or eukaryotic cell culture 21 have been developed. For microbial cells, monitoring the growth kinetics has been greatly facilitated with the application of plate readers that use optical density (OD) values as indirect estimation of the number of bacteria at each time point. 22 In some cases, these robotic platforms have been upgraded with other devices to automatically monitor the production of florescence proteins 23 or even to perform protein expression and purification. 24
In fact, the utilization of fluorescent proteins, or other kind of reporters to measure promoter performance, 25 has also contributed to the integration of plate readers in high-throughput platforms. 26 However, qPCR quantification of transcripts involves total RNA isolation, first-strand cDNA synthesis by reverse transcription (RT), and qPCR amplification. Each of these steps, in particular extraction of total RNA from a large number of samples, typically requires numerous pipetting steps, restricting its incorporation into automated high-throughput systems. In addition, the duration and the nature of the first step (RNA extraction) makes the simultaneous implementation of both kinds of gene expression analysis (promoter/reporter output and transcriptional analysis) into automated platforms challenging.
Here, we describe Edwin, a robotic workstation, the design of which enables the integration of both kinds of gene expression analysis with the automatic propagation and cultivation of bacterial cells. In order to achieve that, different commercial solutions used in gene expression quantification experiments were integrated with a liquid handling platform and a robotic arm that moves all the labware between the system components. All those instruments are controlled by Overlord3, a software that, in a user-friendly manner, directs the processes that are taking place in each of the commercial devices, integrating their actions in an automatic workflow. We then developed scripts and Overlord3 procedures that allow (1) automatic bacterial propagation, (2) fluorescence and OD monitoring, and (3) simultaneous customized RNA purification/RNA quality analysis at different time points of the growth curve. To validate the system, we engineered different Escherichia coli strains carrying two constitutive promoters of differing strengths and an inducible promoter controlling the expression of the green fluorescent protein coding gene (gfp). First, and to test the performance of Edwin as a robotic platform capable of propagating bacterial cell cultures in a customized approach, we prepared bacterial cultures at different target ODs. Then we validated (using the engineered E. coli reporter strains) Edwin’s ability to extract RNA, in an automatic way, during the dynamic acquisition of fluorescence and OD measurements. Finally, we tested that RNA extracted during the automated procedure described here is suitable to be used in qPCR analysis, and we compared these results with the ones obtained measuring fluorescence production. We can conclude the robotic platform presented here and procedures developed confer a powerful set of tools for automated gene expression analysis at the transcriptional level during time-lapse fluorescence quantification based on promoter and reporter gene fusions.
Methods
Bacterial Strains, Culture Conditions, and General Procedures
The strains used in this study were E. coli XL1-Blue MRF’ (Stratagene, La Jolla, CA) and E. coli DH10B (Invitrogen, Waltham, MA) carrying plasmids with different gfp/promoter fusions. E. coli were grown in Luria Bertani (LB) base media supplemented with 100 µg/mL ampicillin to ensure plasmid maintenance. All cultures were performed at 37 °C and 700 rpm in the plate reader containing 200 µL of LB per well.
Manual cultivation of bacteria cells was performed as follows: E. coli strains were cultured overnight in 2 mL of LB in 15 mL Falcons at 37 °C. Then, OD600 was recorded in the Nanodrop 2000c spectrophotometer (Thermo Scientific, Waltham, MA) and a new black, flat, clear-bottom 96-well microplate (Greiner, Monroe, NC) was inoculated at the specified target OD600 by manual pipetting.
PCRs were performed as follows: 50–100 ng of the template indicated in each case was mixed in a 50 μL reaction mixture with 10 pmol of each of the primers specified and 1 unit of Pfu DNA polymerase (Stratagene). Samples were then subject to an initial step of 5 min at 98 °C and then 30 cycles of 15 s at 95 °C, 15 s at 58 °C, and 2 min at 72 °C, to finish with a final extension of 10 min at 72 °C. Clones were first checked by colony PCR 27 using 1.25 units of Taq DNA polymerase (Roche, Basel, Switzerland) and later confirmed by DNA sequencing.
Other gene cloning techniques and standard molecular biology procedures were carried out according to Sambrook et al. 27
Construction of Plasmids
Plasmids carrying the gfp gene controlled by different promoters were constructed as follows: a 736 bp fragment containing the gfp coding region downstream of a strong ribosome binding site (RBS) was amplified by PCR using as a template Biobrick part BBa_E0040 and the primers B0034GFP1F (gg
To generate a plasmid carrying a promoterless version of gfp, another PCR was performed using as a template Biobrick part BBa_E0040. This time, the primers used were B0034GFP2F (gg
Finally, a 199 bp fragment carrying the Plac promoter flanked by XbaI and SpeI restriction sites (introduced in the primers, uppercase) was amplified using Plac1F (ggTCTAGAgcgcccaatacgcaaacc) and Plac2R (ggACTAGTtaaattgttatccgctcacaatt), using as a template pUC18. This fragment was then cloned XbaI/SpeI into pJ23100, replacing the constitutive promoter J23100 by the Plac promoter and generating pPlac plasmid.
Automated Procedures
All the automated steps performed in this study were executed using the relevant equipment within Edwin, namely, a Biomek FXP liquid handler (Beckman Coulter, Brea, CA), FLUOstar OMEGA plate reader (BMG Labtech, Cary, NC), QIAxcel Advanced capillary electrophoresis system (QIAGEN, Hilden, Germany), and LightCycler 480 II system (Roche). The automatic process presented here involved 96-well plate inoculation with different bacterial strains, cultivation of bacterial cells and monitoring of OD and fluorescence, sample collection for RNA extraction, and RNA extraction and analysis. This process was executed using a specific procedure developed in the Overlord3 software (Peak Analysis and Automation Ltd. [PAA], Hampshire, UK). The Overlord3 procedure encompassed different steps, some of which controlled the movements of the SCARA robotic arm directing the transfer of the labware from one device to another. They also ran, in specific moments of the workflow, (1) the methods developed in Biomek FXP software to collect and prepare liquid samples by automatic pipetting and to extract RNA samples by using the Biomek Filtration System with a Vacuum Valve Unit (Beckman Coulter), (2) the protocols developed in OMEGA software to run the OMEGA plate reader (BMG Labtech), and also, when required, (3) QIAxcel and LightCycler 480 II system methods.
Variables that define the target OD for plate inoculation, samples to be taken for RNA extraction, and columns of the Wizard SV 96 Binding Plates used in the RNA extraction protocol in each step were defined by the user using Overlord3 software. Scripts were written for Overlord3 software (Supplementary Material) in order to generate files defining pipetting patterns for Biomek FXp software based on parameters introduced by the user.
Growth and Fluorescence Assays
Bacterial growth was estimated by measuring the optical density of the cultures at a wavelength of 600 nm (OD600). OD600 and florescence values were recorded in the multimode microplate reader FLUOstar OMEGA (BMG Labtech) when it was defined in the Overlord3 procedure. Bacterial cultures were propagated using 200 µL of LB per well and fluorescence (λex 485 nm, λem 520 nm, and gain 1300), and OD600 was measured using black, flat, clear-bottom 96-well microplates (Greiner). The relative fluorescence values were calculated by dividing the obtained values of total light emission (in arbitrary units) by the OD600 values obtained in the same wells. All the experiments were reproduced by running the Overlord procedure on at least three independent and different occasions.
RNA Extraction
Customized RNA extraction was performed automatically using specific methods developed in Biomek FXP software and SCARA movements, both executed by Overlord3. The procedure comprised three serial stages that started once a defined time point was reached: (1) Biomek Span-8 P250 Tips (Beckmann) and a reservoir containing the required buffers (Polypropylene Deep-Well Plates, Beckmann) were loaded into the Biomek FXP desk. (2) A 96-well plate with bacterial cultures was taken from the BMG OMEGA plate reader by the SCARA robotic arm and transferred to the Biomek FXP desk, where 100 µL of the user-defined samples was mixed with 100 µL of lysis buffer (SV 96 Total RNA Isolation System, Promega, Madison, WI) in the reservoir. The samples taken and the number of columns of the reservoir containing lysis buffer were defined by the scripts (see Supplementary Material). The plate then was transferred back to the plate reader to continue with the recording of OD600 and fluorescence values. (3) The last stage performed in Biomek FXP was completed as follows: The lysates were transferred to specific columns (defined by another script described in Supplementary Material) of the Wizard SV 96 Binding Plate (Promega) sitting on the Biomek Filtration System (Beckman Coulter). After a first washing with 525 µL of washing buffer (96 Total RNA Isolation System, Promega), samples were treated in columns with 1 unit of TURBO DNase (Ambion) at room temperature for 20 min. A second washing step (525 µL of washing buffer) was performed followed by another treatment with DNase at room temperature for 20 min. After the second DNAse treatment, 500 μL of DNAse Stop solution (96 Total RNA Isolation System, Promega) was added to the columns, and after that, they were washed again with 525 μL of washing buffer. Finally, RNA was eluted in a new 96-well plate (elution plate) by adding 175 μL of water to the Wizard SV 96 Binding Plate. The Wizard SV 96 Binding Plate was subjected to 50,796 Pa of vacuum pressure for 3 min after each pipetting step using a Biomek Filtration System (Beckman Coulter). After the last washing step (before the elution), vacuum was applied for 20 min in order to remove residual ethanol from the column. All the RNA extractions were reproduced by running three independent experiments, using the Overlord procedure on different occasions.
RNA Analysis
The procedure developed in Overlord3 also included serial steps for the RNA analysis. The RNA analysis was performed by running the samples in a QIAxcel RNA Quality Control Gel Cartridge (QIAGEN). This part of the Overlord3 procedure also involved four different stages that happened automatically after the last RNA extraction: (1) In the first one, specific tips, plates, and a reservoir containing RNA QIAXcel buffers (QIAxcel RNA QC Kit v2.0, QIAGEN) were placed in the Biomek FXP desk. Then 6 µL of each of the RNA samples was taken from the elution plate and mixed with 6 µL of QIAxcel denaturation buffer (QIAGEN) in a LightCycler 480 Multiwell Plate 96-well plate (Roche). (2) The plate was then transferred by SCARA to the LightCycler 480 II system, where it was incubated for 2 min at 70 °C. (3) A LightCycler 480 Multiwell Plate 96 was then transferred back to the Biomek FXP, and 18 µL of dilution buffer (QIAGEN) was added to the samples. (4) Finally, the plate was transferred using a SCARA robotic arm to the QIAxcel Advanced system device and a specific method to analyze the bacterial RNA was run. All the RNA analyses were reproduced by running three independent experiments, using the Overlord procedure on different occasions.
Transcription Analysis by RT-qPCR
RT-qPCR was performed as follows: The first-strand cDNA was synthesized in 20 µL reaction volumes using 2 µL of total RNA template, 4 µM of specific reverse transcription primers (5′- TTATTATTTGTATAGTTCATC-3′ for gfp and 5′-TAAGGAGGTGATCCAAC-3′ for 16S rRNA) described elsewhere, 29 and the ImProm-II Reverse Transcription System (Promega). The cDNA was diluted 1:80 in nuclease-free water, and 2 µL of this dilution was used as a template in a 20 μL reaction containing 1× LightCycler 480 SYBR Green I Master (Roche) and 10 µM of gfpFw (5′-ATGGCC CTGTCCTTTTACC-3′)/gfpRv (5′-ATGTGGTCTCTCTT TTCGTTG-3′) or 16SFw (5′-GCTACAATGGCGCATACA AA-3′)/16SRv (5′-TTCATGGAGTCGAGTTGCAG-3′) primers. 29 The reactions were run on a LightCycler 480 II System (Roche) using the following program: 5 min at 95 °C and 30 cycles of 15 s at 95 °C, 15 s at 50.5 °C, and 20 s at 72 °C, with a final melting curve of 15 s at 95 °C, 15 s at 60 °C, 10 min gradient to 95 °C, and 15 s at 95 °C. To analyze the RT-qPCR data, the 2-ΔΔCt method 30 was used, taking as a calibrator Ct values corresponding to strain E. coli pGFP. The RT-qPCR values correspond to the averages of at least three biological replicates performed using as a template RNA obtained running the Overlord procedure on different occasions.
Detection of gDNA Contamination in RNA Samples
PCR to check the presence of genomic DNA (gDNA) in the RNA extracted was performed as follows: 2 µL of RNA was mixed with 4 µM of specific reverse transcription primers (described above), but without reverse transcriptase, in a total volume of 20 µL. This mixture (similar to the RT reaction but containing only RNA and the reverse transcription primers) was then diluted 1:80 in nuclease-free water as the cDNA samples prepared before. Two microliters of this dilution or 2 µL of the cDNA diluted 1:80 was used as a template in PCRs using 16SFw/16SRv primers and 1.25 units of Taq DNA polymerase (Roche).
Statistical Comparison of Growth Curves
Parameters derived from growth curves were compared as follows: three individual growth curves produced in different experiments (different performances of the Overlord3 procedure) were fitted to the Gompertz equation 31 using the DMFit program, 32 and maximum specific growth rate (µ), length of lag phase (λ), and maximum cell growth (A) parameters were calculated. The significance of the difference between the averages of these parameters was assessed by using Student t test.
Results and Discussion
Requirements for Automatic Monitoring of Microbial Gene Expression Dynamics
Edwin is a robotic platform designed to measure bacterial gene expression at the population level and integrates in one single procedure two different processes that, individually, are often used in gene expression studies: (1) monitoring of the output of promoter and reporter gene fusions 33 and (2) extraction of suitable RNA for analysis of the transcription by RT-qPCR. 12 The first process has been integrated in a number of different high-throughput platforms due to its nondisruptive nature. 26 However, gene expression analysis of bacterial populations at the transcriptional level requires multiple steps, the first being the disruption of the cells to extract the RNA. This type of analysis requires customized collection of specific samples at different time points during bacterial growth that are usually stored for later RNA extraction, RNA quality control, and stand-alone RT-qPCR analysis. Both approaches described above require, before starting the gene expression analysis, the inoculation of new bacterial cultures with a similar number of cells. 23 The workflow to do this on an automated platform would encompass several sequential and parallel steps: (1) inoculation of different strains in a new plate at a specific OD600 that corresponds to a defined number of cells, (2) OD and reporter gene output monitoring, (3) RNA extraction, (4) usually RNA validation, and finally, (5) RT-qPCR. The automation of all these steps would then require the integration of numerous commercial devices, each designed specifically to perform an individual process, and a central control of workflow and data management through specific software.
Hence, Edwin integrates a liquid handler with a shaking-incubating plate reader, a qPCR system, and a QIAxcel Advanced system for RNA quality control monitoring ( Fig. 1a ). We have further increased the high-throughput nature of this system by pairing all these instruments with a robotically assisted arm ( Fig. 1a , SCARA, PAA) that can transfer samples from one device to another. We also have developed procedures using the custom global governor software, Overlord3 (PAA), which is used to control all the different vendor software and to manage the collection of results. The procedure presented in this work (a schematic version of the procedure and the interplay of the commercial devices is shown in Fig. 1b ) integrates into one single run the automatic inoculation of bacterial strains, monitoring of OD and fluorescence, and personalized RNA extraction and analysis. The process can be customized through the introduction of several user-defined variables in Overlord3 before starting. The user can define the number of RNA extractions, select which samples will be collected for RNA extraction/analysis, and state the specific time points when this will happen. Finally, the RT-qPCR can be done as a stand-alone procedure.
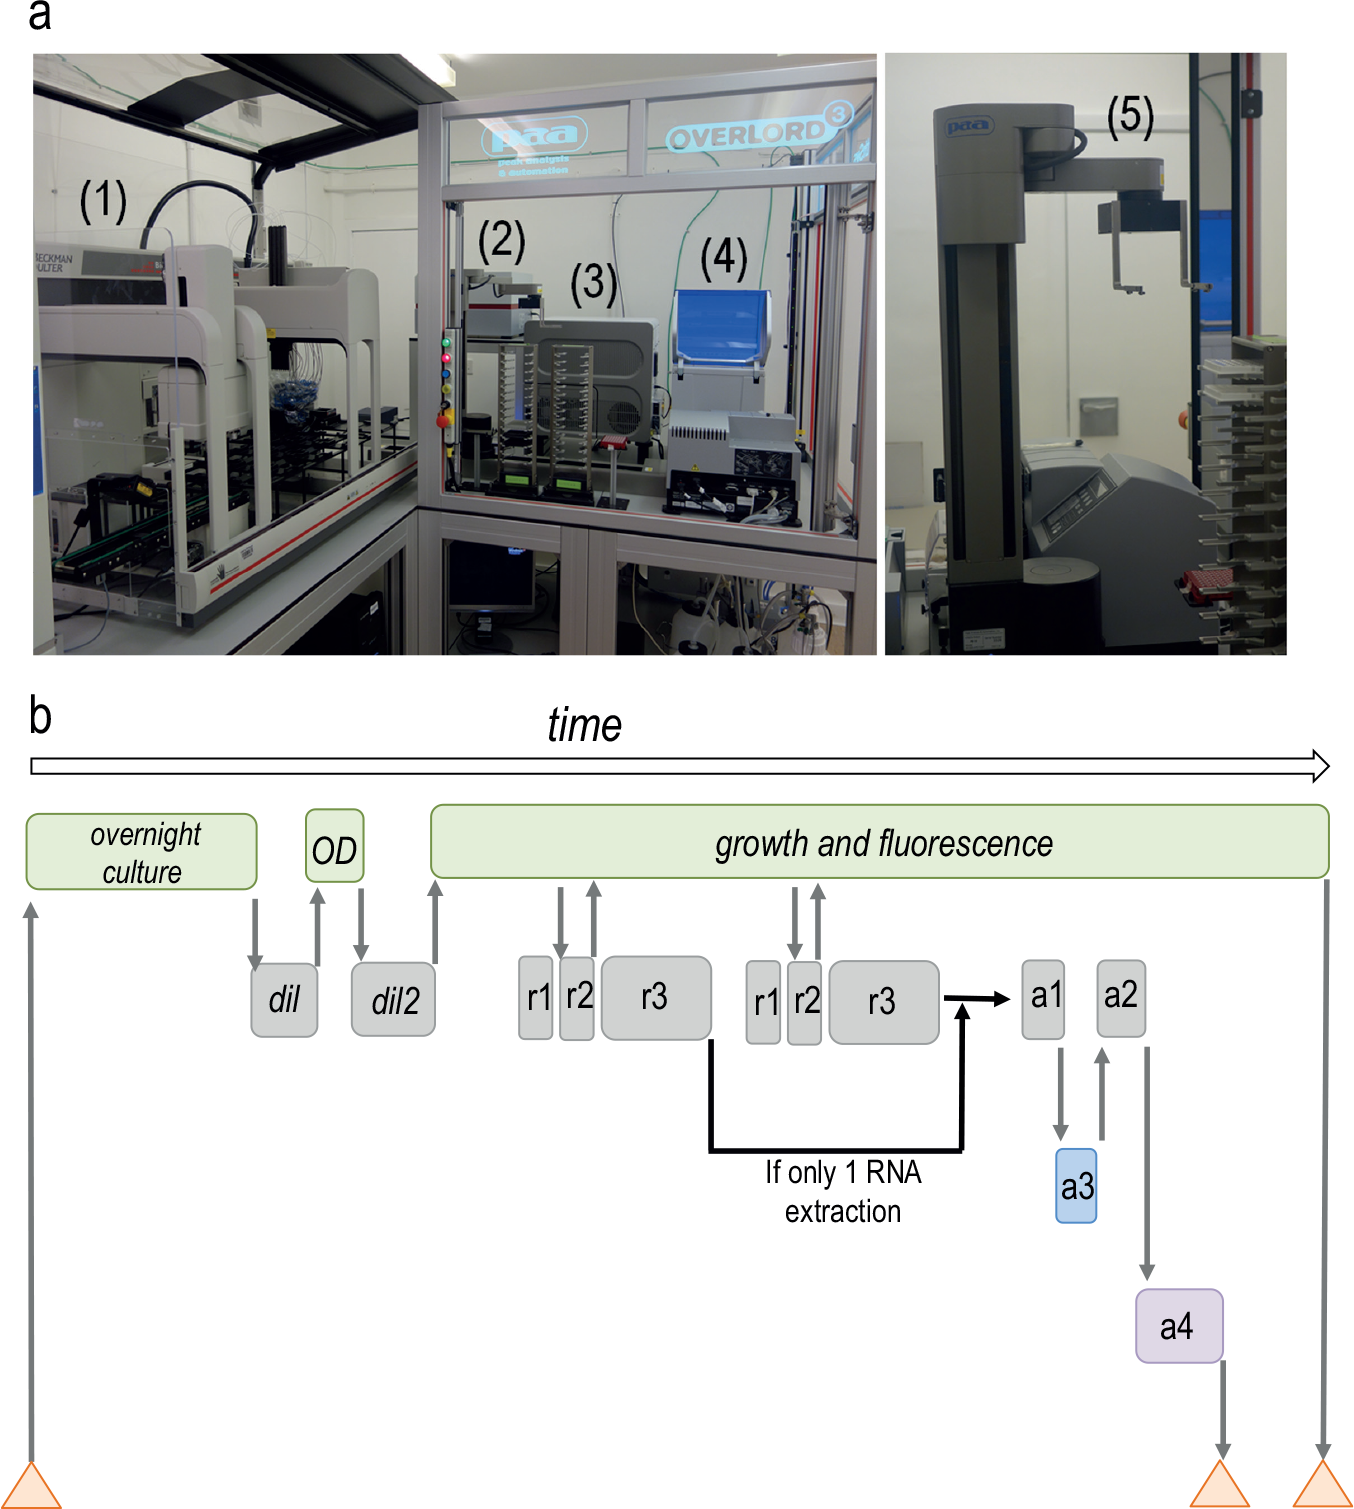
Edwin workflow and parts. (
Automated Inoculation and Cultivation of Microbial Cells
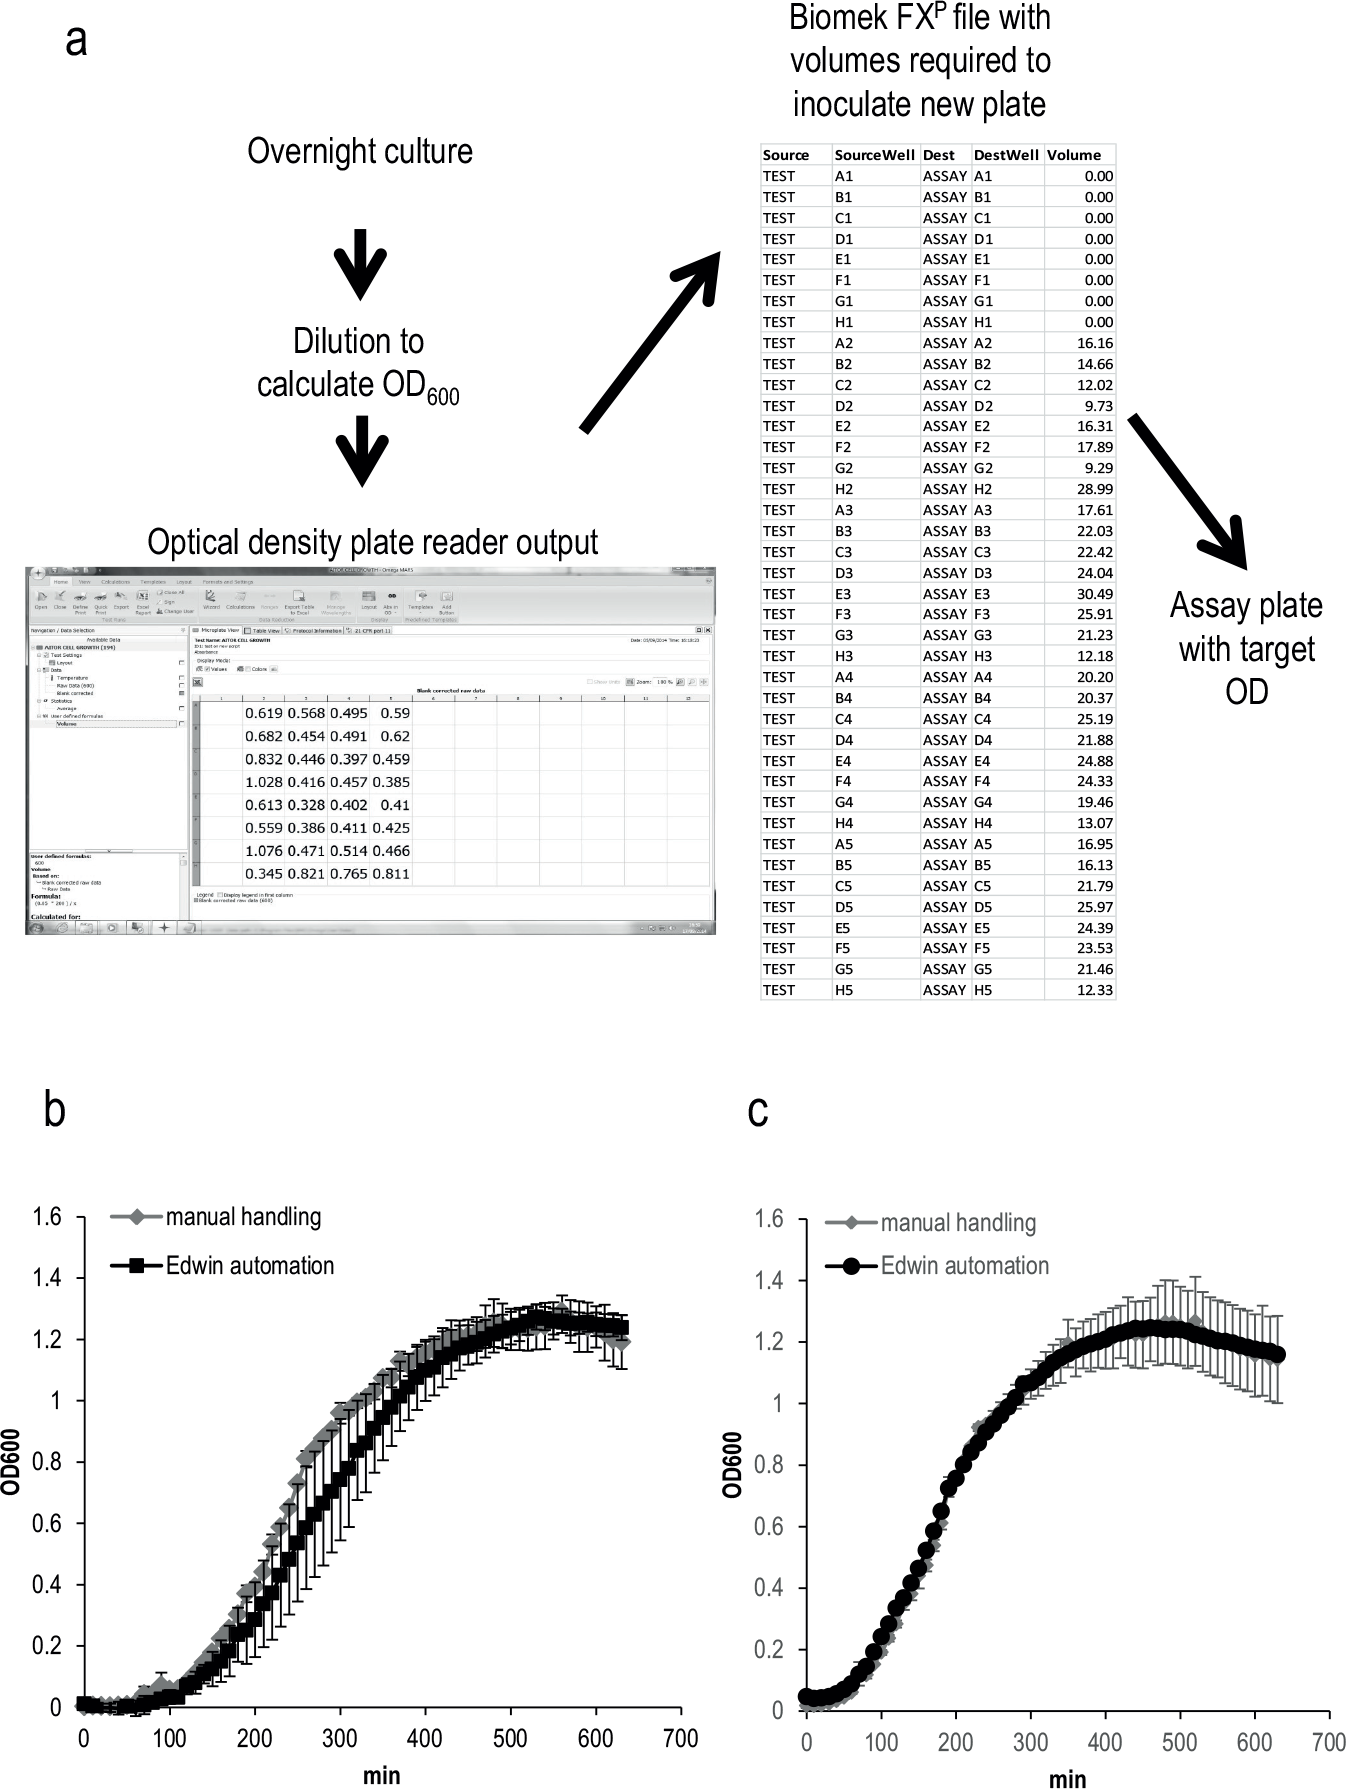
A required step to study bacterial gene expression using plate readers is to prepare a new plate with the strains and conditions that are going to be monitored (assay plate). Thus, Edwin was designed to propagate bacterial cultures by specific dilution. The procedure described in this work includes different steps ( Fig. 1b ): (1) to transfer a plate with overnight cultures to the Biomek FXP deck, (2) to prepare a new plate by diluting the overnight samples with medium in order to decrease the number of cells per milliliter (dilution plate), and (3) to record the OD600 measurements of the dilution plate in the plate reader. Then, a bespoke script written for Overlord3 software defines a pipetting data file by calculating from OD600 values (Script Absorbance converter, Supplementary Material) the volume to be sampled from each well to achieve a user-defined target OD upon dilution. The Biomek FXP software can then read that pipetting data file, taking those volumes from the dilution plate to prepare a new one (assay plate) at the target OD600 defined by the user ( Fig. 2a ), ensuring the same amount of bacteria in each well.
Automated inoculation of bacterial plates. (
To test the ability of Edwin for custom inoculation bacterial cultures, we used an E. coli strain carrying a plasmid with an antibiotic resistance cassette (pPlac, described below). We decided to run the Edwin procedure to inoculate culture plates using two different sizes of inocula and compare those growth curves with the ones obtained by manual handling. In order to do that, we cultured the E. coli strain overnight (see below) and inoculated it into new 96-well plates using two different target OD600 values, 0.01 (
Fig. 2b
) and 0.05 (
Fig. 2c
), by using manual handling or Edwin. Growth curves were fitted to the Gompertz equation
31
using the DMFit program,
32
and maximum specific growth rate (µ), length of lag phase (λ), and maximum cell growth (A) parameters were calculated and compared. The results showed that the µ, λ, and A generated with different target ODs by using Edwin were not significantly different from the ones obtained by manual handling (
Customizing the Automated Procedure for Simultaneous Fluorescence/Growth Monitoring and RNA Purification/Analysis
Edwin has been designed to monitor the dynamics of gene expression at two levels, the protein level using the promoter/reporter gene fusions and the transcriptional level by extracting RNA and quantifying it by RT-qPCR. Automation of gene expression detection by using promoter/reporter gene fusions can be easily achieved using plate readers and/or incubators and multiwell plates ( Fig. 3 ). In general, in these experiments multiwell plates contain technical replicates of each strain/condition to ensure robust measurement of reporter output ( Fig. 3 ). By contrast, integrated qPCR quantification of gene expression during time-course experiments is more challenging, principally due to the first step of the process (total RNA extraction of multiple samples). 34 Protocols/kits to extract total RNA involve numerous pipetting steps, starting with the lysis of the cells. Besides, all of them involve pelleting the cells before mixing them with the lysis buffer. 35 This implies that, in the case of the extraction of all the samples of the same plate, more replicates would be required to continue monitoring reporter gene expression during the rest of the time course.
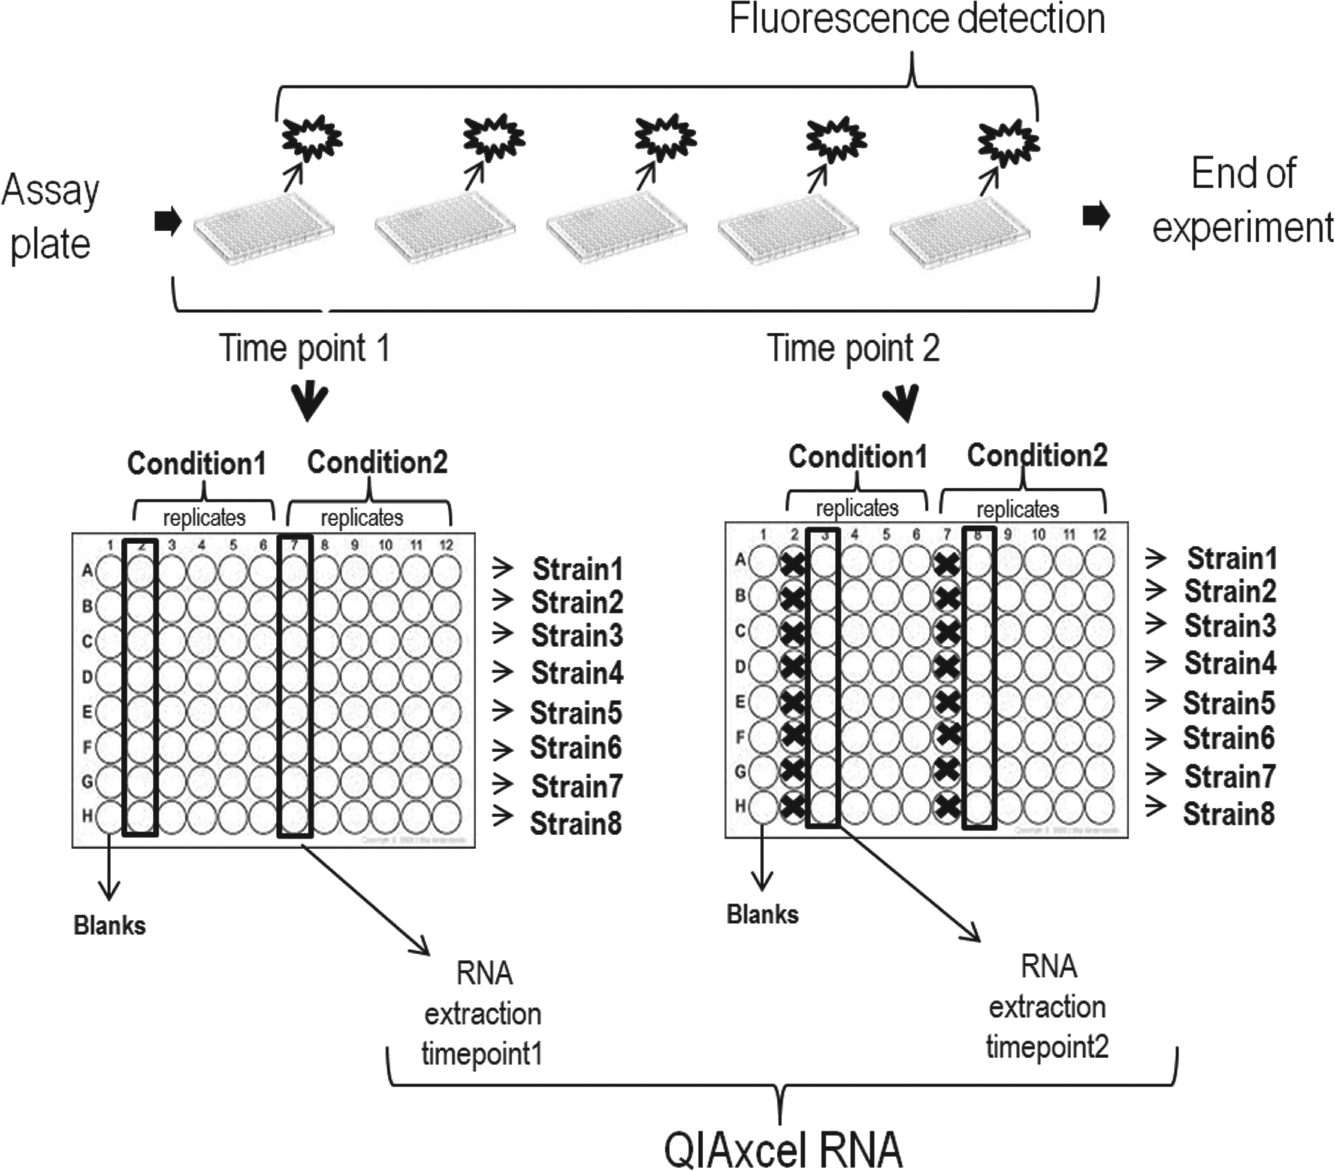
Schematic representation of the Edwin capabilities. Edwin is able to extract and analyze total RNA at different time points, during the typical real-time experiment, to measure reporter gene expression on a plate reader (upper part). The user can choose the wells (columns) that will be taken for RNA extraction among the ones present in the typical plate layout prepared for reporter gene detection (an example layout is sketched). In the following time point, the next column will be selected for RNA extraction. Finally, after the RNA extractions Edwin will perform the RNA analysis, running it automatically in the QIAxcel high-resolution capillary electrophoresis.
In order to overcome this limitation, and to integrate total RNA extraction during a typical time-course reporter gene expression experiment, we developed specific scripts that can be read by Overlord3 software (scripts for automatic RNA extraction, Supplementary Material). Users then can define, at the beginning of the process, which and how many columns of the assay plate (and also of the filter plate used in the RNA extraction process) they want to use for RNA extraction (exemplified in Fig. 3 ). Overlord3 generates files that organize the collection of samples for RNA extraction and the initial steps of this process. The samples present in the selected wells will be collected for RNA extraction when the time point defined by the user is reached. At that specific time, and after recording the reporter gene output, the plate will be automatically transferred to the Biomek FXp deck. The defined samples will then be collected (e.g., a set of technical replicates) and the plate will be transferred back to the plate reader to keep on recording the reporter output while the RNA extraction takes place. In this procedure ( Fig. 1b ), the number of time points where the samples are taken for RNA extraction is limited by the duration of each extraction (approximately 1 h, 20 min). Nevertheless, it is possible to perform an automatic RNA extraction during the growth curve in, at least, two time points ( Figs. 1b and 3 ). The Overlord3 procedure encompasses steps to automatically modify the variables used for the first RNA extraction and to again execute the scripts. This allows subsequent RNA extraction at a later time point of another set of replicates of the assay plate ( Fig. 3 ) using different binding columns in an automatic way. Besides, one important advantage of the procedure we have developed is that total RNA is extracted from liquid samples. These samples are taken directly from the 96-well plate, avoiding the need for freezing and/or pelleting the cells, and therefore decreasing the complexity and duration of the automated process. 35
In addition to the automatic extraction of RNA, we included (in the same Overlord3 workflow) steps that allow automatic analysis of the RNA samples. This process is performed after finishing all the RNA extractions determined by the user ( Figs. 1 and 3 ) by running the samples in a QIAxcel RNA Quality Control Gel Cartridge (QIAGEN) as described in Material and Methods.
Validating Edwin’s Ability to Measure Fluorescence and OD600 in an Automatic Procedure
The design previously mentioned allows an integrated and automatic RNA extraction and analysis during the typical experiment of fluorescence and OD measurement. In order to test this procedure, we decided to engineer different E. coli strains that we could use as a reference. These E. coli strains, named pJ23114, pJ23100, and pPlac, carry the gfp reporter gene under the control of a constitutive weak promoter (Biobrick BBa_J23114), a constitutive strong promoter (Biobrick BBa_J23100), and the IPTG inducible Plac promoter. Before performing any RNA extraction, we decided to first test the ability of Edwin to grow bacterial cultures while acquiring a fluorescence time course. We then inoculated and cultured these strains by using the described procedure, defining no RNA extractions and using LB (and also LB + 10 mM IPTG in the case of the strain carrying Plac→gfp) as a medium to propagate them.
We recorded the fluorescence and optical density values during the time course. The results are shown in
Figure 4
. The constitutive promoters (
Fig. 4a
) rendered values of specific fluorescence that agreed with the strength previously described for these two promoters.
36
Also, in the case of the Plac inducible promoter (
Fig. 4b
), we could observe an increase of the production of the fluorescence when we cultured the strain in the presence of IPTG, an inducer of the Plac promoter. These results confirmed that Edwin is suitable not only to inoculate and culture microbes in 96-well plates but also to monitor the gene expression using reporter gene/promoter fusions in a time-course experiment. Besides, the obtained fluorescence values fell within the range where fluorescence and amount of fluorophore follow a linear correlation (
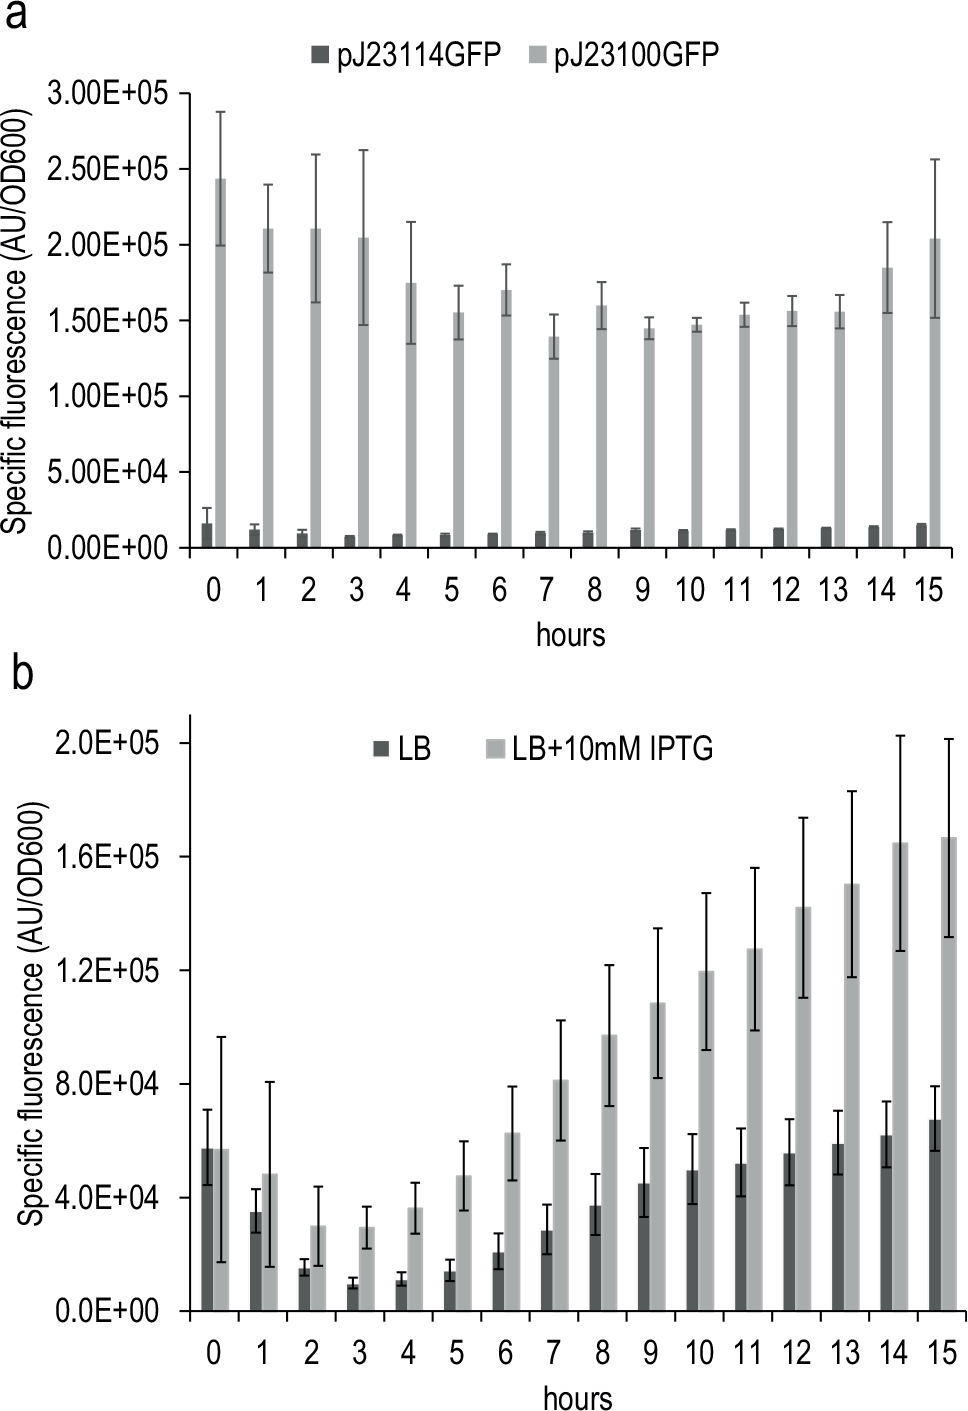
Time course of GFP expression obtained using automated culture shown by E. coli carrying the gfp under the control of a constitutive strong (pJ23100 strain) and constitutive weak (pJ23114 strain) promoter growing in LB (
Validating the Procedure Steps to Extract RNA by Analyzing Its Quality
As we mentioned above, we introduced in the procedure the possibility of performing customized RNA extractions of the samples that are being monitored in the plate reader at different time points. The procedure also allows the user to include an analysis of the quality of the extracted RNA by sensitive, high-resolution capillary electrophoresis in the QIAxcel Advanced system. Based on the image of the electrophoresis, the QIAxcel Advanced system produces two indicators of RNA quality assessment, the RNA Integrity Score (RIS) and the 23S/16S rRNA ratio. To validate these steps, we again ran the procedure with the strains and conditions detailed above, together with a strain carrying the promoterless version of GFP to calibrate in RT-qPCR analysis. We also included the E. coli DB10B strain carrying Plac→gfp as a positive control of Plac expression. This strain does not contain the LacIq repressor of the Plac promoter. Therefore, in this genetic background, the expression mediated by Plac is not induced by the addition of IPTG, which relieves LacIq repression and behaves like a constitutive promoter. We then defined RNA extractions of all these strains at two different time points of the growth curve (times 3 and 6), which represented the middle and late exponential phase. We ran the procedure, including the automatic RNA analysis, after the extraction, which was performed automatically in the QIAxcel Advanced system (a representative image is shown in Fig. 5a ). The obtained capillary electrophoresis images were used to calculate total RNA concentration and the RNA quality indicators. An average of these values for each strain at two different time points is shown in Table 1 . The results indicated that the 23S/16S rRNA ratio of most of the samples is close to 1.82 (SD ±0.16) and that the RIS index about 6.04 (SD ±0.27). These results showed that RNA quality obtained by running the Edwin automatic procedure was suitable for downstream applications.37,38
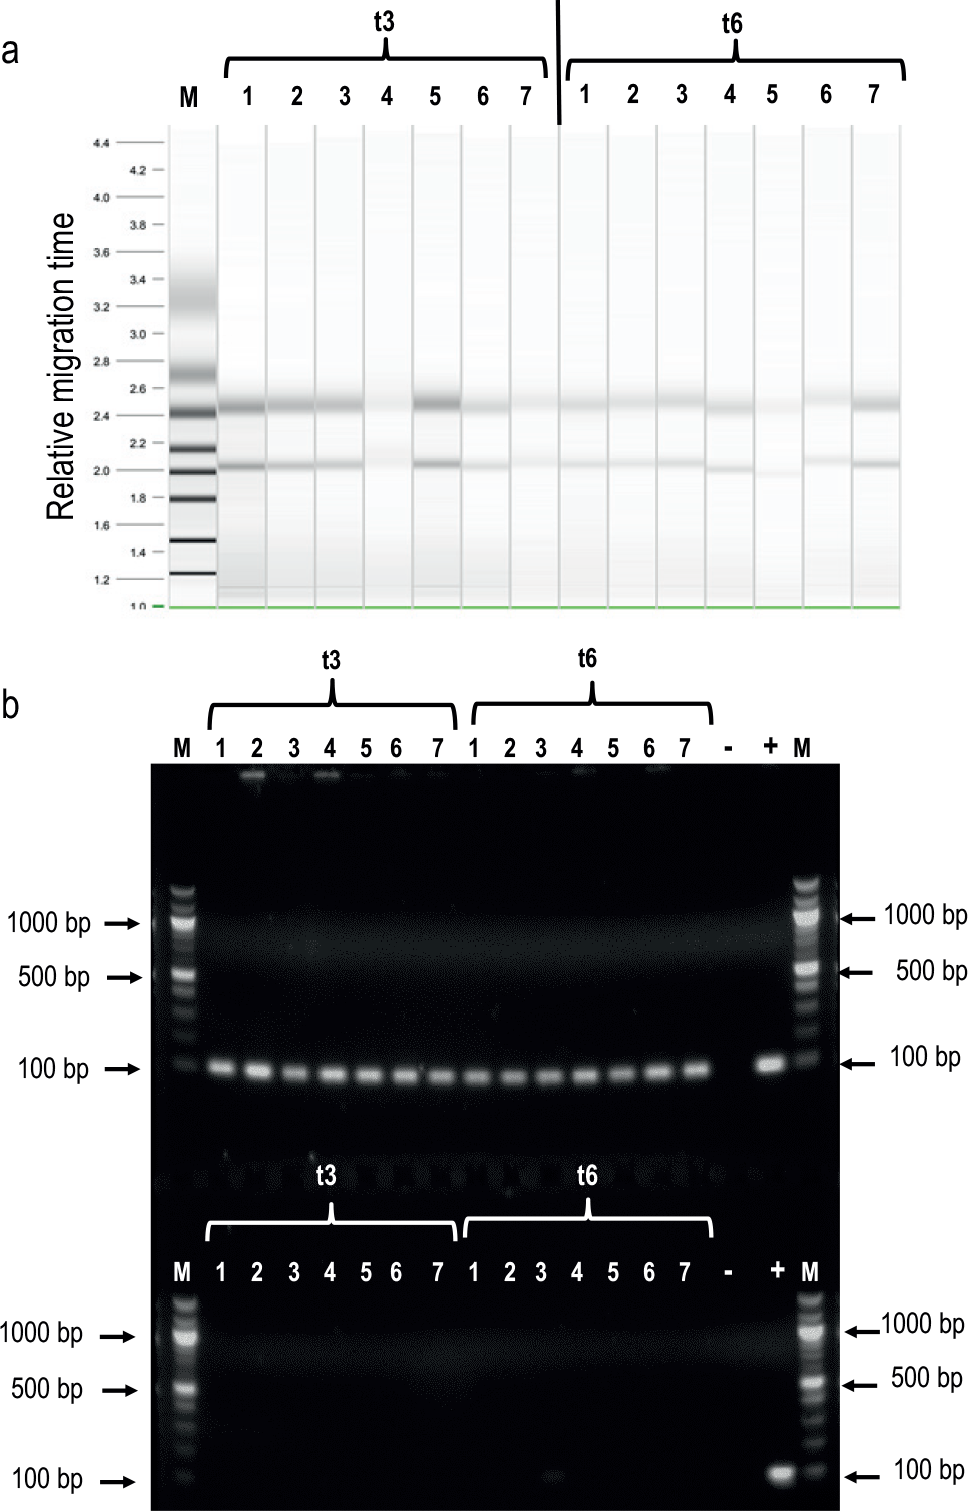
RNA quality obtained by using Edwin’s procedure. (
Quality of RNA Extracted Using Edwin.
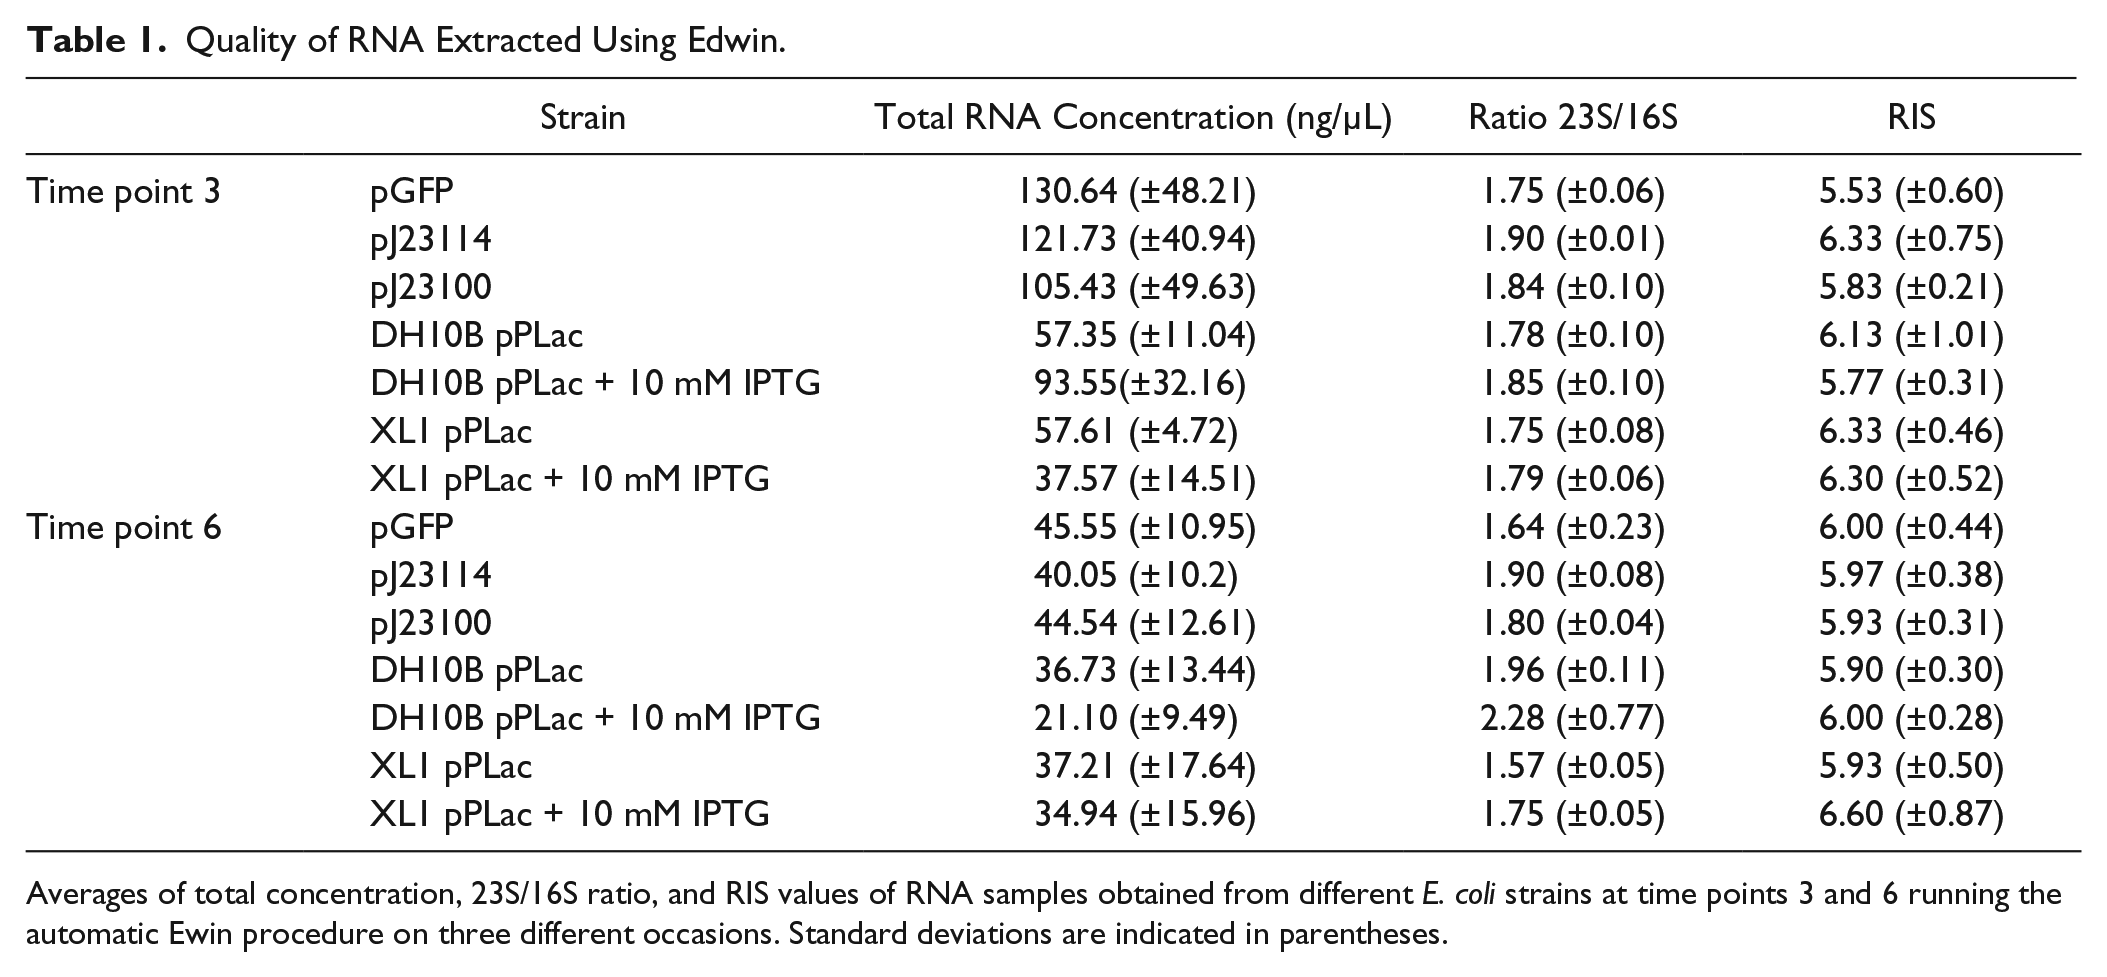
Averages of total concentration, 23S/16S ratio, and RIS values of RNA samples obtained from different E. coli strains at time points 3 and 6 running the automatic Ewin procedure on three different occasions. Standard deviations are indicated in parentheses.
Finally, and because the presence of gDNA in RNA samples can lead to nonspecific amplification 39 in the RT-qPCR analysis, we decided to check that the extracted RNA was free of gDNA. In order to do that, we amplified by PCR a fragment of the 16S rRNA housekeeping gene using as a template aliquots of the RNA extracted or the corresponding cDNA obtained after the reverse transcription reaction. The results showed a 101 bp band corresponding to 16S rRNA only when the cDNA was used as a template, indicating that RNA is free of gDNA ( Fig. 5b ).
RNA Extracted by Edwin Is Suitable for RT-qPCR Analysis
Our results indicated that total RNA extracted during the automated process was not degraded; it was clean and free of gDNA. Nevertheless, in order to confirm that it was suitable for transcriptional analysis, we performed RT-qPCR. We used as a reference the values obtained for the E. coli pGFP (strain carrying the promoterless gfp) to calculate relative levels of mRNA for each promoter. The RT-qPCR results ( Fig. 6a ) for the constitutive promoters (J23114 and J23100) indicated that both promoters maintain the same rate of transcription at two different time points, with J23100 being approximately fourfold stronger than J23114. Although the rate of induction (between 3.5 and 4 times) observed at the transcriptional level is different from that obtained from monitoring the fluorescence ( Fig. 4a , about 15-fold higher), the transcriptional results confirmed the constitutive nature of both promoters and their relative strengths.
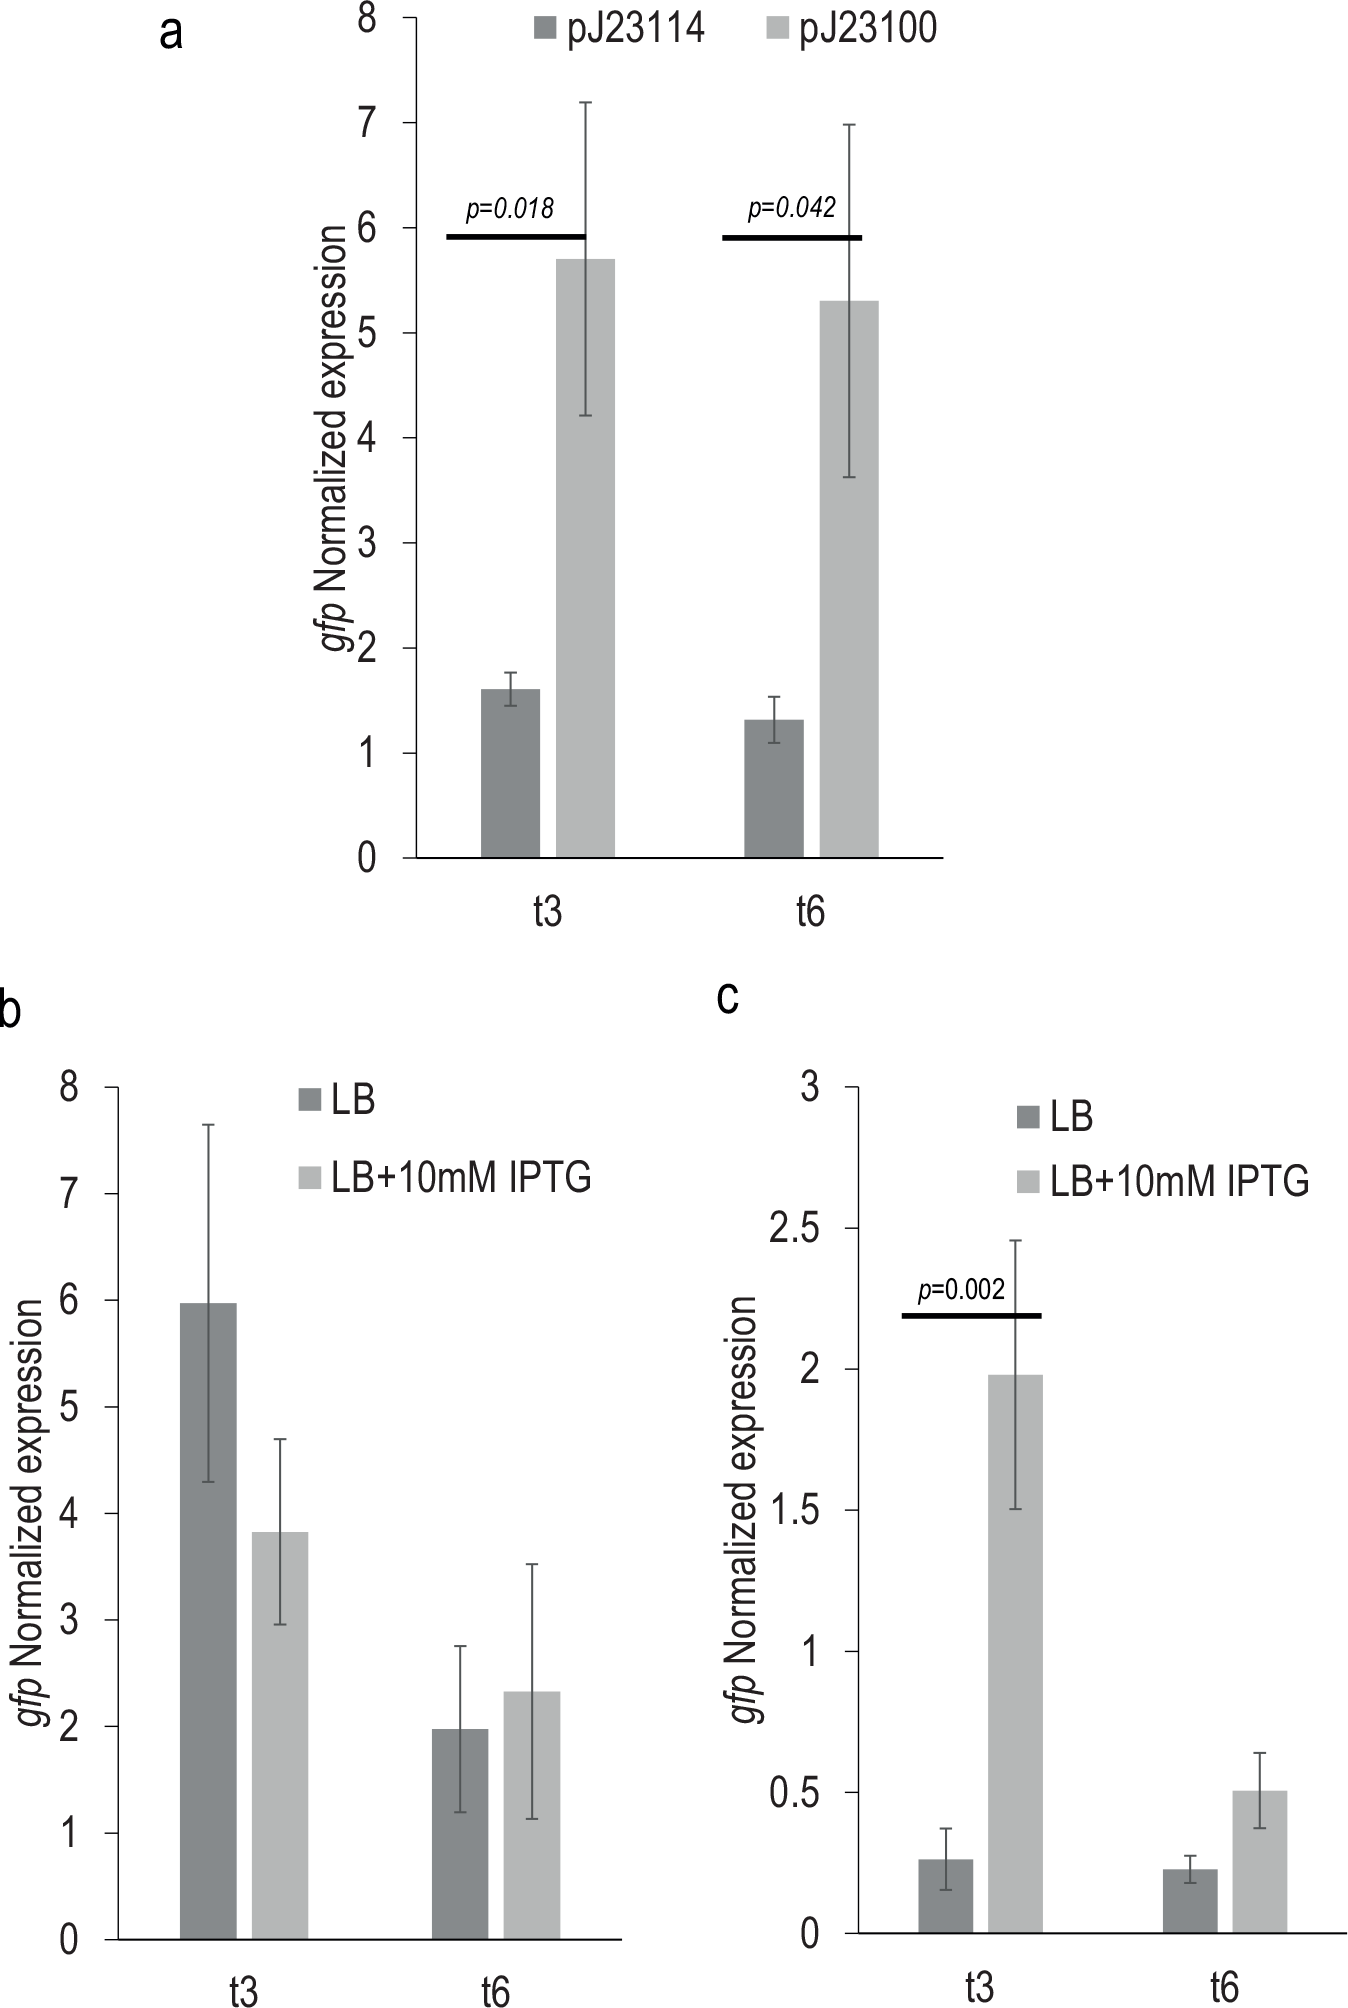
Analysis of expression at the transcriptional level using RNA samples obtained by automation. RT-qPCR analysis of the gfp expression at time points 3 (t3) and 6 (t6) of E. coli strains pJ23114 and pJ23100 growing in LB (
With regard to the Plac inducible promoter, it was not possible to observe differences between noninducing (LB) and inducing conditions (LB + IPTG) in E. coli strain DH10B corresponding to the lack of the repressor LacIq ( Fig. 6b ). The RT-qPCR analyses also showed a clear induction of Plac promoter in the presence of IPTG in the E. coli XL1-Blue MRF’ strain at time point 3, confirming the suitability of the procedure to also detect expression driven by inducible promoters ( Fig. 6c , regulated system). Nevertheless, our data showed that the levels of expression of the Plac promoter in the presence of IPTG at time point 6 were lower than at time point 3 and not significantly different from noninducing conditions, suggesting a decrease of the promoter activity. Also, in this case, the differences observed in the levels of mRNA for the inducible promoter did not correlate with the fluorescence values obtained with the plate reader ( Fig. 4b ). This discrepancy could be explained by the different degradation rates of the mRNA and the GFP, leading to an accumulation of the protein after induction of promoter. Taken together, these results indicated that the RNA automatically extracted during the process is suitable for RT-qPCR analysis, and also they support previous work that points to a reduced correlation between mRNA and protein abundance in some cases at single cell and population levels.8,18,40
Conclusions
Edwin, the robotic platform presented here, has been designed to measure gene expression at the protein and RNA level in microbial systems. This kind of characterization has become an essential step of the design cycle workflow used in synthetic biology. 26 Recently high-throughput platforms have been used to characterize biological parts; however, they typically incorporate liquid handling robots coupled with plate readers,16,17 which only allows quantification of gene expression based on the amount of reporter protein. Monitoring gene expression at the RNA level, using standard techniques, requires several process steps and raises the difficulty of integrating this kind of analysis in high-throughput platforms. 34 Transcriptional analysis by qPCR requires the extraction of RNA. In general, this step involves the collection of samples and several pipetting steps, thus limiting its incorporation in time-course experiments. 17 Therefore, we developed Edwin’s scripts and tools to facilitate automated RNA extraction analysis within a typical high-throughput procedure for the dynamic assessment of gene expression. We tested the system with two constitutive promoters and the Plac inducible promoter. Our results confirmed that Edwin can be used to monitor gene expression using promoter/reporter fusions and, at the same time, extract and analyze the RNA at different time points for a later RT-qPCR analysis. Our results also support previous evidence that suggests a low correlation between the abundance of mRNA and protein levels. 8 Therefore, the analysis of the expression at both levels ought to be valued not only to decipher putative posttranscriptional mechanisms in natural promoters, but also to get a deeper characterization of the regulatory regions and lead to an optimization of parameters used in systems biology. The tools presented here can be used to (1) perform the characterization of natural regulatory elements at transcriptional and translational levels in different conditions (e.g., regulated systems in the presence of the inducers and/or repressors); (2) study the relations between the mRNA and protein levels in order to investigate regulatory events acting at the posttranscriptional level, such as riboswitches or small RNA (sRNA) 18 ; or (3) characterize new synthetic regulatory elements.41–43
Footnotes
Acknowledgements
We thank our Flowers Consortium colleagues Dr. Geoff Baldwin and Prof. Paul Freemont (Imperial College London) for helpful discussions. We also thank Dr. Lorraine Kerr and Eliane Salvo-Chirnside for their helpful advice about RNA extraction. Also, we recognize the efforts of Andy Mash, Andrew Melrose, and Joe Warren of Peak Analysis and Automation (PAA) in the development of Edwin.
Authors’ Contributions
ADLH performed the experiments, built and ran automation procedures, and analyzed the data. WX wrote Overlord3 scripts for custom RNA extraction.
ADLH, WX, and VS set up and adjusted physical parameters to optimize the robotic platform processes. AE conceived of and designed the robotic platform. ADLH and AE designed the experiments and wrote the article.
Availability of Supporting Data
Declaration of Conflicting Interests
The authors declared no potential conflicts of interest with respect to the research, authorship, and/or publication of this article.
Funding
This work is delivered as an activity of the Flowers Consortium, for which we recognize the financial support of the EPSRC (EP/J02175X).
References
Supplementary Material
Please find the following supplemental material available below.
For Open Access articles published under a Creative Commons License, all supplemental material carries the same license as the article it is associated with.
For non-Open Access articles published, all supplemental material carries a non-exclusive license, and permission requests for re-use of supplemental material or any part of supplemental material shall be sent directly to the copyright owner as specified in the copyright notice associated with the article.