
Abstract
Use of a smartphone as an optical detector for paper microfluidic devices has recently gained substantial attention due to its simplicity, ease of use, and handheld capability. Utilization of a UV light source enhances the optical signal intensities, especially for the particle immunoagglutination assay that has typically used visible or ambient light. Such enhancement is essential for true assimilation of assays to field deployable and point-of-care applications by greatly reducing the effects by independent environmental factors. This work is the first demonstration of using a UV LED (UVA) to enhance the Mie scatter signals from the particle immunoagglutination assay on the paper microfluidic devices and subsequent smartphone detection. Smartphone’s CMOS camera can recognize the UVA scatter from the paper microfluidic channels efficiently in its green channel. For an Escherichia coli assay, the normalized signal intensities increased up to 50% from the negative signal with UV LED, compared with the 4% to 7% with ambient light. Detection limit was 10 colony-forming units/mL. Similar results were obtained in the presence of 10% human whole blood.
Introduction
Paper microfluidics has become a popular sensor platform due to its simplified patterning protocol,1–4 smaller sample volume, and filtration capability. 5 Many different chemical and biological assays have been demonstrated on paper microfluidics, such as detecting glucose,4,6 proteins,4,7,8 cholesterol,4,9 enzymes, 10 antibodies, 8 and so forth.11,12 Incorporating smartphone detection to paper microfluidics has also gained significant attention,5–8,13–16 toward field-deployable, low-cost, and easy-to-use chemical and biological assays. Detection of pathogenic bacteria from myriads of sample matrices, including field/waste water, food samples, stool, urine, and blood from animals/humans would be the ultimate yet challenging application of paper microfluidics assay with a smartphone.
A latex particle immunoagglutination assay can be used to achieve very sensitive detection of bacteria. It is a robust method of detecting a target antigen by using antibody-conjugated latex particles (typically submicron polystyrene particles) and subsequent Mie scatter detection. The antibody-conjugated latex particles form aggregates in the presence of corresponding bacterial antigens and subsequently change the extent of angle-specific Mie scattering. 17 Our group has recently demonstrated this assay on paper microfluidics with a smartphone to detect Escherichia coli and Salmonella Typhimurium with the limit of detection of 10 colony-forming units (CFU)/mL.5,13,16 Optimizing the angle of the Mie scatter detection and minimizing the background scatter from paper fibers enabled high sensitivity and subsequently a very low limit of detection. However, the change of normalized signal intensity was only up to 5% to 7% over the negative control, partly due to its inherent limitation in distinguishing between the target and the nontarget signals. Although the small error bars confirmed statistically significant sensitivity for bacterial detection, other independent factors in environmental conditions (such as ambient lighting, temperature, humidity, paper porosity) can overshadow this small signal change. This situation applies to not only the particle immunoagglutination assay but also any type of chemical/biological optical assays toward translating them into field-deployable and point-of-care applications.
One method of improving the signal change is the use of a shorter wavelength light source, such as UV LED (ultraviolet light emitting diode). UV light would provide higher energy to the particles and subsequently allow stronger scatter than visible light (E = hc/λ, where E is the energy, h is the Planck constant, c is the speed of light, and λ is the wavelength of light). Use of UV light toward handheld biosensing, however, requires caution as it can be dangerous to human skin and eyes. Therefore, longer wavelength UV such as UVA (315–400 nm) would be preferred over UVB (280–315 nm) or UVC (100–280 nm).
There exists one potential problem in using UV LED toward smartphone-based Mie scatter detection. Can a smartphone’s camera recognize UV light? If so, which color channel should be used? Toward this end, the response characteristics of a smartphone camera (complementary metal oxide semiconductor or CMOS array) to UV irradiation was investigated. In addition, a Mie scatter simulation was conducted to confirm whether the UV light generates a greater change in scatter intensity upon immunoagglutination than visible light. A standard curve was also constructed for varying concentrations of Escherichia coli using a paper microfluidic platform and smartphone detection, without using any optical filter. Finally, the E. coli assay was repeated with whole blood (in 10% dilution) to assess the enhanced scatter from UV LED, which has not been demonstrated previously. Thus, the utilization of a UV light source may be imperative for true assimilation of assays to field-deployable and point-of-care applications.
Materials and Methods
Prior to the assays, Mie scatter simulations were conducted using MiePlot software 18 to compare the scatter intensities from polystyrene (PS) particles under green (representative visible or ambient light) versus UV light.
The paper microfluidic chips were fabricated using cellulose chromatography paper (GE Healthcare, Maidstone, Kent, UK) and SU-8 negative photoresist (MicroChem, Newton, MA), following the same method as described in Park and Yoon 5 and Park et al. 13 Three keyhole-shaped channels were printed on each chip with a 4.5-mm × 3.5-mm rectangular inlet, 2.5-mm wide × 11.5-mm long channel, and 4.5-mm × 5.5-mm oval-shaped adsorbent pad. The first channel was designated negative, the second low positive, and the third high positive.
Polyclonal antibody to E. coli (anti–E. coli; Meridian Life Science, Memphis, TN)–conjugated PS particles (diameter = 920 nm; Magsphere, Pasadena, CA) were prepared following the protocol described in Park and Yoon 5 and Park et al. 13 and loaded to the center of each paper microfluidic channel (low and high positive channels) and subsequently dried. Bovine serum albumin (BSA)–conjugated PS particles (0.5 µg) were loaded to the negative channel to generate the negative signal without necessarily using a separate, blank control. A total of 0.5 µg of particles was loaded to each channel. Prior to loading to the paper channels, the antibody- or BSA-conjugated particles were soft-centrifuged 16 to isolate unstable particles from the suspension.
E. coli K12 (Sigma-Aldrich, St. Louis, MO) was cultured in brain heart infusion growth media (Remel, Lenexa, KS) for 12 h at 37 °C. The fully grown bacteria culture (108 CFU/mL; confirmed by MacConkey agar plating) was serially diluted in deionized water to make 10, 102, 103, 104, and 105 CFU/mL samples. Then, 1% Tween 80 (Sigma-Aldrich) was added to each serially diluted E. coli solution at a 1:10 ratio, which isolates the antigens from the viable colonies that can travel through the paper fibers. 7 µL of the E. coli sample was loaded on the inlets of negative and positive channels.
The UV LEDs (275, 340, 365, 375, 385, and 395 nm; Seoul VioSys, Ansan, Republic of Korea) irradiated the paper microfluidic chip at an incident angle of 30° to the chip surface, and the smartphone took the image at 25° from the chip surface ( Fig. 1 ). These angles were optimized from a series of experiments that maximized the Mie scatter intensities from the PS particles and minimized the background scatter from paper fibers, using the procedure described in Park et al. 13 The smartphone took two images before (background image) and after (signal image) the sample was loaded. The focus, exposure, and white balance were all locked to their optimal values to maximize the contrast and dynamic range, predetermined from our previous work. 16 The images were split into red (R), green (G), and blue (B) channels, and the rectangular crops were made for each detection zone (where the particles were loaded) using ImageJ (National Institutes of Health, Bethesda, MD). In this manner, the scatter intensities were evaluated for each channel. For each channel, the scatter intensity from a signal image was divided by that from a background image to provide the normalized intensity (I = Is / Ib) to compensate for the variations in chip fabrication, wetting and lighting conditions, and so on. The normalized scatter intensity from a positive channel (i.e., with anti–E. coli particles) was compared with that from a negative channel (i.e., with BSA particles), and percent scatter increase from a negative channel was evaluated, this time to compensate for the differences in the scattering characteristics and amount of the loaded particles. The whole experiment was repeated three times, each time using different samples and different paper microfluidic chips. Identical experiments were performed using the E. coli samples spiked into 10% (v/v) diluted human whole blood (Interstate Blood Blank, Memphis, TN).
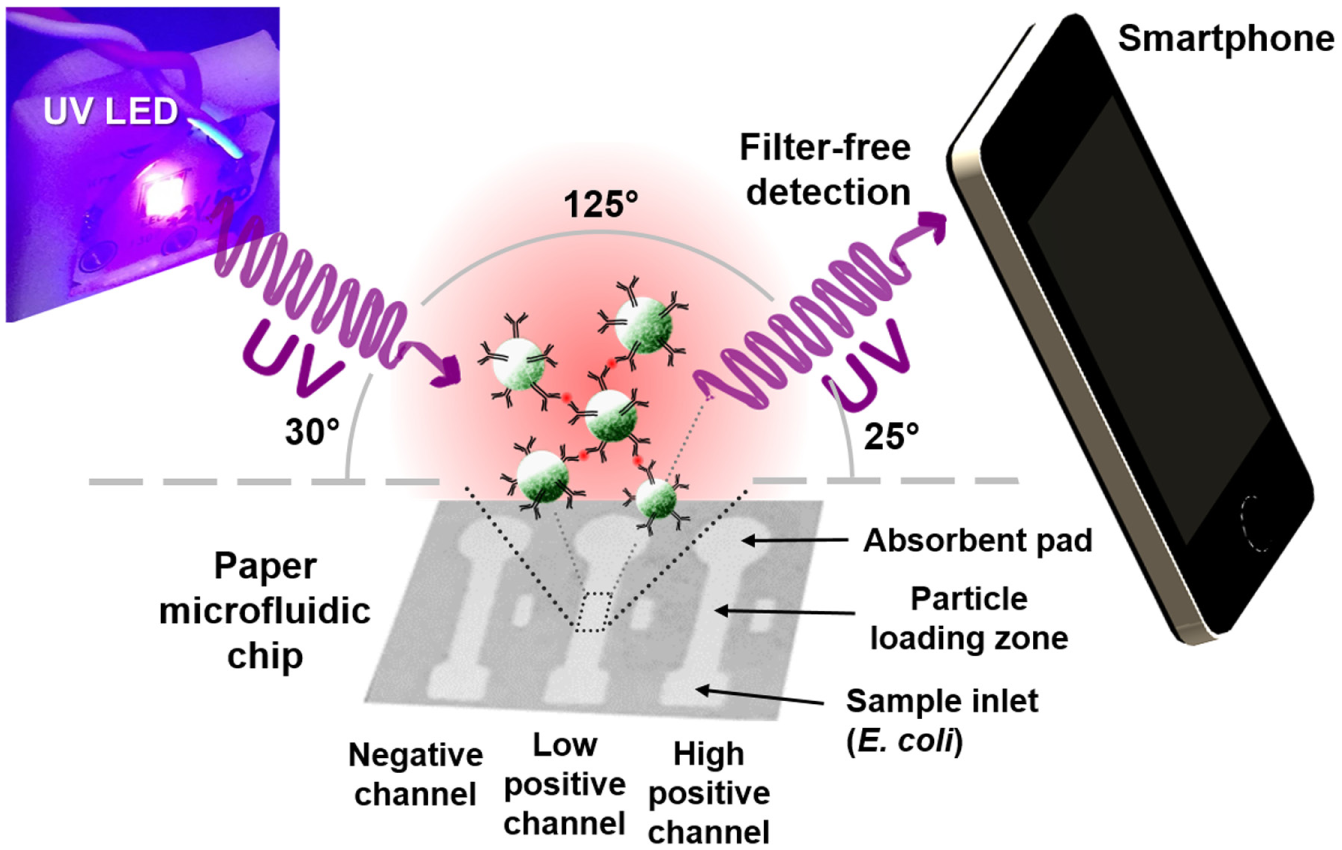
Schematic illustration of the UV LED-enhanced particle immunoagglutination assay on paper microfluidics and subsequent smartphone detection. Antibodies (Y-shaped) are conjugated to the polystyrene particles (green spheres). The presence of Escherichia coli antigens (red dots) triggers antibody-antigen binding and subsequently immunoagglutination of particles.
Results and Discussion
Smartphone Camera’s Response to UV LED Irradiation
Six different UV LEDs (275, 340, 365, 375, 385, and 395 nm) were used to evaluate the response characteristics of the smartphone’s CMOS camera to UV irradiation. These UV LEDs were directly irradiated to the smartphone’s camera (iPhone 4; Apple, Cupertino, CA) at a distance of 16 cm without using any optical filters. The average pixel intensities in red, green, and blue (RGB) channels were analyzed using ImageJ software. Figure 2 shows the average pixel intensities in RGB channels upon UV LED irradiation. All RGB intensities with 275- and 340-nm UV LEDs were very low, while those with 365-nm UV LED were substantial. The red and blue intensities with longer wavelength UV LEDs (375, 385, and 395 nm) showed saturated values (i.e., close to 255), while the green intensities remained unsaturated, under normal camera operation with auto-exposure. The blue saturation can easily be explained with the UV LED wavelength’s (375, 385, and 395 nm) proximity to the blue color (400–500 nm). The red saturation can also be explained with the response characteristics of the human eye and subsequently most CMOS cameras to violet color (380–450 nm), to which both blue and red cone cells (and subsequently blue and red pixels) respond. Therefore, it can be concluded that all three color channels respond to UVA, specifically to the wavelengths longer than 365 nm. 19 Green intensities can be particularly useful since red and blue pixel intensities are saturated under normal camera operation while green intensities are not. Among three choices (375, 385, and 395 nm), the 385-nm UV LED was selected for the remainder of this study.
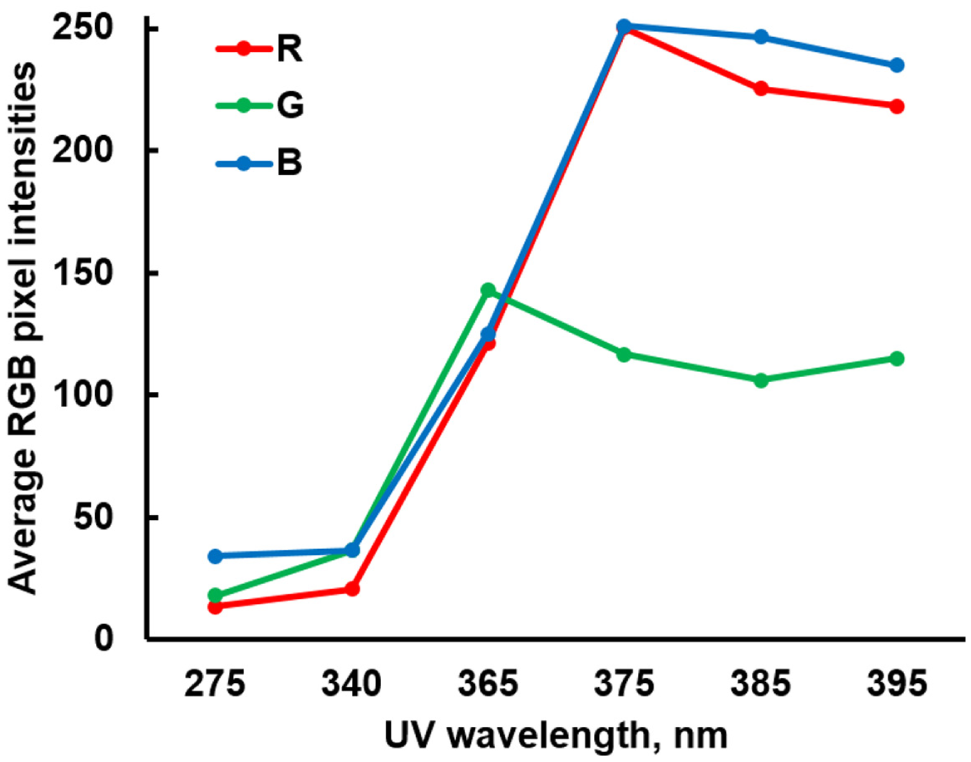
Average red, green, and blue (RGB) pixel intensities of a smartphone upon UV LED irradiation.
Mie Scatter Simulation
Mie scatter simulation was conducted to estimate the increase in scatter intensity of the immunoagglutinated PS particles from the nonagglutinated, under UV light, in comparison with those under ambient light (i.e., previous work5,13,16), where the green pixel intensities were proven to be the most sensitive. Simulation was conducted using the following parameters: (1) light source = 530 nm (green detection under ambient light) versus 385 nm (UV LED), both unpolarized; (2) particle diameter = 920 nm for the nonagglutinated PS particles versus 1840 nm for the immunoagglutinated particles; (3) particle size distribution = normal distribution with 5% standard deviation; (4) refractive indices = 1.60 for PS (polystyrene) and 1.33 for water (medium); and (5) scattering angle = 125° (refer to Fig. 1 ). As shown in Figure 3 , the scatter intensity (arbitrary unit) increased from 1.2 to 2.3 under the 530-nm green light for the simulated immunoagglutination. A similar increase from 9.6 to 22.1 (arbitrary unit) was observed with the 385-nm UV light, showing a marked enhancement over that with green light. Obviously, this signal enhancement is due to the higher energy inherent in shorter wavelength UV light than longer wavelength ambient light.
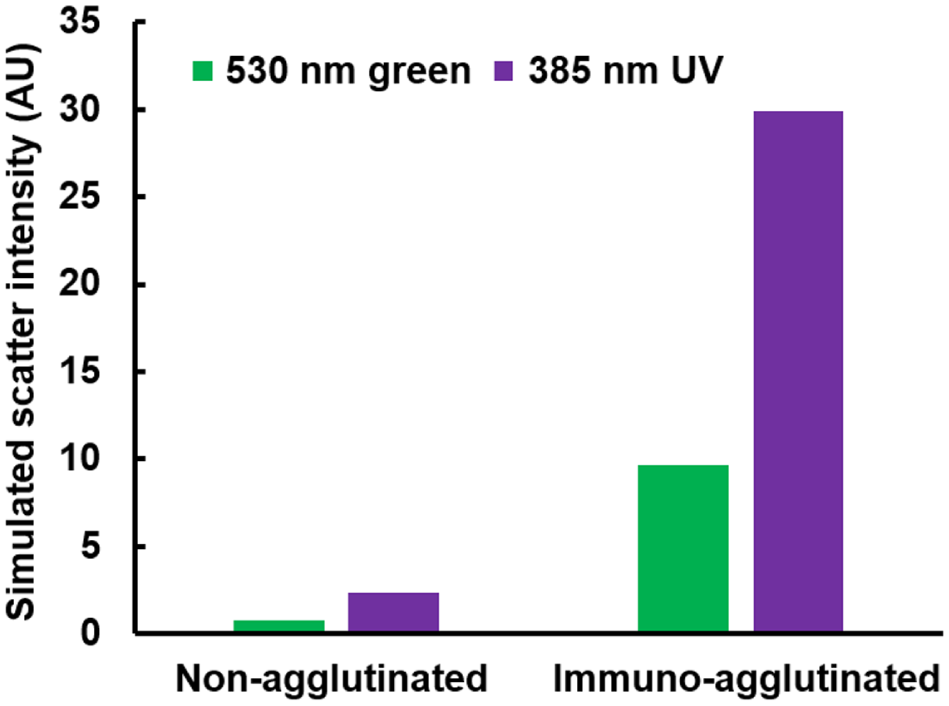
Simulated Mie scatter intensities (arbitrary unit) for the nonagglutinated polystyrene particle (920 nm) and the immunoagglutinated particle (with twice the diameter, 1840 nm) under green (530 nm) and UV (385 nm) irradiation.
E. coli Assay
Using the 385-nm UV LED as a light source, particle immunoagglutination E. coli assays were conducted on the paper microfluidic chips, preloaded with anti–E. coli–conjugated PS particles. The smartphone acquired the digital images of the paper microfluidic chips before and after the assays. Similar to the results shown in Figure 2 , both blue and red intensities from the detection zone of each microchannel were always saturated under the normal auto-exposure condition, since the other parts of the paper microfluidic chips and the background (laboratory desk) were substantially dimmer than the particle-loaded area. A special smartphone application may be used to reduce the exposure time to attenuate both blue and red intensities. However, such application is not necessary, since the green intensities from the detection zone provided unsaturated and detectable signal intensities.
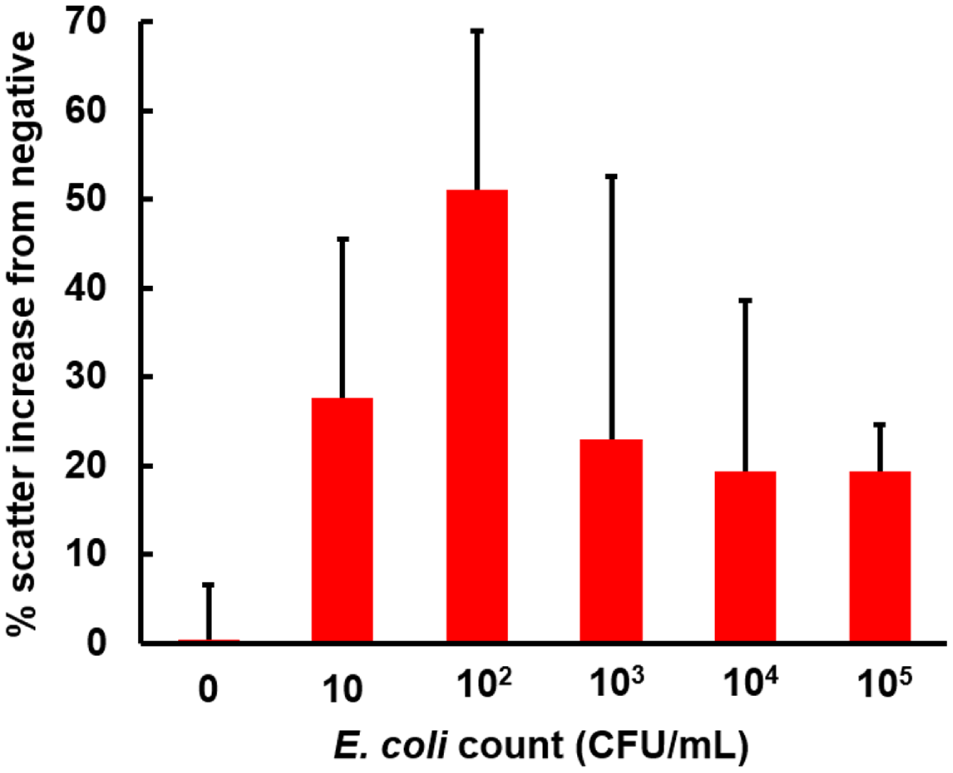
Using this approach, a standard curve for E. coli detection was obtained, as shown in Figure 4 . Since each data point was normalized to that of the negative channel (loaded with BSA-conjugated particles) with the same E. coli sample, it was possible to evaluate the data for 0 CFU/mL with an error bar, which is not necessarily at 0%. 16 The double-normalized intensities increased almost up to 50% for the 103 CFU/mL sample, followed by a decrease. This result indicates that the linear range of assay is three orders of magnitude for the given amount of antibody-conjugated particles, consistent with the previous work.13,16 While it is possible to shift this linear range to the higher range of concentration (e.g., 103–105 CFU/mL or 105–107 CFU/mL) through increasing the amount of antibody-conjugated particles loaded to the paper channel, as previously demonstrated, 16 it has already been demonstrated and is out of scope of this work. All data points from 10 to 104 CFU/mL were significantly different from that of 0 CFU/mL (p < 0.05), indicating the detection limit of 10 CFU/mL. This signal increase is approximately 10 times bigger than the previous work (4%–7%), which used ambient light as a light source.5,13,16
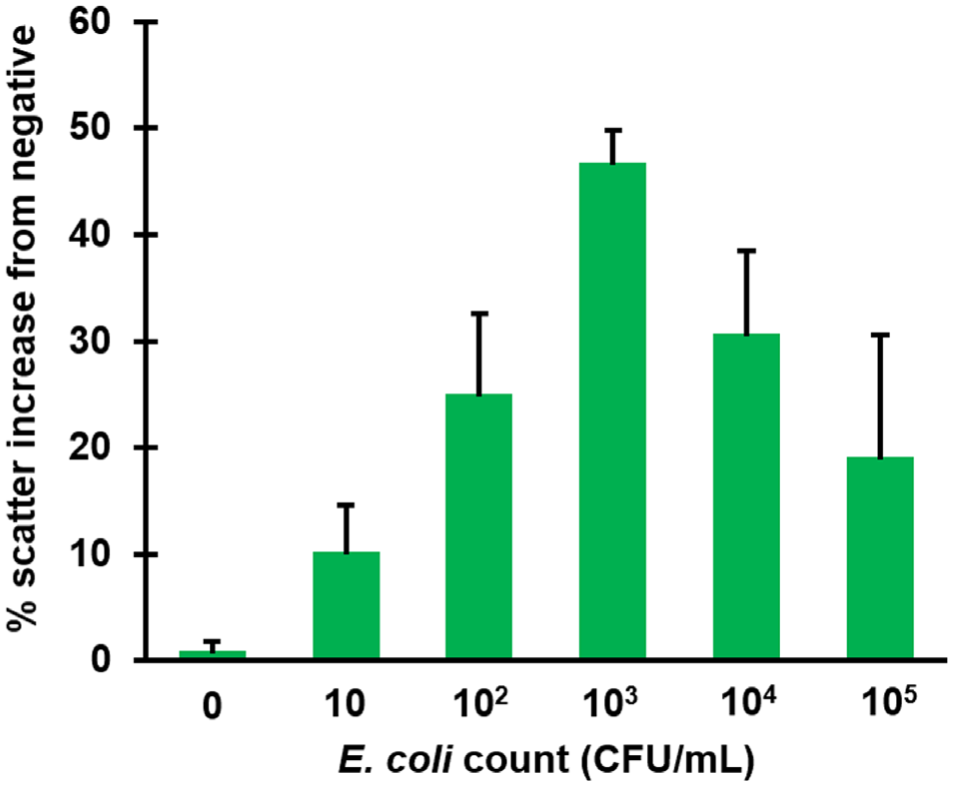
The result of paper microfluidic assay for the Escherichia coli in deionized water using the 385-nm UV LED. Green pixel intensities were evaluated and double-normalized as described in Materials and Methods. The 920-nm anti–E. coli–conjugated polystyrene particles were preloaded to the center of each paper microfluidic channel prior to the assays. Average of three different experiments, each time using different samples and different paper microfluidic chips. Error bars are standard errors. CFU, colony-forming unit.
E. coli Assay with 10% Human Whole Blood
The same experiments were repeated with the E. coli samples dissolved in 10% diluted human whole blood, which is a typical dilution used for many other immunoassays, including the conventional microfluidic assay. 20 The paper microfluidic assays for the whole-blood sample are known to be challenging due to the significant colorimetric disturbance from the blood components. This effect can particularly be worse for the particle immunoagglutination assay under ambient light, due to its inherently weak signals. Figure 5 shows the results, indicating successful assays. The double-normalized intensities increased up to 50% for the 102 CFU/mL sample, followed by a decrease. The reductions in the linear range (up to 102 CFU/mL vs. up to 103 CFU/mL), as well as the overall larger error bars, can be attributed to the presence of the blood components.
The result of paper microfluidic assay for the Escherichia coli in 10% human whole blood. All other conditions are identical to those shown in Figure 4 . Average of three different experiments, each time with different samples and paper microfluidic chips. Error bars are standard errors. CFU, colony-forming unit.
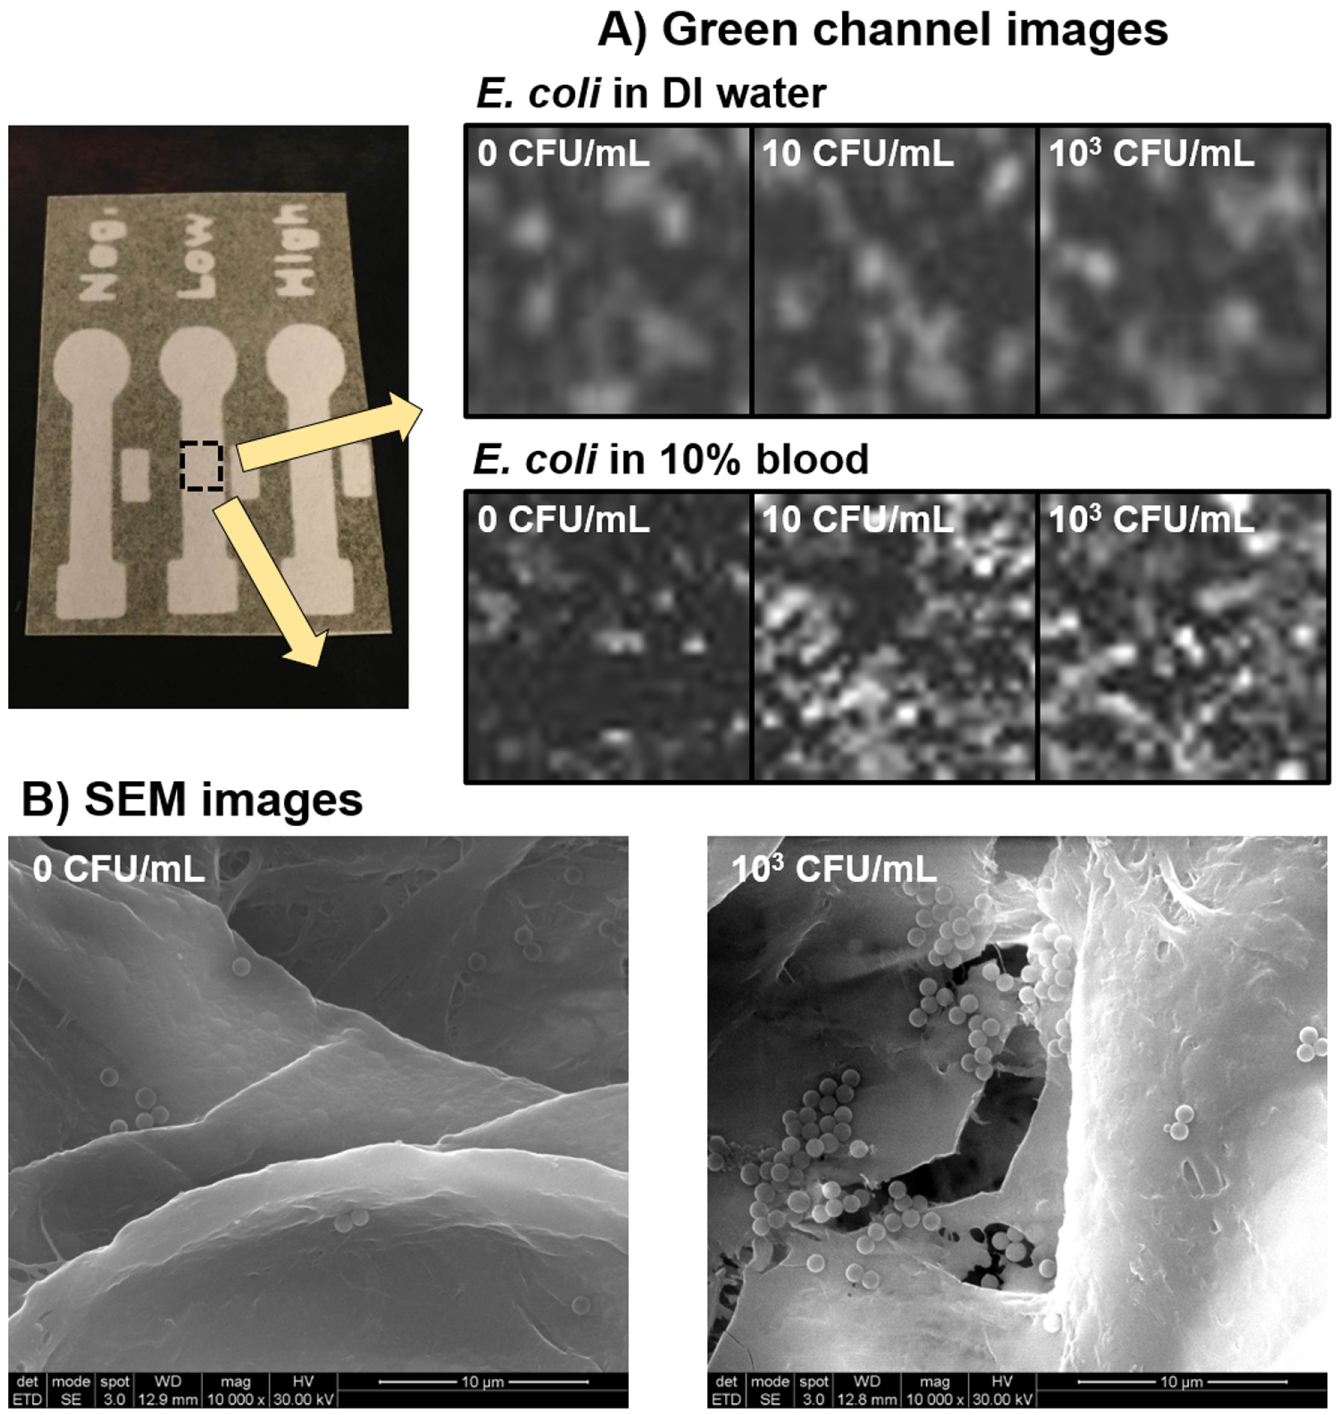
Macroscopic and Scanning Electron Microscopy Images of Particle Immunoagglutination on Paper
Figure 6A shows the macroscopic, green channel images of the detection zone of each paper microfluidic channel with 0, 10, and 103 CFU/mL E. coli in deionized water or 10% whole blood. The overall green pixel intensities increased with increasing E. coli concentration, which were used as input parameters for evaluating normalized intensities. In addition, the scanning electron microscopy (SEM) images of anti–E. coli–conjugated polystyrene particles on the central detection zone of each paper microfluidic channel are also shown in Figure 6B , showing a substantial difference in the extent of agglutination between 0 and 103 CFU/mL E. coli. Small extent of aggregation with 0 CFU/mL E. coli can be attributed to the gold sputter coating and the vacuum conditions required for SEM imaging.
(
In conclusion, in this work, we demonstrated the significant enhancement of Mie scatter signals of particle immunoagglutination assays on paper microfluidic chips by use of UV LED and that a smartphone can recognize it efficiently in the green channel. Normalized signal intensities increased up to 50% for the E. coli assay, a 10-fold improvement from the same assay with ambient light. We were able to achieve a detection limit of 10 CFU/mL. The same experiments can be repeated for the E. coli assay in 10% human whole blood, which can be attributed to the stronger energy generated by the UV light source.
Footnotes
Acknowledgements
K. Serge Dogbevi and Jessica M. Mergener at the University of Arizona assisted the fabrication of paper microfluidic chips and preparation of reagents. Scanning electron microscopy was performed at the W. M. Keck Center in the University of Arizona. The authors also thank Dr. Daewoong “Dave” Suh and Dr. Kyujin Choi at Seoul VioSys for helpful discussion.
Declaration of Conflicting Interests
The authors declared no potential conflicts of interest with respect to the research, authorship, and/or publication of this article.
Funding
The authors disclosed receipt of the following financial support for the research, authorship, and/or publication of this article: This research was supported by Seoul VioSys, Ansan, Gyeonggi, Republic of Korea, and the Richard A. Harvill graduate fellowship (awarded to Soohee Cho).