
Abstract
Compound management (CM) is a critical discipline enabling hit discovery through the production of assay-ready compound plates for screening. CM in pharma requires significant investments in manpower, capital equipment, repairs and maintenance, and information technology. These investments are at risk from external factors, for example, new technology rendering existing equipment obsolete and strategic site closures. At AstraZeneca, we faced the challenge of evaluating the number of CM sites required to support hit discovery in response to site closures and pressure on our operating budget. We reasoned that overall equipment effectiveness, a tool used extensively in the manufacturing sector, could determine the equipment capacity and appropriate number of sites. We identified automation downtime as the critical component governing capacity, and a connection between automation downtime and the availability of skilled staff. We demonstrated that sufficient production capacity existed in two sites to meet hit discovery demand without the requirement for an additional investment of $7 million in new facilities. In addition, we developed an automated capacity model that incorporated an extended working-day pattern as a solution for reducing automation downtime. The application of this solution enabled the transition to a single site, with an annual cost saving of $2.1 million.
Keywords
Introduction
In 2003, AstraZeneca signified its commitment to internal high-throughput screening (HTS) as a technique for discovering hit molecules with a $35 million investment in four automated compound management (CM) facilities on four separate research sites. 1 Each facility retained an identical copy of AstraZeneca’s liquid sample screening collection, initially totaling 500,000 unique compounds in 2003 and increasing to 1.9 million unique compounds by 2014. Each facility was enabled with identical automated storage and processing equipment for compound retrieval and assay plate production.
In the first year of operation, AstraZeneca conducted a total of 32 HTS campaigns. A significant growth in HTS was widely predicted,2,3 but a peak in HTS activity was reached in 2006 with a total of 52 campaigns. From 2006, there were yearly fluctuations in HTS activity, but there was a general trend downward, with 18 internal campaigns conducted in 2014. The most significant contribution to this decline was a reduction in the number of new drug discovery projects. In addition, alternative hit discovery technologies found favor.4-6
During this same period, CM activities underwent significant change driven by organizational developments, technology innovation, and a rise in external screening activities. Operations were expanded by the consolidation of compound handling activities from multiple screening laboratories into the site CM groups. This offered an improvement in efficiency and extended the accountability of CM from receipt of newly synthesized compounds through to assay-ready plate production. One impact of this change was a shift away from manual solid sample processing toward automated liquid sample processing, as screening colleagues ordered multiconcentration compound plates directly from the CM group. Assay miniaturization, driven by the development and commercialization of acoustic droplet ejection technology, 7 transformed the equipment landscape. Accurate and reproducible nanoliter dispensing in 384- and 1536-well plates became the standard output. 8 The development of external screening collaborations for the identification of hit molecules posed new challenges. 9 These included greater flexibility in screening library size and formats required to meet the individual specifications of the broader science community and total numbers of samples in an average screening campaign being significantly lower.
Although CM sites were evolving rapidly, these changes, particularly the lack of growth in internal HTS beyond 2006, amounted to a major reduction in demand. Given that a single CM site has an annual operating cost of $2.5 million, we reasoned that our multisite model could be inappropriate, and faced the challenge of evaluating the number of sites now required to support hit discovery.
As the focus of work had shifted to automated liquid sample processing, we required a method for analyzing automation capacity utilization and turned to a manufacturing tool, overall equipment effectiveness (OEE). OEE was developed by Seiichi Nakajima in the 1960s to evaluate how effectively a manufacturing operation is utilized. 10 The technique involves the analysis of each step in a process with performance comprised of three elements (eq 1).

OEE enables direct performance comparison across different types of automation or different steps within a single process, or performance evaluation between two distinct processes. For a given system to attain 100% OEE, it must be available all of the time, going as fast as it was designed to run and producing customer-defined perfect quality output with no defects or rework. 11
The technique found widespread application in manufacturing industries, 12 and was later employed in various types of plants in the pharmaceutical industry, from active pharmaceutical ingredient (API) to packaging. 13 However, the adoption of OEE in the pharmaceutical research environment, where complex automation and robotics have been deployed extensively since the 1990s, has been surprisingly limited. To our knowledge, no literature reports exist that detail the application of OEE for analyzing capacity utilization in pharmaceutical research operations.
Methods
Capacity Analysis
Process mapping
The first stage in the capacity analysis was to describe the process, from compound weighing to high- and low-volume plate production ( Fig. 1 ). This defined the boundaries of the process and ensured measurement correlation between output units from one process step to input units of the next.
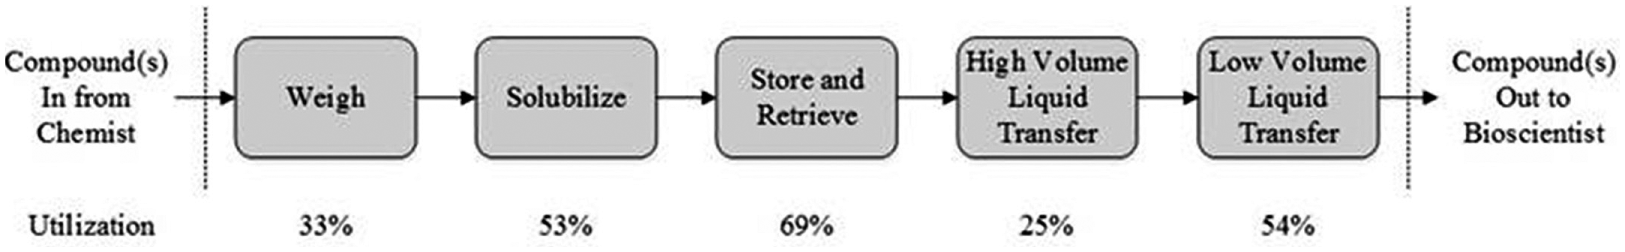
Main CM process steps from newly synthesized compounds to multiconcentration assay-ready plate production. The process is initiated with new compounds arriving from chemistry. The compounds are weighed, solubilized to a 10 mM concentration in DMSO, and stored. When an order is placed for a compound, it is retrieved from the store and then transferred from the storage tube to an intermediate plate and diluted. A second compound transfer and final dilution is performed to generate the assay plate. The utilization figures represent total demand modeled across two CM sites and show the highest utilization to be at the automated storage and retrieval step.
Overall Equipment Effectiveness
OEE was calculated according to eq 1.
The theoretical maximum output, or design rate, for each process step was determined over a 7-day period of 24 h continuous operation. For major automation process steps, this was taken from manufacturer’s guidelines, and for manual steps, such as compound weighing, timings were taken over a short period and extrapolated.
The pace was calculated from the observed output at each process step and expressed as a percentage against the design rate, ensuring the measurements were taken during full operation and excluded any downtime or breaks. These measurements identified the pace of automation operation to be heavily dependent on the type of work being processed; for example, the pace of production of a low-volume assay plate was 1.6 times faster for a 20 nL dispense than for a 300 nL dispense. For work activities that significantly affected the pace of the automation, the type of work and best and worst pace were recorded.
The uptime captured the proportion of time each step in the process was available to carry out work after accounting for planned maintenance, software upgrades, and any unplanned breakdowns of the automation or information technology (IT) systems. The previous 12 months’ maintenance logs were reviewed and the recorded figures were averaged to calculate the uptime over a typical week, expressed as a percentage of available time in the week. A week was defined as 24 h a day for 7 days.
The quality should be described as the number of customer-defined, high-quality products produced as a percentage of total products produced at each process step. However, no record of defect data was available. The CM group conducts an extensive program of quality assurance on new powders produced from chemistry and new liquids produced in CM. The quality assurance of liquid samples is determined on the discrete storage tubes and is performed by analytical chemists using mass spectrometry techniques. However, since no technique currently exists for nondisruptive molecular evaluation of discrete wells in assay-ready plates, the quality of the final product cannot be assured. We reasoned that any rework resulting from loss of quality in the two liquid transfer steps was accounted for through increased demand, rather than a reduction in overall quality, and the high throughput of the system was unlikely to lead to significant impact from this discrepancy in the measurement.
The OEE of each process step and the design rate were used to calculate actual equipment capacity (AEC) for a time period of 1 week (eq 2).

Demand Analysis
Historic demand was used to calculate the utilization of each step in the process. The demand was also assigned to a best or worst pace.
Annual demand data was averaged over a week to ensure consistency with the time units of the capacity analysis. Demand scenarios were developed by scaling specific activities; for example, a standard HTS was scaled to capture the total annual demand from HTS and then averaged over a 52-week period to calculate the demand for 1 week.
Equipment Utilization
The combination of demand and capacity for each process step enabled the calculation of equipment utilization (eq 3).

Cost Analysis
The cost types included in the analysis were equipment maintenance, system maintenance, manpower, equipment depreciation, energy, and consumables. A full breakdown of costs for models of one, two, and three CM sites is provided in
Results and Discussion
The application of OEE provided, for the first time, a clear differentiation between screening demand and equipment capacity, and an accurate view of capacity utilization. The approach highlighted that AstraZeneca was consistent with the industry trend in transitioning from solid to liquid dispensing, 14 with higher utilization figures for liquid sample storage and retrieval, and low-volume liquid sample processing ( Fig. 1 ). We identified the automated storage and retrieval of liquid samples as the process step with the highest capacity utilization for a two-site model.
At the time of this analysis, AstraZeneca operated three CM sites, but had made the decision to exit all research activities at one of them. Consequently, the utilization for automated storage and retrieval of liquid samples was modeled for one, two, and three CM sites to assess the ability of CM to continue support for hit discovery. The models were developed for an even distribution of demand—an ideal scenario not accounting for peaks and troughs in work—and an uneven distribution of demand, which more accurately reflected the situation in the laboratory ( Fig. 2 ). The annual operating costs for each model were also calculated.
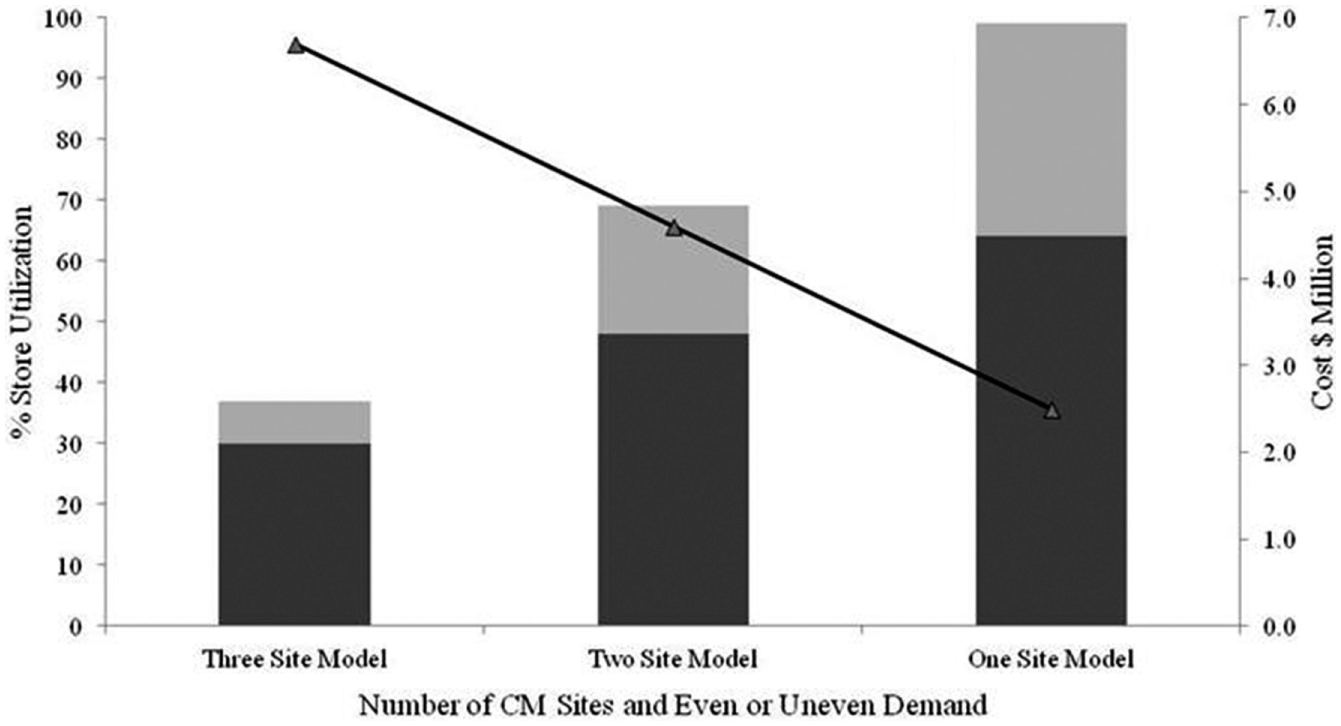
Equipment utilization was modeled for one, two, and three CM sites, accounting for both even (dark grey) and uneven (light grey) work at the automated storage and retrieval step. This demonstrated that sufficient available capacity existed with one site, providing an even workload could be achieved. Cost calculations (black line) depict the annual operational cost of supporting each of the models. The one- and two-site models represent annual savings of $4.2 million and $2.1 million, respectively, when compared with the three-site model.
The analysis demonstrated that sufficient capacity existed with two sites to meet the demand for automated storage and retrieval of liquid samples (see Fig. 2 , 48%–69% capacity utilization for automated storage and retrieval). Therefore, an additional investment of $7 million to establish a new CM group at an alternative site was unnecessary. A powerful implication of uneven workload can be observed in Figure 2 , with the uneven capacity utilization (69%) in the two-site model being greater than the even capacity utilization (64%) in the one-site model.
We reasoned that the risk to reliable compound delivery from one site could be mitigated by increasing the capacity for the critical equipment step of compound storage and retrieval. Potential solutions to enhance equipment pace or reduce equipment downtime were assessed by comparing the cost of implementation against the benefit on equipment capacity. This assessment identified automation downtime as the key component within our control. Attention was placed on understanding the observation that downtime decreased from 37% to 15% when periods of high demand were supported by out-of-hours working.
Analysis of downtime occurrences for automated storage and retrieval equipment ( Fig. 3 ) concluded that 92% of incidents could be rectified by the availability of skilled staff, with no requirement for specialist engineering or software support. In addition, we identified specific issues impacting automation performance. Where possible, preventative actions were implemented, for example, visual controls (see Fig 3 , impacting inventory missing), regular checks of out-feed buffer lanes and plate carousels (see Fig. 3 , impacting emptying plates and plate stacker full), and enabling slower grab rates on tube retrieval robotic arms (see Fig. 3 , impacting tube flick-outs). With the knowledge that it was not possible to eliminate all automation issues, 15 we concluded that the best automation performance would be achieved with the presence of skilled staff.
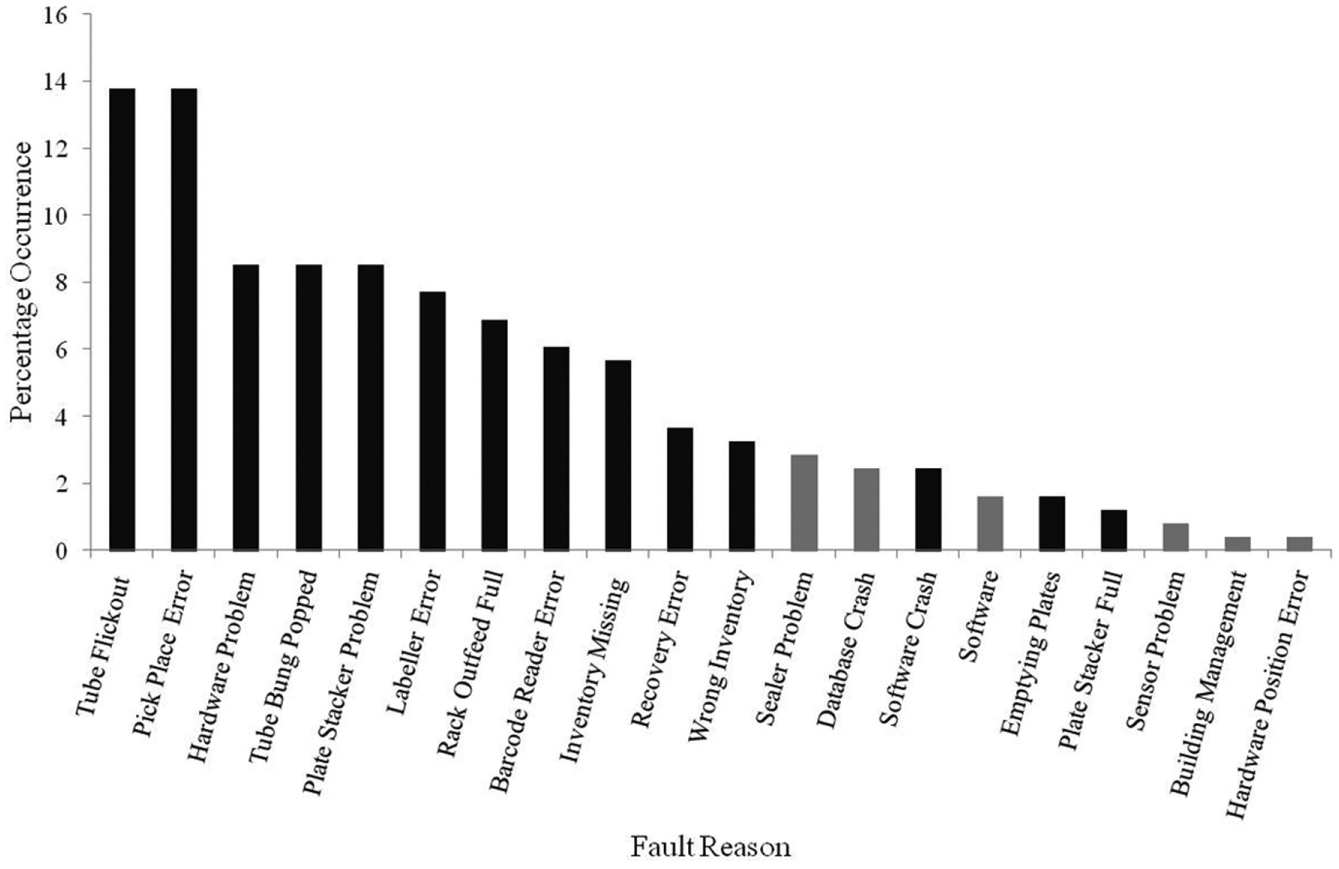
Plot of automated storage and retrieval fault occurrences over a 12-month period. Black bars represent faults that were rectified by skilled staff, while grey bars indicate faults where engineering or IT support was required. This demonstrates the majority of faults could be addressed by skilled staff, and their availability would have a significant positive impact on equipment capacity.
With this knowledge, we developed a one-site model with an extended 15 h day—selected in consultation with staff and to minimize additional manpower costs required to operate a 24 h pattern. Annual variability was still observed in the total number of HTS campaigns, so we applied scenarios for 18, 24, and 30 HTSs (
Fig. 4
). The analysis demonstrated that although capacity utilization was high, it never reached a critical level. With the expectation that 24 HTSs a year was now a realistic reflection of demand, and having taken action to reduce peaks and troughs of work, we made the decision to consolidate to a single CM site. This decision generated an annual cost saving of $2.1 million, accrued predominantly through a reduction in equipment depreciation and manpower costs (
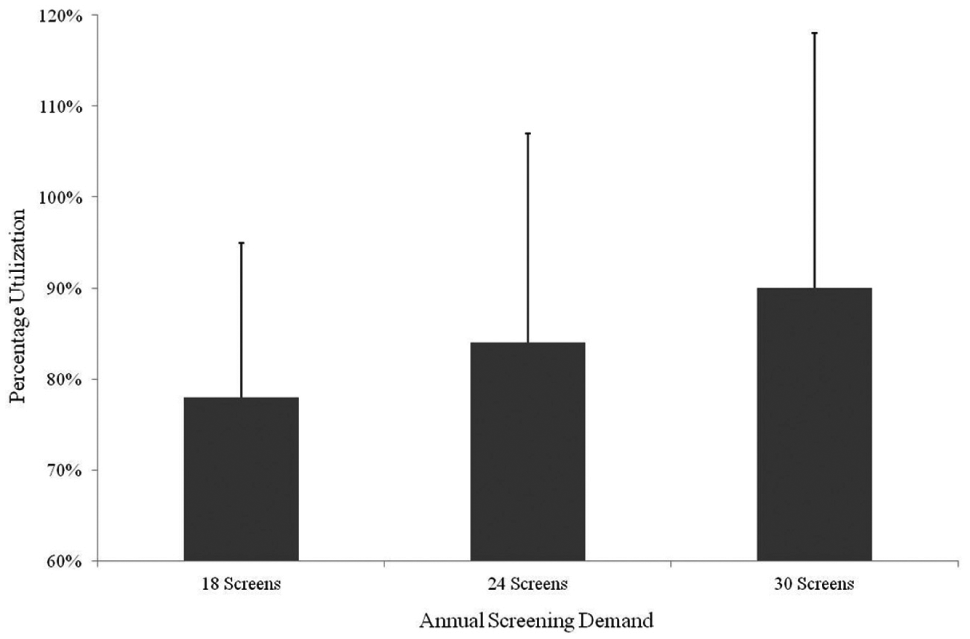
Automated storage and retrieval capacity utilization for a single CM site using three HTS scenarios from 2014. Grey bars indicate the maximum equipment utilization for an even distribution of work. Black error bars indicate the equipment utilization with uneven work. This demonstrates that at 24 HTSs a year, and having taken action to balance the workload, we could consolidate to a single CM site.
The application of OEE introduced a rigorous, data-driven approach to calculating capacity utilization. Automation was placed at the center of the capacity calculations, with a focus on the maximum possible output that could be achieved from the automation step and the overall process. This differed from our previous analysis, which focused on the number of staff required to meet an anticipated level of demand.
An initial limitation of the methodology was the assumption of even demand, which failed to correlate with the peaks observed from large HTS campaigns. Originally, this was captured by assessing the maximum number of HTSs run in a given time period, factored at 4.8 screens per month. As a wider acceptance of the methodology was achieved and the impact of peaks and troughs was observed, more opportunities to balance the demand were explored. Collaborative planning and early CM engagement in projects enabled improved work scheduling, and urgent project work was balanced against less urgent internally placed CM work, for example, retrieval of liquid samples for quality assurance. Reducing the peaks and troughs created a more consistent flow of work through the process, 16 with the result of improved lead times for our scientific colleagues.
The appropriate upper level of equipment utilization was a key point for consideration in our analysis. Initially, we followed manufacturing trends in striving for 70%–80% equipment utilization. 15 However, as we developed a greater understanding of HTS scheduling, increased our confidence in the accuracy of the model to represent the real system, and identified further opportunities to increase capacity through weekend and overnight working, we surmised that the risk from increasing the upper level was low.
We acknowledged that as percentage utilization increased, there was also a potential for lead times to increase. 16 To address this, key service levels and process control were introduced to ensure continued high standards of delivery were achieved for time-critical lead identification and lead optimization projects; for example, ≥90% of project compounds will be dispatched to screening within 1 day and ≥95% within 2 days. 17
The application of OEE to model capacity utilization was heavily focused toward automation and gave no insight into the staff requirements needed to support the equipment. Approaches such as those employed by Allen and Wigglesworth 18 offer a complementary system to consider alongside OEE, and these will be deployed as we continue to optimize our performance or develop new workflows.
In conclusion, the application of OEE provided a simple-to-produce, accurate representation of the automated processes in CM and identified the automated storage and retrieval of liquid samples as the step with the greatest capacity utilization. Solutions to manage the capacity at this step enabled CM to support hit discovery from a single site, with significant cost savings. The main drawbacks of OEE were (1) the complexity in modeling peaks and troughs of work and (2) the inability to assess the absolute quality of the assay-ready plates. While collaborative solutions were developed between colleagues in CM and HTS to balance work, a rigorous assessment of quality requires technology innovation in nondisruptive molecular evaluation of discrete wells in assay-ready plates. Many potential applications for OEE could be envisaged across automated processes in pharmaceutical research, with the potential for quantifying critical activities to improve performance and reduce cost.
Footnotes
Acknowledgements
We thank Penny James for providing guidance on the application of OEE. We would also like to acknowledge Dan Addison for providing the demand data. Finally, we wish to thank those who have read and provided feedback on this article.
Declaration of Conflicting Interests
The authors declared no potential conflicts of interest with respect to the research, authorship, and/or publication of this article.
Funding
The authors received no financial support for the research, authorship, and/or publication of this article.