
Abstract
The globalization and externalization of a pharmaceutical company’s research and development (R&D) places considerable demands on its underpinning compound management (CM) capability. More robust CM workflows are needed to support higher demands and cross-continent supply chains. The tracking and visibility of compound orders progressing through CM processes has become crucial to ensure prompt and reliable delivery to customers and project timelines worldwide. AstraZeneca at Alderley Park UK has successfully introduced and integrated a visual management system into its CM processes to support the company’s global R&D strategy. A simple, low-cost approach has been employed to track solid processing and solubilization orders. This reduced variability and end-to-end cycle times by decreasing waiting time between processing steps. The visual tracking system has been quick to implement, adaptable to change, and able to be owned and run by delivery teams. Introduction of the visual tracking system has resulted in significant improvements in order processing, both in terms of variability and speed. The percentage of orders processed within 24 h rose from 81.5% to 92.5%, and reductions of 50% and 17.5% in the average processing time were seen for solid dispense and solubilization orders, respectively.
Introduction
The challenges facing the pharmaceutical industry are significant and of increasing public and monetary concern, 1 necessitating leaner research and development (R&D) delivery and externalization of processes.2,3 As R&D strategy changes, compound management (CM) is challenged to respond by delivering a greater and more diverse output while tightly controlling operating cost (e.g., centralized groups, reduced manpower, and restricted capital investment). Many CM groups, including AstraZeneca at Alderley Park UK, now operate with large legacy automated systems purchased at around the turn of the century 4 and the challenge of a large data load on global information technology (IT) systems. To support today’s higher demands and cross-continent supply chains against this largely static and generally inflexible backdrop, it is essential that the underpinning CM processes are highly efficient and robust. Minor deviations and variable delivery can have a significant impact on CM reputation and, more important, on drug discovery project timelines.
In 2004, AstraZeneca made a significant capital investment in large-scale automation, implementing automated compound management facilities (ACMF) at multiple AstraZeneca sites supplied by Brooks, formerly RTS Life Science (Manchester, UK). AstraZeneca’s ACMF delivered a fully integrated and automated sample tracking solution for the storage, retrieval, and processing of solid and solution samples.5,6 Key elements of the ACMF at Alderley Park UK were a central solid store, a primary liquid store (PLS), and a liquid-handling cell.
Since 2004, the demand profile has changed considerably, with a shift from CM supplying customers with solid compounds to supplying microliter liquid volumes and, more recently, to dispensing nanoliter amounts as assay-ready plates. An additional automated system and ordering platform, CODA (Compounds On Demand for Assays), was introduced at Alderley Park UK in 2009 to meet the significant demand for assay-ready plates, 1536-well output plates, and dose-response screening formats. 7 Fundamental ACMF processes such as weighing a solid material and high-volume liquid dispensing have remained the same and are still needed, but the new demand profile means their outputs are now often not required directly by the customer. Instead, these are upstream process steps in the supply chain to CODA for the generation of assay-ready plates. Although the CM deliveries have evolved, the process still relies heavily on the ACMF, which is not easily amenable to change and, 9 years on from implementation, is close to the end of its natural life cycle. The scale and complexity of CM operations within pharmaceutical companies have also led to the development of sizable interlinked IT systems for compound requesting, order administration, and order execution. Similarly to the ACMF, these legacy IT systems are also inflexible to changing demands from research projects.
AstraZeneca has found that when operating in this environment, most orders will be processed quickly and correctly, but sometimes they will be missed, often due to order progress being spread across or hidden within multiple IT systems. 8 The resulting variability in processing time and delivery can have a significant impact on CM reputation and on project timelines. The tracking and visibility of compound orders progressing through CM processes has therefore become crucial to ensure fast and reliable support to global customers so that delivery of test data to drug discovery projects is not delayed.
In 2010, the CM group embarked on a program of process improvement activities to meet evolving project needs within the existing automation and IT infrastructure, with the goal of processing all customer orders within 24 h. A continuous improvement study looked at high-level processes within CM, using key system process time stamps to map solid order processing. The data clearly demonstrated high variability in order processing time, highlighting extended periods of waiting time between process steps for most orders and significant delays for several orders. Further investigations revealed a number of contributing factors to the observed variability in order processing times: the reliance on email and lack of visibility of orders, orders awaiting approval to progress, the high number of orders in the system, the fragmentation of orders across multiple racks of vials, and the lack of visibility of order status.
To address these challenges, a single transparent view of order progress was identified as a key requirement. Solutions deployed across other parts of the business were explored before opting to implement a simple, low-cost, card-based visual management system founded on the Lean principles of Kanban.9,10 The basis of the solution was that every order would have a card that followed it through the process, either directly or on a board, making the demand at each process step visible to all. There is a wealth of literature references on the use of card-based visualization systems to enhance business processes,11,12 particularly in the automotive industry, but to the best of our knowledge, this is the first time that visual management has been used in a high-throughput pharmaceutical R&D environment.
Materials and Methods
The first phase in implementing a visual solution was a virtual exercise, mapping the process and highlighting the key process milestones that required tracking. Five milestones applicable to the multiple workstreams within solid order processing were identified: order receipt/creation, allocating samples to an order, sending an order for processing, processing an order, and completion of an order (see Fig. 1 ).
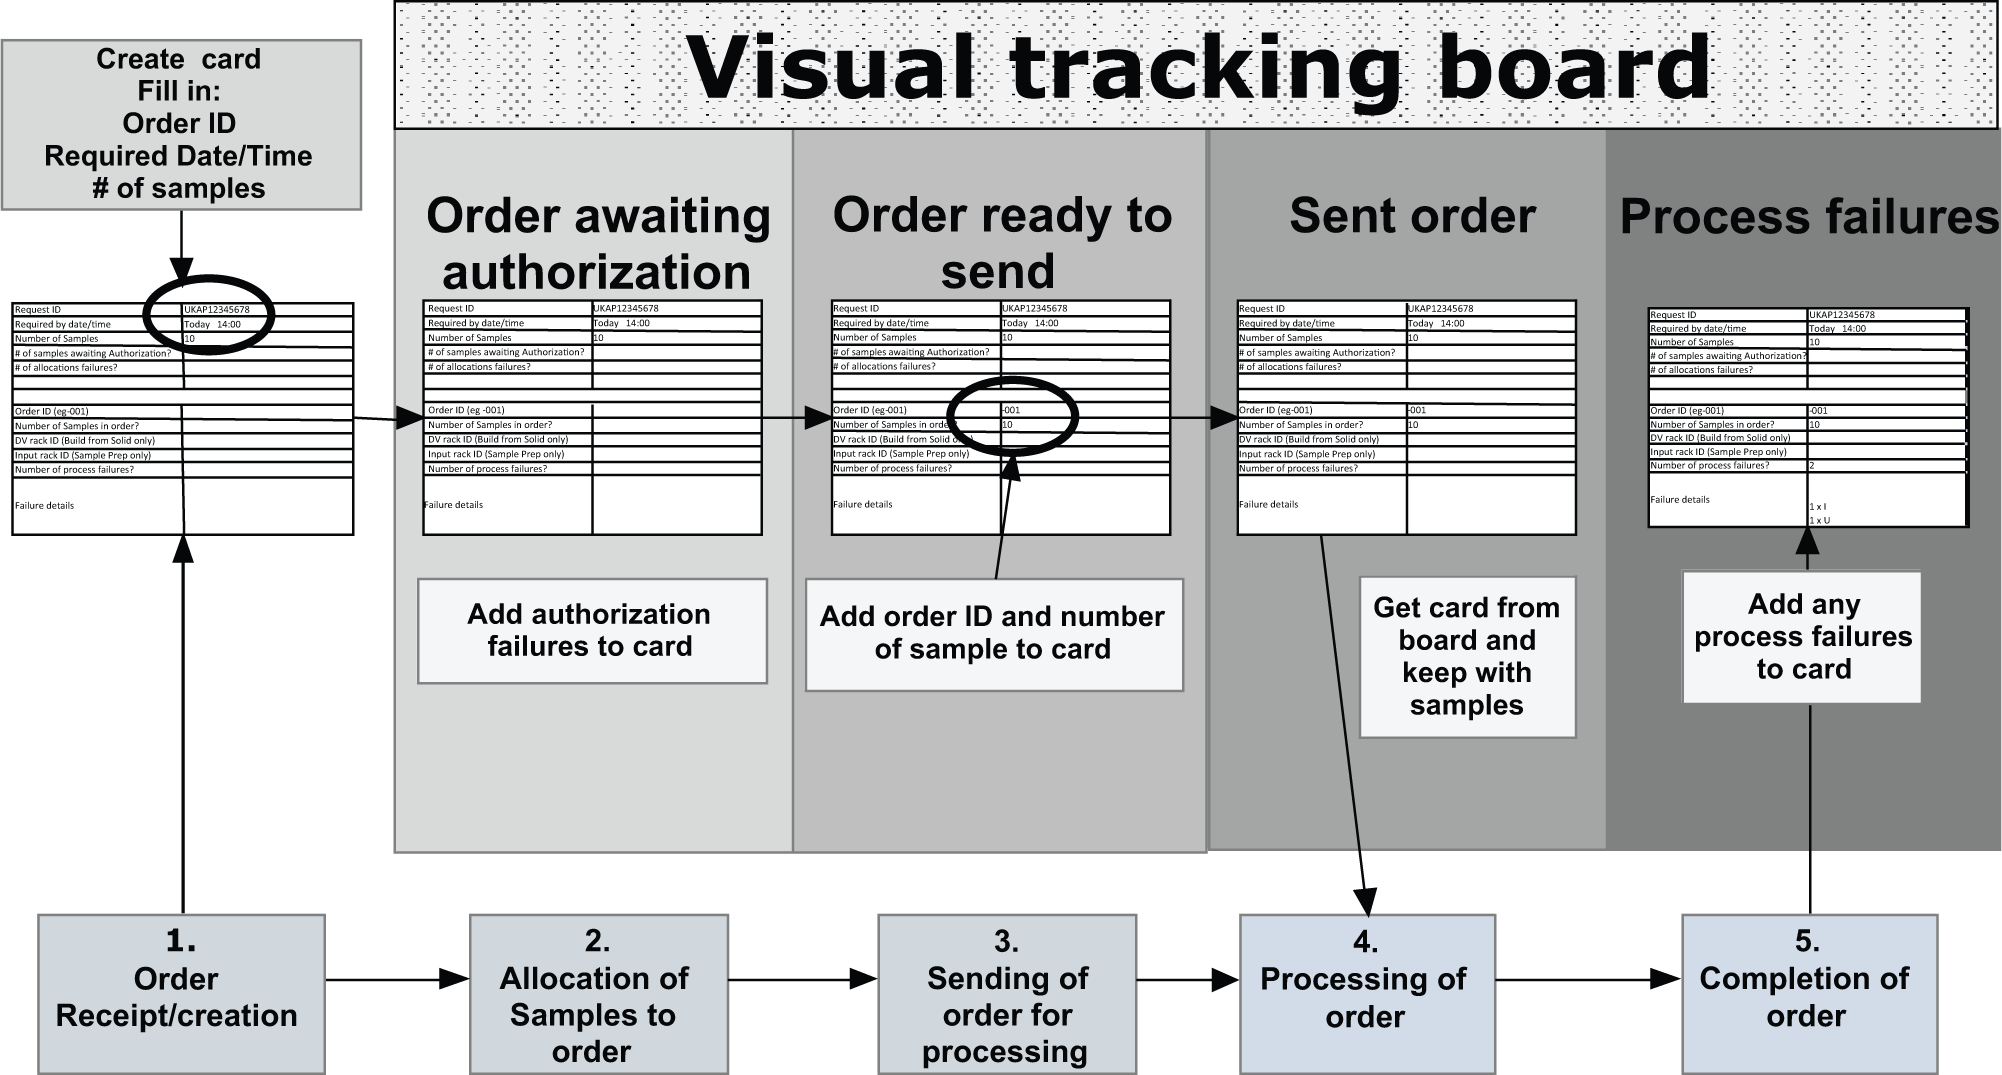
Map of solid process to be tracked, showing the creation, population, and progress of T-cards as orders pass though process milestones.
For each milestone to be tracked, a set of rules was developed for the compilation and flow of tracking information:
1. Order Receipt/Creation
Upon receipt/creation of an order, a card is generated, with the order ID, number of order items, and date/time required added to the card.
2. Allocating Samples to an Order
Order items are allocated to confirm that sufficient material is available to fulfill the order and to check for restrictions of use. If no actions are required, the card is transferred to the “Order ready to send” board panel. If items require authorization, the details are added to the card, which is then placed on the “Order awaiting authorization” panel. Cards on this panel are checked periodically to see if authorization has been granted. Upon receiving authorization, the card is transferred to the “Order ready to send” panel, and this acts as a holding area and allows delivery teams to control the level of work sent for processing to prevent the buildup of racks/orders available for processing while maintaining visibility of demand.
3. Sending an Order for Processing
When there is available work, orders are sent for processing, and the card is moved to the “Sent order” panel. Typically, there is a one-to-one relationship between a customer order and the order sent for processing, but where large orders are encountered that may overload the system, they are divided into suborders, with a card created for each suborder, which is then individually transferred to the “Sent order” board panel, with a card remaining on the “Order ready to send” panel to indicate more items require processing.
4. Processing of an Order
When an operator selects a rack to process from the automated store out-feed, the manual store, or the set-down table (see Fig. 2 ), the rack is scanned to find the associated order and the card retrieved from the “Sent orders” panel. The operator will then be able to confirm whether he or she has all the vials required to fulfill the order and to locate any additional vials, with the card then remaining with the racks/samples until processing is complete. Any sampling failures encountered during processing are added to the card to be acted upon on completion of the order.
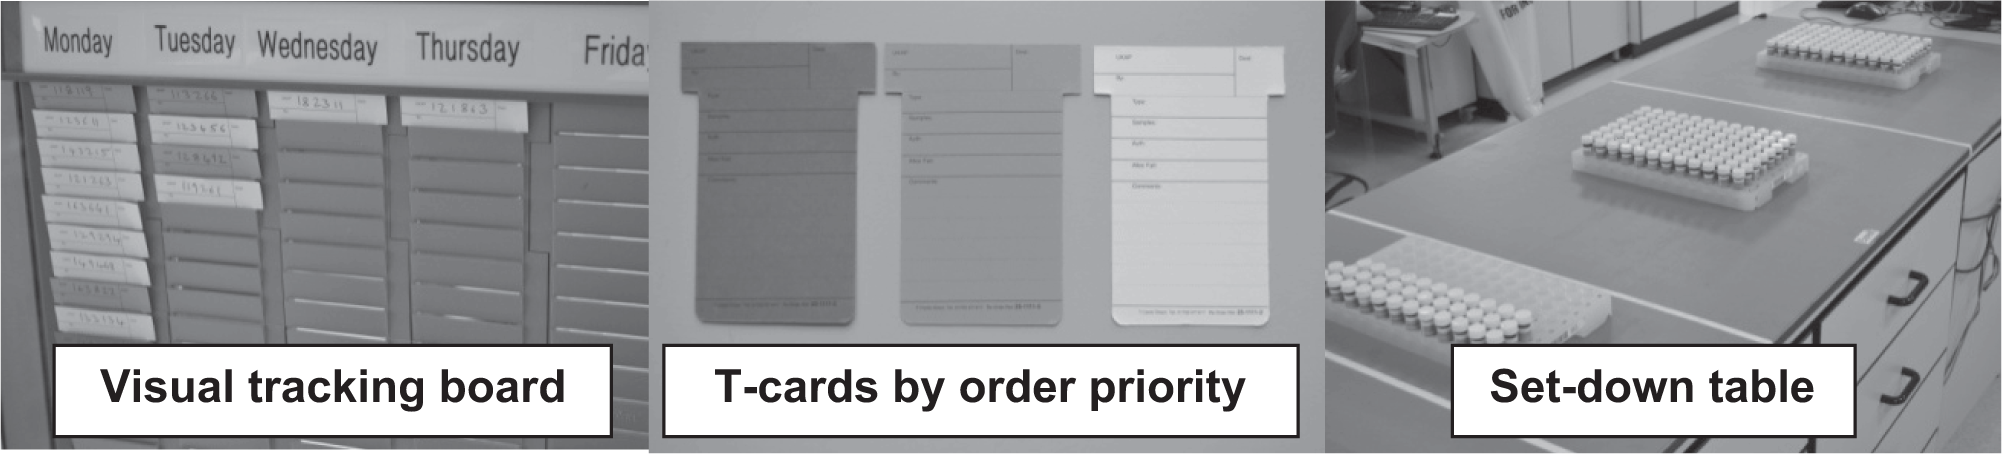
Left: Visual tracking board with columns for day order required or order status. Middle: T-cards used to capture order information colored by order priority. Right: Set-down table segregated by order priority to give visibility of work in progress.
5. Completion of an Order
Once all items within the order are processed and the order is complete, the card is checked for failures and appropriate action taken (e.g., informing the customer and adding failed items to an alternative workflow). At this point, the card is disposed of.
The second phase in implementing a visual solution was to pilot tracking, first by a simulation using handmade cards and brown paper and run through the process workflow, initially with a pilot workgroup. Based on positive feedback from the simulation exercise, it was decided to implement this across all solid processes. There were a number of risks with this approach: the need to maintain customer services, the difficulty of deploying onto a heavily loaded system, and gaining buy-in from the delivery teams. A half-day pilot in the real environment followed, requiring significant preparation to preload the visual tracking system with current order information to ensure that the pilot represented how the final solution would look and feel. The pilot immediately revealed a large number of orders at each stage in the process, clearly demonstrating the benefits of such a visual approach.
Indeed, the pilot was such a success that delivery teams elected to move forward into the final phase of visual solution implementation—extension into everyday operations. Over the following weeks, delivery teams were encouraged to improve and adapt the initial solution—for example, color coding of the tracking cards was introduced to highlight order priority (red signifying high-priority orders requiring immediate action, orange representing orders requiring completion by the end of the day, and yellow for lowest priority orders), increasing the visibility of high-priority orders on the tracking board. Once this optimization phase was completed, widely available preprinted T-shaped cards and corresponding slot boards were deployed ( Fig. 2 ) to afford full implementation of the tracking system.
To assess the impact of the changes, performance data were compared before and after introduction of the card system.
Results
Data were recorded from order creation to order completion to assess the impact on solid dispense orders for the period before and after visual tracking was implemented. Figure 3 shows the data plotted as a scatter graph with processing times falling into three categories:
Orders processed within 12 h—for these orders, no authorizations were required and no processing issues encountered.
Orders processed within 24 h—for these orders, one or more samples required authorization or a processing issue was encountered.
Orders taking more than 24 h to process—outlying orders requiring improvement.
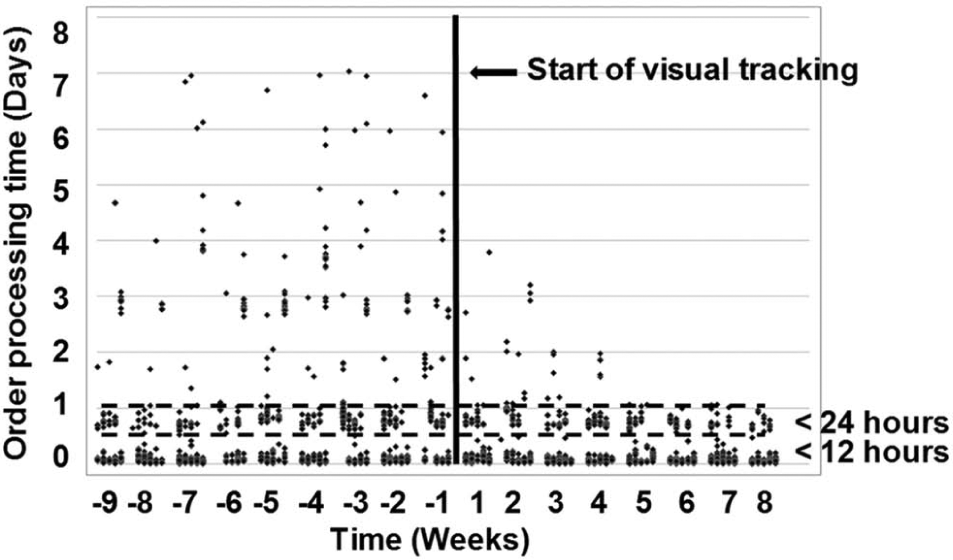
Scatter plot of solid dispense order processing times before and after introduction of visual tracking demonstrating a reduction in variability in order processing time.
Figure 3 shows a significant reduction in the variability of order processing times after the introduction of visual tracking, with nearly all orders being processed within 24 h just 5 weeks after introduction of the system. Looking at the data in more detail (see Fig. 4 ), visualizing the workflow in this way had a dramatic effect on processing times, with a 50% reduction from 18 h 51 min to 9 h 18 min. A similar reduction was seen in the median order processing time (see Fig. 4 ). Similarly, the percentage of orders processed rose from 55.2% to 69.3% within 12 h and from 81.5% to 92.5% within 24 h. The ability to visualize the demand on the system in this way allowed the delivery teams to react to orders waiting at process milestones, adjusting resource or rescheduling demand accordingly.
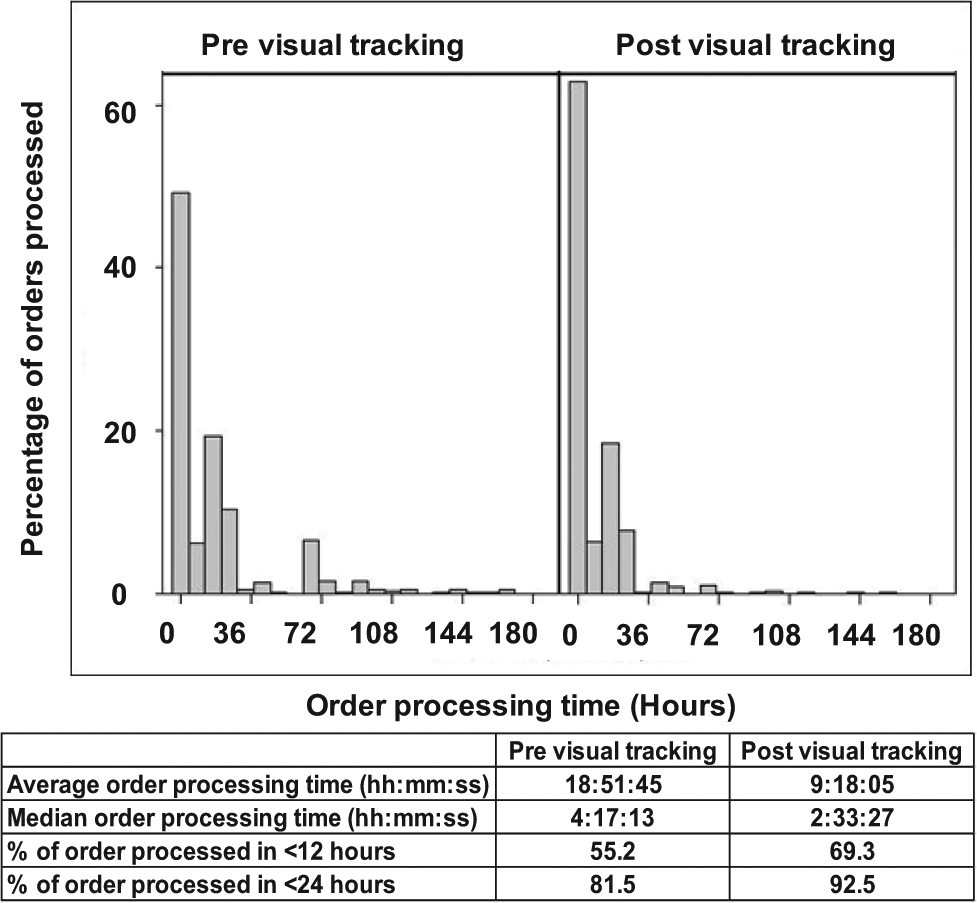
Solid dispense order processing time and a table of key statistics (average and median order processing times, % of orders processed within 12 and 24 h) before and after introduction of visual tracking.
To further investigate and exploit the impact of the visual tracking techniques, orders for the generation of liquid stocks from solids were also analyzed. A service-level agreement (SLA) was in place to solubilize solids and submit the liquids generated to the PLS within 4 h. The process consisted of multiple workflow steps, including handovers between processing areas and teams. All orders were submitted as high priority to meet the SLA, with a red card facilitating their priority passage through the system. Figure 5 shows a plot of the average weekly processing times from order creation to loading of liquid stock into the PLS. This shows a 17.5% reduction (~29 min) in the average time for processing of liquid generation orders following the introduction of the visual tracking board and cards.
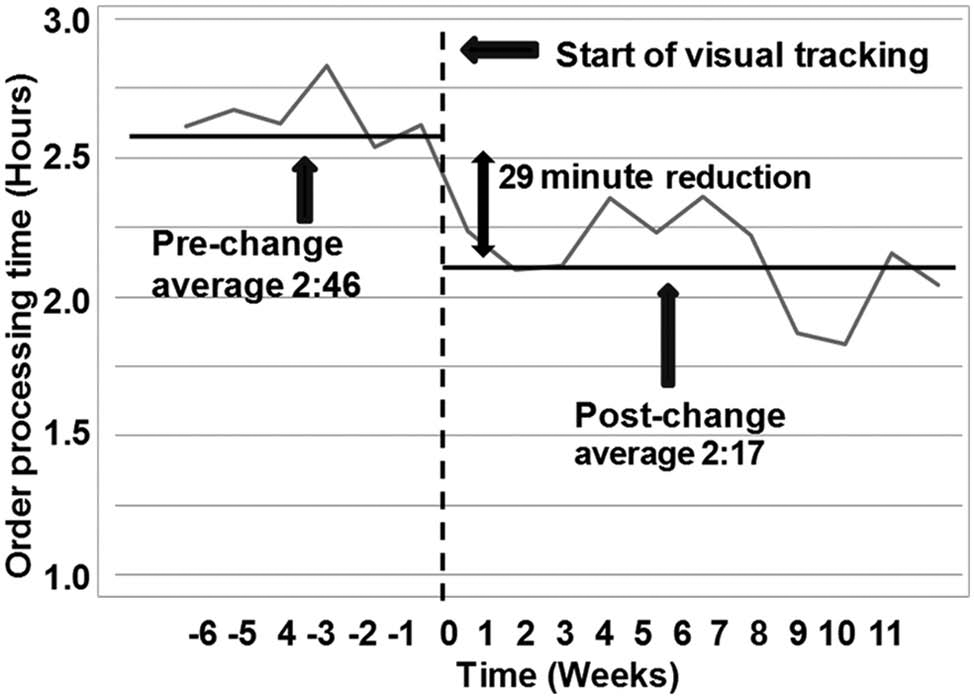
Average weekly processing times from order creation to loading of liquid stock into the primary liquid store. Plot shows a reduction of 29 min in average processing times after the introduction of visual tracking.
Discussion
Before the introduction of visual tracking, most orders were processed within 24 h but with a degree of variability that affected the delivery of test data to drug discovery projects. The introduction of visual tracking has significantly reduced variability in delivery, with 92.5% of orders being processed within 24 h. A reduction of 50% in the average processing time for solid dispense orders (see Fig. 4 ) and a reduction of 17.5% for solubilization orders (see Fig. 5 ) were observed after the introduction of visual tracking.
The dramatic improvement in order processing has been achieved using simple, low-cost tools that can potentially be applied to any complex workflow and can be rapidly implemented and easily maintained by delivery teams. The tools employed have served as a proof of concept, validating that visualization of orders can indeed add value in a dynamic high-throughput environment. The card-based visualization system has been key for identifying issues and improving delivery, but there have been associated challenges. As deviations became less frequent over time, the apparent cost/benefit of manually filling out and processing T-cards diminished, eroding delivery team engagement with the system. The results described show the value to drug discovery projects of tracking and visualizing CM orders but also the need to miminize the cost of the solution. AstraZeneca is therefore developing an IT solution that, building on the principles of the card-based system, automatically captures process milestones. Looking forward, as pharmaceutical R&D supply chains are expanded to include global research service suppliers, AstraZeneca can see the opportunity to extend these simple visual tracking principles to sample shipments between intersite groups and external partners. Further visual improvements to the supply chain will be described in future communications.
Footnotes
Acknowledgements
The authors express their thanks to the delivery teams for invaluable input to the project, to Philip Jarvis for statistical support and to Peter Simpson, Clive Green, Isabel Charles, Ian Sinclair, and Sunil Sarda for proof reading, helpful comments and discussions during the preparation of this manuscript.
Declaration of Conflicting Interests
The authors declared no potential conflicts of interest with respect to the research, authorship, and/or publication of this article.
Funding
The authors received no financial support for the research, authorship, and/or publication of this article.