
Abstract
In this study, a slow-responding chemo-optical sensor for dissolved oxygen (DO) integrated into a 96-well plate was developed. The slow response time ensures that the measured oxygen value does not change much during plate transport to the microplate reader. The sensor therefore permits at-line DO measurement of microbial cultures. Moreover, it eliminates the necessity of individual optical measurement systems for each culture plate, as many plates can be measured successively. Combined with the 96-well format, this increases the experimental throughput enormously. The novel sensor plate (Slow OxoPlate) consists of fluorophores suspended in a polymer matrix that were placed into u-bottom 96-well plates. Response time was measured using sodium sulfite, and a t90 value of 9.7 min was recorded. For application, DO values were then measured in Escherichia coli and Saccharomyces cerevisiae cultures grown under fed-batch–like conditions. Depending on the DO sensor’s response time, different information on the oxygenation state of the culture plate was obtained: a fast sensor variant detects disturbance through sampling, whereas the slow sensor indicates oxygen limitation during incubation. A combination of the commercially available OxoPlate and the Slow OxoPlate enables operators of screening facilities to validate their cultivation procedures with regard to oxygen availability.
Introduction
Dissolved oxygen (DO) is a crucial parameter for aerobic bioprocesses because the solubility of oxygen is low in aqueous solutions containing nutrients and salts, whereas exponentially growing cells have a high oxygen demand. The volumetric oxygen consumption may exceed the oxygen transfer rate, especially at high cell densities. 1 Oxygen limitation has severe effects on growth and product formation2,3 and is therefore monitored during production processes in bioreactors. 1 In contrast to that, the screening for microbial production strains is mostly carried out under uncontrolled conditions without any process monitoring. 4
To overcome this lack of information, several commercial systems for online DO monitoring in shake flasks, 5 minibioreactors, 6 and microplates 7 were developed. They all share the disadvantage of a limited number of parallel cultivations and are therefore not suitable if hundreds or thousands of putative production strains need to be screened.
Ninety-six-well plates are a common format for high-throughput screening programs. They have been characterized with regard to oxygen transfer 8 and mixing time and have been equipped with sensors for DO,9,10 and pH. 11 In a common laboratory automation setup, numerous 96-well plates are incubated in a so-called plate hotel. To read out signals or take samples, the plates have to be removed from the hotel and processed. During that time, steady decrease of DO due to the cells’ respiration occurs. To estimate the state of a culture during the cultivation in such a setup, the sensor needs to have a “memory” function (i.e., it should show a slow response).
Therefore, it was the aim of this study to develop an oxygen sensor for at-line measurements in 96-well plates. Because of the slow response, the oxygen value measured in the plate reader does not change much compared with the one on the shaker. With the sensor, discrimination between aerobic and anaerobic conditions should be possible. The functionality of the prototype sensor then needs to be proven by response time measurements using sodium sulfite and microbial culture broth. Then the sensor is applied to monitor growth conditions of microliter-scale fed-batch cultures.
Material and Methods
Oxygen Sensors
The DO in bacterial and yeast cultures was measured with optical oxygen sensors embedded in 96-well microplates (Microlon 600; Greiner, Frickenhausen, Germany). In addition to the sensors with slow response, commercially available microplates with an oxygen sensor with fast response (OxoPlate; PreSens, Regensburg, Germany; t90 < 30 s) were used. The response time t90 is the time at which oxygen has decreased to 90% of its total decrease. The sensors consist of a fluorescent, oxygen-sensitive dye and an inert reference dye. Both dyes are integrated in a polymer. Furthermore, a microsensor (NTH-PSt1-L5-TS-NS40/0.8-NOP, PreSens; t90 < 2 s) was tested to obtain the actual oxygen content within the sample for comparison with the ones detected with the sensor plates with slower response.
Manufacturing of the Sensor Plates with Slow Response
Different approaches were tested to obtain a sensor with a reproducible response time of approximately 10 min. As the original oxygen sensor of the commercial OxoPlate responds within 30 s, we tried to enlarge the response time by using different polymer layers and increasing the layer thickness. Sensor foils with different layers and thicknesses were produced using a knife coating device (ZAA 2300; Zehntner GmbH, Sissach, Switzerland) to spread the liquid sensor material with a constant thickness onto a supporting foil. The dyes were dissolved in a hydrophobic polymer. The two-layer sensor foils (SL-F2-AB, PreSens; Fig. 1A ) consisted of a polymer layer with thicknesses between 50 and 800 µm and a polymer layer containing the fluorescent dyes with a constant thickness of 50 µm. The three-layer sensor foils (SL-F3-AB, PreSens; Fig. 1B ) consisted of a layer with fluorescent dyes; a white, reflecting layer; and a black layer as optical isolation. Each of the three layers had a thickness of 600 µm. Five-millimeter spots were cut out of these sensor foils and bonded with silicone glue (No. 692-542; RS Components, Mörfelden-Walldorf, Germany) into the wells of a 96-well, flat-bottom microplate (Greiner). The supporting foil faced the bottom of the microplate.
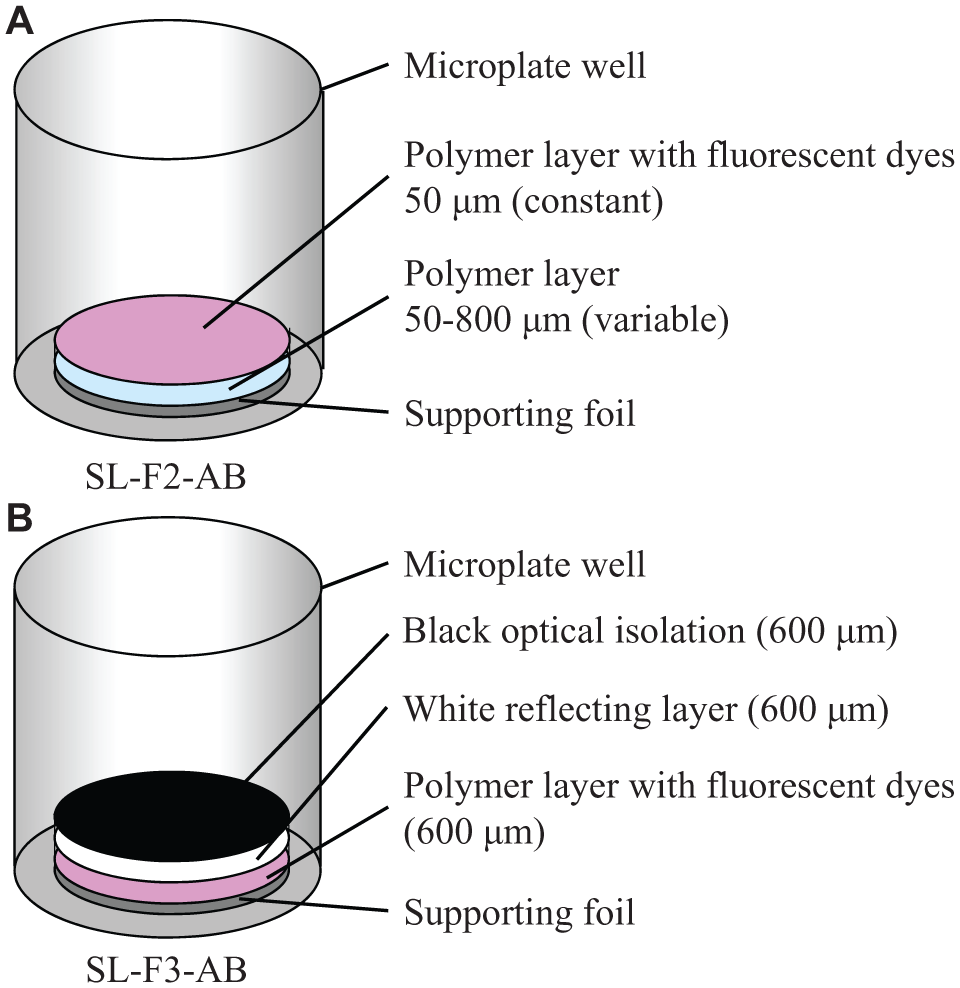
Schematic drawing of prototype sensor setups. (
In a third approach, liquid sensor materials with volumes between 2 and 130 µL were pipetted into round-bottom 96-well microplates (Greiner). The sensors were produced using a hydrophilic (HG-T-AB, PreSens) and a hydrophobic polymer (SL-T-AB, PreSens), respectively. The sensors were dried under atmospheric conditions for at least 24 h. After drying, the polymer layer adheres to the bottom of the microplate. For volumes of more than 50 µL, successive addition of smaller volumes was also tested, with a minimum drying time of 4 h before adding the next volume. Four wells per microplate and volume were used. For the best sensor (Slow OxoPlate), plates with 96 sensors were produced, sealed in an opaque bag, and beta irradiated. Figure 2 shows the setup of the sensors as well as pictures of the Slow OxoPlate.
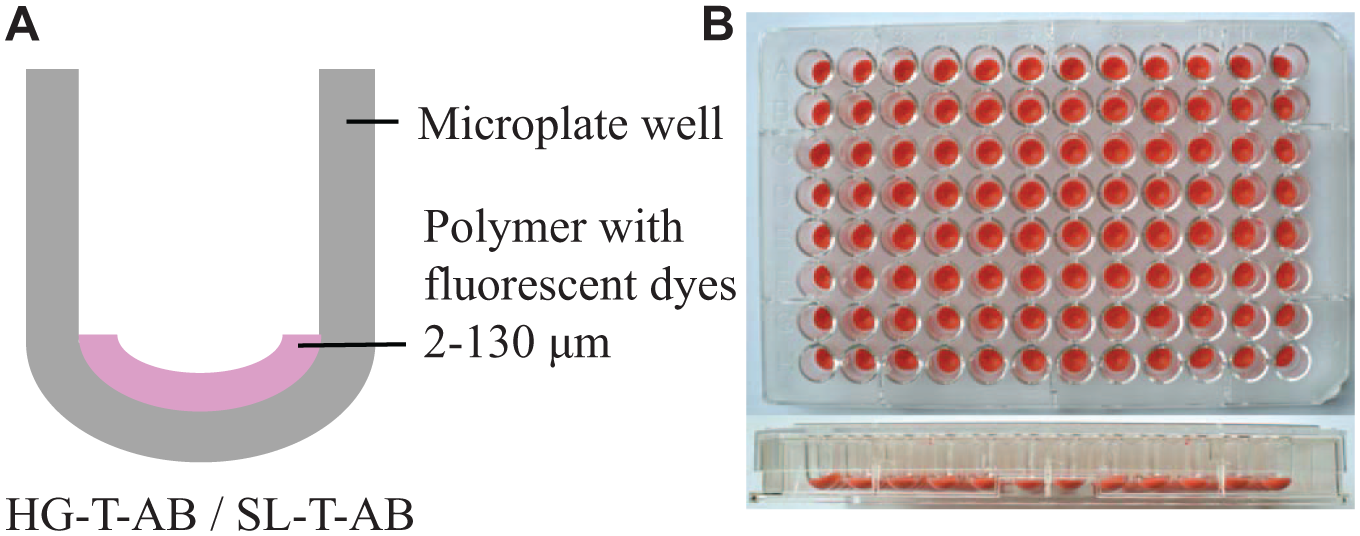
Third sensor setup: liquid sensor materials pipetted into round-bottom microplates. (
Sensor Characterization
For determination of the precision and resolution of the Slow OxoPlate, the sensors were calibrated using air-saturated water (cal100) and oxygen-free water (cal0). For cal100, about 20 mL of deionized water was put into a 50 mL glass vessel, closed with a screw cap, and shaken vigorously for approximately 2 min. The glass was then opened and moved gently to avoid oversaturation. For cal0, 0.2 g of sodium sulfite was dissolved in 20 mL deionized water in a closed glass vessel and moved slightly to dissolve the sulfite. Twenty-four wells of the Slow OxoPlate were filled with 200 µL of cal100 and 280 µL of cal0 for the round-bottom plates and 380 µL of cal0 for the flat-bottom plates, respectively. The wells with cal0 were closed with strips of adhesive foil (EasySeal, Greiner) to minimize oxygen ingress. The plate was incubated in a microplate reader Fluoroskan Ascent (Thermo Fisher Scientific, Dreieich, Germany) for 1 h at 37 °C. The fluorescence signals were measured at 37 °C for 20 min with a measurement interval of 2 min, using the filter combinations 544/650 nm for the indicator dye and 544/590 nm for the reference dye. At these wavelengths, most fluorescent media ingredients do not display fluorescence. The calibration constants k100 and k0 were calculated as the average values of the respective intensity ratios of the indicator and reference dye.
Differing from this procedure, for DO calculation of the response time measurements, k100 was taken from the start value and k0 from the end value of the respective measurement.
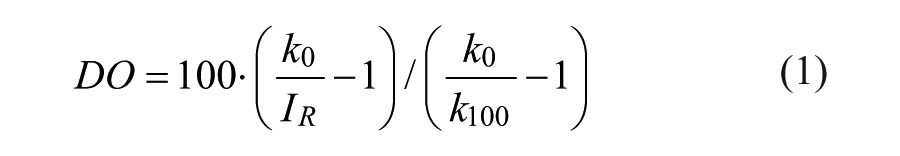
Calculation of DO from Fluorescence Data
DO (in % air saturation [% a.s.]) was calculated from the ratios IR of the fluorescence intensities of the indicator and reference dye and the calibration values k100 and k0 using the Stern-Volmer equation:
Response Time Measurement
Eighty microliters of cal100 was put into the four wells containing the sensors, covering all of the sensor material. The fluorescence intensities (544/650 nm and 544/590 nm) were measured with the Fluoroskan Ascent microplate reader at room temperature with an interval of 1 min for 2 h until the signals were constant. Then a new measurement was started, measuring cal100 for 5 min with an interval of 1 min. After that, the plate was ejected and 200 µL (u-bottom plates) or 300 µL (flat-bottom plates) of cal0 containing 5 × 10⁻⁴ M of cobalt nitrate as a catalyst was added rapidly with an eight-channel pipette and carefully mixed once. The wells were covered with strips of adhesive foil (EasySeal, Greiner) and the measurement continued with an interval of 0.25 min for at least 2.5 h until the signals were constant. After converting the signals into oxygen values, the response time t90 was determined as the time in which the oxygen decreased to 10% of its original value of about 100 % air saturation.
Precision and Resolution
For the Slow OxoPlate, precision and resolution at 37 °C were determined. Precision was calculated as the maximum standard deviation of four sensors measured at the same time. Resolution was calculated as the maximum standard deviation of five succeeding measurement points of a kinetic of one sensor. As target values for these specifications, the ones of the standard OxoPlate (PreSens) were applied. The precision of this plate is given as ±5% a.s. for cal100 and ±2 % a.s. for cal0, the resolution as ±2% a.s. for cal100 and 0.5% a.s. for cal0.
Strains
For bacterial cultivation experiments, Escherichia coli W3110 and BL21 were used. The BL21 strain was transformed with the plasmid pDgPNP, which has been constructed for heterologous expression of a purine nucleoside phosphorylase from Deinococcus geothermalis. 12 For yeast cultivations, Saccharomyces cerevisiae AH22 harboring the plasmid pPG6 for secretion of an endopolygalacturonase from Aspergillus niger 13 was used. Both strains were stored at −80 °C in media containing 20% glycerol.
Media and Cultivation Conditions
E. coli cultures were grown in EnPresso B or a prototype growth system based on EnBase technology (EnPresso B Defined), whereas baker’s yeast cells were grown in EnPresso Y Defined medium (all from BioSilta Ltd., Cambridge, UK). Unless otherwise stated, cultures with EnPresso growth systems were prepared according to the manufacturer’s instructions. All cultivation experiments were performed at 30 °C.
Microbial cultures were carried out in different systems and scales. Shake flask cultivations were performed with 25 mL EnPresso B using a 125 mL Ultra Yield Flask covered with AirOtop Enhanced Seal (Thomson Instrument Company, Oceanside, CA). For controlled glucose release, 1.5 U L−1 of biocatalyst (reagent A) was added, and the flasks were shaken in a Kuhner LT-X incubator (Adolf Kühner AG, Basel, Switzerland) at 200 rpm, 25 mm amplitude. Microplate cultures were carried out in two different ways. For the first experiments with optimal aeration, the sensor plates were covered with “System Duetz” sandwich covers (Enzyscreen B.V., Haarlem, the Netherlands) and shaken at 300 rpm, 50 mm amplitude.
For automated reading and sampling, experiments were performed on a robotic platform, which was previously described. 14 Briefly, it consists of several instruments attached to a liquid-handling robot (Hamilton Microlab Star; Hamilton Bonaduz AG, Bonaduz, Switzerland). The system can incubate up to eight 96-well plates and analyze samples with a microplate reader and a flow cytometer. The culture plates were sealed with XPierce foil (Excel Scientific Inc., Victorville, CA) and incubated on an orbital shaker (Hamilton FAME incubator). For measurements with the microsensor, the on-deck shaker Teleshake 95 (Inheco GmbH, Munich, Germany) was used.
Prototype Sensor Tests with Bacterial Cultures
Sensor tests with microbial cultures were performed using E. coli W3110 cells grown in shake flasks overnight to an optical density at 600 nm (OD600) of 6 to 8. From the culture, different volumes (100, 150, 200 µL) were then transferred in triplicate to the sensor plates. The plates were covered with sandwich covers and shaken for 1 h, in order to reach equilibrium conditions. Then, the plates were manually placed into a Biotek Synergy MX plate reader (Biotek Instruments Inc., Winooski, VT). The delay until measurement was less than 1 min. For both sensor plate types (Slow OxoPlate, OxoPlate), the same reader settings were used. The excitation wavelength for both fluorophores was 540 nm. The emitted fluorescence light of the indicator was measured at 650 nm, whereas the reference fluorophore emission was measured at 590 nm. A time-resolved measurement from 0 to 500 µs was performed with a sensitivity setting of 50. Measurements were carried out every minute for 8 min. DO values were calculated from the raw data using Gen5 v1.09 (BioTek Instruments).
For comparison of the oxygen values generated with the microplates with an external reference instrument, a DO microsensor (PreSens) was applied. The Slow OxoPlate was shaken at different speeds on the Teleshake 95, which is located on the robotic platform, for 30 min. The microsensor was calibrated according to the manufacturer’s instructions. A gripper transported the plate from the shaker to a position at which the microsensor DO measurement was carried out. The transport time was 12 s. Because of the rapid signal decrease, the microsensor was submerged in only one well for 5 s. Afterward, the sensor plate was transported to the microplate reader.
Cultivation on the Robotic Platform
E. coli BL21 pDgPNP glycerol stock (maintained at −80 °C) was plated on LB agar containing 100 µg mL−1 ampicillin and incubated overnight at 30 °C. The grown cell material was then washed from the agar plate using 3 mL of EnPresso B Defined [Prototype]. The yeast preculture was grown as a batch culture in EnPresso Y Defined containing 20 g L−1 of glucose for 24 h.
The main cultures were prepared in Erlenmeyer flasks with cells from the precultures corresponding to an initial OD600 of 0.15. Then, 170 µL per well was distributed into the Slow OxoPlate and the OxoPlate, sealed, and placed onto the robotic platform. The liquid handler added reagent A in the predefined amounts (E. coli: 1 U L−1, S. cerevisiae: 3 U L−1). The plates were transported into the FAME incubator and shaken at 1000 rpm (2 mm amplitude). For DO measurement and liquid-handling steps (OD600 measurement, addition of reagent A), a sampling method was programmed using the Hamilton VenusOne Method Editor v4.2.1.6670. With the sampling method, the user is able to define sampling frequency and individual events using an MS Excel spreadsheet. Every 2 h, the plates were transported from the shaker to the microplate reader for the DO measurements. For OD600 measurements, 5 µL samples were taken after 6, 14, 23, 33, and 43 hours. This automated sampling procedure included 30-fold dilution of the samples to a total volume of 150 µL in standard, flat-bottom, 96-well plates (Greiner) and measurement at 600 nm in the microplate reader. After overnight incubation, glucose release was further increased by addition of reagent A to the cultures.
Results
Development of a Slow OxoPlate Sensor
The robotic platform used in this study is equipped with an incubator and a spectrophotometer, which are attached to a liquid handler. To read out fluorescence signals from a sensor plate, a total transport time from the shaker to the spectrophotometer of 26 s was measured. Because larger platforms may have longer transport times, a minimum response time (t90) of 10 min was defined.
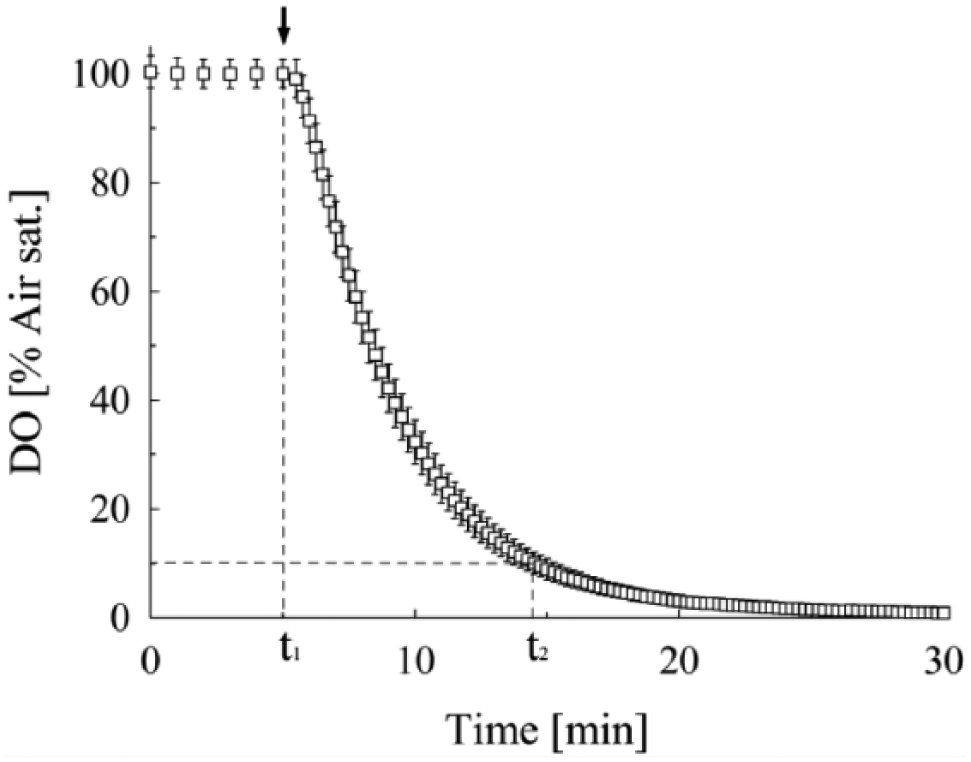
The two-layer SL-F2-AB foil sensors showed inhomogeneity of the sensor foil at layer thicknesses of 200 µm or greater. For the response time measurements, the most homogeneous parts of the foil were used. The response time was <10 s for all layer thicknesses and thus much too low for the target response time of 10 min ( Fig. 3 ). The three-layer SL-F3-AB foil sensor revealed excellent reproducible results, but again, the response time was only 1.0 to 1.2 min. The production of even thicker layers to enhance the response time was not possible because of the inhomogeneity of such thick sensor foils. Thus, foil sensors were not further investigated.
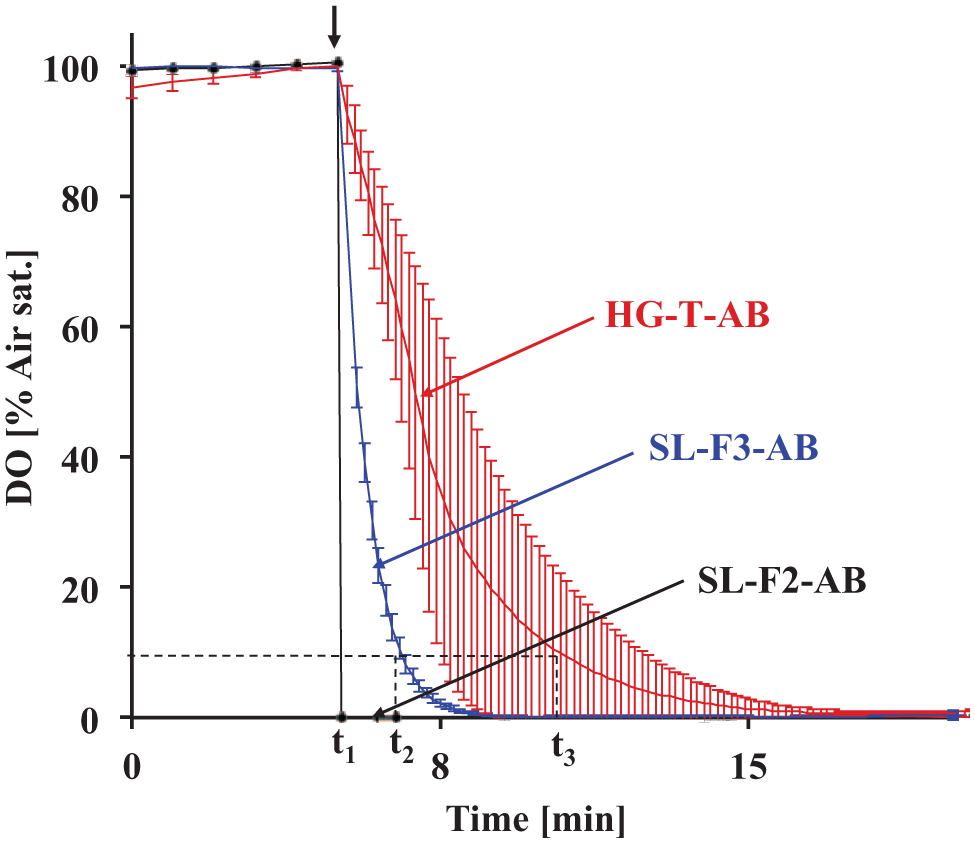
Response time measurements of the foil-based sensors SL-F2-AB, SL-F3-AB and the pipetted sensor HG-T-AB. After measuring oxygen at air saturation for 5 min with a measurement interval of 1 min, sulfite was added and the solution mixed. The arrow shows the time point of sulfite addition (t1). The response times of SL-F2-AB (t2) and SL-F3-AB (t3) were determined.
The pipetted sensor using a hydrophilic polymer (HG-T-AB) showed response times of 2.4 to 7.9 min for the maximum volume of 130 µL/well, which was still too low for this application. Furthermore, the reproducibility of the response times of the four different sensors was rather bad for volumes greater than 50 µL. Thus, volumes higher than 130 µL to increase the response time were not tried.
The pipetted sensor using a hydrophobic polymer (SL-T-AB) also showed a bad reproducibility for high volumes of liquid sensor material of greater than 75 µL. For these volumes, surface defects in the sensor layer were visible because of inhomogeneous drying. Thus, the sensor material was applied to the microplate well in smaller volumes step by step. After addition of the first volume of sensor material, it was dried for at least 4 h in ambient air before applying the next volume. This improved the reproducibility dramatically. A volume of 2 × 15 µL gave a response time of 9.7 min. This sensor was further characterized with regard to precision, resolution, and reproducibility of the response time and the oxygen values after 1 min.
The response times of 96 sensors pipetted from a different batch of liquid sensor material were determined and compared with the response times of the four sensor spots of the previous test. The results were very similar with 9.6 ± 0.8 min ( Fig. 4 ) compared with 9.7 ± 0.6 min. The average oxygen values after 1 min were 91.4% ± 4.1% a.s. compared with 90.2% ± 1.8% a.s. from the previous test. This shows that the sensor can be produced in a very reproducible way. The slow response enables detection of the approximate oxygen value in the shaken culture after moving the microplate from the robotic system to the reader, as the measured oxygen decrease is quite small. The precision at 37 °C for this sensor was determined as ± 0.6% a.s. (cal0) and ± 4.8% a.s. (cal100), the resolution with ± 0.05% a.s. (cal0) and ± 0.2% a.s. (cal100), respectively. These values lie within the target values of the OxoPlate. The Slow OxoPlate fulfills the requirements for this application and was used for the oxygen measurements during bacterial and yeast cultivation.
Response time measurements in the Slow OxoPlate with the sodium sulfite method. The arrow indicates the time point of sulfite addition (t1). The decreasing DO was then measured with an interval of 15 s. Oxygen dropped below 10% a.s (t2) 9.6 min after sulfite addition.
Proof-of-Concept for Microbial Cultivation Monitoring
To investigate the signal change during plate transport, the oxygen consumption of bacterial cultures was measured with the fast-responding OxoPlate and the slow-responding Slow OxoPlate. Cultures that were grown under glucose-limited fed-batch conditions were taken for these experiments, as they are characterized by a lower oxygen consumption rate than cells growing at their maximum growth rate. Preliminary experiments in shake flasks equipped with DO sensors were carried out to determine the time at which glucose limitation occurred. This was characterized by an increase of DO until 90% a.s. or greater, which was reached after overnight incubation.
Then, the shake flask culture was transferred into the sensor plates, which were closed with sandwich covers for well-defined aeration and shaken for 1 h. The fluorescence signals were then recorded for 8 min ( Fig. 5 ) without additional shaking. The Slow OxoPlate shows an initial DO value of 95%, followed by a linear decrease. At the endpoint, a DO value of 82% was detected. In contrast to that, the signal of the OxoPlate declines from 70% to 30% within 4 min. The decline is then slowing down, reaching 21% at the endpoint.
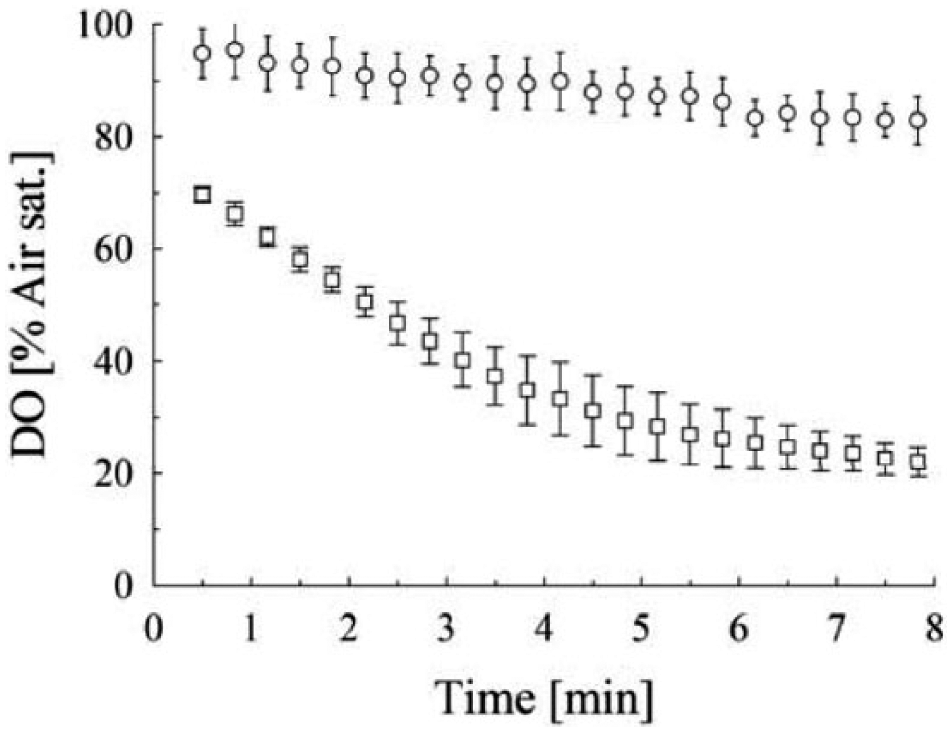
Triplicate dissolved oxygen measurements of E. coli W3110 cultures grown in EnPresso B at 30 °C. Open circles: Slow OxoPlate; open squares: OxoPlate. The cultures were grown in shake flasks overnight, and then 200 µL per well was transferred into Slow OxoPlates and OxoPlates. After 1 h of incubation at 300 rpm (50 mm amplitude), the plates were measured in a microplate reader without additional shaking.
Aerobic conditions were detectable with both sensor types, which means that both sensor types could be applied on the robotic platform for bacterial cultures under glucose limitation. However, in this experiment, cells were slow growing and the initial DO was close to 100% air saturation, which does not resemble the actual situation during a strain screening.
Cultures with a high growth rate, which are commonly used in screening experiments under batch conditions, exhibit lower DO levels than the slow-growing cells in the first experiment. Therefore, lower initial DO levels were tested in a subsequent investigation. A DO microsensor served as a reference system for rapid at-line measurement, and an on-deck shaker was used to shorten the transport times.
At lower shaking frequencies, DO values declined ( Fig. 6 ). However, even at 400 rpm, DO levels greater than 20% were detected with the Slow OxoPlate. The microsensor measurements draw a different picture. Even at delay times of 20 s from stopping the shaker until measurement, it was not possible to measure DO signals that closely resemble the sensor plate results. In addition, the microsensor was mounted above the shaken plate for online DO measurements. After stopping the shaker, a decline of DO signal from 89% to 59% in 75 s was recorded (data not shown). Because glucose-limited cultures were taken for these experiments, it can be expected that these effects are much more severe with exponentially growing microbial cultures.
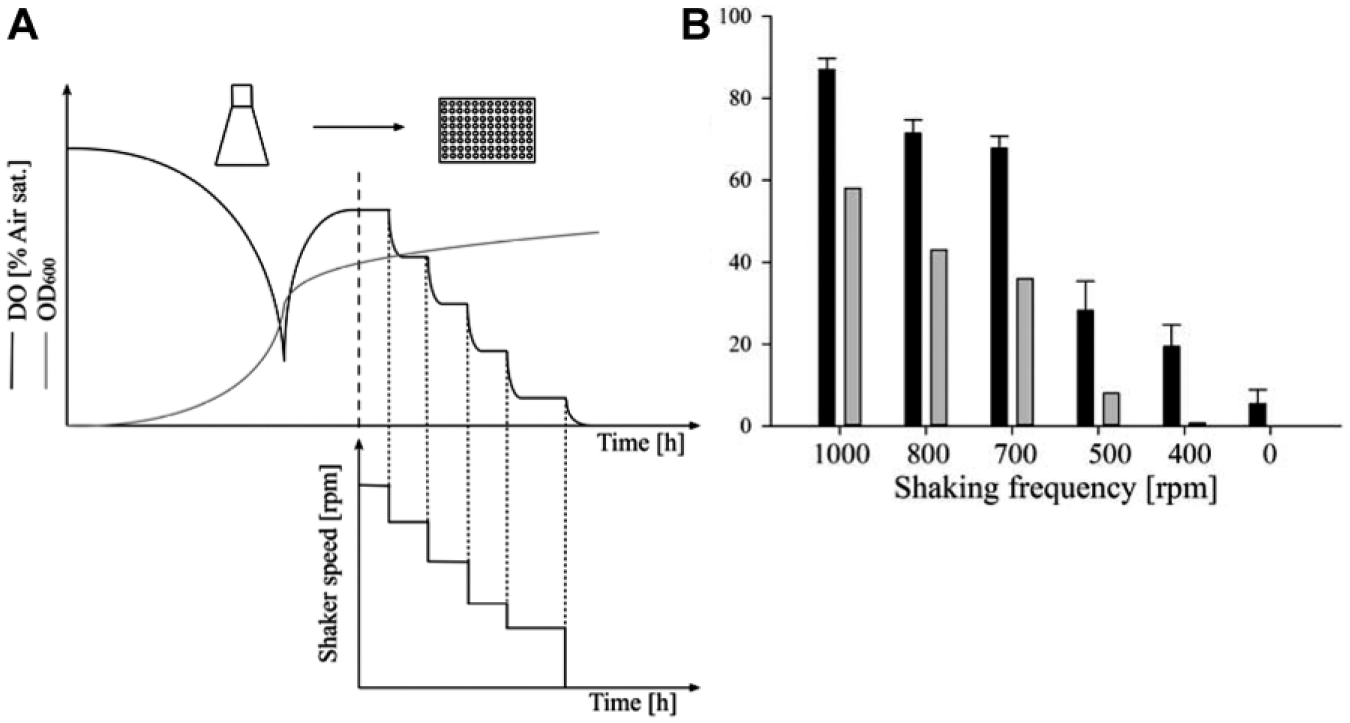
Comparison of at-line microsensor and Slow OxoPlate measurements of E. coli W3110 cells incubated at different shaking velocities. (
Comparison of Slow and Fast-Responding Sensor Plates in an Automated Cultivation
To demonstrate the ability to detect oxygen limitation during high-throughput cultivation experiments, a reference experiment for cell line screening on a robotic platform was performed. Two culture plates were prepared for comparison of both sensor plates: the Slow OxoPlate and the OxoPlate. Both were prepared with the same layout: cultures with EnPresso B and EnPresoo Y Defined were inoculated with E. coli BL21 pDgPNP and S. cerevisiae AH22 pPG6, respectively. After an initial growth phase of 10 to 20 h, glucose release was further increased by adding reagent A. The plates were taken from the incubator every 2 h for DO measurement and combined with OD600 measurements at certain time points.
For both yeast and bacterial cultures, the typical DO curves of fed-batch fermentations were recorded. However, different DO profiles were obtained from the sensor types tested. For E. coli, the OxoPlate showed a decline followed by an increase in DO the first few hours ( Fig. 7A ). This trend is not detectable with the Slow OxoPlate. After 20 h, 12 U L−1 reagent A was added, which provided a faster glucose release and thus a higher growth rate. Both sensor plates detect a drop in DO at that time. However, the OxoPlate indicates an oxygen limitation phase of 8 h, whereas this phase appeared to be less than 4 h when looking at the data from the Slow OxoPlate. For S. cerevisiae, the obtained results were similar ( Fig. 7B ). Addition of reagent A after 10 h resulted in a decrease of DO, indicated by both sensors. A short phase of oxygen limitation was detected with the Slow OxoPlate, whereas the OxoPlate data indicated an anaerobic phase of 10 h.
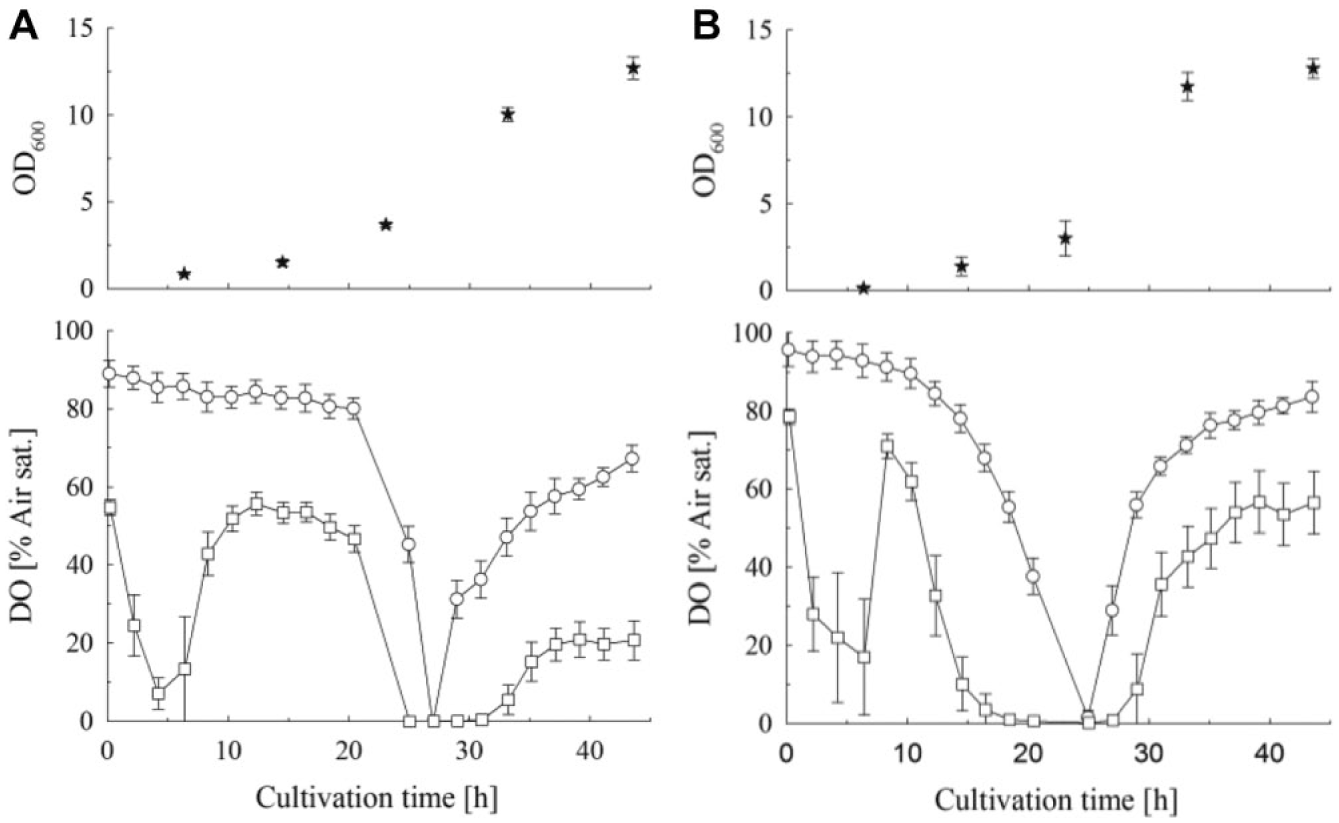
Application of slow- and fast-responding sensor plates for fed-batch cultures of E. coli BL21 pDgPNP (
The OxoPlate was able to detect the initial exponential phase of the culture after inoculation. Because of the delay between stopping of the aeration and the measurement, the oxygen decreased further during plate transport. After the first few hours, both cultures grew under substrate limitation, which is indicated by an increased DO level. This phase was not detectable with the Slow OxoPlate, which proves its capability of serving as an indicator for the DO concentration during shaking. After increasing the glucose-release rate, the OxoPlate indicated severe oxygen limitation in both cultures. In comparison with the data from the slow sensor, we conclude that this is mainly due to the delayed measurement. Only a short oxygen limitation phase of 4 h is observed with the Slow OxoPlate.
With the reference cultivation presented in this study, the functionality of the Slow OxoPlate was demonstrated. Oxygen limitations in microbial cultures in 96-well plates can be detected through at-line DO monitoring.
Discussion
In this study, we present the development of a new sensor type for standard 96-well plates. The targeted response time and reproducibility were achieved by sequential pipetting of 2 × 15 µL of liquid sensor material into the plates. Sensor characterization using sodium sulfite showed a response time of 9.7 min, and further tests using microbial cultures indicated that the system can be applied for culture monitoring. Therefore, a reference experiment on a robotic platform was performed, in which DO-level monitoring helped to identify oxygen limitation phases in E. coli and S. cerevisiae cultures.
Each of the two sensor types was able to deliver information on different oxygenation states of the culture. The OxoPlate was able to detect disturbances caused by the measurements. Data on the DO level at the time of sampling may serve as a guideline for sampling frequency and time points. Signals obtained from the Slow OxoPlate closely reflected the DO curves obtained from on-line sensor systems such as the PreSens SensorDish Reader or Shake Flask Reader, which underlines that the right approach for sensor design was chosen. The importance of the adjustment of aeration conditions in small-scale cultures was pointed out by different research groups. For example, Stockmann and colleagues 15 have reported a severe impact of oxygenation on the screening of phytase producing Hansenula polymorpha strains.
Within the study, the application of glucose-limited cultures was a good choice because their stable oxygen consumption rate over time made the adjustment of DO level by adjustment of the shaking frequency possible. Moreover, growing E. coli using the EnBase technology has been found to be an important factor for the scale up of recombinant protein production processes.3,6 In future work, we want to prove that the combination of small-scale sensor technology and high-throughput fed-batch cultivation can be seen as an enabler for process design based on QbD principles. 16
In summary, the detection of oxygen limitation in aerobic microbial cultures using standard 96-well plates equipped with fluorescent sensor spots was successfully performed. By increasing the sensor’s response time, at-line determination of a rapidly changing parameter such as DO was possible. With the new sensor, optimization of growth conditions on a reference plate is possible. High-throughput screening programs can be carried out afterward using standard 96-well plates. The conditions of such screening experiments are comparable with bioreactor cultivations in terms of oxygen availability, which helps in reducing the risk of difficulties during scale up.
Footnotes
Acknowledgements
The authors are thankful for assistance carrying out the experimental work and programming. Michael Heiser, Susan Bigesse, and Christopher Skopnik were involved in parts of the study. Moreover, technical and material support by BioSilta Ltd. and PreSens Precision Sensing GmbH was appreciated.
Declaration of Conflicting Interests
The authors declared no potential conflicts of interest with respect to the research, authorship, and/or publication of this article.
Funding
The authors disclosed receipt of the following financial support for the research, authorship, and/or publication of this article: Technical and material support by BioSilta Ltd. and PreSens Precision Sensing GmbH. Financial support by the German Federal Ministry of Education and Research (BMBF) within the Framework Concept “Research for Tomorrow’s Production” (project No. 02PJ1150, AUTOBIO project).