
Abstract
The Nanostream (Pasadena, CA) Veloce system, together with 24-column Brio cartridges, offers a novel approach to micro parallel liquid chromatography (μPLC). This system allows users to achieve unprecedented throughput for standard assays while matching the performance of conventional LC instrumentation, thus enabling routine compound purity assessment and physiochemical property profiling early in the drug discovery and development process.
The Veloce system—which includes instrumentation, software, and replaceable microfluidic cartridges—incorporates pressure-driven flow to achieve chromatograms comparable to conventional high performance liquid chromatography (HPLC) instrumentation for a broad class of analytical applications while offering a dramatic increase in sample analysis capacity. The system enables parallel chromatographic separations and simultaneous, real-time UV detection. Each Nanostream Brio cartridge, made of polymeric materials, incorporates 24 columns packed with standard (C-18) stationary phase material to achieve reverse phase separations. Mixing and distribution of the mobile phase to each of the 24 columns is precisely controlled in each cartridge. The system provides an ideal platform to accelerate assessment of compound purity and physicochemical properties (i.e., log
Keywords
Introduction
Since the introduction of combinatorial chemistry, compound libraries have undergone a significant increase in size and diversity. The expansion and diversification of compound libraries over the last decade has resulted in increased demand for analytical throughput. For example, a major bottleneck in the maintenance of compound libraries is monitoring results of individual syntheses. 1 Hundreds to thousands of compounds in a library should be evaluated for purity prior to biological testing to ensure meaningful screening results. 2,3 Routine compound purity screening and analysis of all members of a large and diverse parallel synthesis array requires a fast analytical method of wide applicability that is easily automated. 4 In many drug discovery and development laboratories, routine compound purity testing is not performed due to throughput limitations of traditional analytical techniques.
Similarly, analytical throughput constraints limit availability of lipophilicity measurements early in the drug discovery process. Lipophilicity is often used as a predictor of the absorption, distribution, metabolism, and excretion (ADME) properties of a drug. The tendency for a compound to associate with a lipid-like environment is often determined as the logarithm of the octanol/water partition coefficient of a neutral molecule, or log
Another approach to characterizing lipophilicity is based on the chromatographic hydrophobicity index (CHI), a parameter for solvent strength that moderately correlates with log
Nanostream, Inc. offers an analytical system that enables 24 parallel reverse phase separations and variable wavelength UV absorbance detection. The Nanostream Veloce system (Figure 1), used in conjunction with 24-column Brio cartridges (Figure 2), provides a high-throughput format for chromatographic separations, thus enabling routine compound purity assessment and high-throughput determination of lipophilicity early in the drug discovery and development process.
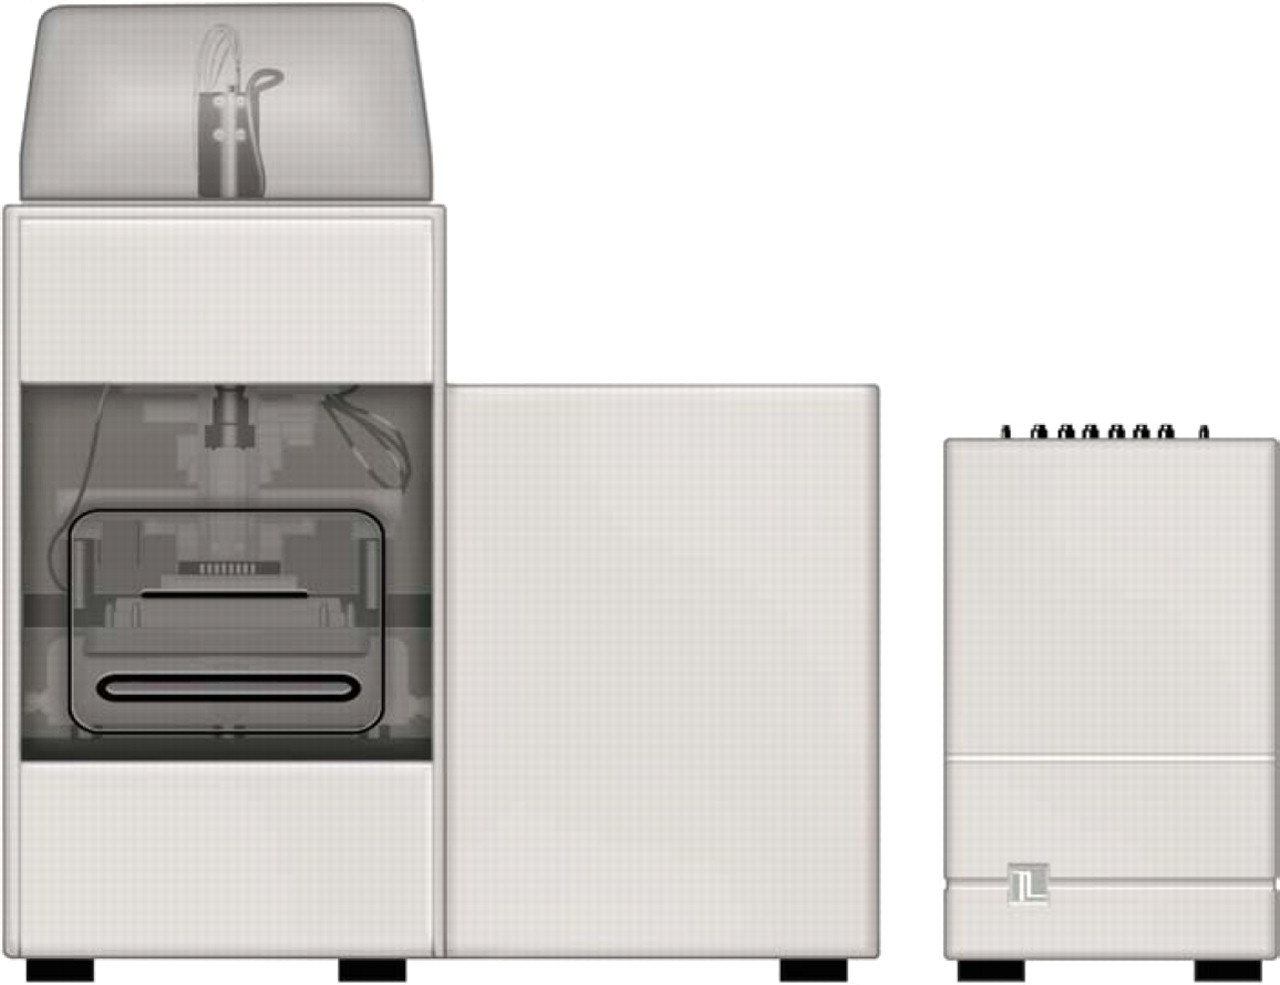
Nanostream Veloce system with 8-head auto-injector, individual dual-piston servo-controlled pumps and 24 UV absorbance detectors.
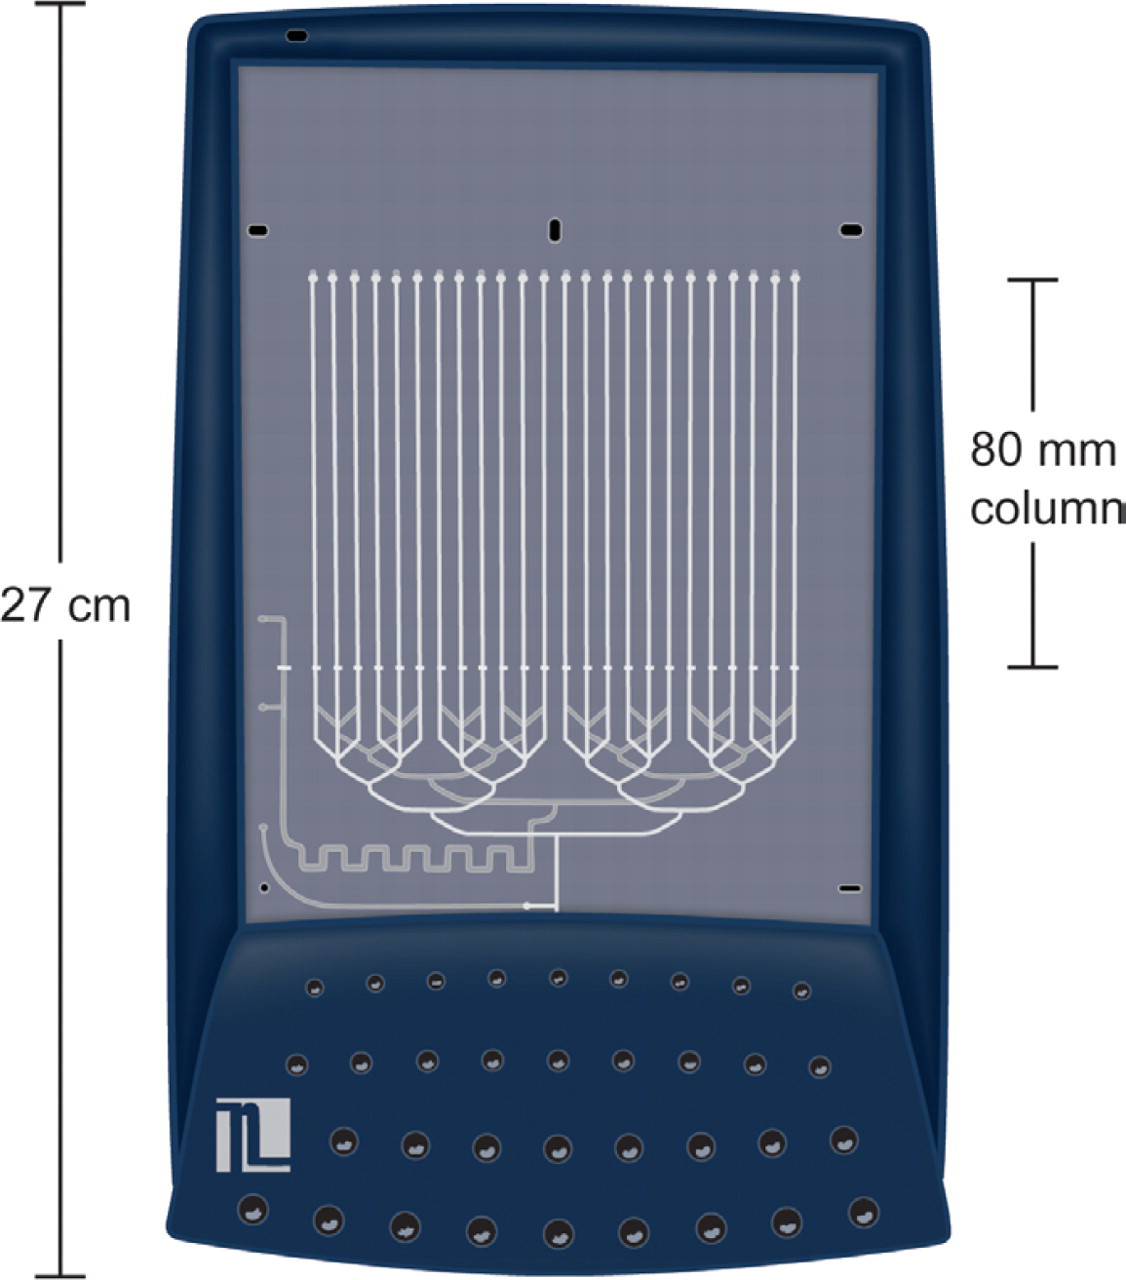
Nanostream Brio cartridge with 24 parallel, micro-fluidic LC columns.
Materials and methods
Equipment
Veloce system (Figure 1); Brio cartridge with 24 parallel columns (Figure 2); Stationary phase: C-18, 10 μm diameter particles with 100 A pores; Columns: 80×0.5 mm (i.d. equiv.); Injection Volume: 0.5 μL.
Compound Purity
Chromatograms were obtained for 1,000 compounds using the Veloce system. Compounds were obtained from small molecule compound libraries of several partner companies. Prior to each ten-minute cycle, 24 samples were transferred from wells of a microtiter plate to individual injection reservoirs on a cartridge. Reverse phase chromatograms were obtained and absorbance was reported based on UV detection at 214 nm. The purity of each sample was then determined by calculating the primary peak area as a percentage of total peak area.
Mobile phase: A: water: acetonitrile (95:5) with 0.1% formic acid; B: acetonitrile with 0.1% formic acid; Detection: UV 214 nm; Sample Size: 0.5 mg/mL; Gradient: 10:25:90% B, 0 0.5 min. 10 25% B, 0.5 5.5 min. 25 90% B, 5.5 7.0 min. 90% B, 7.0 10 min. 90 10% B; Run Time: 10 minutes.
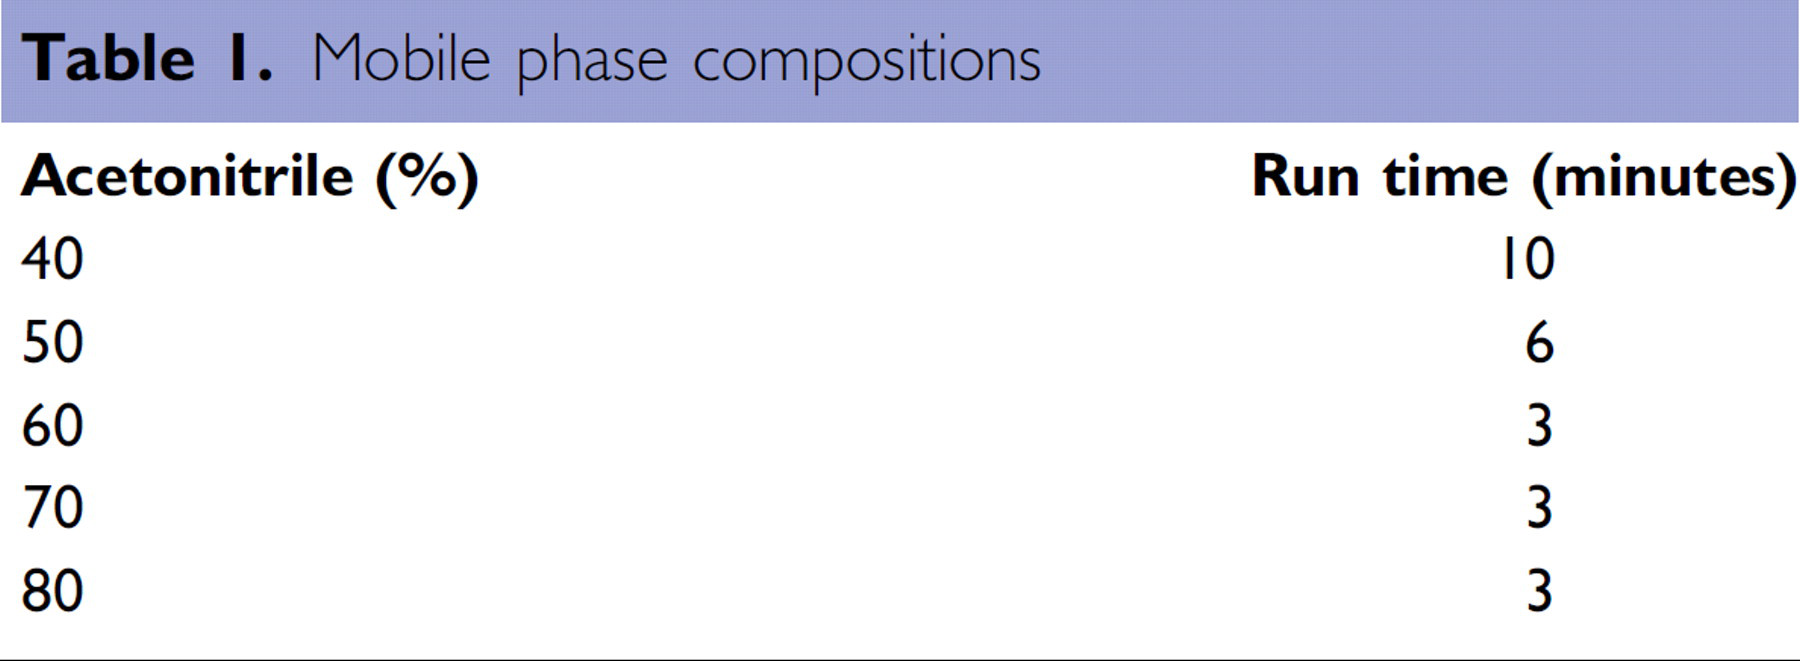
Mobile phase compositions
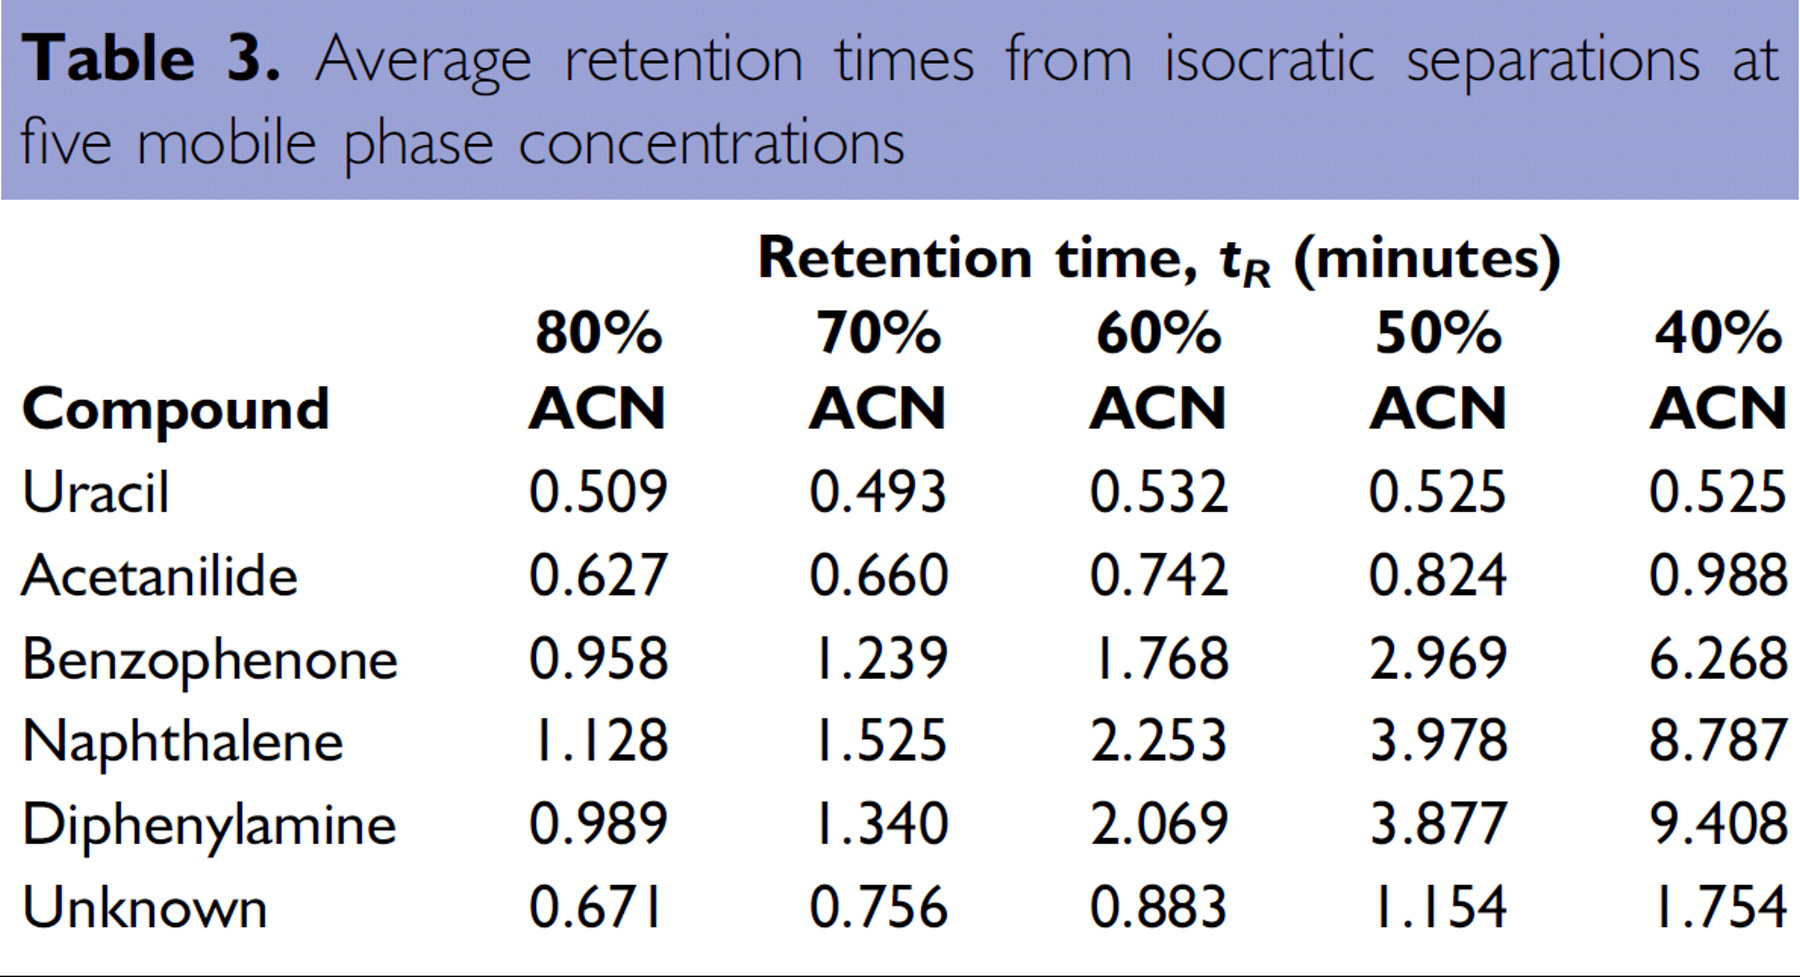
Ten columns were used to analyze all compounds in duplicate. Uracil, which eluted in the void volume, provided the retention time corresponding to
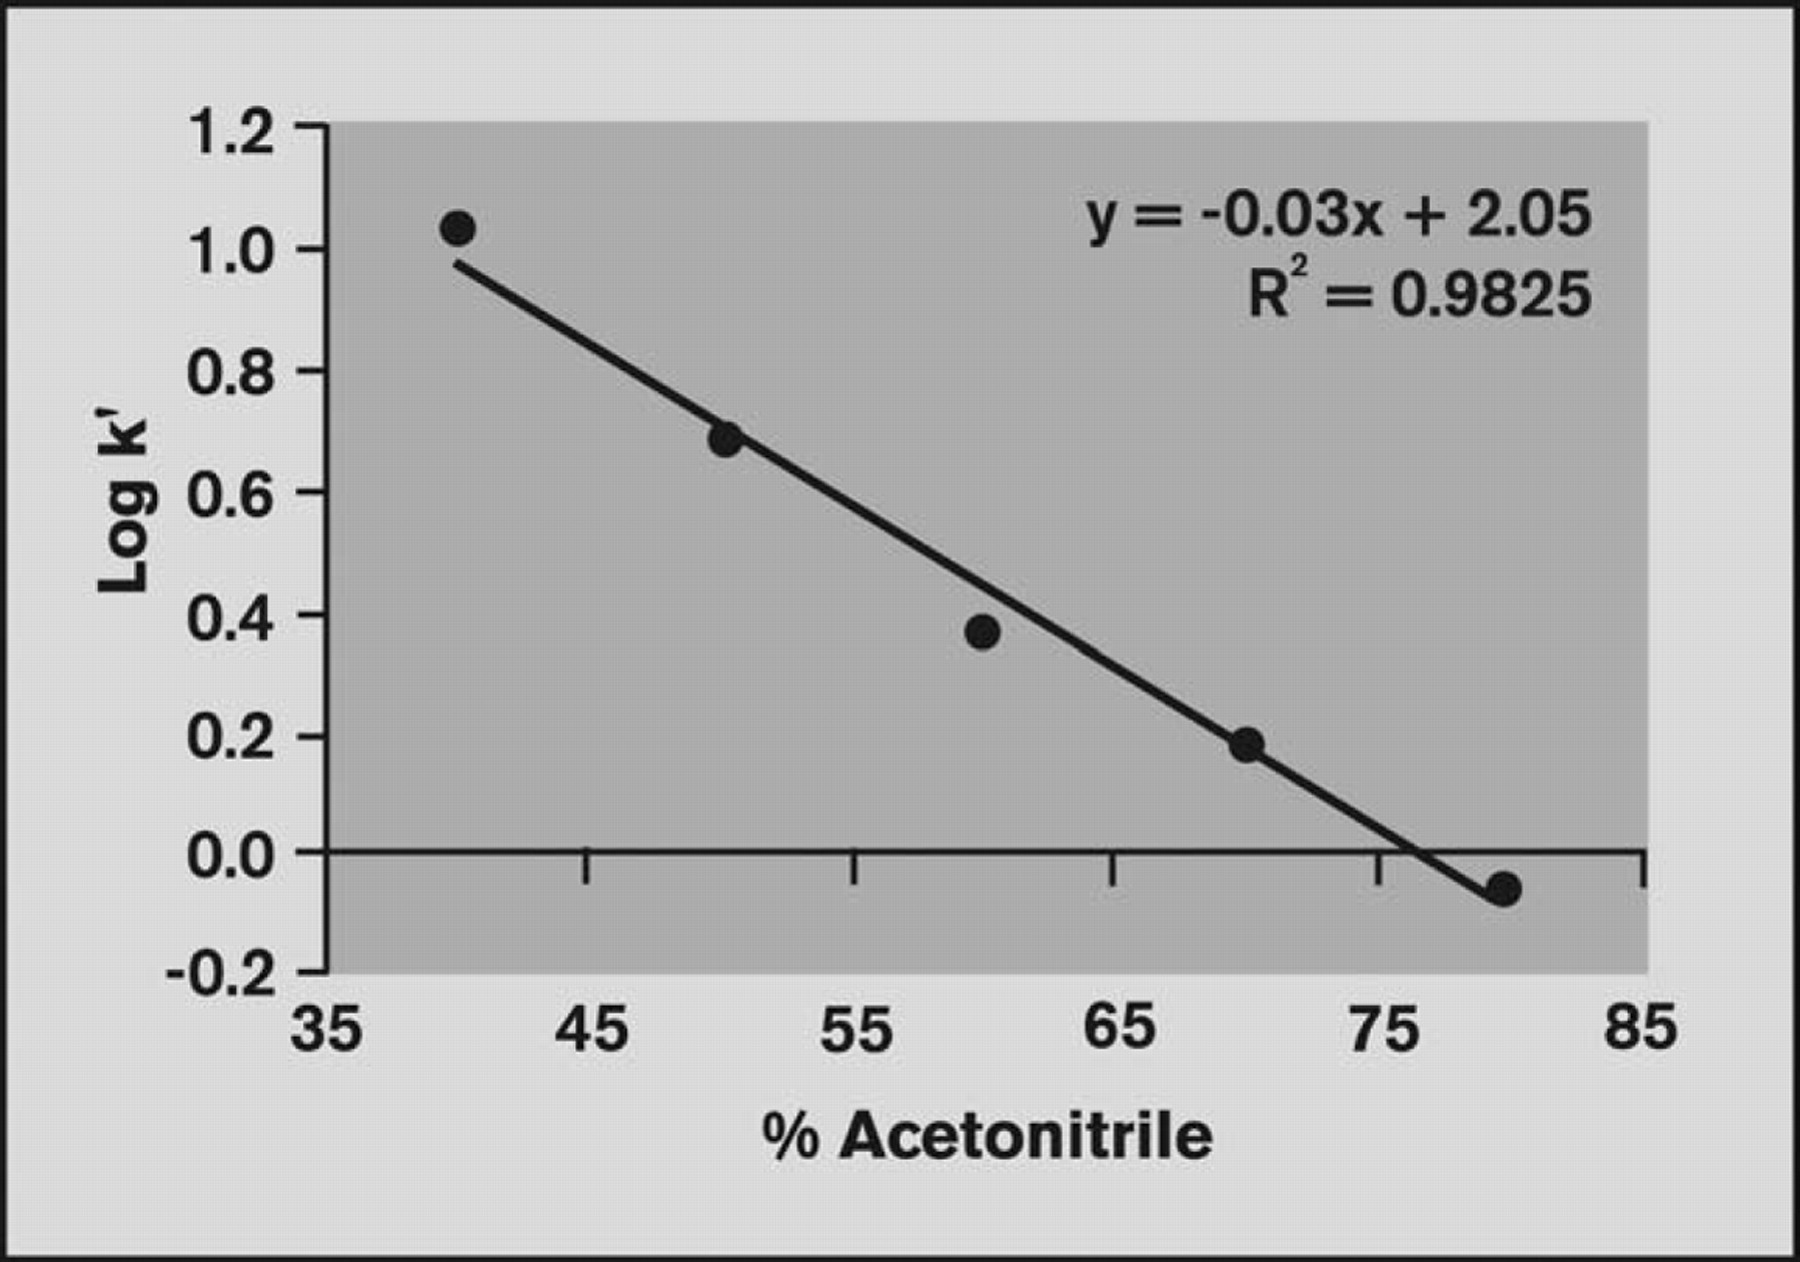
Values for the log of the capacity factor,
Sample Size: 100 μg/mL in 50:50 (v/v) mobile phases A and B; Flow Rate: 15 μL/min; Mobile phase: A: 50 mM ammonium acetate, pH 7.0; B: 100% acetonitrile (ACN); Detection: UV 254 nm.
Chi
A single Brio cartridge was used to generate a standard curve for compounds with known CHI values. Chromatograms were obtained for seven reference compounds (5-phenyl-tetrazole, benzimidazole, colchicine, indole, propiophenone, butyrophenone, and valerophenone). Three columns were used to analyze the reference compound mixture in triplicate, and seven columns were used to analyze each individual compound to determine its retention time. The remaining 14 columns were available for analysis of unknown samples. A standard curve was obtained by plotting the published CHI value against the retention times of the reference compounds. CHI values for the unknown compound were determined using the standard curve.
Mobile phase: A: 50 mM ammonium acetate, pH 7.0; B: 100% acetonitrile (ACN); Detection: UV 254 nm; Flow Rate: 15 μL/min; Sample Size: 125 μg/mL (per component) in 50:50 (v/v) mobile phase A and B; Gradient: 10:90% B, 0–6.5 min. 10–90% B, 6.5–7.0 min. 90% B, 7.0–10.0 min. 10% B.
Comparison to HPLC
For comparison, the procedures were repeated using a conventional HPLC instrument (Shimadzu VP) with a 50 × 4.6 mm (i.d.) column packed with 5 μm C18 stationary phase under the same conditions but with a higher flow rate (0.5 mL/min) and larger sample injection volumes (2.5 μL).
Results and discussion
Compound Purity
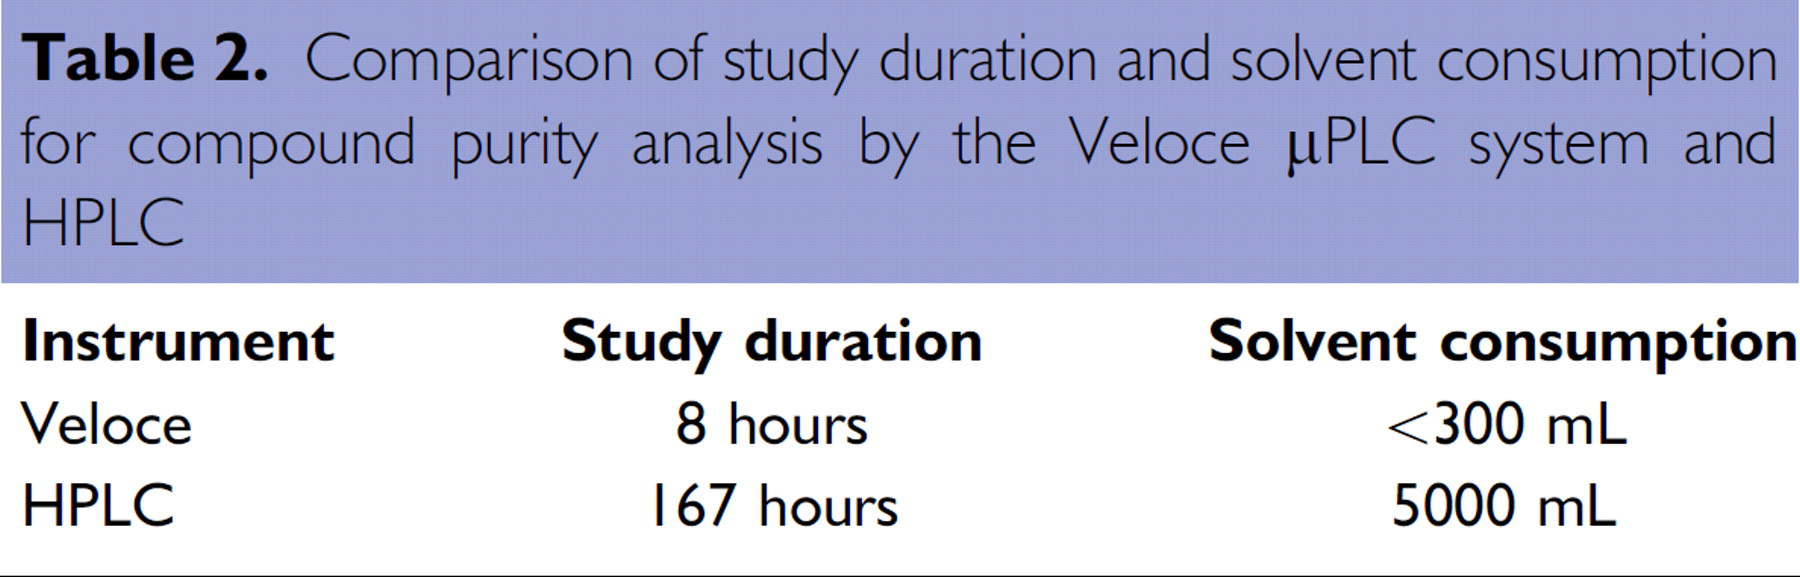
The Veloce system enabled analysis of 1,000 samples within 8 hours, consuming less than 300 mL of mobile phase over the course of the study compared to 167 hours and 5,000 mL of mobile phase (flow rate 0.5 mL/min) using conventional HPLC (Table 2, Figure 3).
Comparison of study duration and solvent consumption for compound purity analysis by the Veloce μPLC system and HPLC
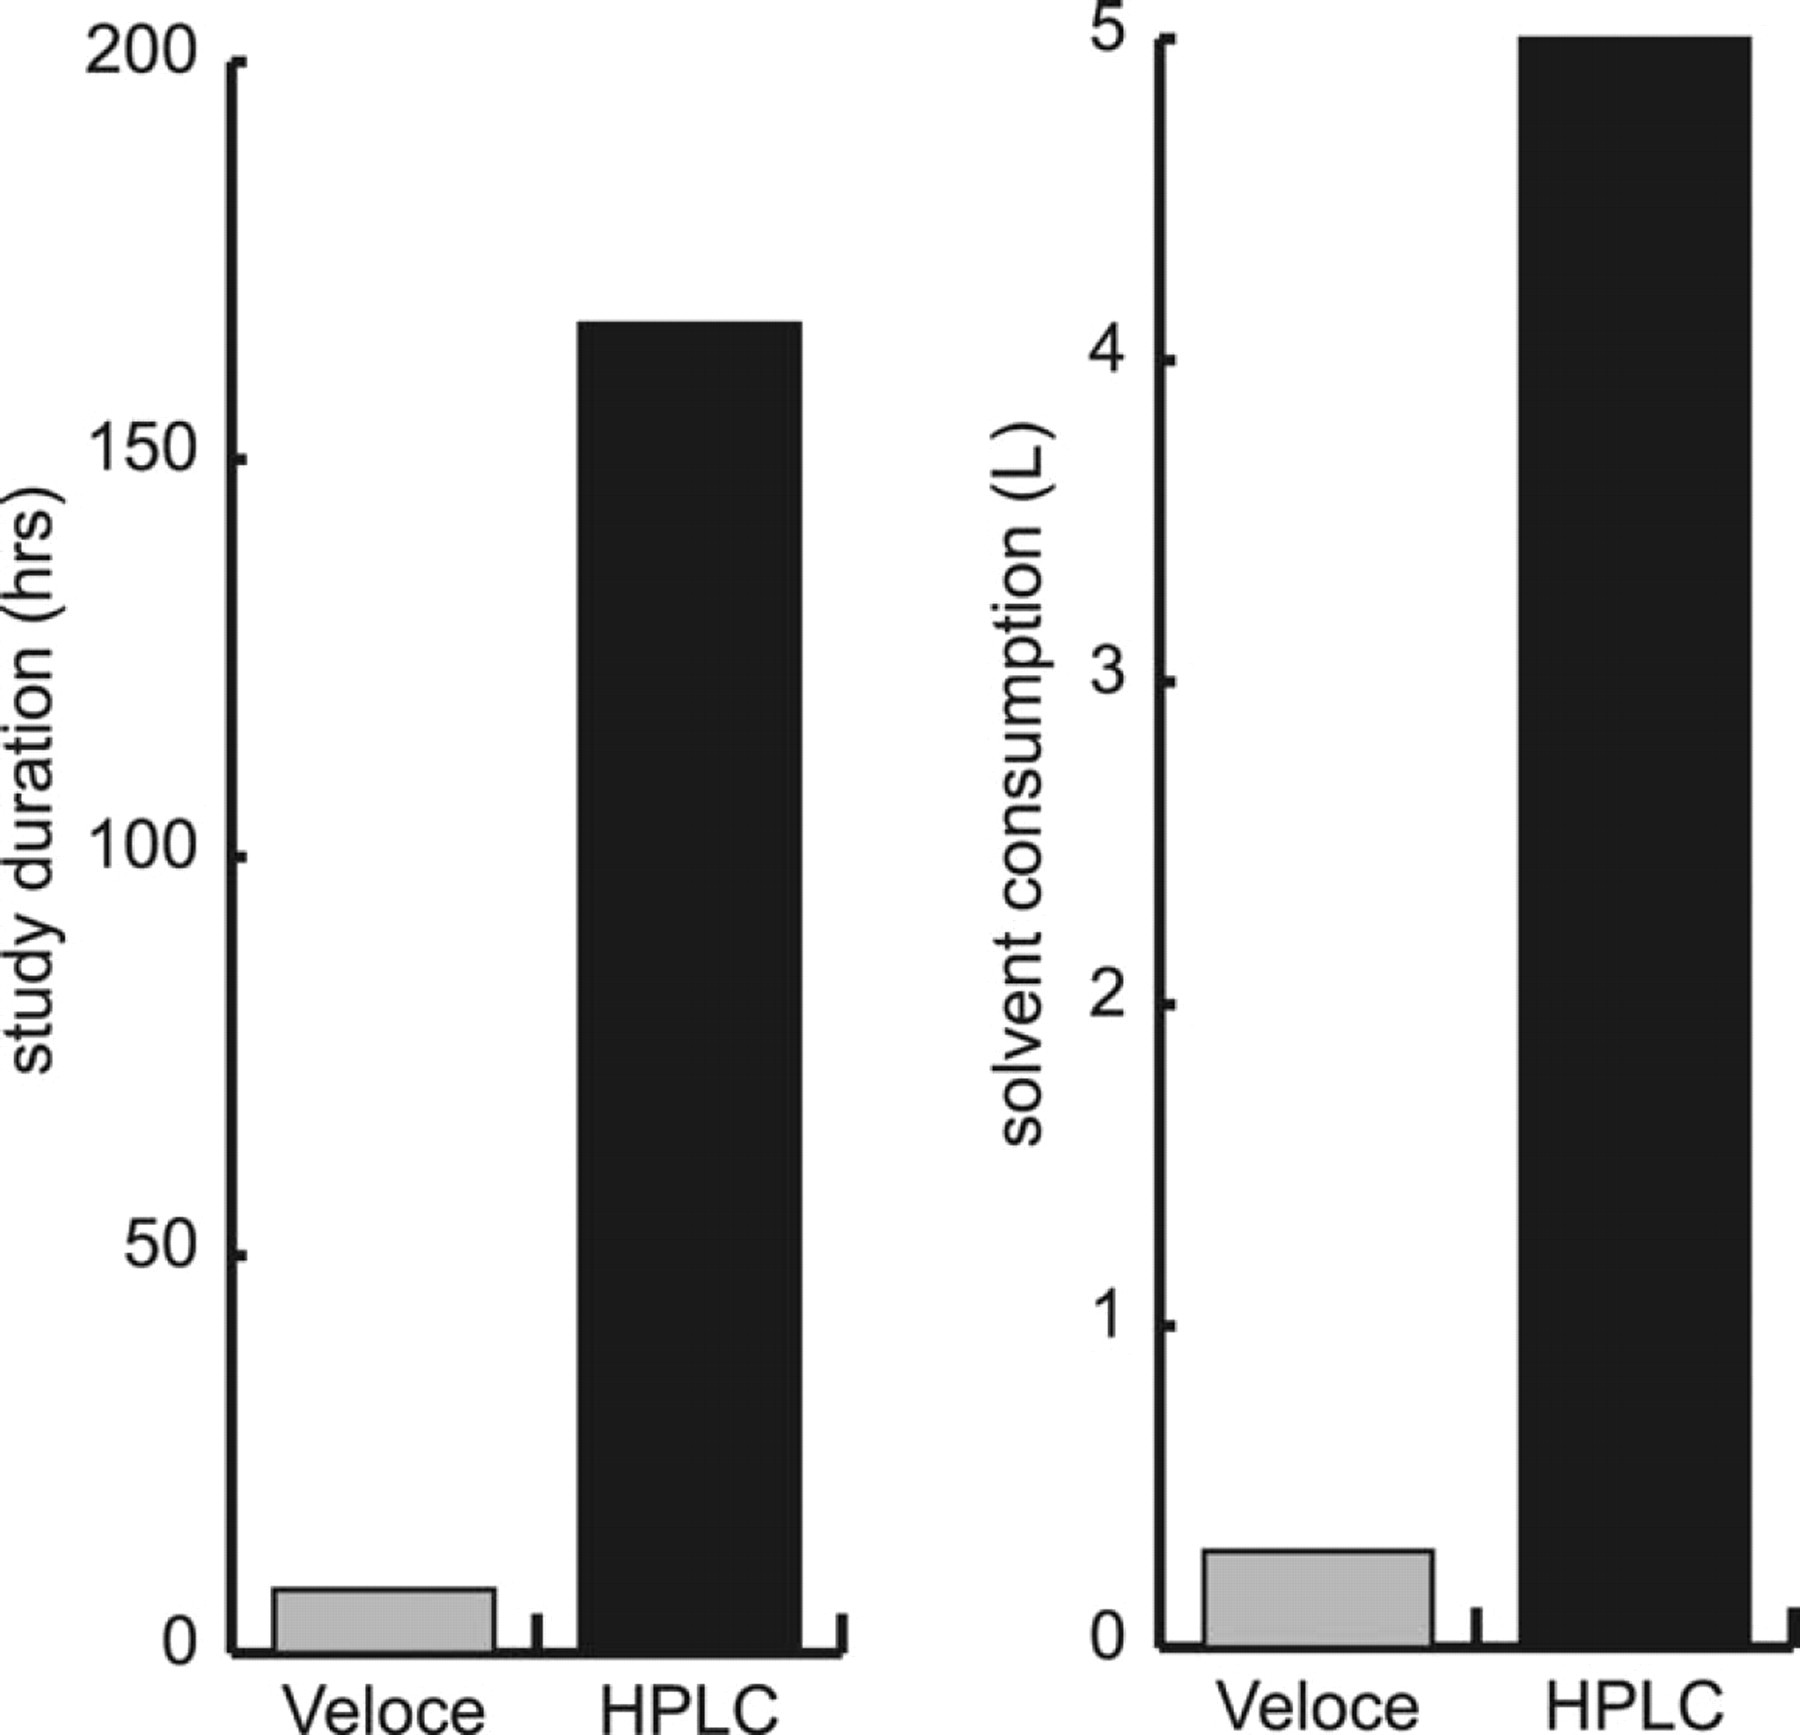
Comparison of study duration and solvent consumption for compound purity analysis by Veloce μPLC system and HPLC.
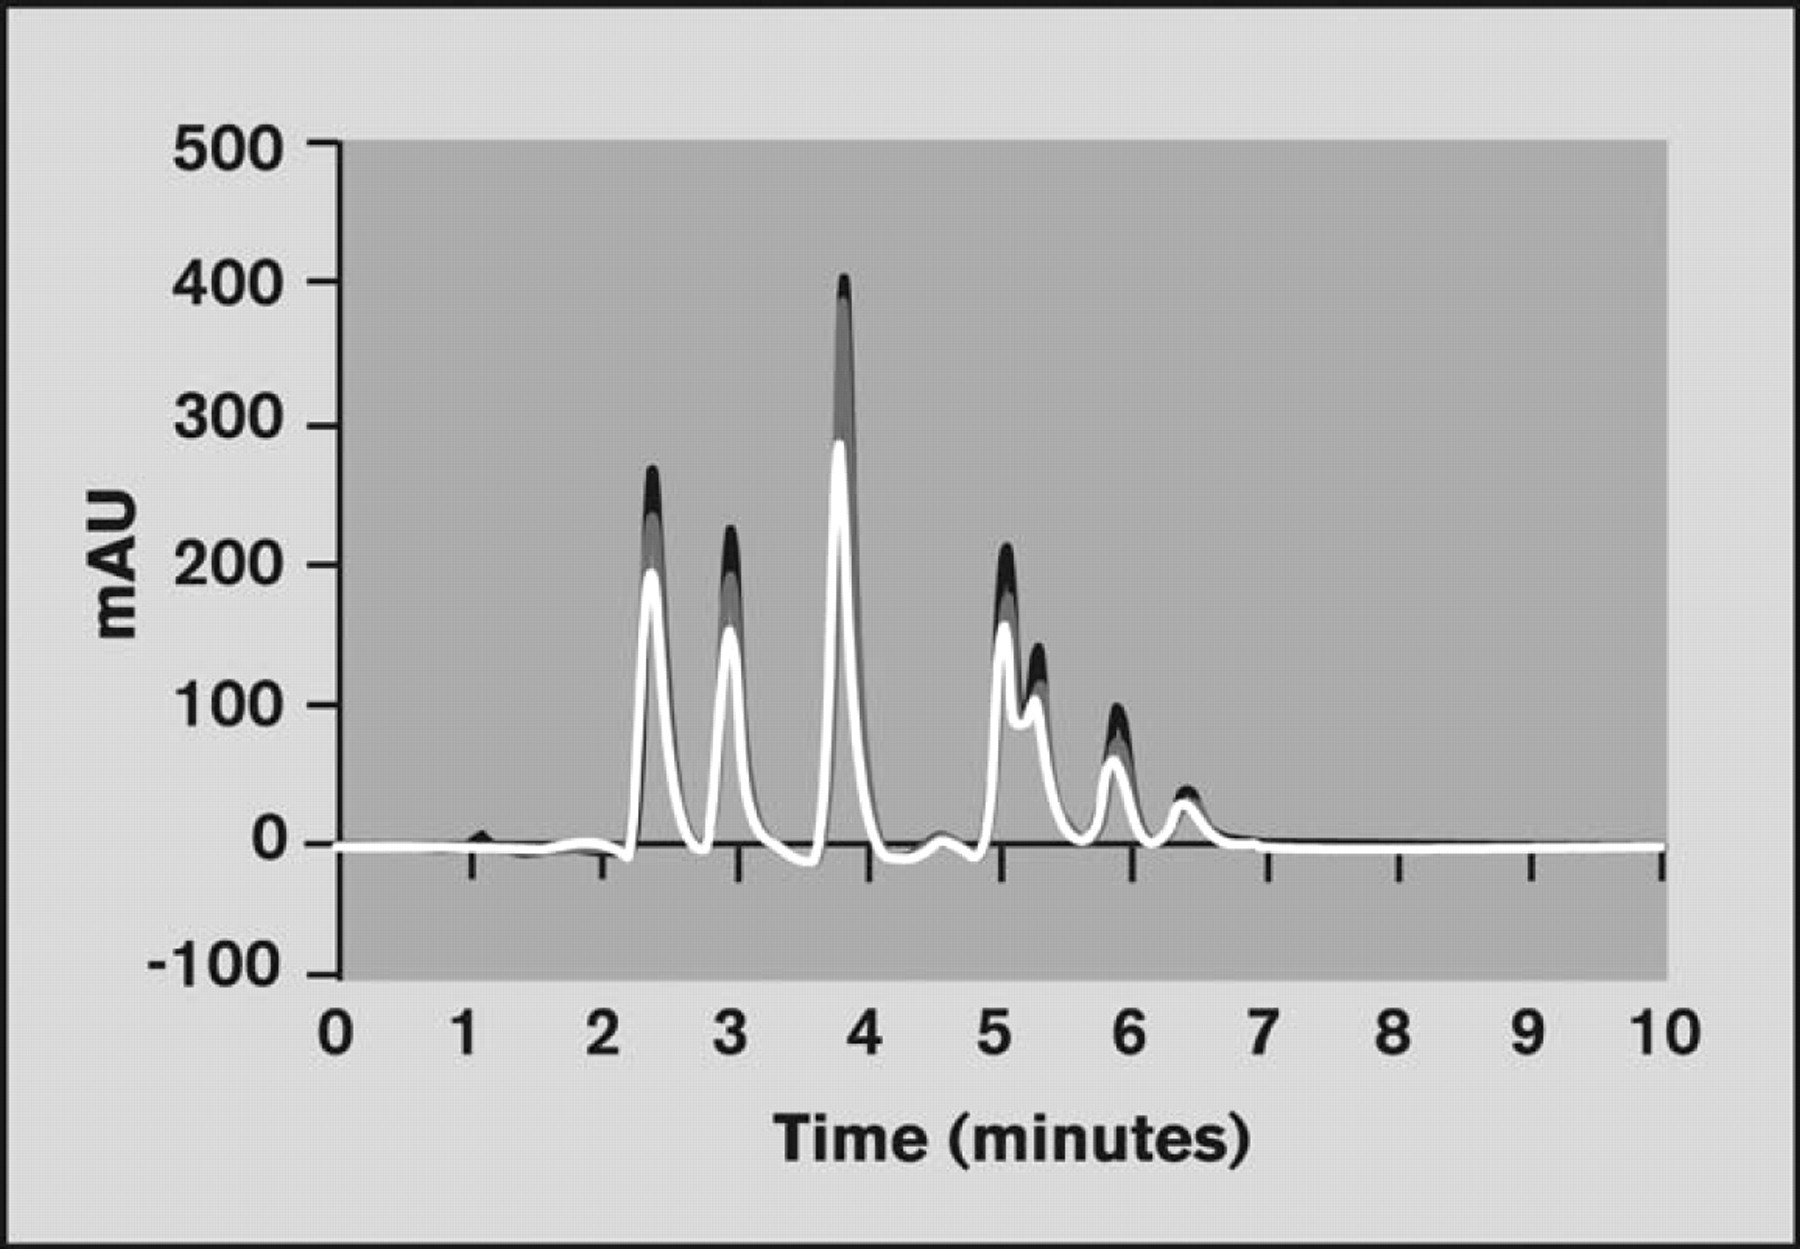
The chromatograms generated using the Veloce system showed excellent correlation to results obtained from conventional LC instrumentation (Figures 4 and 5).
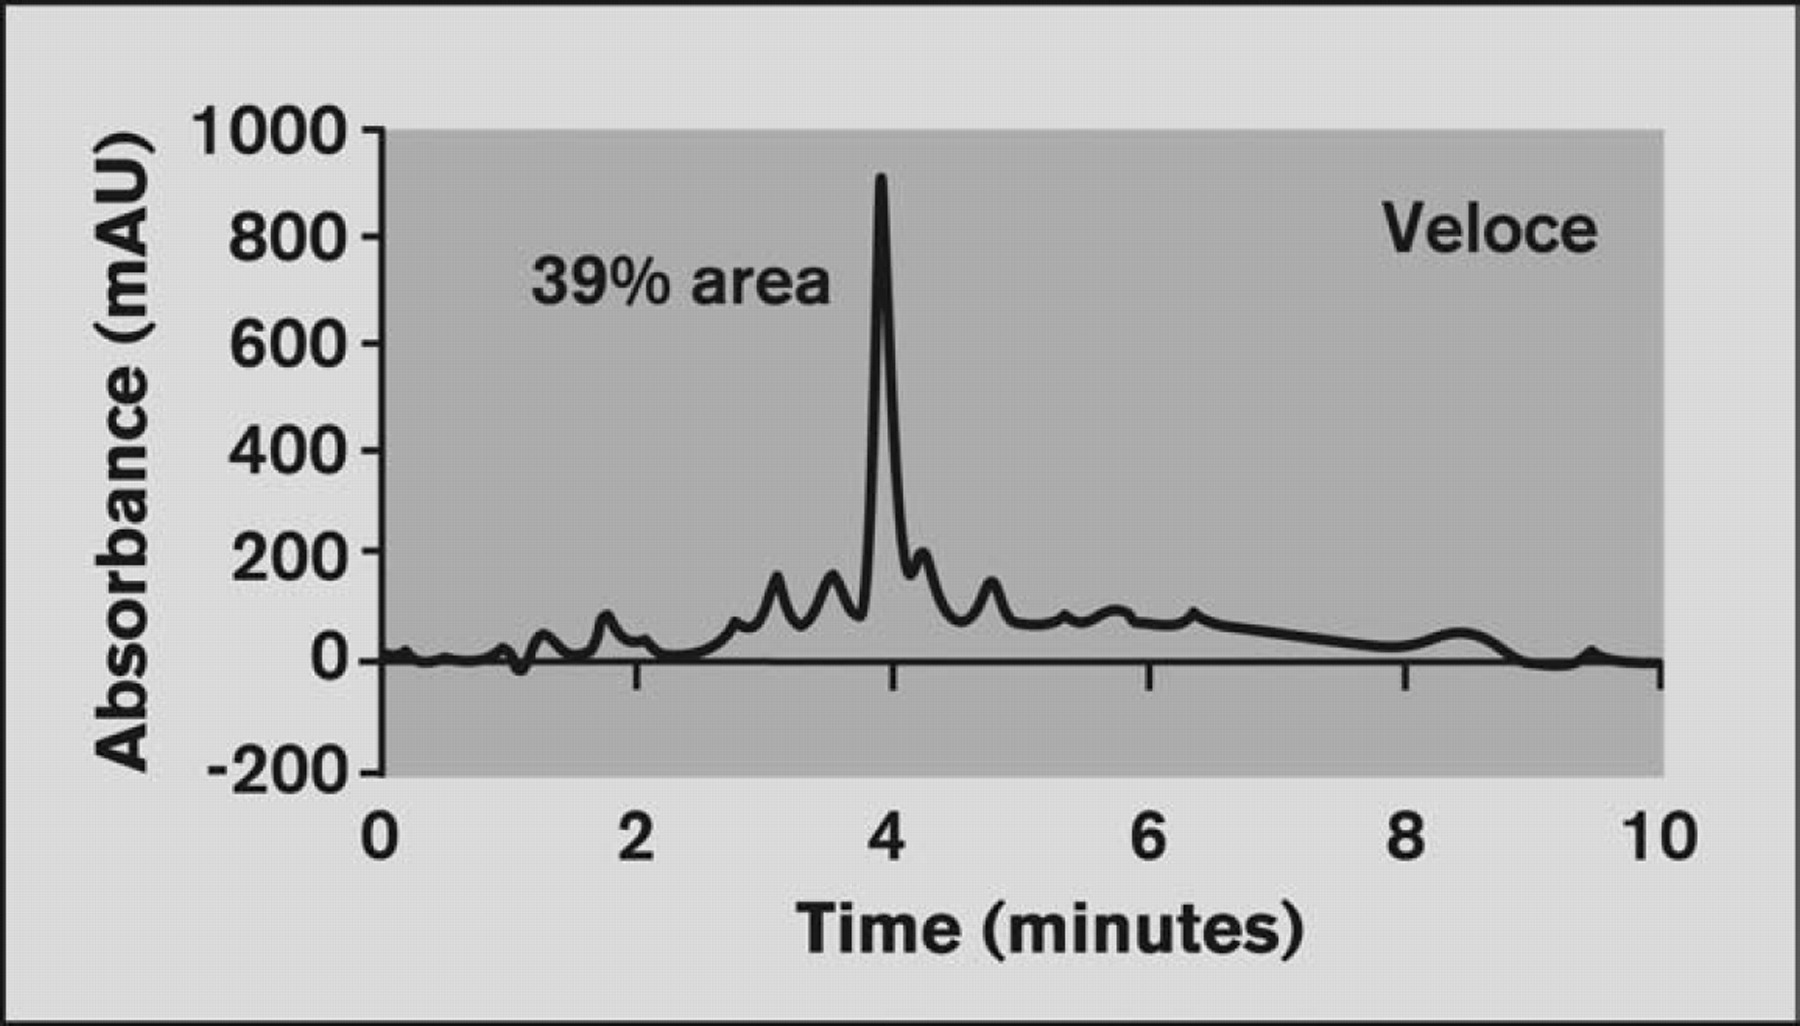
Chromatogram of sample RX08–13592 from the Veloce system with baseline corrected. Injection volume = 0.5 μL; Gradient=10:25:90 acetonitrile; Flow rate=12.5 μL/min; Column = C18, 10 μm, 80 × 0.5 mm.
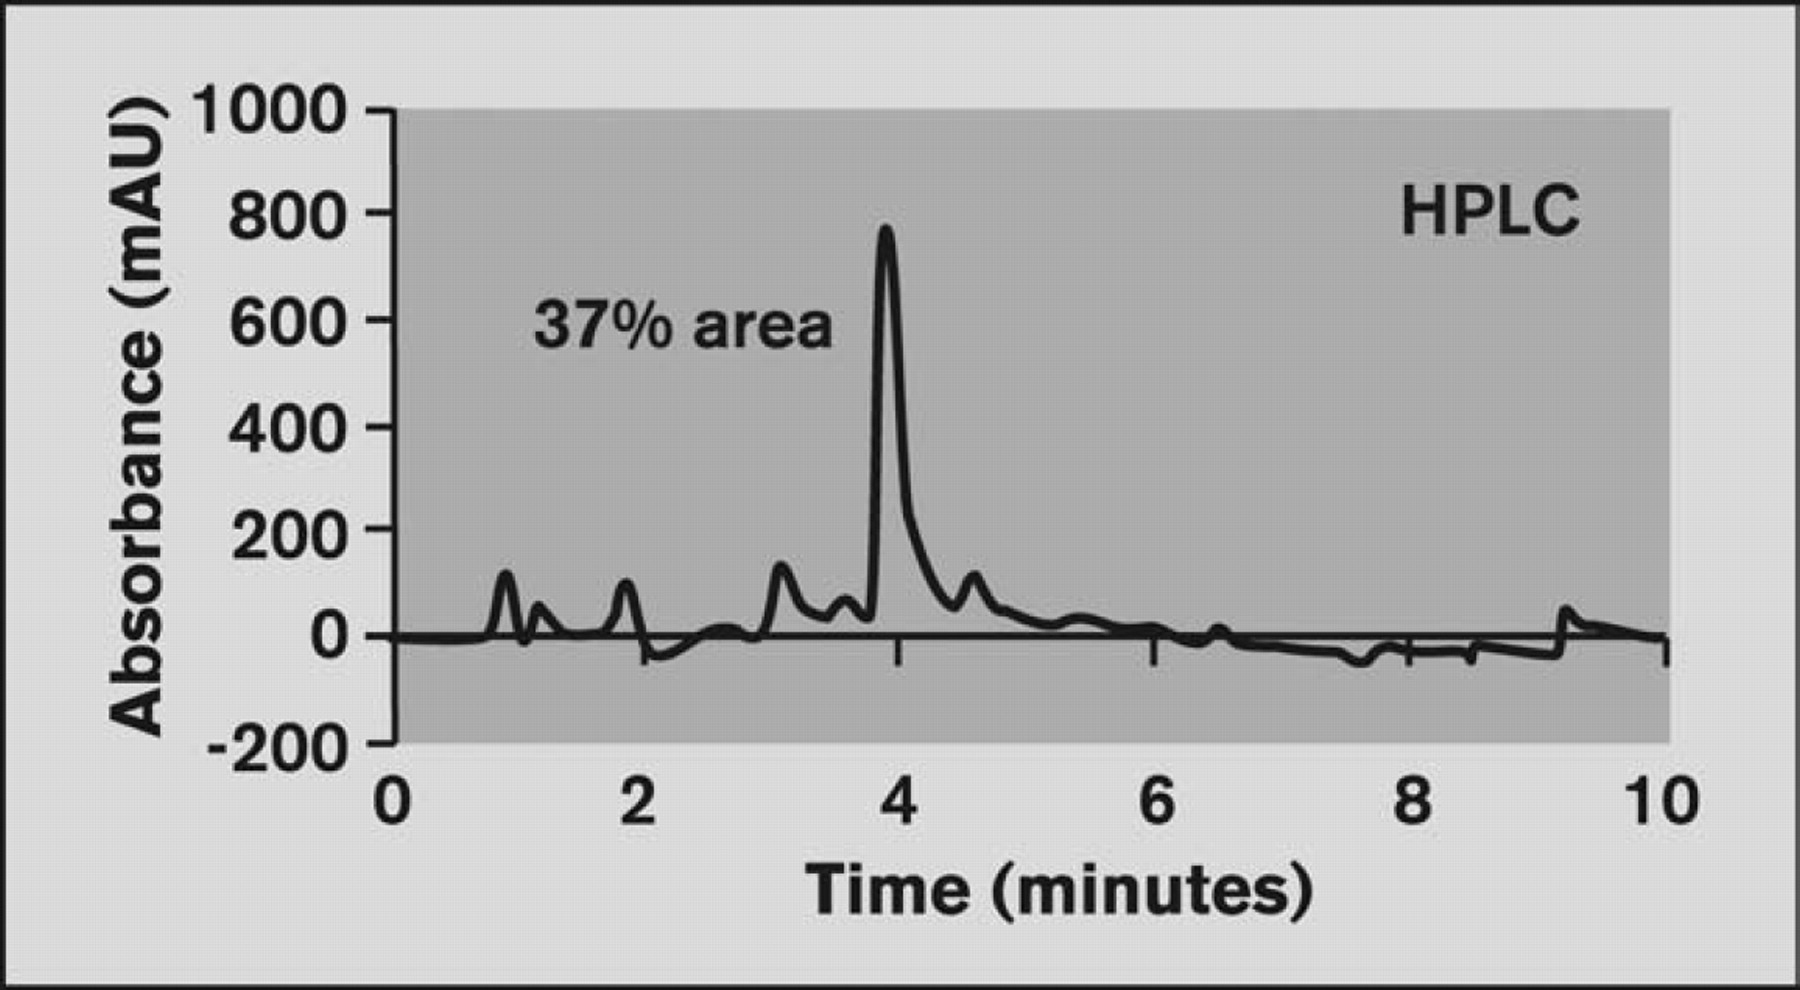
Chromatogram of sample RX08–13592 from HPLC with baseline corrected. Injection volume = 2.5 μL; Gradient=10:20:90 acetonitrile; Flow rate = 500 μL/min; Column = C18, 5 μm, 50 × 4.6 mm.
Percent purity results from the Veloce system were in good agreement with results from HPLC, within experimental error. Figure 6 shows results for primary peak area for 384 samples analyzed by both the Veloce system and HPLC using comparable settings. In this data set, the average deviation between the two values was 5%.
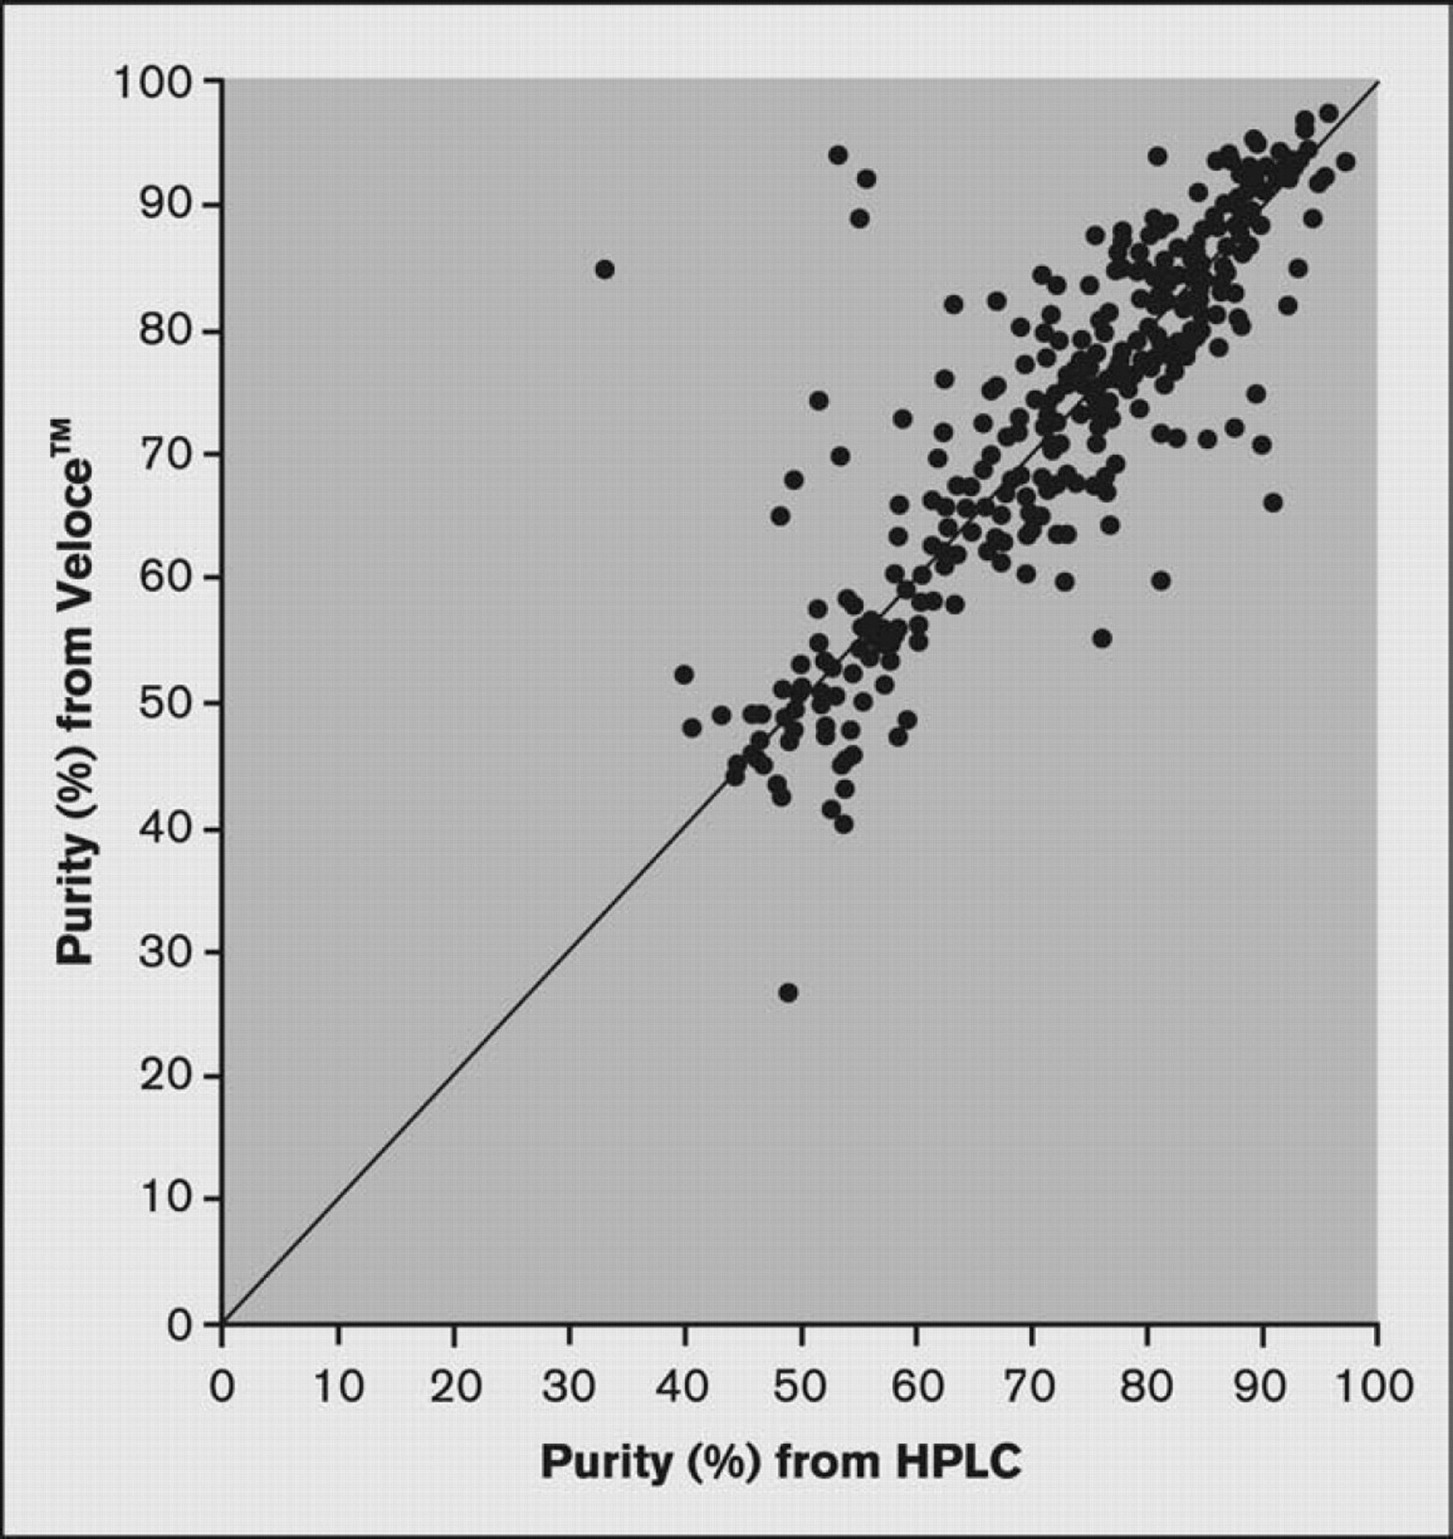
Comparison of primary peak area results for 384 samples analyzed using the Veloce system and HPLC. The primary peak purity (%) obtained using conventional HPLC and the Veloce system differed by an average of 5%.
Average retention times from isocratic separations at five mobile phase concentrations
Log
Log
Log
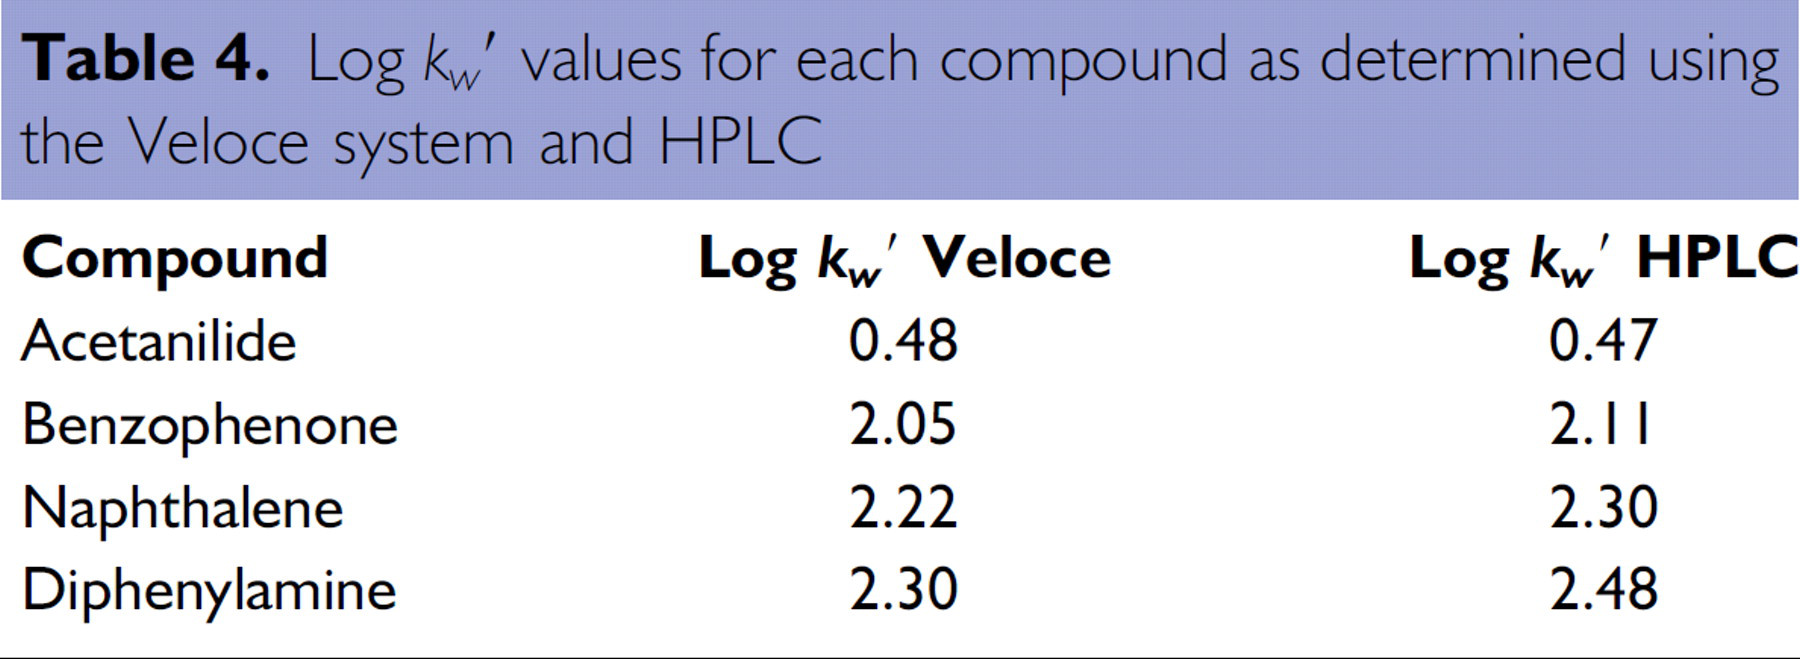
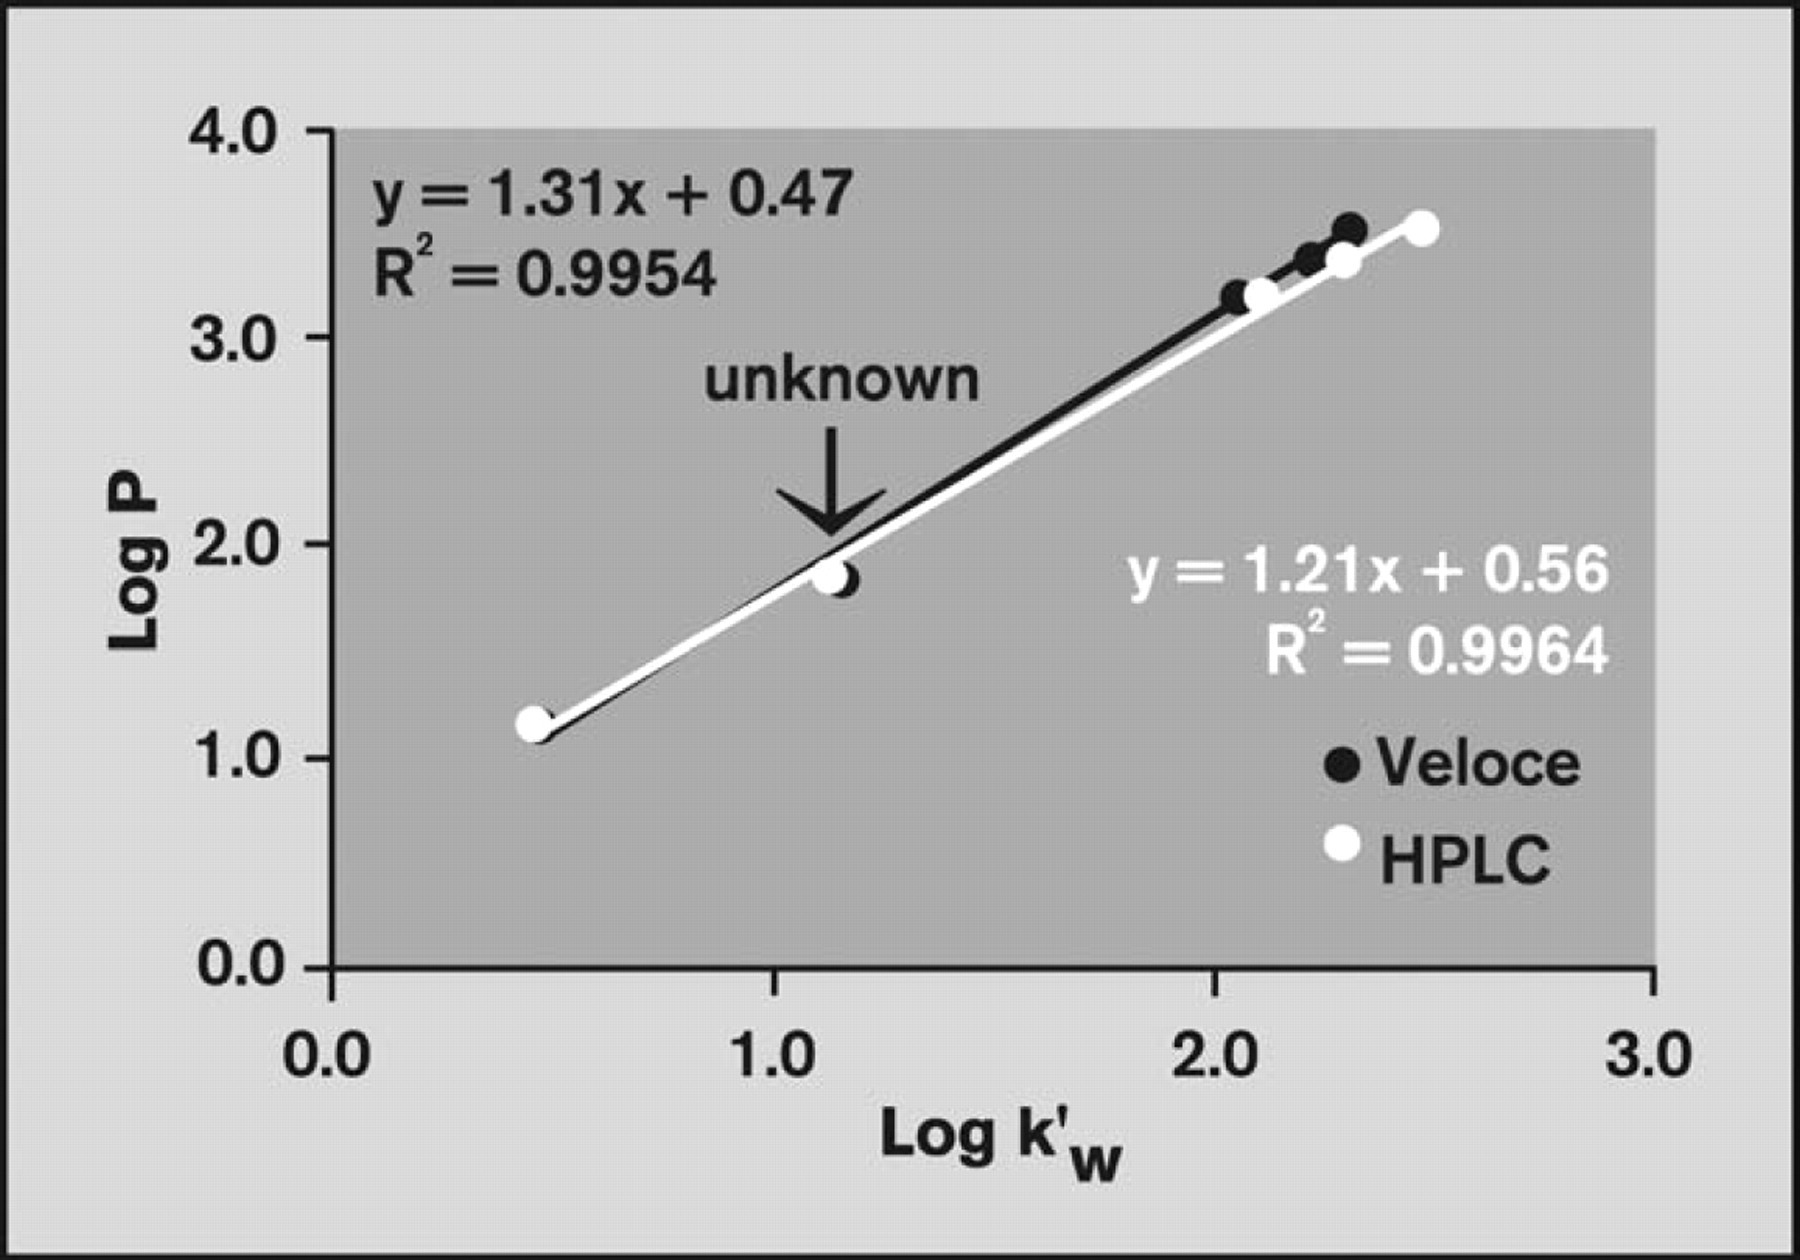
Comparison of log
The curves were then used to predict log
Comparison of log
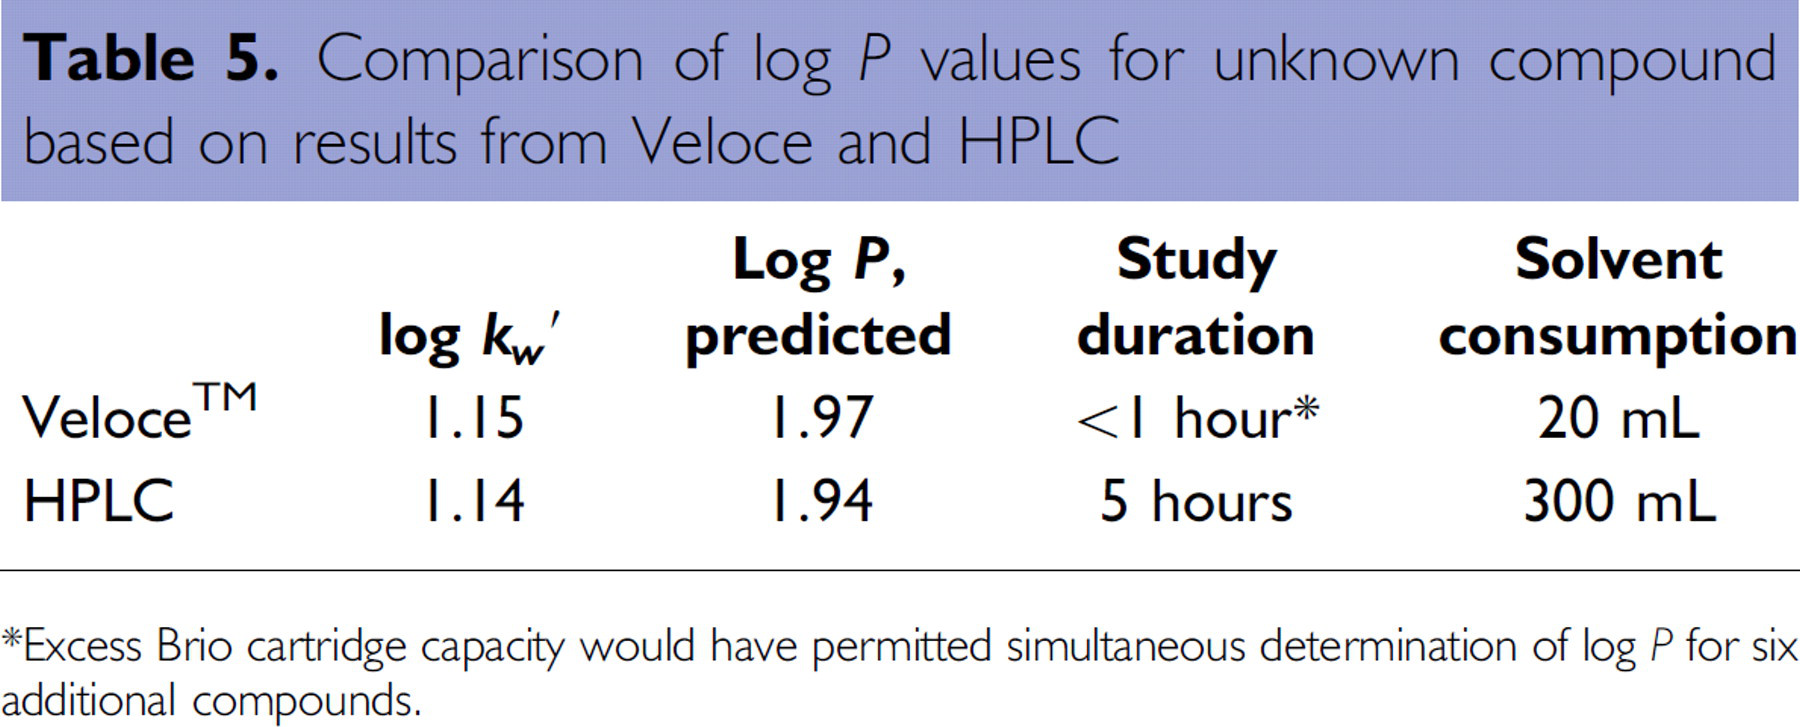
Excess Brio cartridge capacity would have permitted simultaneous determination of log
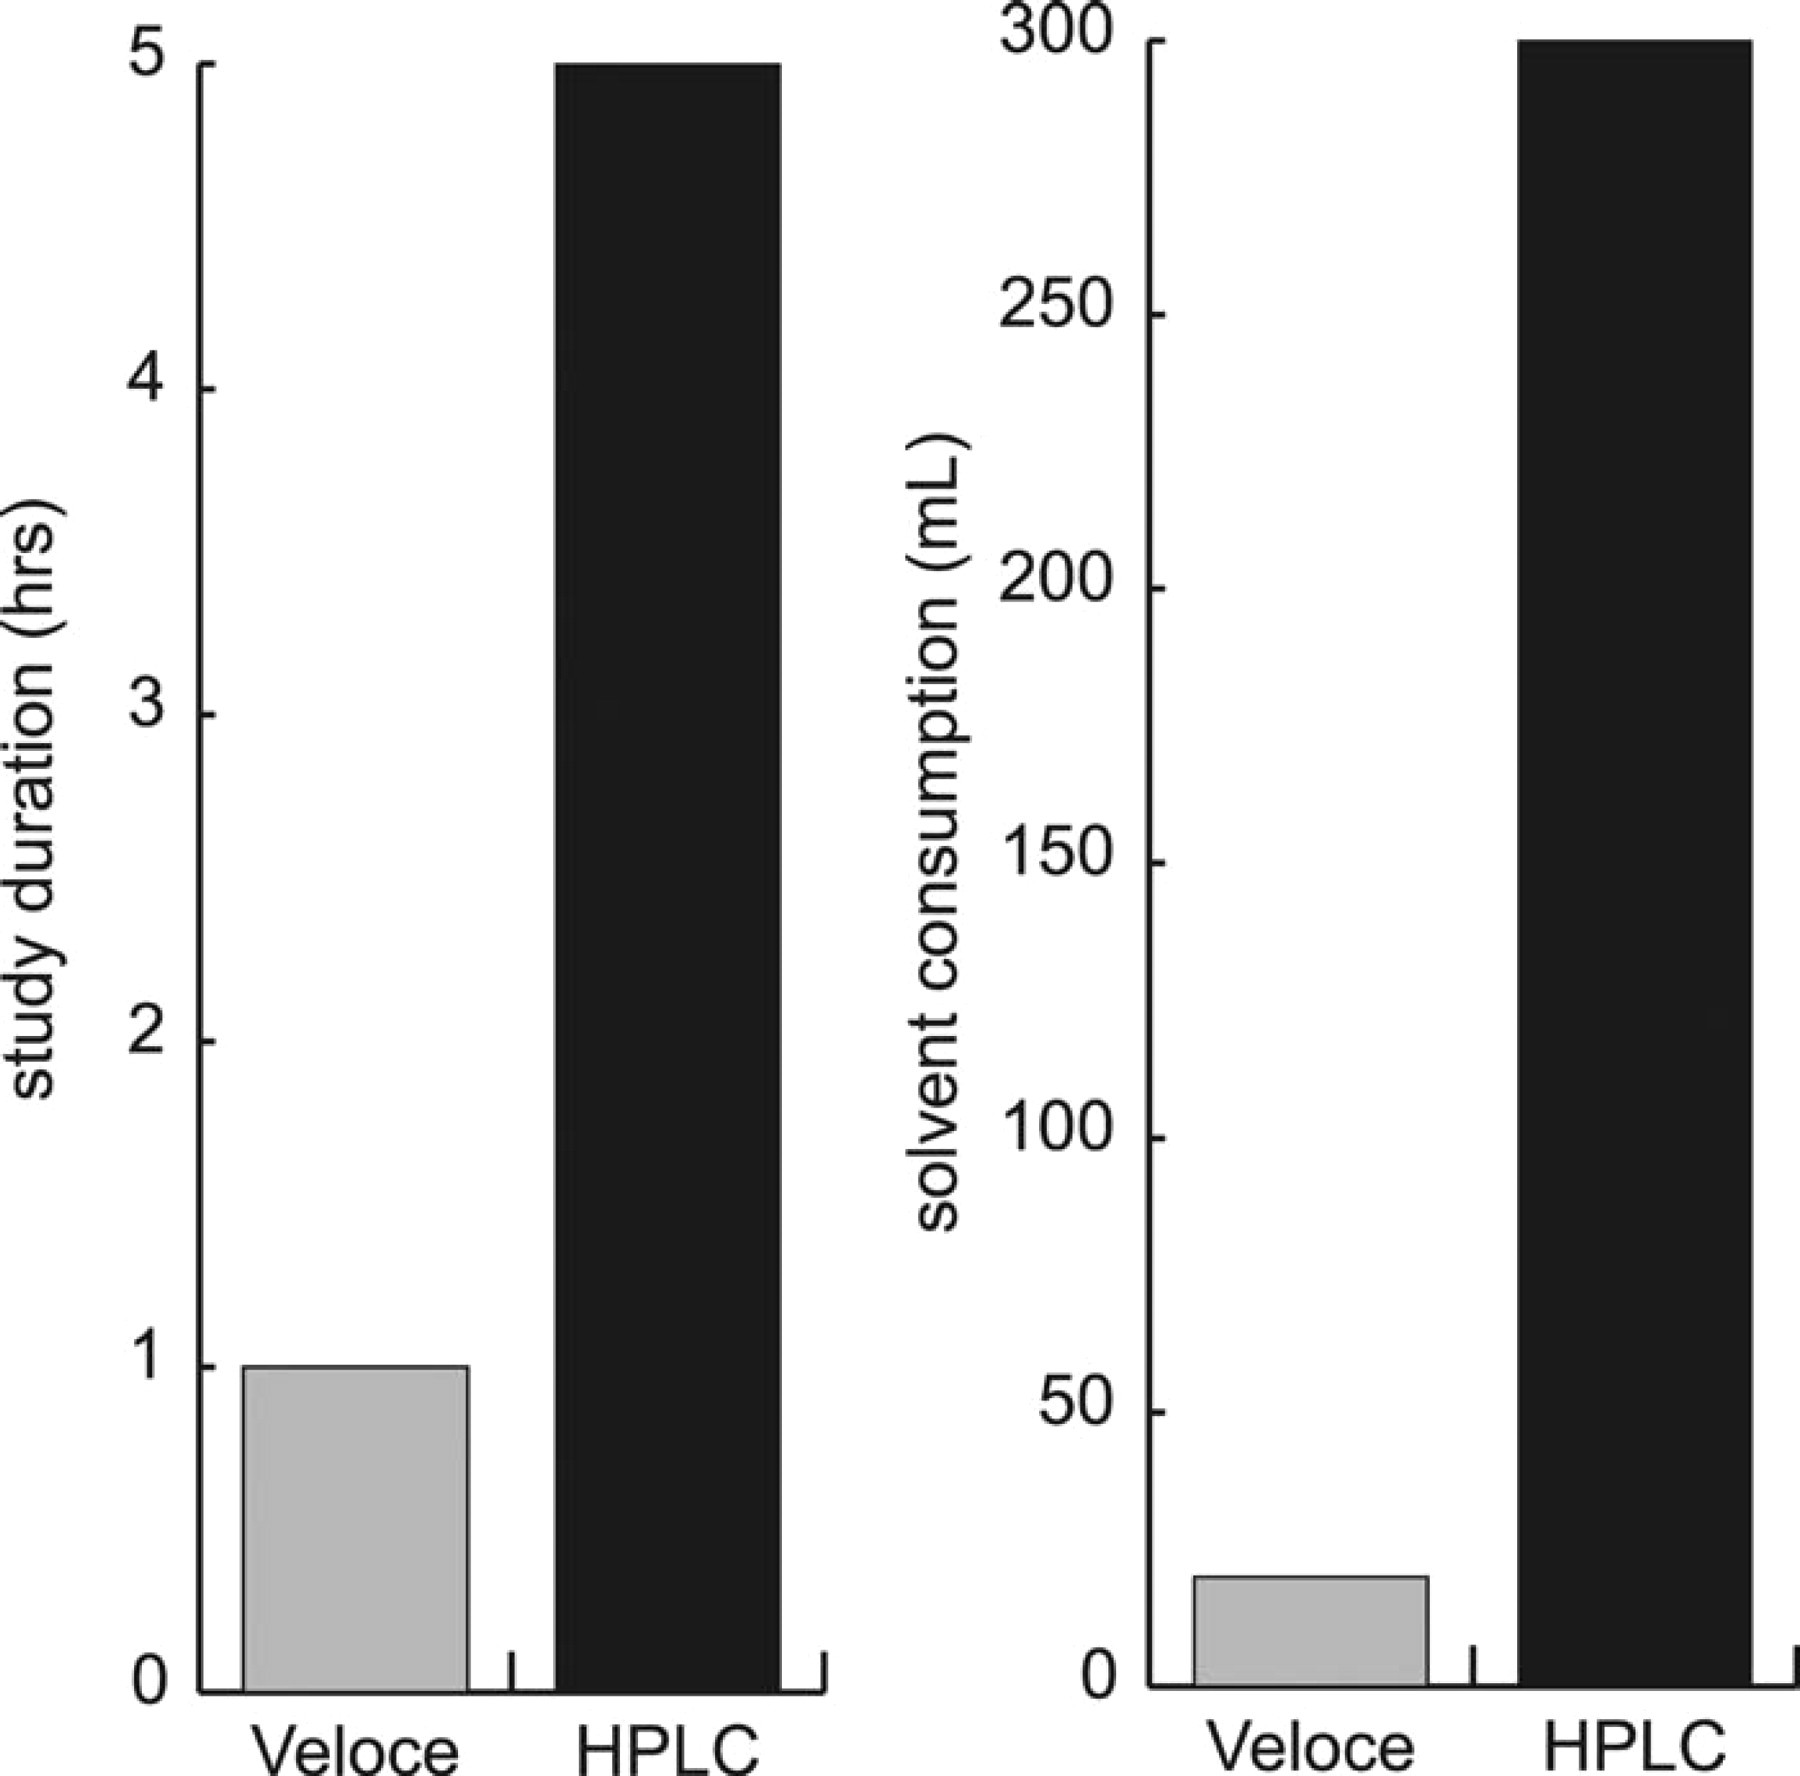
Comparison of study duration and solvent consumption for log
Chi
Retention times for the reference compounds were determined from the chromatograms obtained for the standard mixture (Figure 10).
An overlay of chromatograms obtained using the Veloce system. Three replicates of the reference compound mixture were simultaneously analyzed on a Brio cartridge.
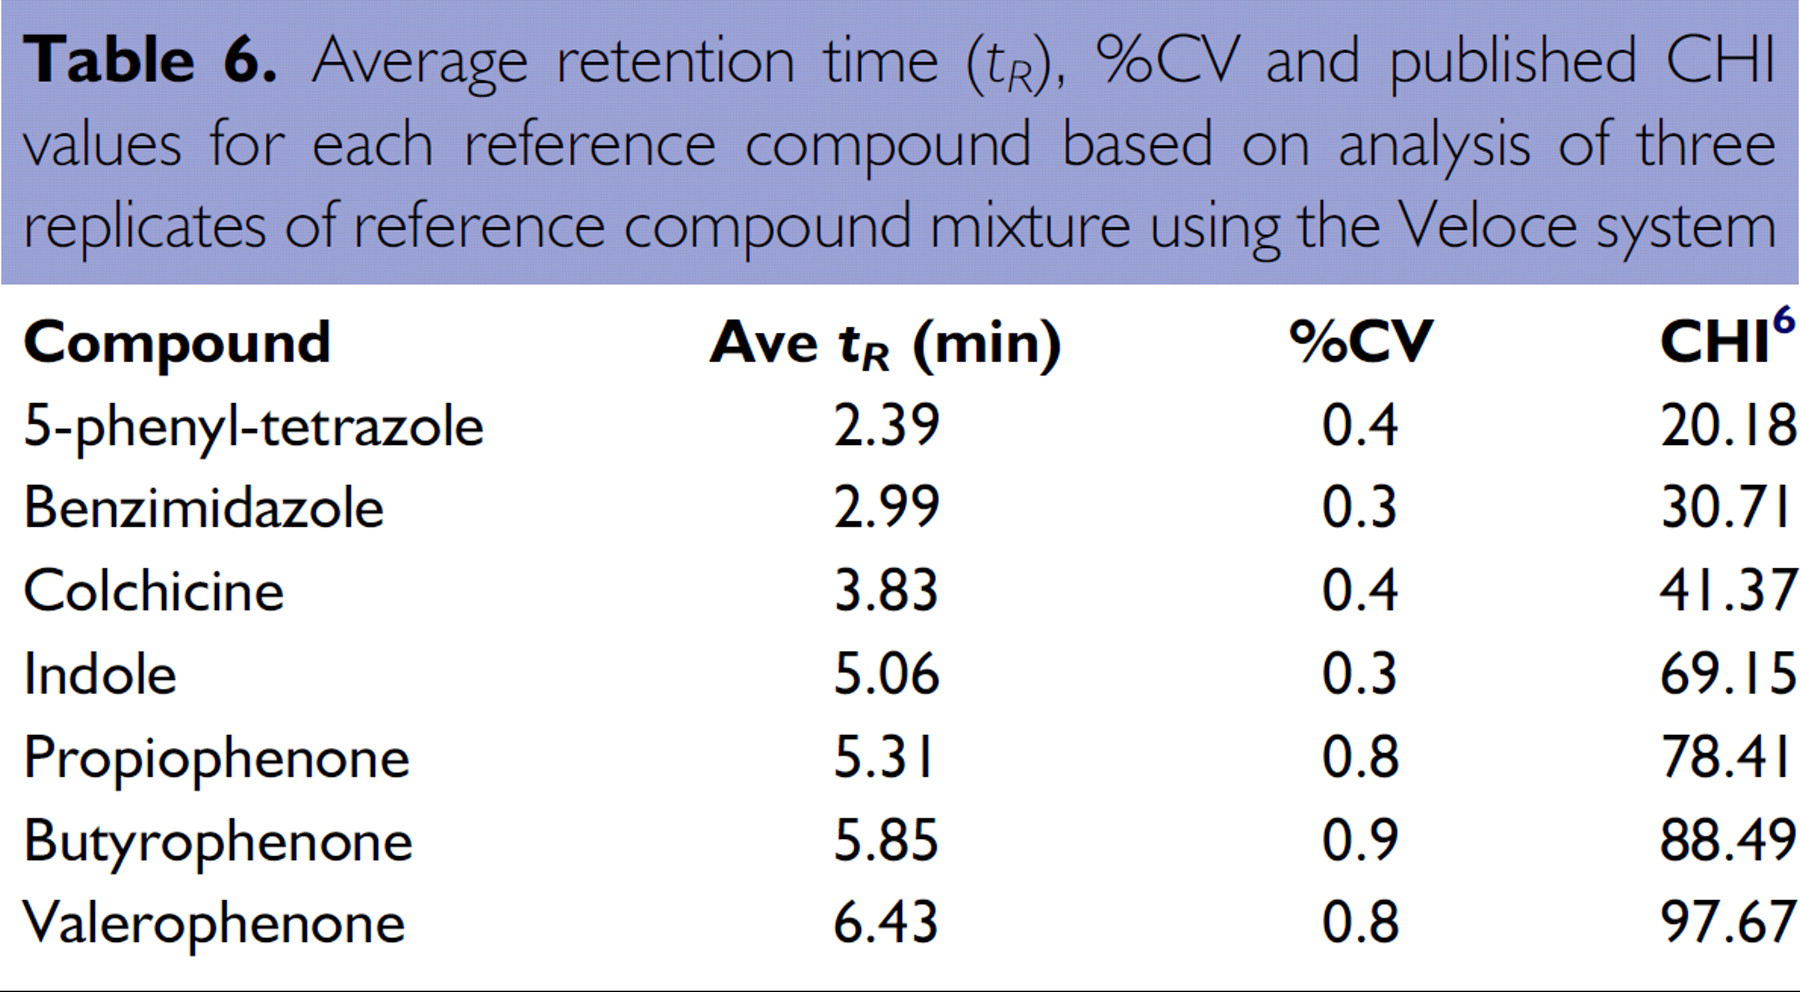
The average retention time (
Average retention time (
The low values of the coefficient of variation (%CV) indicate that the retention time measurements were very reproducible and did not depend on which column was used.
A curve was generated by plotting the published CHI values against the average retention times for the seven compounds. The curve was compared to results obtained by conventional HPLC instrumentation. Note that the increased sample analysis capacity of the Veloce system facilitated parallel analysis of three replicates of the mixture of reference compounds, whereas only one analysis was performed using HPLC in the same amount of time. A comparison of the standard curves is shown in Figure 11.
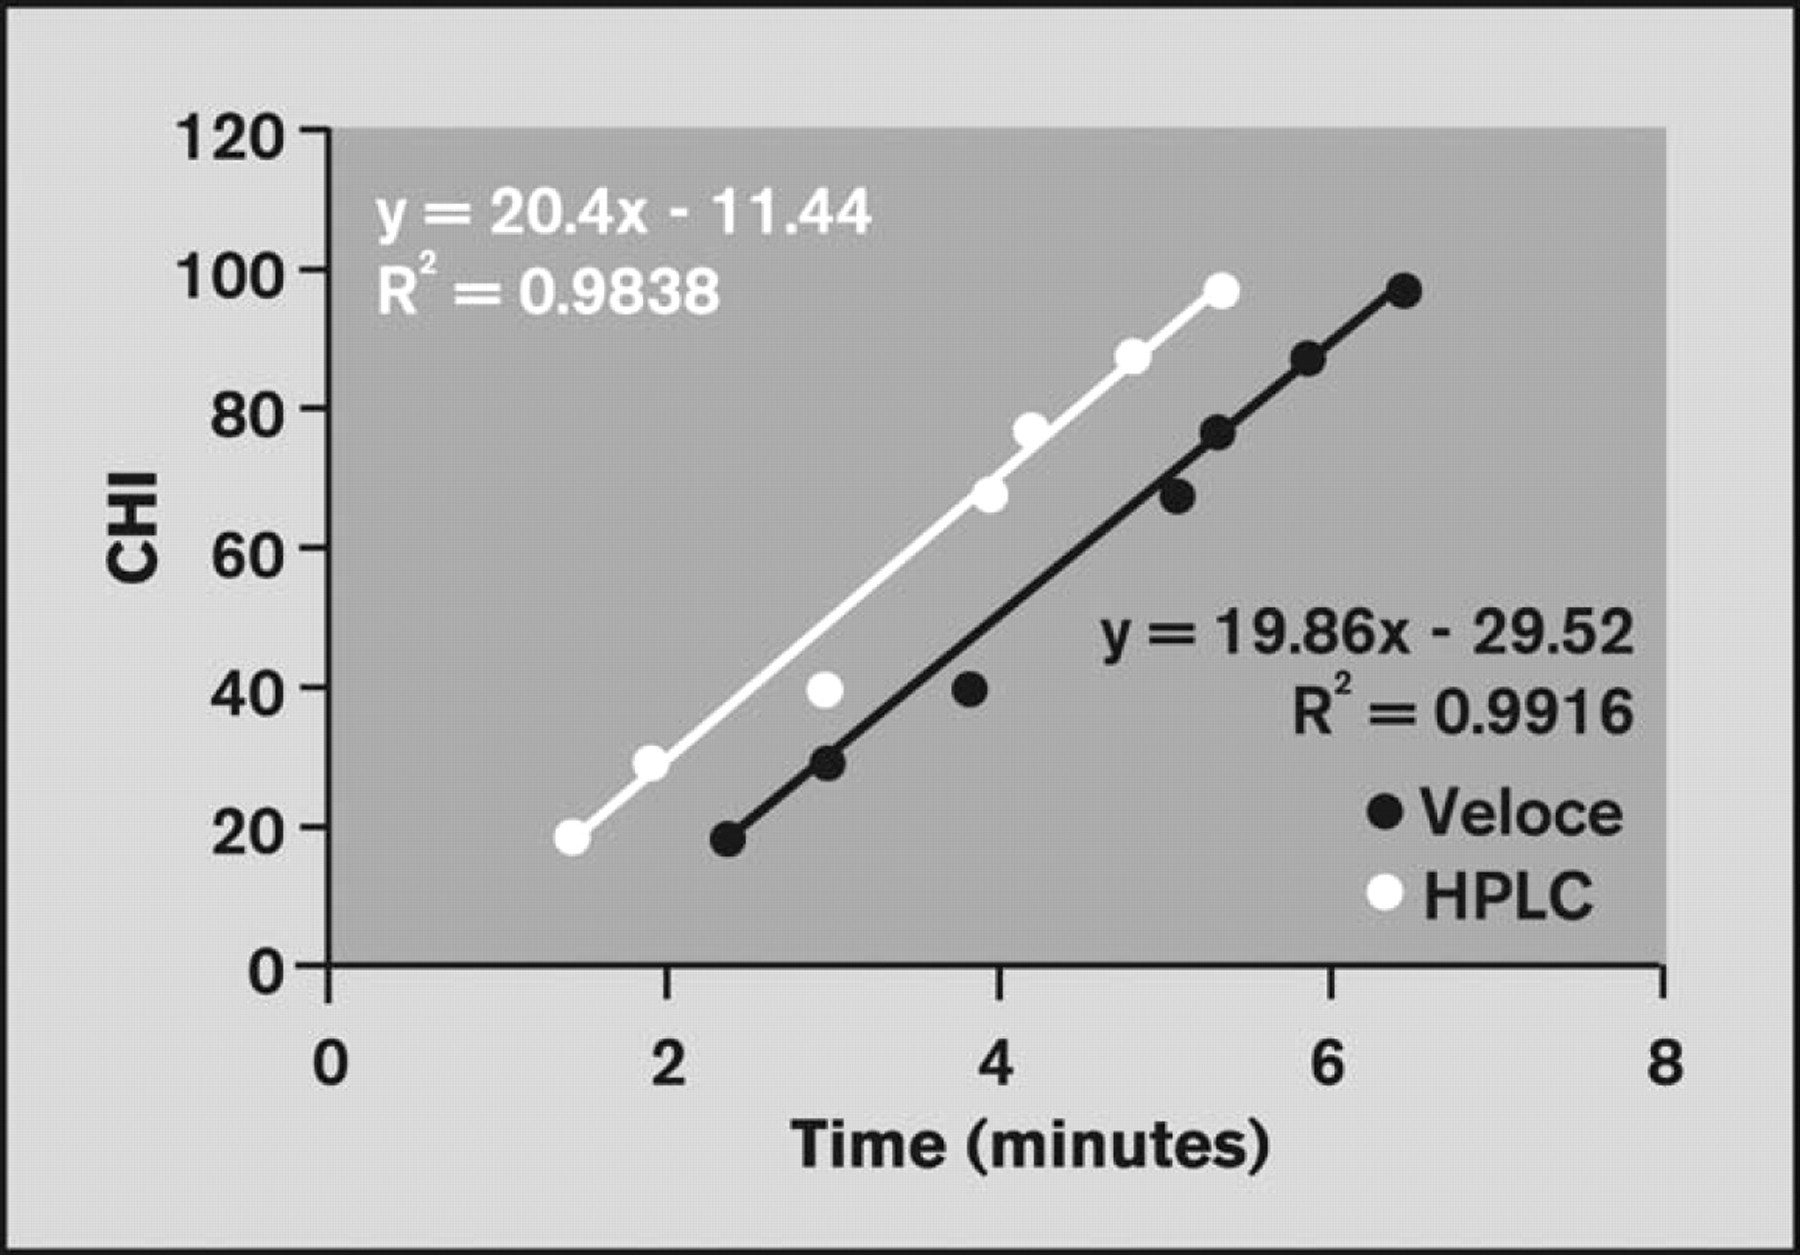
Comparison of CHI curves obtained using the Veloce system and HPLC.
An unknown compound was analyzed under the same conditions (in a separate column of the Brio cartridge) in parallel with the reference compound mixtures. CHI was determined for the unknown compound using the standard curves shown in Figure 11. Table 7 compares the CHI value predicted by the Veloce system to the value predicted by HPLC. The predicted CHI values differ by <5%, which is reasonable within experimental error. Figure 12 compares the study duration and solvent consumption for CHI determination by the Veloce system and by HPLC. Excess Brio cartridge capacity would have permitted simultaneous determination of CHI for 14 compounds.
Comparison of CHI values for an unknown compound based on analysis by the Veloce system and by HPLC
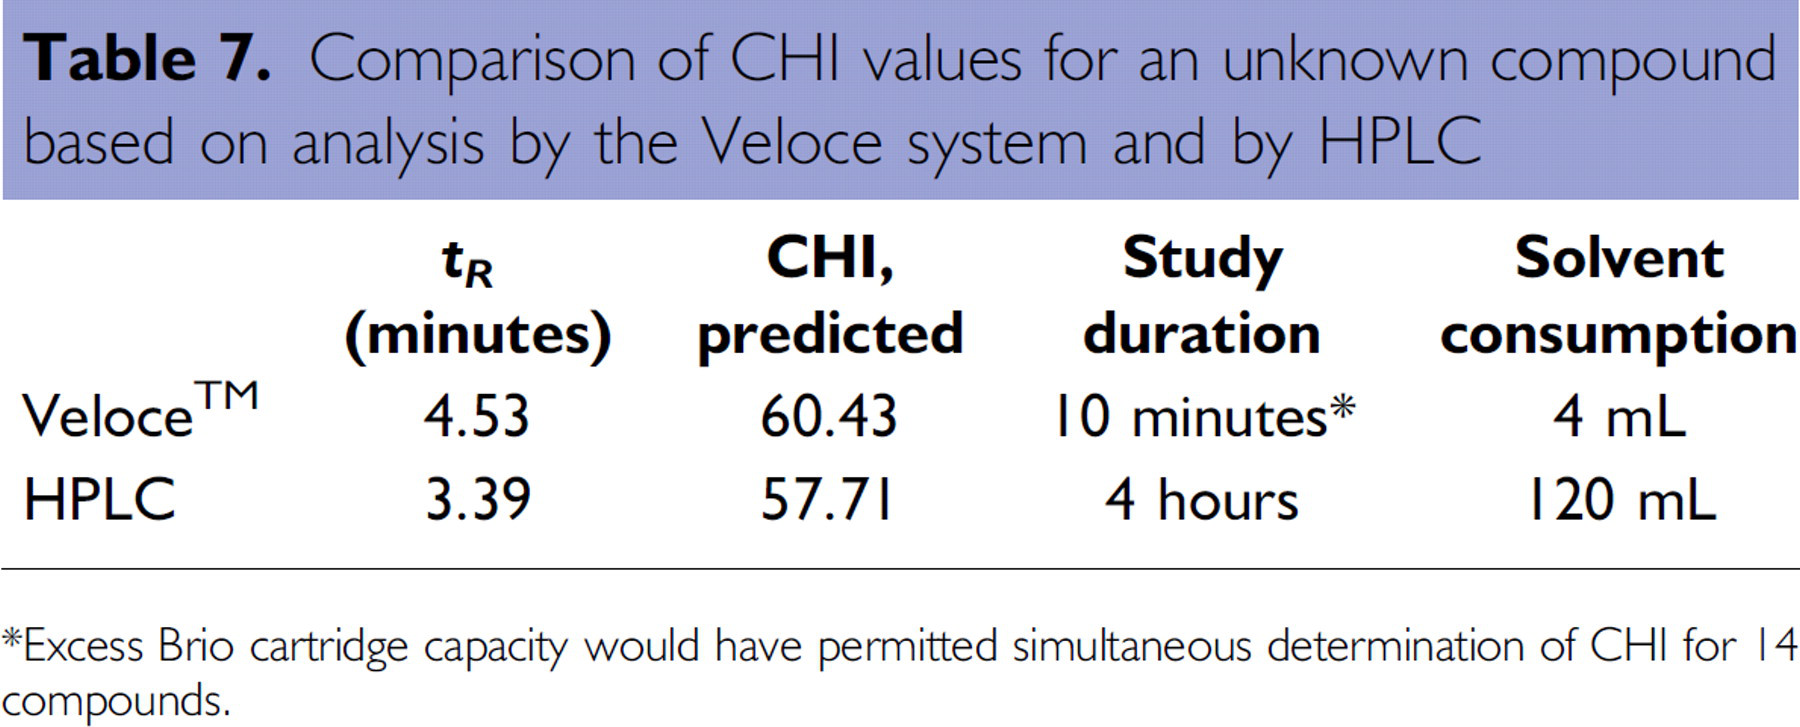
Excess Brio cartridge capacity would have permitted simultaneous determination of CHI for 14 compounds.
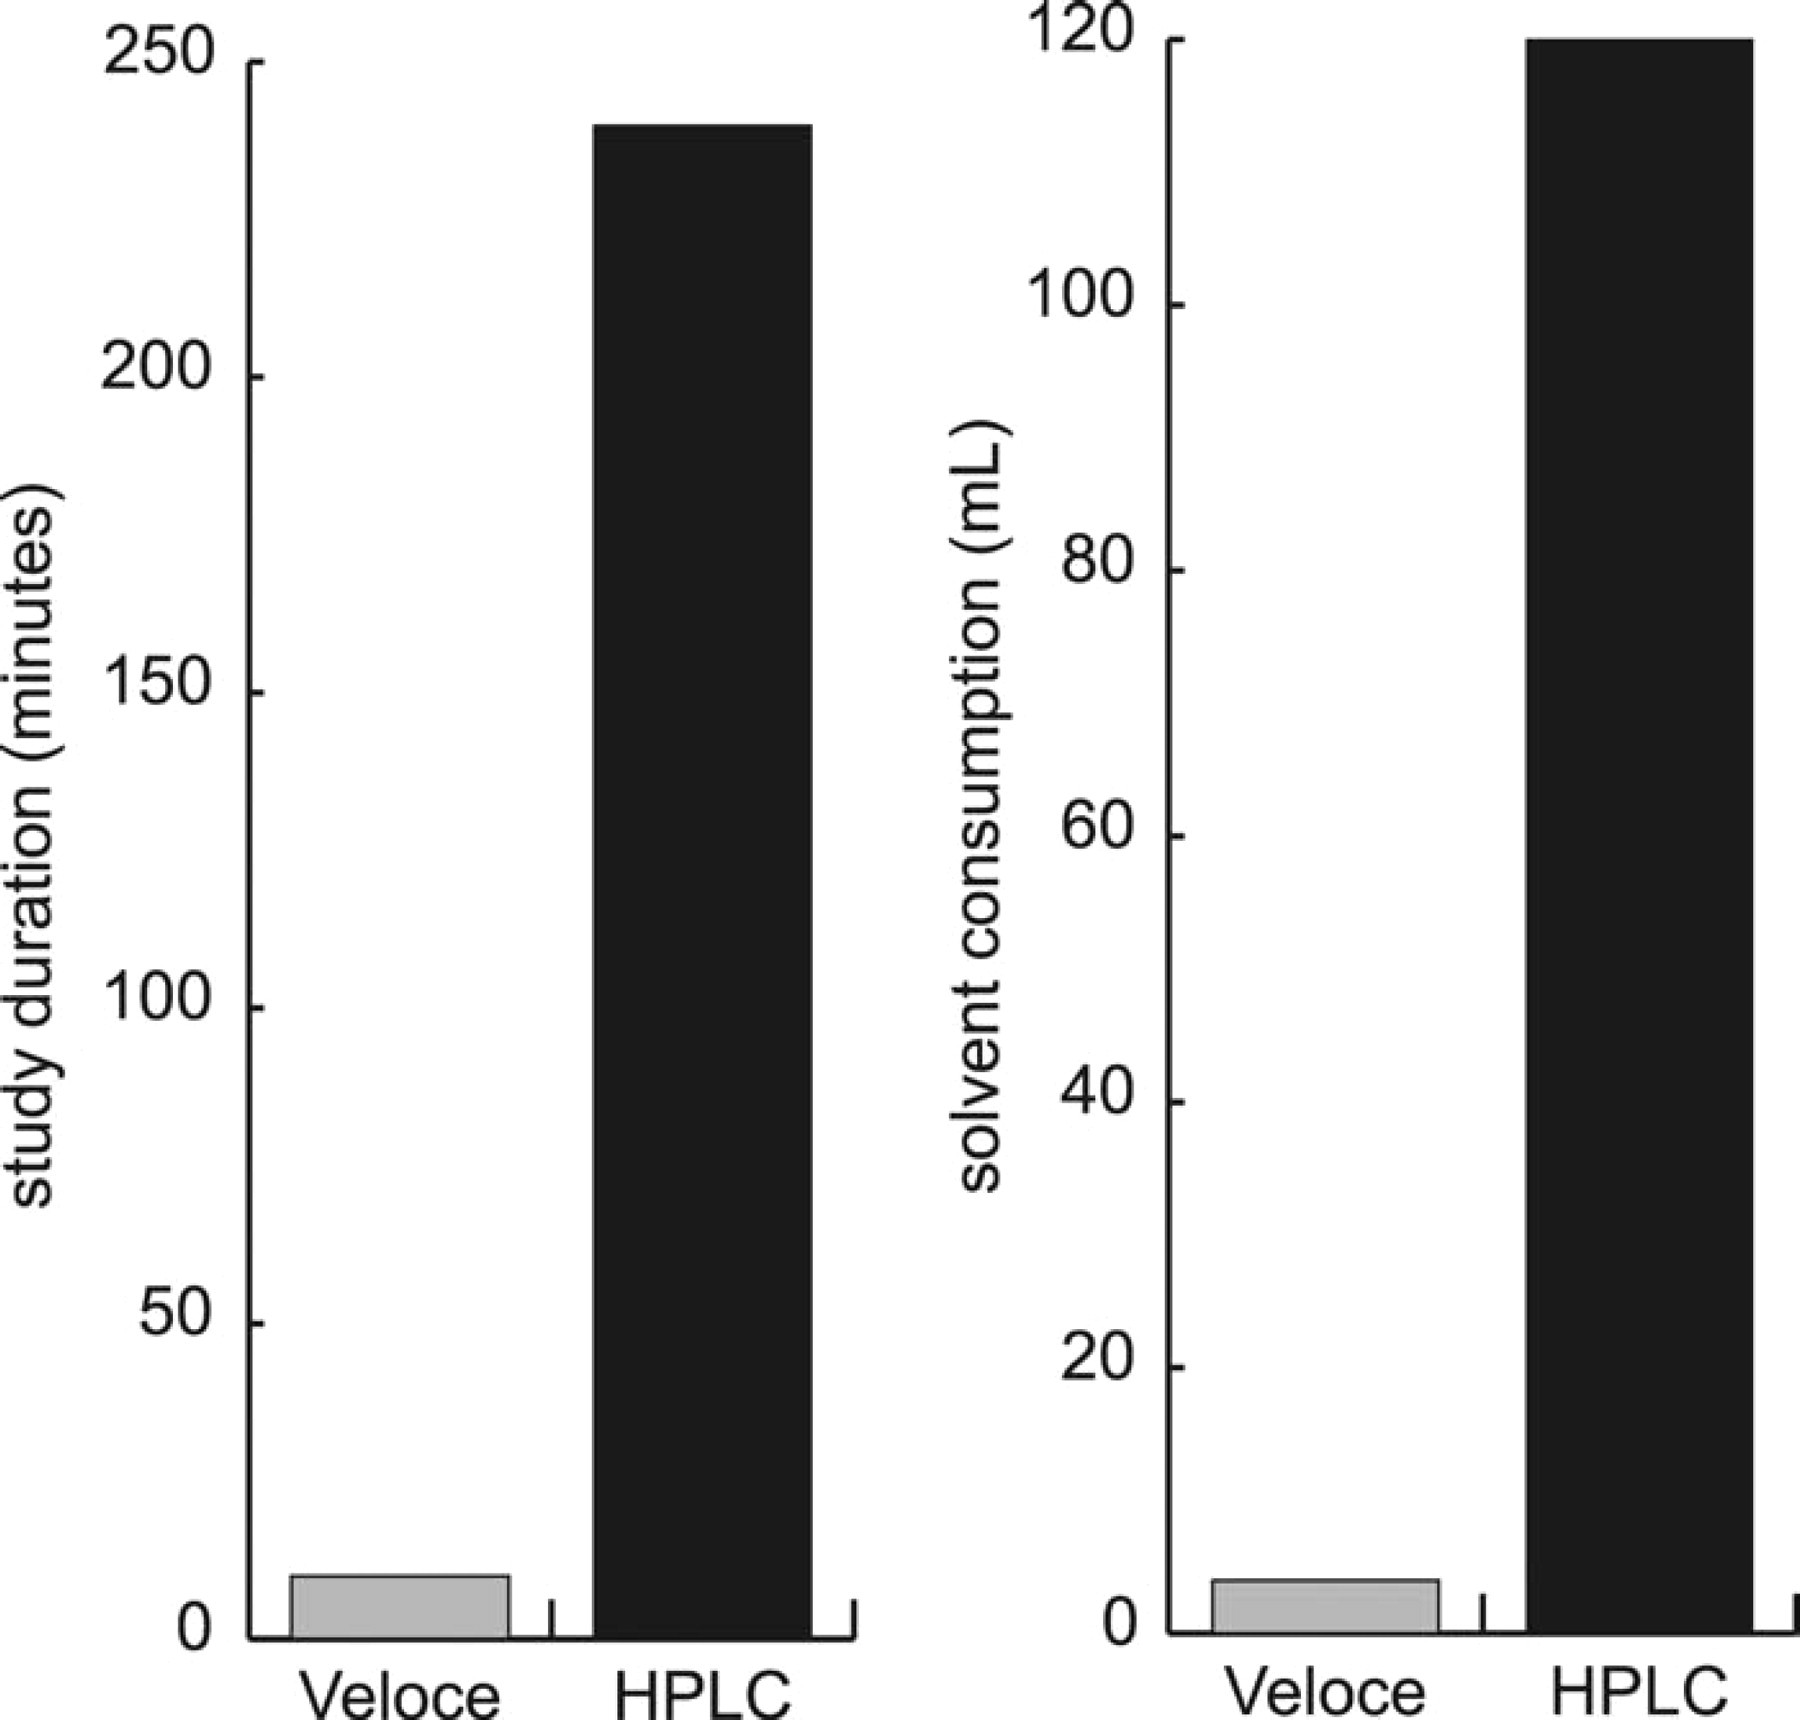
Comparison of study duration and solvent consumption for CHI determination by the Veloce μPLC system and HPLC.
Conclusion
This study demonstrates use of the Veloce system for quantitative assessment of compound purity and ADMET parameters for a wide variety of compounds. For selected applications, the system offers a dramatic increase in throughput, and at the same time, matches the accuracy and precision of traditional techniques. The parallel format allows analysis of a large number of compounds and/or multiple replicates of samples in a single run. Compared to serial HPLC approaches, the 24-fold increase in sample analysis capacity dramatically reduces the time required to characterize these properties for a large number of samples and offers the flexibility to design experiments that provide statistically meaningful, high-quality data. Compared to systems of equivalent capacity, the Veloce system occupies minimal bench space. Additionally, the platform significantly decreases mixed waste by reducing consumption of samples and solvents.