
Abstract
Automated DNA isolation can decrease hands-on time in routine pathology. Our aim was to apply automated DNA isolation and perform DNA methylation analyses. DNA isolation was performed manually from fresh frozen (CRC = 10, normal = 10) specimens and colonic biopsies (CRC = 10, healthy = 10) with QIAamp DNA Mini Kit and from FFPE blocks (CRC = 10, normal = 10) with QIAamp DNA FFPET Kit. Automated DNA isolation was performed with MagNA Pure DNA and Viral NA SV kit on MagNA Pure 96 system. DNA methylation of MAL, SFRP1, and SFRP2 were analyzed with methylation-specific high-resolution melting analysis. Yield of automatically isolated samples was equal in fresh frozens and significantly lower compared to manually isolated biopsy and FFPE samples. OD260/280 of fresh frozen and biopsy samples were similar after both isolations, automated isolation resulted in lower purity in FFPE samples. Both protocols resulted in similar OD260/230 from fresh frozens, automated isolation method was superior in biopsies and manual protocol in FFPE samples. DNA methylation of biopsies, fresh frozen samples were highly similar after both methods, results of automatically and manually isolated FFPE samples were different. Automated DNA isolation from fresh frozen samples can be suitable for high-throughput laboratories.
Introduction
Different types of biological samples are analyzed in daily routine pathology, including fresh frozen, biopsy, and formalin-fixed, paraffin-embedded (FFPE) tissue specimens. Among these sample sources, snap frozen tissue and cryopreservative (e.g., RNAlater RNA Stabilization Reagent, 1 PAXgene Tissue System 2 ) stored samples are considered to have the highest quality, although the majority of surgically or endoscopically removed tissue samples are routinely processed as FFPE specimens. The latter sample type is used for pathological and molecular diagnosis, but the molecular analysis of highly degraded and cross-linked nucleic acids isolated from FFPE samples remains challenging.3,4
In the routine work of diagnostic laboratories, DNA isolation can be a time-consuming step, especially because of the rapidly increasing volume of clinical samples. This step is usually performed manually with silica column-based protocols with a limited number of samples in parallel. In contrast, continuous optimization of automated DNA isolation methods from a broad range of sample types resulted in more standardized, reproducible, and efficient protocols designed especially for high-throughput analyses. Among the commercially available automated nucleic acid isolation systems, MagNA Pure 96 Instrument (Roche, Basel, Switzerland) has one of the highest sample input capacities for nucleic acid isolation based on magnetic glass particles with ready-to-use reagents and with a minimal hands-on time for the operator. The built-in ultraviolet decontamination system can inhibit carryover contamination between runs, which makes this instrument suitable for diagnostic laboratories.
Our molecular knowledge of colorectal cancer (CRC) relies largely on results of mutational analyses, but to date, known genetic alterations still cannot fully explain the complex process of carcinogenesis. Cancer-associated epigenetic alterations can provide further insight into colorectal tumorigenesis. DNA methylation is one of the most intensively studied epigenetic processes. Hypermethylation of a growing number of known genes can lead to decreased expression and finally contribute to CRC formation. Secreted frizzled-related protein 1 (SFRP1),5,6 secreted frizzled-related protein 2 (SFRP2),7 –9 and T-cell differentiation protein (MAL) 10 are known to be hypermethylated in benign and malignant colorectal tumors compared with healthy colonic tissue controls. DNA methylation assessment of these genes can be cost-effectively performed with methylation-specific high-resolution melting (MS-HRM) analysis. 11
In the present study, automatic and manual genomic DNA isolation was performed from fresh frozen, biopsy, and FFPE tissue samples using different commercially available kits. Isolated DNA samples were tested by DNA methylation analysis for SFRP1, SFRP2, and MAL genes with MS-HRM analysis.
Materials and Methods
Sample Collection
Fresh frozen tissue specimens were collected from the Department of Transplantation and Surgery, Semmelweis University, Budapest; surgically removed CRC (UICC stage II–III; n = 10) and corresponding normal adjacent tissue (NAT; n = 10) furthest available from the tumor sample were collected and were then snap frozen and stored at −80 °C. Biopsy samples (approximately 3–5 mg tissue specimens) were obtained during routine screening colonoscopy examinations at the 2nd Department of Internal Medicine, Semmelweis University, Budapest, from CRC (n = 10) and healthy patients (n = 10) with no evidence of disease and were immediately put and stored in RNAlater RNA Stabilization Reagent (Qiagen GmbH, Hilden, Germany) at −80 °C. FFPE sample fixation was performed with buffered formalin for no longer than 24 h at the 1st Department of Pathology and Experimental Cancer Research, Semmelweis University, Budapest. FFPE sections were prepared from FFPE blocks less than 6 mo old (n = 20; 10 CRC, 10 NAT). Patients did not receive chemo- or radiotherapy prior to sample collection. The study was approved by the local ethics committee (Semmelweis University Regional and Institutional Committee of Science and Research Ethics; Nr.: ETT TUKEB 23970/2011), and written informed consent was provided by all patients.
Genomic DNA Isolation
Fresh frozen tissue specimens (3–5 mg) were cut on dry ice from fresh frozen surgical material stored at −80 °C by using a scalpel. After weight measurements, tissue samples were immediately put into 180 µL MagNA Pure DNA Tissue Lysis Buffer (Roche, cat No. 04 805 160 001) and 20 µL Proteinase K, recombinant PCR grade (Roche, cat No. 03 115 828 001) before the automated isolations and into 180 µL Buffer ATL and 20 µL of Proteinase K (Qiagen, both included in the QIAamp DNA Mini Kit) before manual isolation protocol. After vigorous vortexing for 10 s, tissue samples were digested at 55 °C for 4 h. DNA isolations were performed according to the manufacturers’ instructions using the automated MagNA Pure DNA and Viral NA Small Volume Kit with the DNA Tissue SV 2.0 Protocol (Roche) on the MagNA Pure 96 System and the DNA purification from tissues protocol of the manual QIAamp DNA Mini Kit (Qiagen). Elution volume was 200 µL in both isolation protocols. RNAlater RNA Stabilization Reagent–stored biopsy samples were thawed on ice, and tissue samples (3–5 mg) were transferred to new tubes containing 180 µL MagNA Pure DNA Tissue Lysis Buffer and 20 µL Proteinase K, recombinant PCR grade (Roche). After vigorous vortexing for 10 s, tissue samples were digested at 55 °C for 4 h. After completion of digestion, lysates were divided and 100 µL lysates were transferred to new tubes. These volumes were adjusted with 100 µL MagNA Pure DNA Tissue Lysis Buffer before automated and with 100 µL Buffer ATL before manual isolation. DNA isolations were performed according to the manufacturers’ instructions using the automated MagNA Pure DNA and Viral NA Small Volume Kit with the DNA Tissue SV 2.0 Protocol (Roche) on the MagNA Pure 96 System and the DNA purification from tissues protocol of the manual QIAamp DNA Mini Kit (Qiagen). Elution volume was 50 µL in both isolation protocols. Consecutive FFPE sections were deparaffinized with a well-established method consisting of incubations with 1 mL xylene for 10 min twice and washing with 1 mL absolute ethanol for 10 min twice. Air-dried sections were transferred to new tubes into 200 µL MagNA Pure DNA Tissue Lysis Buffer and 20 µL Proteinase K, recombinant PCR grade (Roche) before automated, and into 180 µL Buffer ATL and 20 µL of Proteinase K (Qiagen, both included in the QIAamp DNA FFPE Kit). After vigorous vortexing for 10 s, tissue samples were digested at 55 °C overnight before the automated isolation, at 56 °C for 2 h (until complete digestion of tissue samples), and at 90 °C for 1 h in the manual protocol. DNA isolations were performed according to the manufacturers’ instructions using the automated MagNA Pure DNA and Viral NA Small Volume Kit with the DNA FFPE SV 2.0 Protocol (Roche) on the MagNA Pure 96 System and the isolation of genomic DNA from FFPE tissue sections protocol of the manual QIAamp DNA Mini Kit (Qiagen). Elution volume was 100 µL in both isolation protocols.
Quality and Quantity of the Isolated DNA Samples
Genomic DNA concentrations and OD260/280 and OD260/ 230 ratios were measured with the NanoDrop 1000 spectrophotometer (Thermo Fisher Scientific Inc., Waltham, MA). Statistical significance was determined with one-way analysis of variance. DNA integrity was assessed indirectly with a multiplex PCR published previously by van Beers et al. 12 amplifying 4 amplicons from nonoverlapping sites in the GAPDH gene (chr12) with different product lengths (100 bp, 200 bp, 300 bp, 400 bp) using GAPDH multiplex primer mix (final concentration 0.133 µM), LightCycler 480 Probes Master (2×), DNA template (8 ng/reaction) in a final volume of 50 µL. PCR reactions were performed with the following thermocycling conditions on the LightCycler 480 System (Roche): preincubation at 95 °C for 10 min, amplification (45 cycles) at 95 °C for 10 s, 60 °C for 30 s, and 72 °C for 16 s followed by cooling at 40 °C for 10 s with the Mono Color Hydrolysis Probe/UPL detection format. The result of this qualitative test is the number of the four possible PCR products amplified as a reporter of DNA quality. PCR amplicons were analyzed on 2% agarose gel and SYBR Safe DNA Gel Stain (Life Technologies, Carlsbad, CA) in 0.5× TBE using Molecular Weight Marker VIII (19–1114 bp; Roche).
Bisulfite-Specific PCR (BS-PCR) and MS-HRM
Bisulfite conversion was performed by using the EZ DNA Methylation Kit (Zymo Research, Irvine, CA) according to the manufacturer’s instructions with 1 µg input DNA. Bisulfite-specific PCR primers were designed to non-CpG regions to amplify bisulfite-converted DNA (bcDNA) without discriminating between methylated and nonmethylated sequences ( Table 1 ).
Analyzed Genes in DNA Methylation Experiments.
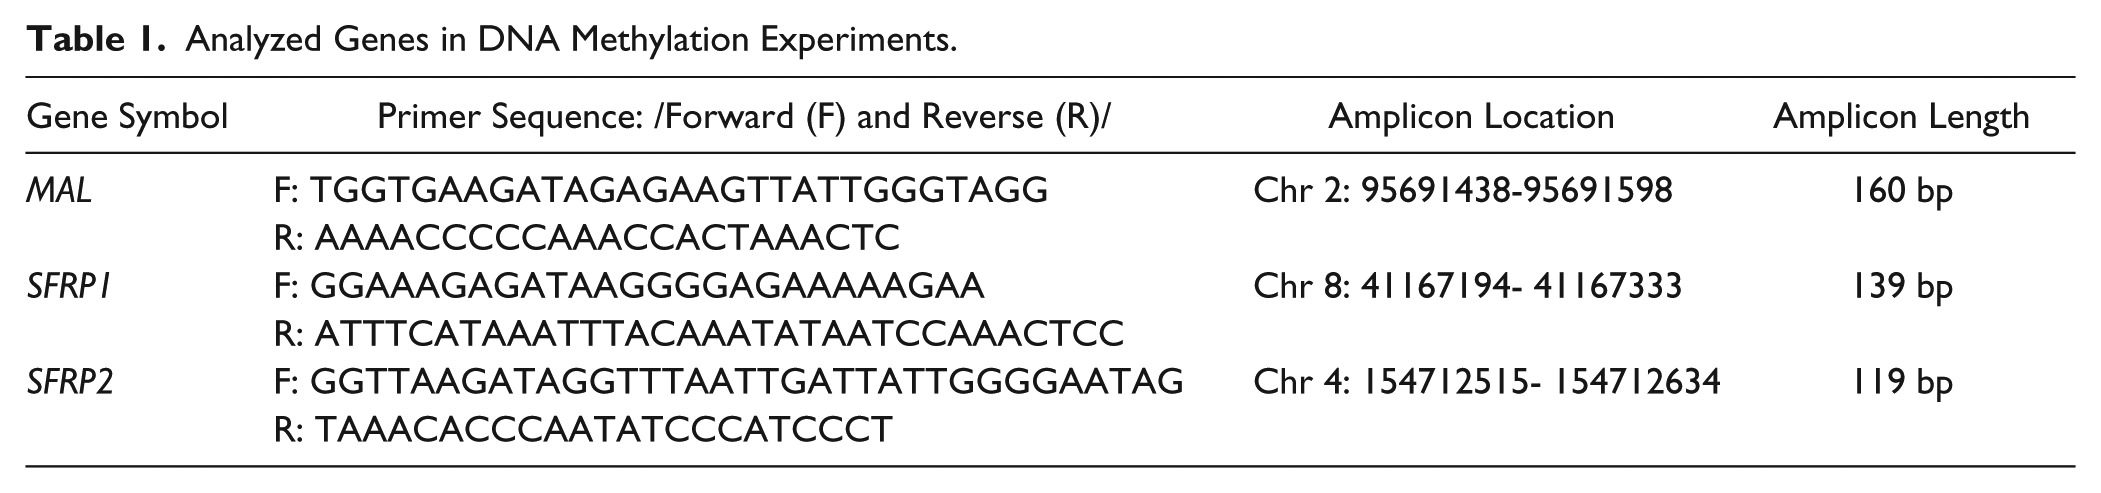
BS-PCR reactions were performed by using the AmpliTaq Gold 360 mastermix (2×; Life Technologies), LightCycler 480 ResoLight Dye (40×; Roche Applied Science), primer mix in 200 nM final concentration, bcDNA samples (approximately 10 ng bcDNA/well) in 15 µL final volume. The final concentration of MgCl2 was 2.0 mM, except for the SFRP2 primers, for which it was 1.5 mM. The real-time PCR amplification was carried out with the following thermocycling conditions on the LightCycler 480 system: 95 °C for 10 min, then 95 °C for 30 s, 60 °C with 0.4 °C decrease/cycle for 30 s, 72 °C for 30 s for 10 touchdown cycles, followed by amplification at 95 °C for 30 s, 56 °C for 30 s, and 72 °C for 30 s in 40 cycles. Following completion of the PCR thermal cycling, HRM analysis began with denaturation at 95 °C for 1 min, cool down to 40 °C, and hold for 1 min, then continuous warm up to 95 °C with 20 acquisition/°C rate during the melting curve fluorescence acquisition. The Cp values and the normalized melting curves were retrieved after data preprocessing using the LightCycler 480 Software release 1.5.0 (Roche). The MS-HRM curve analysis was performed with the LightCycler Gene Scanning software. MS-HRM curves were generated from the standard samples with known artificially methylated ratios (0%, 10%, 25%, 50%, 75%, 100%), and then every analyzed sample’s melting curve was compared visually to these standard curves to estimate DNA methylation percentages, as described previously. 13
Results
Quantity and Quality of the Isolated Genomic DNA
Nucleic Acid Recovery Based on Spectrophotometry (OD260) Measurements
The nucleic acid content of fresh frozen tissue specimens (µg DNA) was found to be similar after both isolation methods. The mean of the DNA quantity was not statistically different in the manually and automatically isolated samples (mean yield ± SD; automated = 10.48 ± 6.16 µg DNA; manual = 14.61 ± 14.05 µg DNA; Fig. 1 ). Biopsy (mean yield ± SD; automated = 3.86 ± 1.42 µg DNA/3–5 mg biopsy; manual = 8.50 ± 3.34 µg DNA/3–5 mg biopsy) and fresh FFPE samples (mean yield ± SD; automated = 4.61 ± 2.36 µg DNA/FFPE slide; manual = 11.51 ± 6.89 µg DNA/FFPE slide) had a significantly higher (p < 0.01) nucleic acid quantity with the manual isolation ( Fig. 1 ) compared with the automated isolation method. It is interesting to note that in contrast to the automated isolation method, yields of manually isolated samples showed higher variation in all sample types, especially in the case of tumor samples.
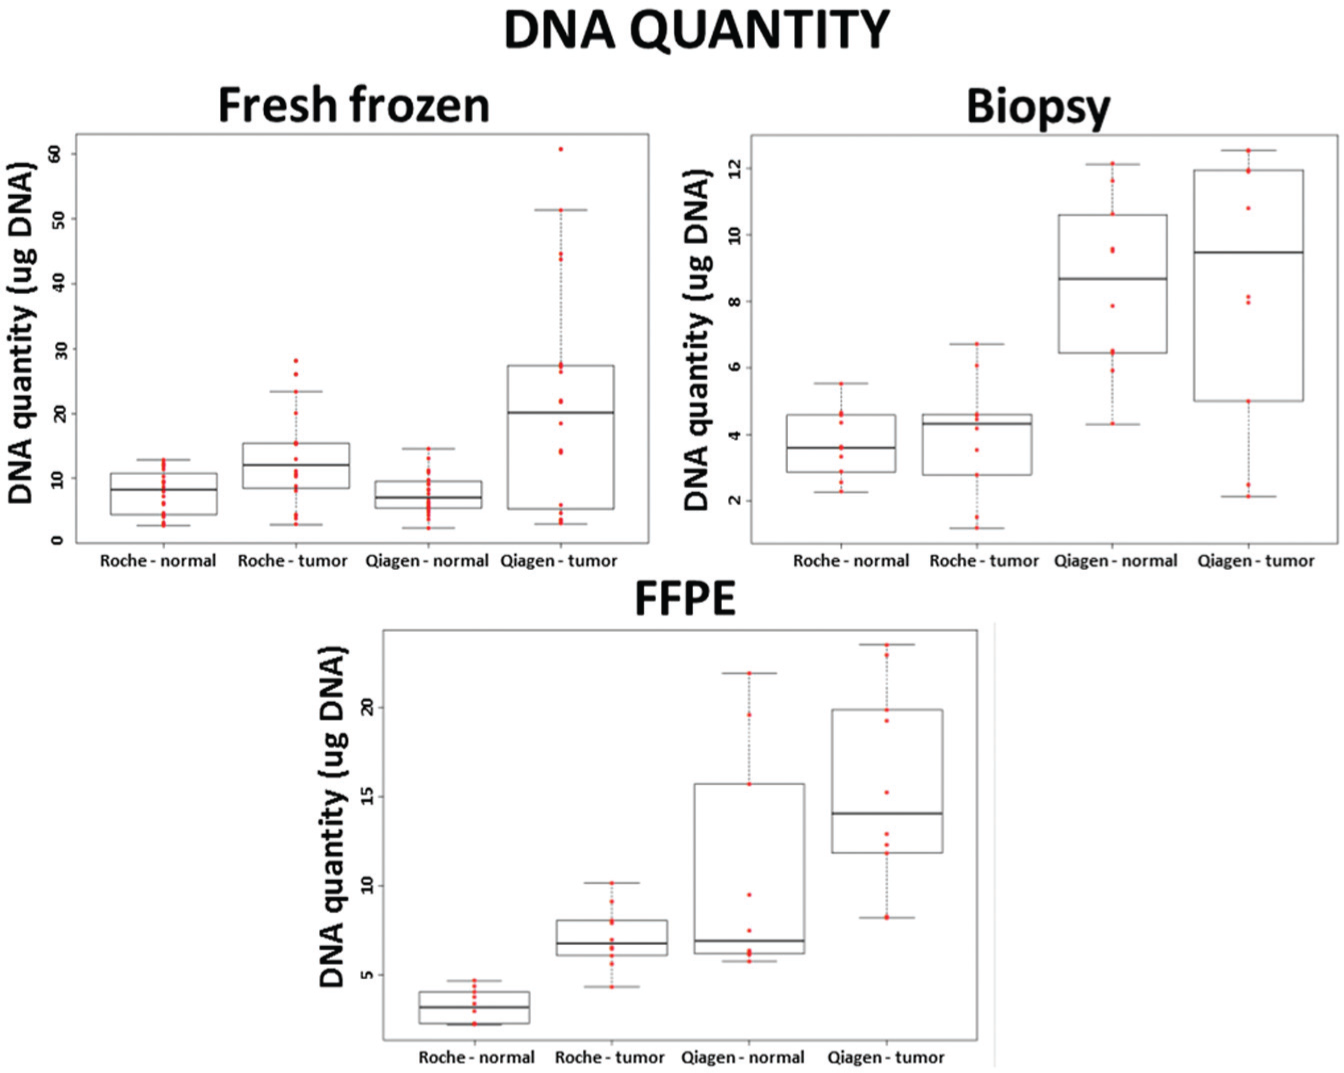
DNA quantity (µg DNA) of fresh frozen biopsy and formalin-fixed, paraffin-embedded (FFPE) samples after automated (Roche) and manual (Qiagen) isolation methods (every group contained 10 individual samples; n = 10). On the boxplots, each data point is represented with a red dot; the black line is the median. The first quartile is the bottom part and the third quartile is the upper part of the boxes. The boxes contain 50% of the data.
OD 260/280
Samples with OD260/280 ratios of 1.8 to 2.0 were considered as pure DNA samples.14,15 Almost all fresh frozen and all biopsy samples were found to have OD260/280 ratios of 1.8 or greater with no remarkable difference between the isolation methods. OD 260/280 values were similar in fresh frozen (mean OD260/280 ± SD; automated method: 1.87 ± 0.07; manual method: 1.88 ± 0.11) and biopsy samples (mean OD260/280 ± SD; automated method: 1.94 ± 0.04; manual method: 1.93 ± 0.04).
Some automatically isolated normal FFPE samples had slightly lower OD 260/280 ratios compared with the fresh frozen and biopsy samples. The manual method showed significantly (p < 0.01) higher OD260/280 ratios in FFPE samples (mean OD260/280 ± SD; automated method: 1.83 ± 0.06; manual isolation method: 2.00 ± 0.04; Fig. 2 ).
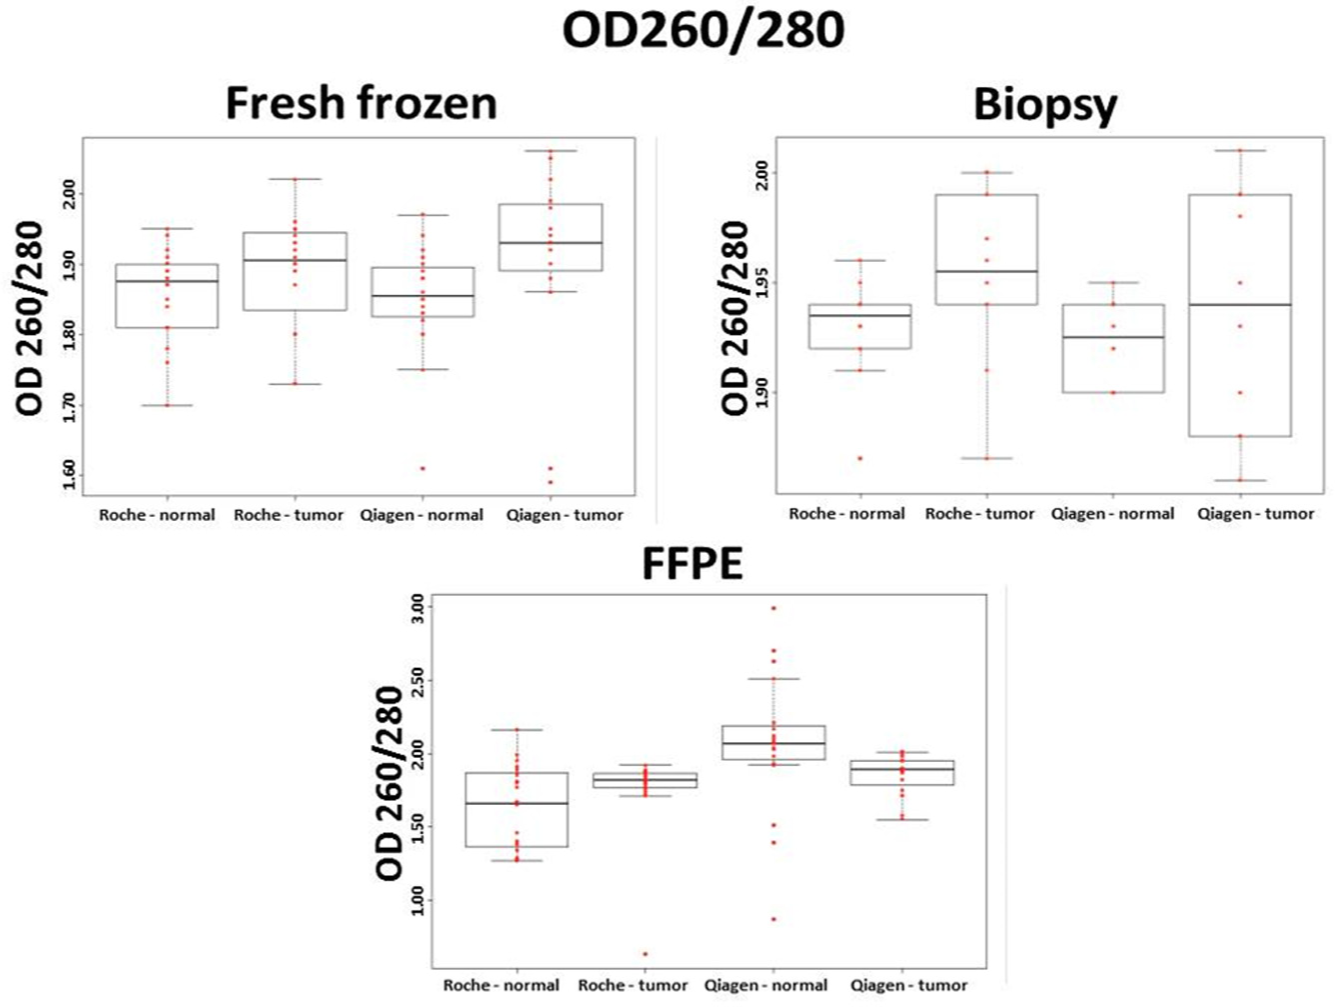
OD260/280 purity ratios of fresh frozen, biopsy, and formalin-fixed, paraffin-embedded (FFPE) samples after automated (Roche) and manual (Qiagen) isolation methods (every group contained 10 individual samples; n = 10). On the boxplots, each data point is represented with a red dot, and the black line is the median. The first quartile is the bottom part and the third quartile is the upper part of the boxes. The boxes contain 50% of the data.
OD 260/230
Samples with OD260/230 ratios of 2.0 to 2.2 were considered as pure DNA samples.14,15 Fresh frozen samples were found to have relatively high OD260/230 ratios (mean OD260/230 ± SD; automated method: 2.01 ± 0.46; manual method: 1.85 ± 0.35); these values were higher after automatic isolation. OD260/230 ratios of automatically isolated biopsy samples were also higher compared with the manual protocol (mean OD260/230 ± SD; automated method: 2.71 ± 0.56; manual method: 2.23 ± 0.13). Higher OD260/230 ratios could be measured in FFPE samples after manual isolation (mean OD260/230 ± SD; automated method: 1.81 ± 0.35; manual method: 1.95 ± 0.27), and the difference was significant in the case of tumor samples ( Fig. 3 ).
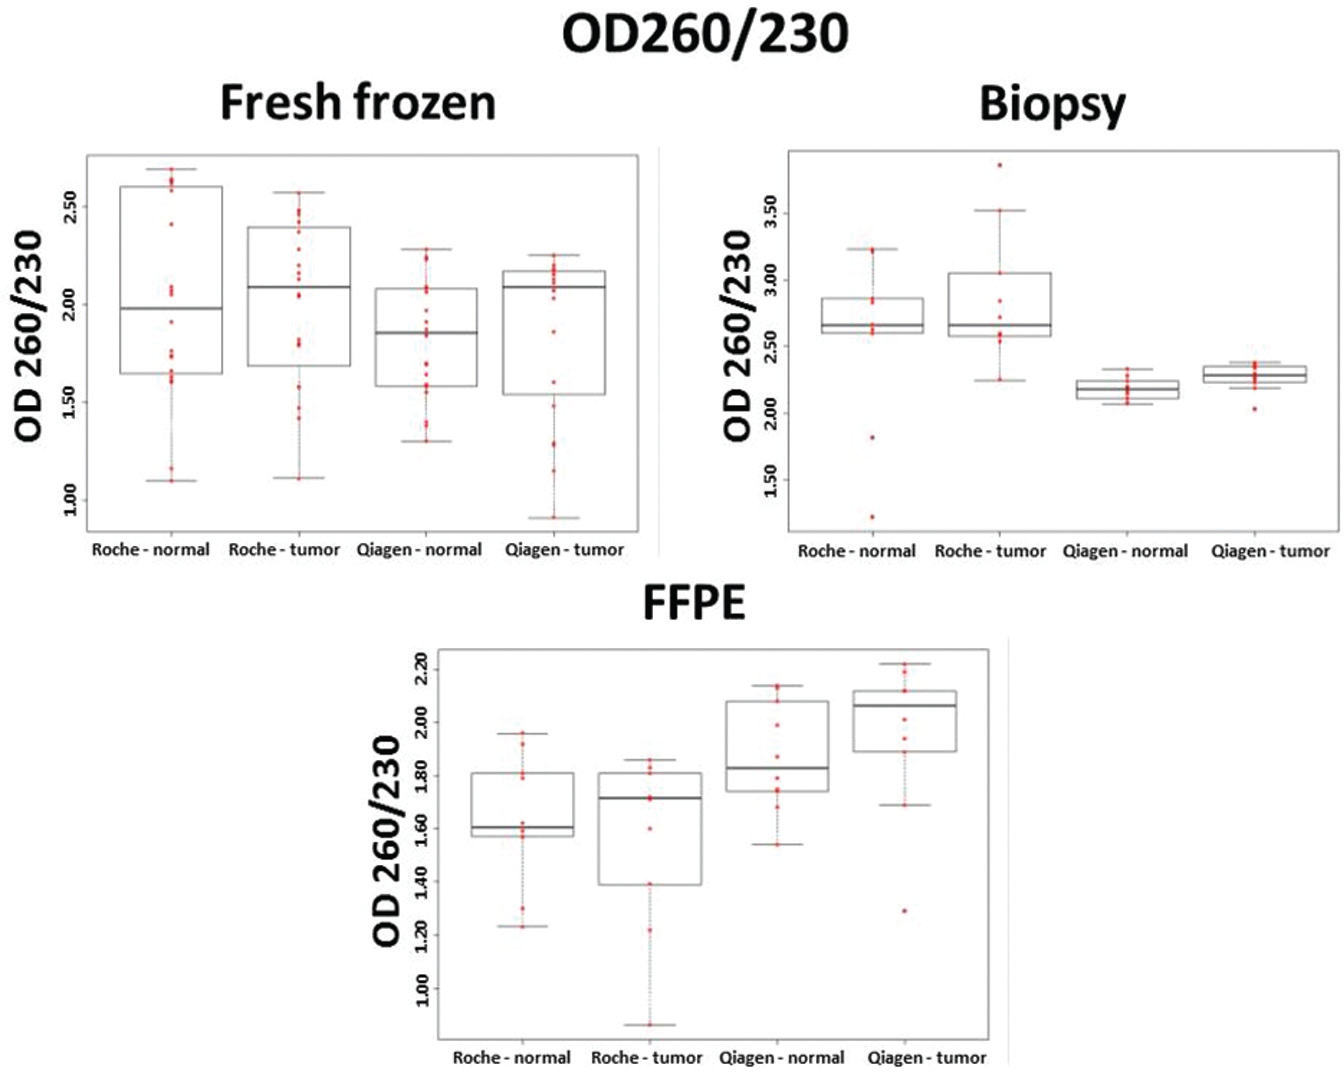
OD260/230 purity ratios of fresh frozen, biopsy, and formalin-fixed, paraffin-embedded (FFPE) samples after automated (Roche) and manual (Qiagen) isolation methods (every group contained 10 individual samples; n = 10). On the boxplots, each data point is represented with a red dot, and the black line is the median. The first quartile is the bottom part and the third quartile is the upper part of the boxes. The boxes contain 50% of the data.
DNA Integrity
As a positive control, the integrity of DNA eluates isolated from fresh frozen samples was analyzed. All four amplicons could be amplified with similar efficiency after both isolation methods ( Fig. 4 ). Different amplicon patterns could be detected among FFPE samples. Although pairwisely compared DNA samples isolated with the two methods from the same biological specimens showed similar patterns, slight variations in the amplicon size distribution could be observed. In the FFPE sample group, 50% of samples (10/20) showed higher DNA integrity after manual isolation and 5% of them (1/20) after the automated isolation method. In 45% (9/20) of the analyzed samples, the DNA integrity was found to be similar in the sample pairs isolated with different methods ( Fig. 5 ).

DNA integrity analysis of fresh frozen samples after automated (Roche) and manual (Qiagen) isolation methods. A previously published multiplex PCR protocol 12 was used, amplifying four amplicons in the GAPDH gene with different product lengths (100 bp, 200 bp, 300 bp, 400 bp). N = normal sample; N1 = normal sample 1; T = tumor sample; T1 = tumor sample 1.
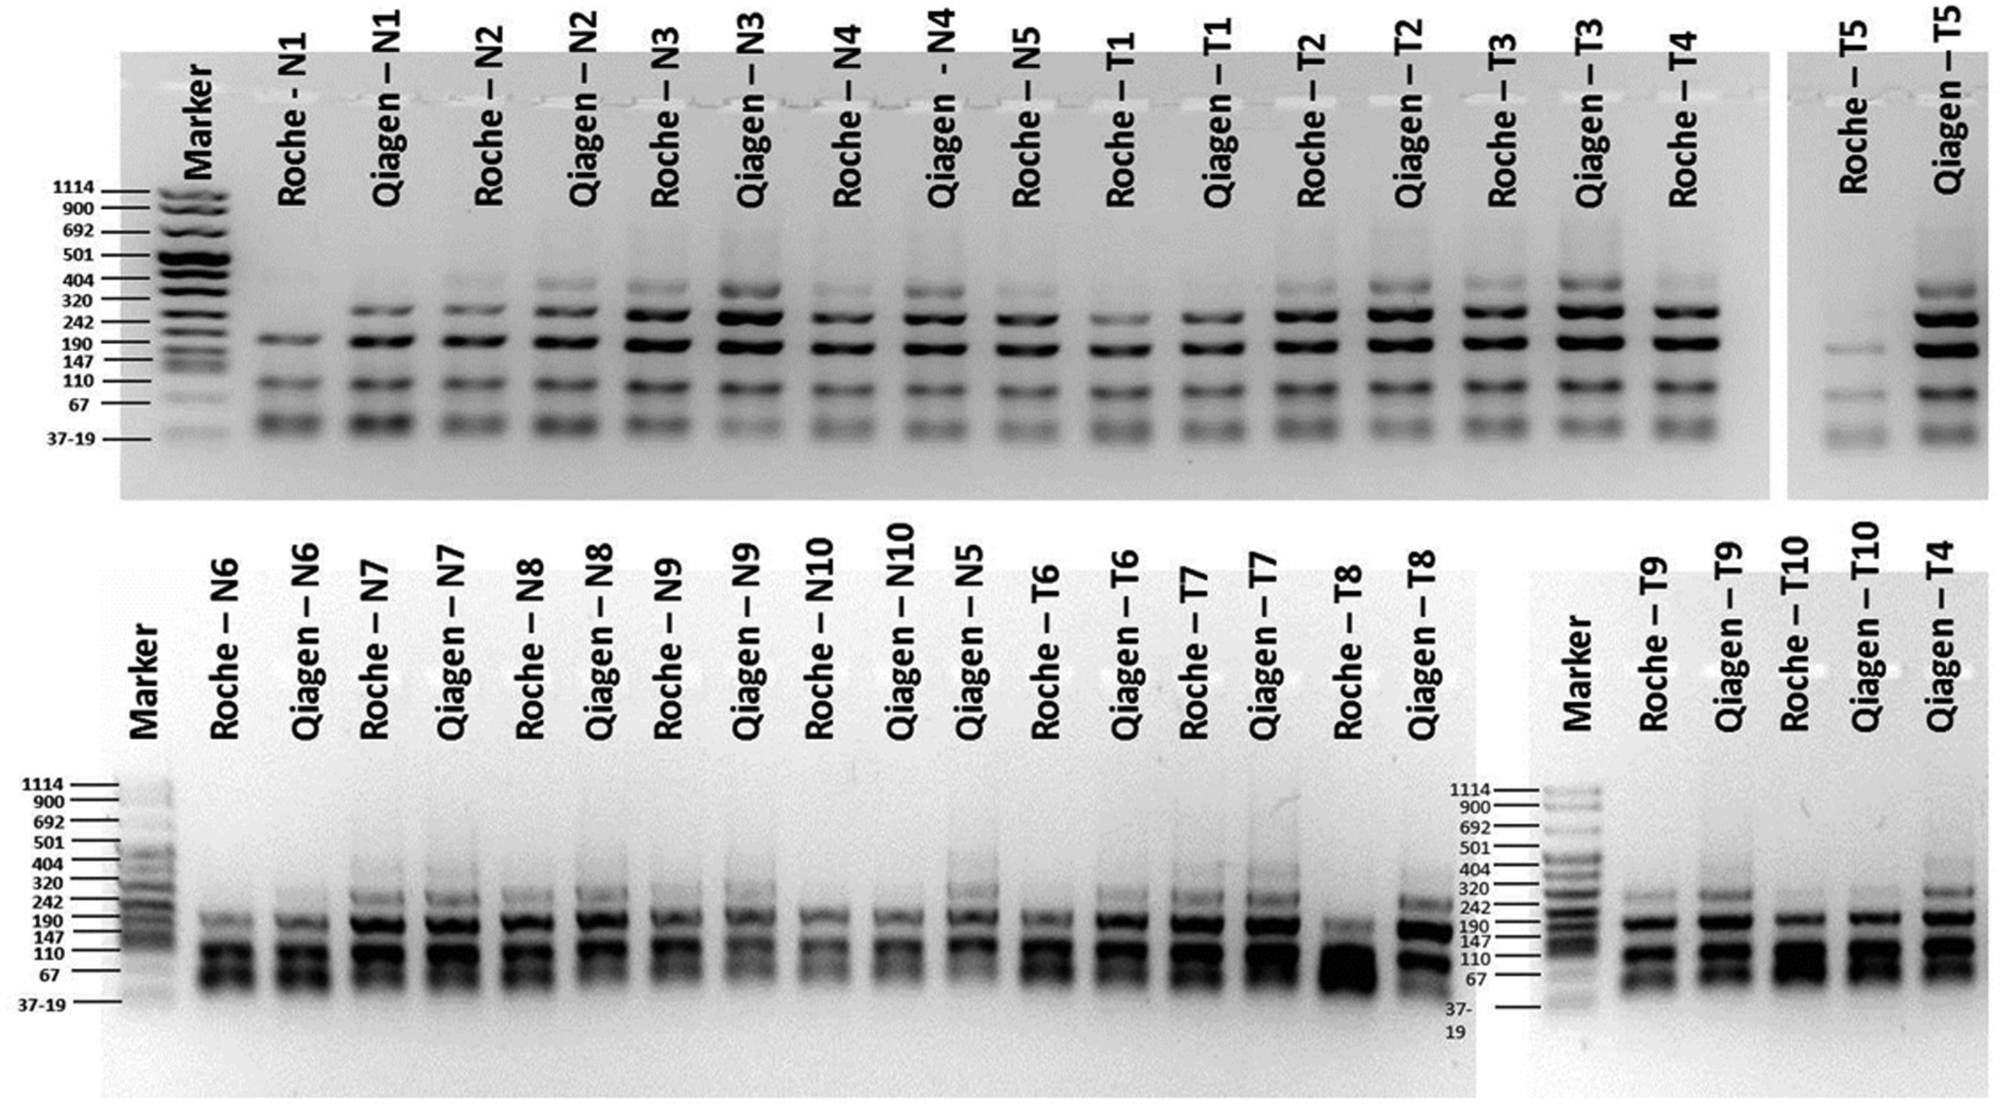
DNA integrity of formalin-fixed, paraffin-embedded (FFPE) samples after automated (Roche) and manual (Qiagen) isolation methods. A previously published multiplex PCR protocol 12 was used, amplifying four amplicons in the GAPDH gene with different product lengths (100 bp, 200 bp, 300 bp, 400 bp). N = normal sample; N1 = normal sample 1; T = tumor sample; T1 = tumor sample 1.
DNA Methylation Analysis
MS-HRM Analysis
Artificially methylated and unmethylated DNA samples were mixed in different ratios to generate methylation standards (0%, 10%, 25%, 50%, 75%, 100%) that were used to estimate the DNA methylation percentage of the analyzed samples.
The derivative curve-based line diagram of –dF/dT is a common way to represent the results of HRM analysis.16,17 These data can be alternatively visualized on heat maps representing the fluorescence intensity values on a color scale (red: high intensity; green: low intensity) for each sample (columns) at different temperatures (rows; Fig. 6 ).
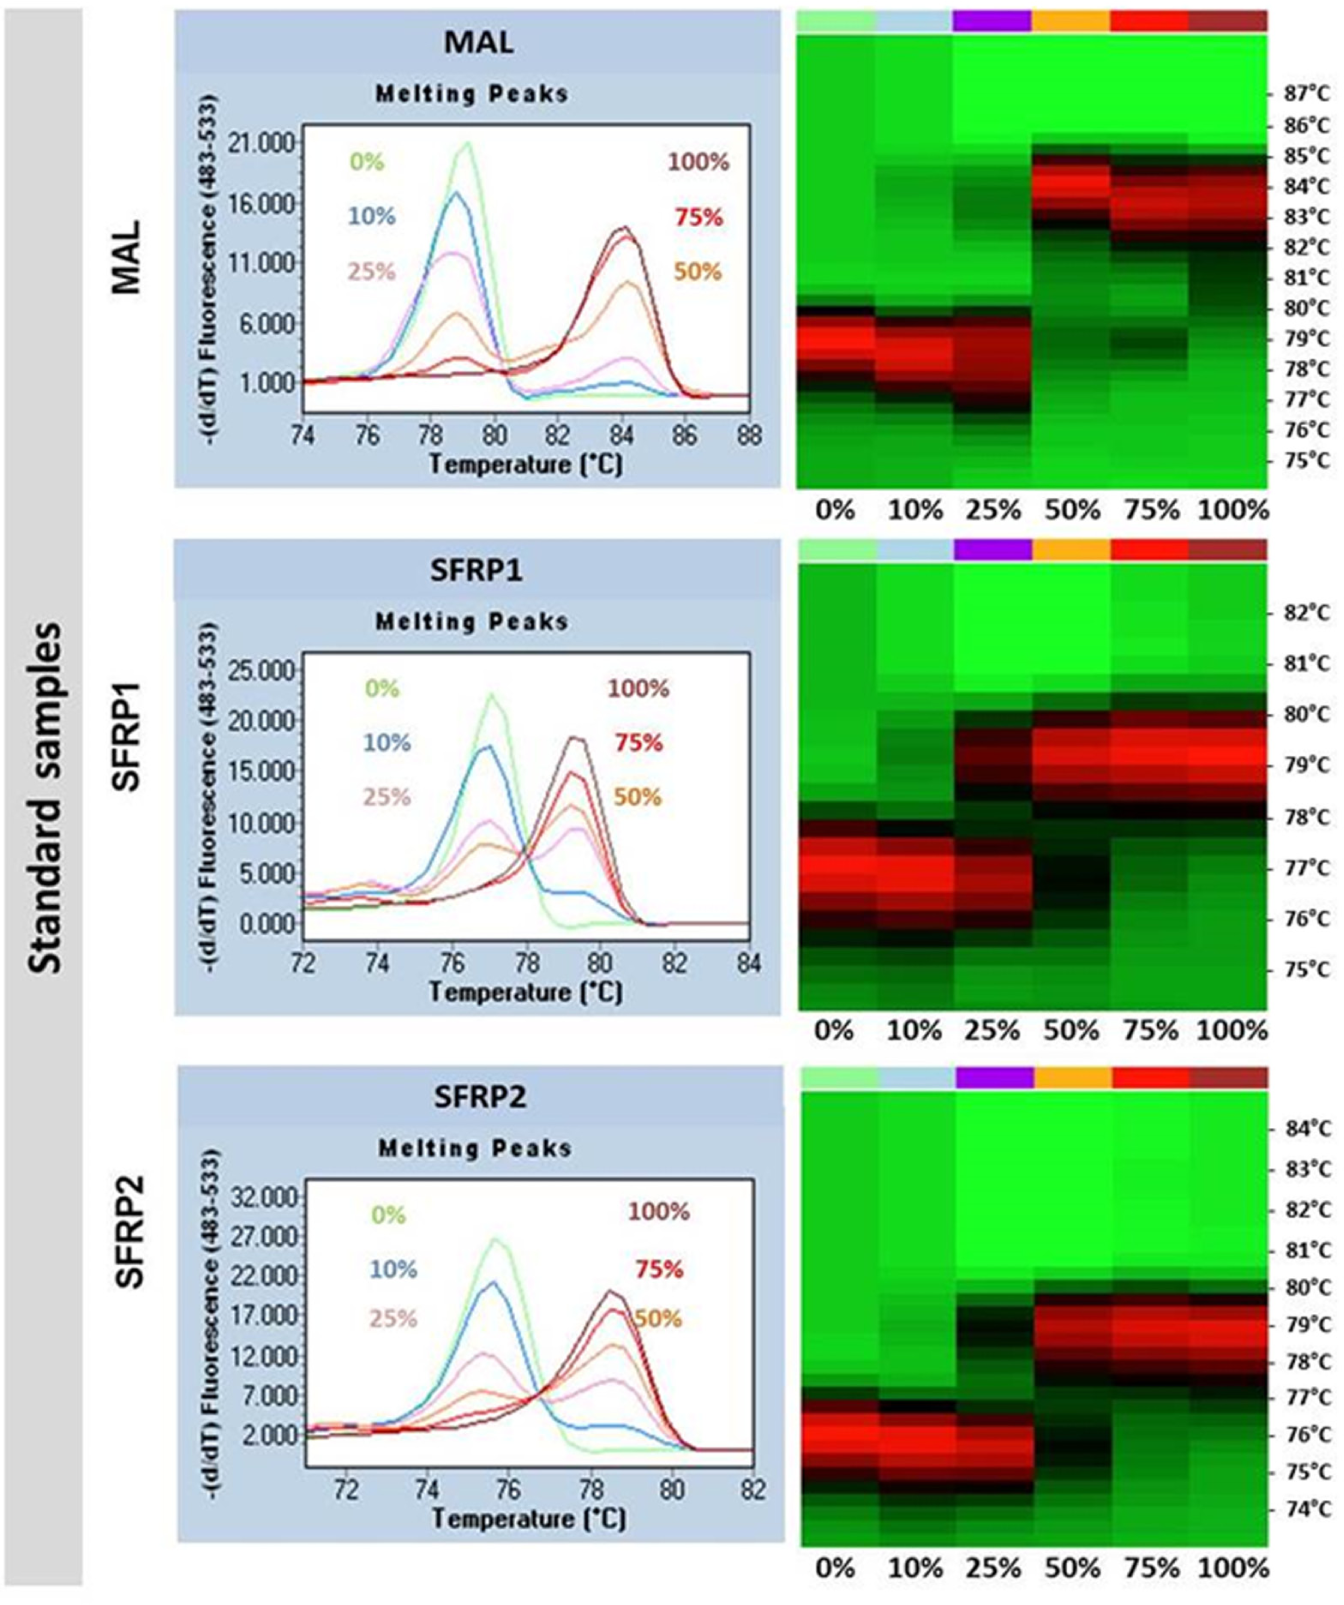
Melting peaks and the associated heat maps of methylation standards for the MAL, SFRP1, and SFRP2 genes. The derivative curve-based line diagrams of dF/dT represent the methylation standards’ (0%, 10%, 25%, 50%, 75%, 100%) results of the high-resolution melting (HRM) analysis (left). These data were visualized also on heat maps (right) representing the fluorescence intensity values on a color scale (red: high intensity; black: intermediate intensity; green: low intensity) for each sample (columns) at different temperatures (rows).
In fresh frozen ( Fig. 7A ) and biopsy ( Fig. 7B ) samples, both automated and manual isolation methods resulted in highly similar results, although some slight differences were found. Interestingly, fresh frozen sample normal 6 showed a high DNA methylation percentage after manual DNA isolation, which might be due to sampling error from the macroscopically normal tissue sample ( Fig. 7A ).
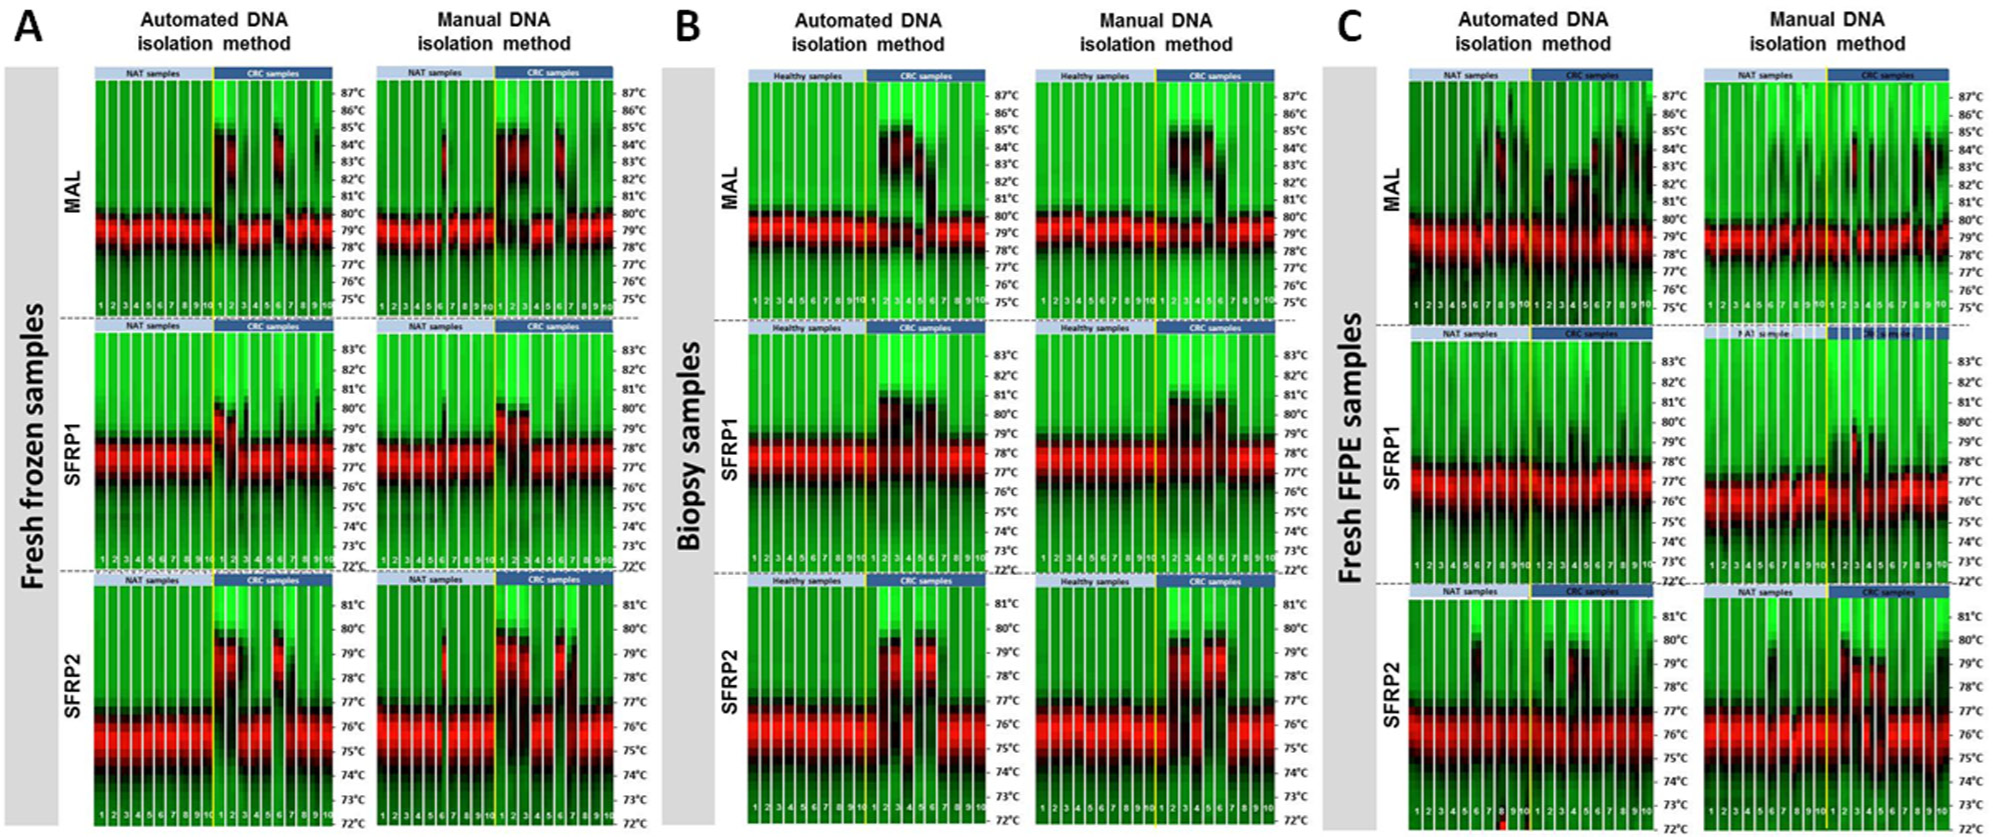
Heat maps of the high-resolution melting analysis of MAL, SFRP1, and SFRP2 gene DNA methylation levels in (
In FFPE samples, more remarkable differences have been found between the two DNA isolation methods in the MAL assay. In contrast to SFRP1 and SFRP2 assays, more normal samples were hypermethylated than in the frozen and biopsy sample groups. Moreover, a high variance in MAL methylation was observed, especially in the case of automated DNA isolation, indicating less sensitivity and higher background signals of MAL primer pairs ( Fig. 7C ).
Agreement between DNA Methylation Estimation Results on the Basis of Manual and Automated Isolation Methods
In biopsy and fresh frozen samples, DNA methylation estimations were highly similar after two isolation methods (biopsy: R2MAL = 0.93; R2SFRP1 = 0.61; R2SFRP2 = 1.00; fresh frozen: R2MAL = 0.72; R2SFRP1 = 0.69; R2SFRP2 = 0.76). Correlation was considered as a moderate correlation if the correlation coefficient fell between 0.36 < r2 < 0.67 and as a strong correlation if r2 > 0.67. 18 Although a limited number of samples were analyzed, the correlation between the DNA methylation percentage data after the two isolation methods was found to be linear. In the FFPE sample group, the linearity of the assays was lower than in the fresh frozen and biopsy samples (FFPE: R2MAL = 0.09; R2SFRP1 = 0.89; R2SFRP2 = 0.89). Among the assays, the performance of MAL was lower than that of the SFRP1 and SFRP2 assays. A strong correlation could be observed in the case of SFRP1 and SFRP2 assays between the methylation percentage data estimated after manual and automated isolation methods even from FFPE material ( Fig. 8 ).
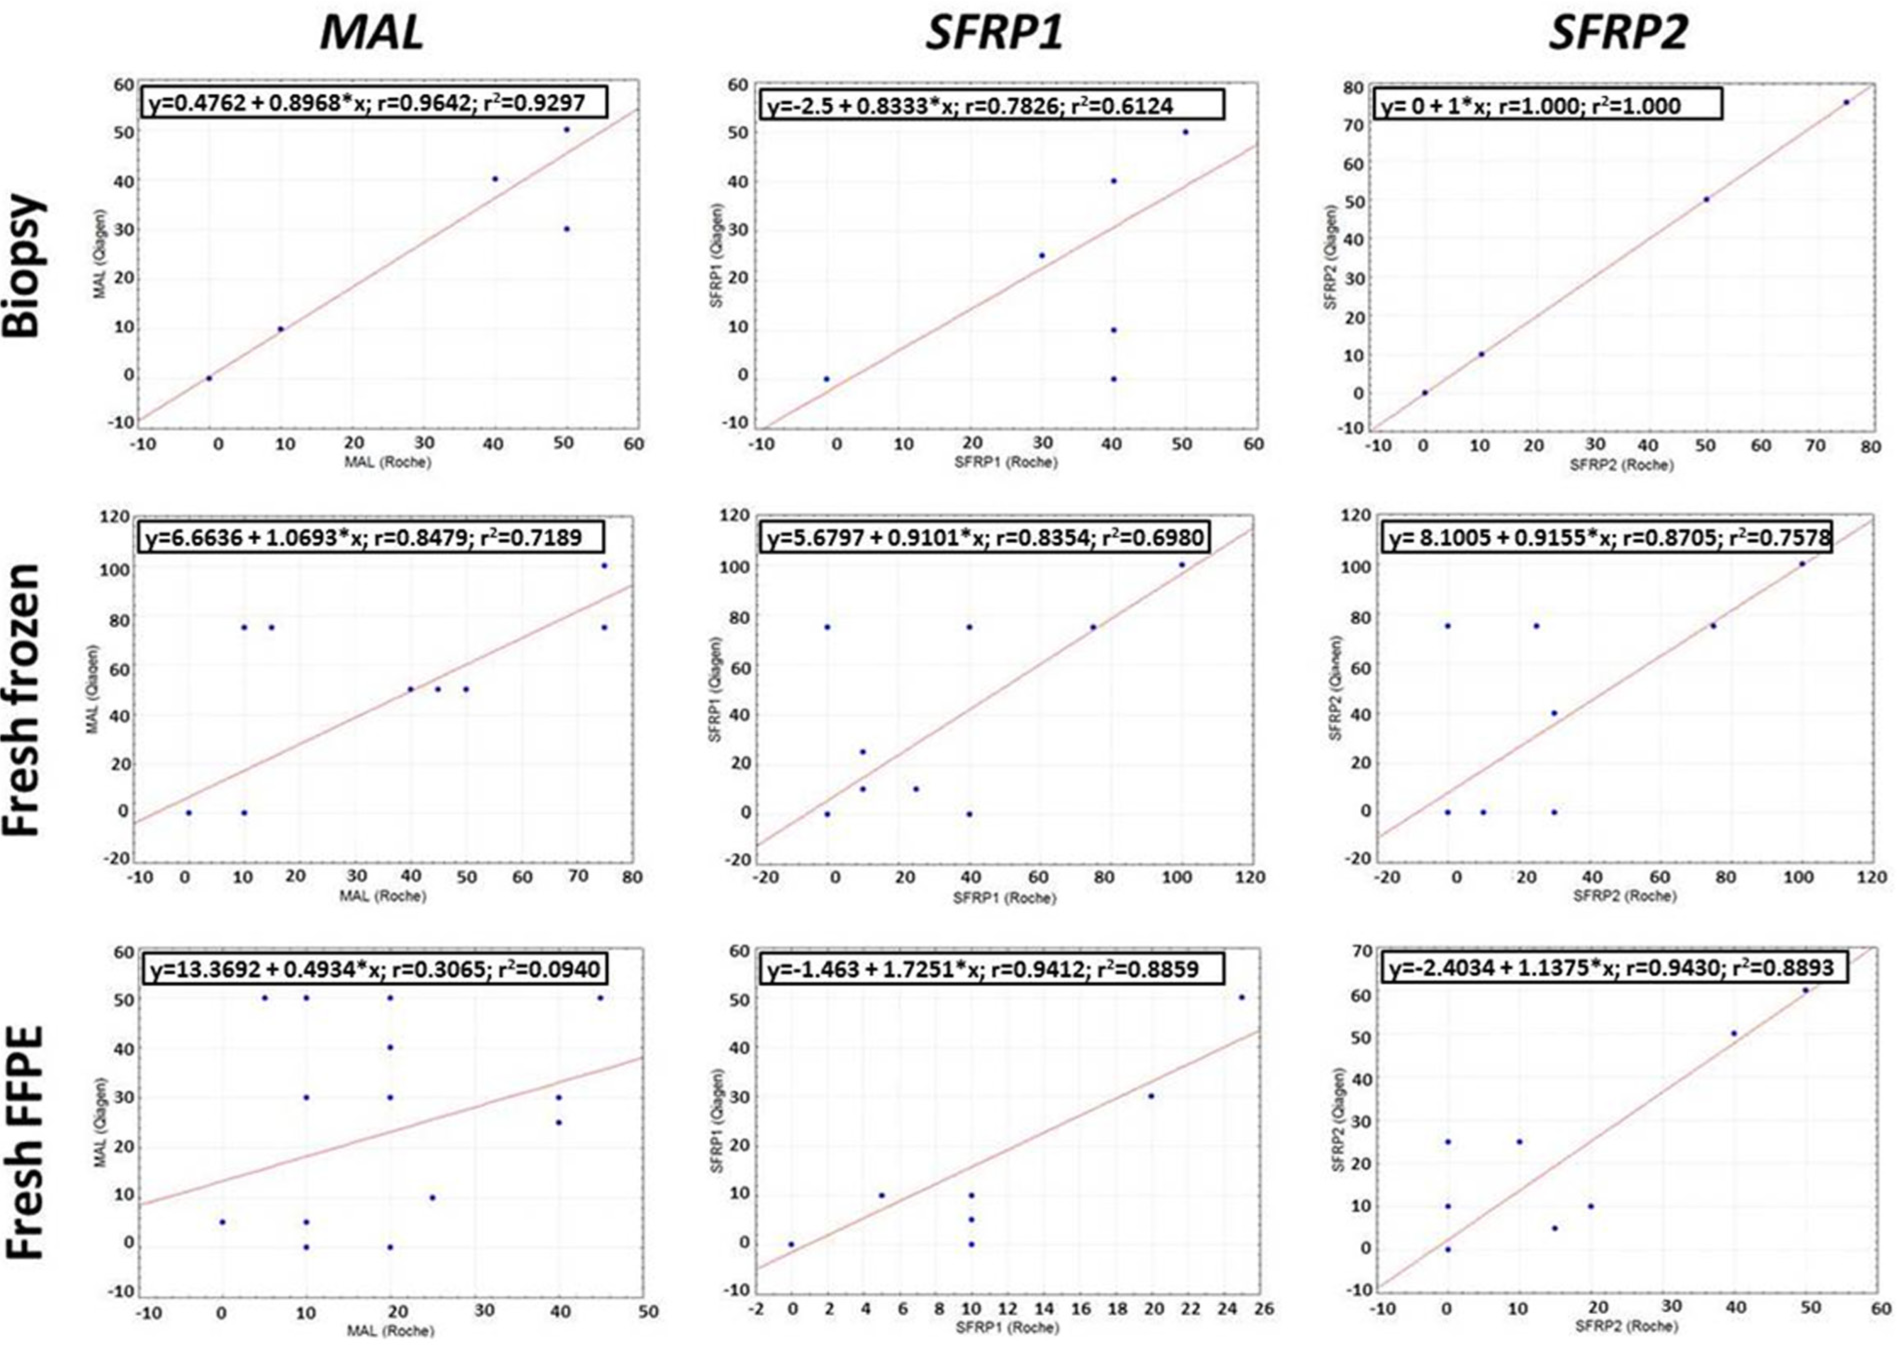
Correlation plots of DNA methylation results of biopsy, fresh frozen, and formalin-fixed, paraffin-embedded (FFPE) samples with MAL, SFRP1, and SFRP2 assays after DNA isolation with manual (Qiagen) and automated (Roche) methods. Each correlation plot represents the estimated methylation percentage results after the different isolation methods. Regression equations, correlation coefficients, and the coefficients of determination (r2) are indicated in the upper part of each correlation plot.
Discussion
The automated routine processing of tissue samples will be the key for effective sample analysis with the potential to replace the manual extraction protocols, reducing hands-on time. Besides high-throughput capacity, sufficient yield and adequate purity are necessary to perform routine downstream applications.
According to the results of the manual and the automated method comparisons, the manual method was found to be superior in terms of isolated DNA quantity and quality. The yield of automatically isolated samples was equal in fresh frozen tissue samples and significantly lower compared with the manual method in the case of biopsy and FFPE samples. This observation is in concordance with data in the literature, as another comparative study of isolation from whole blood also revealed the advantage of manual methods in terms of yield. 19 Automatic and manual methods yielded differently from certain sample types; nucleic acid recovery of the applied methods related to the starting material amount was found to be equal in fresh frozen tissue, but in biopsy and FFPE samples, the automated method demonstrated approximately 50% extraction efficiency compared with the manual method. However, all automatically isolated samples had nucleic acid content higher than 1 µg, which is sufficient for most downstream analyses. According to our results, automated isolation resulted in DNA samples with lower variation regarding yield, which is an advantage in comparison with manual extraction. The purity of the isolated nucleic acids is a parameter that has an impact on their applicability in further experiments. The majority of the isolated samples showed sufficient purity ratios after both isolation methods. OD260/280 ratios were found to be similar in fresh frozen and biopsy samples, whereas manual isolation resulted in higher purity in FFPE samples. OD260/230 ratios were similar in fresh frozen tissue samples after both isolation methods; the automated method was superior in biopsy samples and the manual protocol in FFPE samples.
Besides quantity and quality parameters, the integrity of the isolated nucleic acids will also directly affect downstream results. DNA integrity was the highest in fresh frozen samples, and half of the analyzed FFPE samples showed higher integrity after manual extraction, whereas the rest of the samples had similar integrity after both methods.
In the present study, the applicability of the isolated DNA samples was tested in DNA methylation experiments. According to our results, similar DNA methylation patterns were detected in most of the analyzed samples isolated with both automated and manual methods. In biopsy and fresh frozen samples, DNA methylation estimations were highly similar after two isolation methods, and the correlations between DNA methylation results of SFRP1 and SFRP2 after manual and automated isolations were found to be high even after using FFPE samples. The high variance of the MAL DNA methylation level in these samples together with the high background signals in the case of normal FFPE samples suggests that the BS-PCR performance and the accuracy of the MS-HRM estimation of MAL primers in our analysis were weaker than those of SFRP1 and SFRP2 primers. In fact, the MS-HRM estimation of MAL primers was less accurate according to the melting peaks of methylation standards as well. The use of assays with longer amplicon size in downstream analyses and, furthermore, the lower yield and purity of DNA samples isolated from FFPE automatically can also be challenging. In contrast, manually isolated DNA samples showed lower background signal and less variation in DNA methylation levels, suggesting their better downstream applicability.
In summary, the performance of the MagNA Pure 96 automated nucleic acid isolation system was tested on three different sample types (fresh frozen, biopsy, FFPE), and results were compared with manually isolated samples. Although manual extraction can be superior in terms of nucleic acid quantity and quality, as well as in the DNA methylation analysis of FFPE samples, the automated method also provided DNA samples isolated from fresh frozen and biopsy samples with adequate yield, purity, and quality, and the performance of the MagNA Pure 96 robot–isolated samples was found to be comparable with the manual method in the case of these sample types. Although the automated method also resulted in good yields from FFPE samples, the purity and integrity of the extracted DNA samples as well as their performance in DNA methylation experiments were found to be lower, which should be considered in the case of clinical studies, in which protocol optimization for downstream analyses might be needed when using FFPE samples. Taken together, the MagNA Pure 96 automated DNA isolation from biopsy or fresh frozen samples can be a suitable alternative to manual protocols for laboratories with high sample throughput.
Footnotes
Acknowledgements
The authors would like to gratefully acknowledge the support and assistance from Roche Diagnostics GmbH. We would like to thank Gabriella Kónyáné Farkas (Semmelweis University) for her technical assistance in the study.
Declaration of Conflicting Interests
The authors declared no potential conflicts of interest with respect to the research, authorship, and/or publication of this article.
Funding
The authors disclosed receipt of the following financial support for the research, authorship, and/or publication of this article: This study was supported by the National Office for Research and Technology, Hungary (TECH_08-A1/2-2008-0114 grant).