
Abstract
This study illustrates how optimization of both liquid-handling accuracy and precision is critical to assay performance. The study was designed to examine (1) liquid-handling performance and (2) the effect of liquid-handling variability on two types of in vitro biochemical assays by making small but deliberate changes to assay volume delivery. Specifically, protein binding (streptavidin) and enzyme (α-galactosidase) assays were investigated by determining the effect of assay volume for each assay component. The concomitant effect of the liquid-handling variability was then measured via inhibitor potency and assay performance characteristics such as Z-factor, signal-to-background, and variability. It was found that small changes in assay component volumes were indeed measurable by potency (IC50) but not necessarily by assay variability (Z-factor). In fact, this study demonstrates how a miscalibrated liquid handler can lead to erroneous data.
Introduction
The current cost to bring a new drug to market is estimated to be $800 million—$1 billion per new molecular entity, with an accompanying process that can take 10 to 15 years. 1 The continual rise of drug prices and increased public scrutiny of pharmaceutical companies highlight the need for streamlining drug discovery operations. Advances in laboratory automation, including automated liquid handlers, new labels, faster detectors, parallel screening, or multiplexed approaches, have allowed high-throughput screening (HTS) processes to evaluate a large number of compounds rapidly as potential drug candidates.
Cost reductions in drug discovery have been achieved primarily through automation and miniaturization. Although assay miniaturization has continued to evolve since the 1990s (e.g., microfluidics, well-less plates, gels, and tape arrays), the standard method for screening uses microtiter plates in which total assay volumes have stabilized in the 10 µL range. 2 In addition, several screening strategies have evolved toward improving lead discovery efficiency. The first involves interrogating diverse libraries approaching 1 million compounds using miniaturized screening technologies such as 1536-well microtiter plates or other higher density formats. The second strategy consists of screening smaller, targeted libraries containing tens of thousands of compounds using 384-well microtiter plates. A third strategy is an iterative approach whereby small subsets of random compounds are screened then computationally sorted for selection of the next round of compounds. A fourth, less popular strategy involves screening pools of compounds followed by deconvolution of active mixtures. 3
In addition, many groups take advantage of nanoliter dispensing technologies (e.g., pin tools, acoustic dispensing, PocketTip, etc.), allowing transfer of neat compound directly into assay plates, obviating an intermediate dilution step.
Another strategy to improve efficiency is through development of an effective quality control program. A large component of an effective quality control program focusses on liquid handling, because it is such an integral part of the drug discovery process and is involved in every stage of drug development. By implementing a robust liquid-handling quality control program, drug discovery laboratories can build quality into their processes,4–11 decrease the overall cost by improving quality of data, 12 and shorten the drug discovery timeline as a result of reducing repeat testing or chasing false leads.
Several technologies used in automated liquid handler performance verification have been reported in the literature. For example, there are many in-house–derived methodologies taking advantage of absorbance properties of tartrazine 13 or a combination of dyes. 14 Fluoresence-based methods using fluorescein, 15 Alexa Fluor 488, 11 Oregon green, 16 rhodamine green, 17 or sulforhodamine 1018 are also very popular and sensitive enough to measure volumes in the nanoliter range. Although these in-house–derived liquid-handling quality control methodologies are good at measuring precision, the main challenge is measuring volume transfer accuracy with a high level of certainty. Gravimetric analysis has been reported,13,14 but it is typically not automated because of complexities of measuring multichannel device performance. The only commercial example that addresses both precision and accuracy in multichannel liquid-handling devices with known certainties uses a dual-dye spectrophotometric approach. 18
Of the major sources of assay variability—detection, liquid handling, biology, and random error—liquid-handling error is quantifiable, yet it is often underappreciated.19,20 In fact, the common practice in most HTS labs is to assess system performance by relying on only precision.
To design effective quality control programs, it is essential to understand where and how liquid-handling equipment is used throughout a campaign. For example, automated liquid handlers are used in initial compound preparation by dissolving a known amount of compounds with a known amount of solvent, stock reagent solution preparation, intermediate reagent dilution, and assay assembly (compounds, protein, substrate/ligand, cofactors, stop solution, etc.) during screening campaigns. There is potential for volume error at each step, which can propagate into highly variable data. Most primary screens consist of measuring compound activity against a biological target in singlet at one concentration. Combining the sources of variability, the confirmation rate for compounds identified in HTS campaigns are typically 30% to 80%.21,22
The next consideration is how a compound transitions from one phase to another. For example, a progressively smaller group of compounds is moved through each stage of the drug discovery process: from thousands of hits in HTS to hundreds of leads in lead optimization to less than 10 candidates. At each subsequent stage, compounds are tested more rigorously to determine their safety, efficacy, and feasibility for drug manufacture, which amplifies the cost of aberrant data.
It is also important to note that each time compounds are moved from one drug discovery stage to the next, an assay transfer takes place. Assay transfers are rarely seamless and often cause process delays lasting weeks or months. Time wasted identifying the cause of a failed assay transfer can offset productivity gains realized by automation. Ultimately, proper automated liquid handler calibration is necessary for efficient assay transfer points, such as from assay development to automation validation, primary screening to confirmation screening, lead generation to lead optimization, or simply replacing one liquid handler with another if failure occurs during a campaign.
The liquid-handling component of the overall assay variability is often underappreciated or ignored yet can have a significant impact on the outcome of an assay. Many laboratories rely on precision alone to estimate the quality of the liquid handling. However, this study illustrates how optimization of both liquid-handling accuracy and precision is critical to assay performance. The study in this report was designed to examine liquid-handling performance and determine the effect of liquid-handling variability on in vitro biochemical assays. Specifically, protein binding (streptavidin) and enzyme (α-galactosidase) assays were investigated by making small and deliberate changes to delivered volumes of critical assay components. The effect of the liquid-handling variability was then measured via inhibitor potency and assay performance characteristics such as Z-factor, signal-to-background, and variability.
Materials and Methods
Evaluation of Liquid Handler Quality Control Method and Performance
The MVS Multichannel Verification System (Artel, Westbrook, ME) was chosen as the tool for evaluating liquid-handling performance because it is easily adaptable to automated liquid-handling systems and it effectively determines both precision and accuracy. Furthermore, Artel Verification Plates were compared to four alternative 96-well clear-bottom plate types from other sources, which are typically used as alternatives in liquid-handling quality control: Corning No. 3651 (Corning, Corning, NY), Costar No. 3615 (Corning), Nunc No. 265300 (ThermoScientific, Waltham, MA), and Greiner No. 655096 (Greiner BioOne, Germany). The quality control method consisted of dispensing 10 µL, 20 µL, or 50 µL of Reagent B Sample Solution (Artel) into empty wells of a 96-well plate using a Precision XS microplate sample processor (BioTek U.S., Winooski, VT). Each well was then filled with Diluent Solution (Artel) to a total of 200 µL in each well. The plates were mixed for 1 min at 1500 rpm on a Bioshake 3000 (Q.Instruments, Jena, Germany) prior to reading absorbance at 520 nm and 730 nm using the accompanying, calibrated Artel ELx800 NB plate reader. The dispense volume was then calculated using the dual-dye ratiometric methodology previously described, 18 whereby the two absorbance readings are applied to Equation 1:
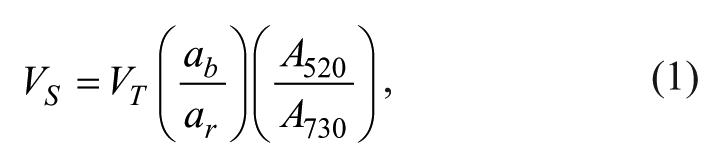
where VS is sample volume and is determined by measuring absorbance at 520 nm (A520), VT is well liquid volume and is determined by measuring absorbance at 730 nm (A730) and considering the well geometry, and ab and ar are predetermined absorbance coefficients for the sample solution and diluent, respectively.
Effect of Liquid-Handling Variability on Assay Performance
Two model assays were developed and validated on a 96-well platform, in which known inhibitors were used to monitor the effect of liquid-handling variability. The first assay was based on the binding protein streptavidin and its strong binding affinity toward biotin and derivatives of biotin. In this assay, 23 biotin-4-fluorescein (Sigma No. B9431, St. Louis, MO) binds to streptavidin (from Streptomyces avidinii; Sigma No. S0677), a tetravalent binding protein with high affinity. Upon binding, the fluorescence is quenched. Fluorescence signal is restored when competitive inhibitors bind to the biotin binding sites on streptavidin. Several competitive inhibitors were studied, including biotin (Sigma No. B0301), N-(+)-biotinyl-6-aminohexanoic acid (Fluka No. 14407), 2-iminobiotin (Sigma No. I4632), and d-desthiobiotin (Sigma No. D1411). All inhibitor stocks were prepared as 10 mM compounds dissolved in DMSO (Fisher Scientific, Fairlawn, NJ). The assay and all subsequent dilutions were carried out in phosphate-buffered saline, pH 7.2, containing 0.1% bovine serum albumin (BSA). The basic assay scheme was add 25 µL of biotin-Fl (labeled ligand), 25 µL of inhibitor, followed by 25 µL of streptavidin. The assembled assay plates were shaken for 1 min and then incubated at room temperature for 1 h. The final concentrations of biotin-Fl and streptavidin were 30 nM and 7 nM, respectively. Fluorescence measurements were carried out on a Synergy 4 multimode plate reader (BioTek) with excitation at 485 nm and emission at 515 nm.
The second assay was based on the enzyme α-galactosidase. 24 In this assay format, α-galactosidase (from green coffee bean; Sigma No. 8507) converts a labeled substrate, 4-methylumbelliferyl-α-D-galactopyranoside (Sigma No. M7633), into fluorescent methylumbelliferyl product. In the presence of inhibitor, the signal is quenched in a manner proportional to concentration of inhibitor.
Stocks of known competitive inhibitors including N-butyldeoxynojirimycin (Sigma No. B8299), deoxygalactonojirimycin hydrochloride (Sigma No. 9641), and 1-deoxymojirimycin hydrochloride (Sigma No. 9305) were prepared in DMSO to 10 mM. The reaction buffer consisted of 50 mM citric acid, pH 4.5. Reactions were allowed to proceed at room temperature for 40 minutes, followed by addition of a stop buffer containing 100 mM glycine, pH 10.8. Fluorescence detection was accomplished by exciting at 338 nm and monitoring emission at 365 nm. The α-galactosidase assay scheme was add 25 µL of substrate, 25 µL of inhibitor, followed by 25 µL of α-galactosidase and stopped by addition of 125 µL stop reagent.
Assay component volumes for both assays were then intentionally varied by approximately ±10% according to Table 1 , where the volumes were confirmed by the Artel MVS. In this experimental design, plate 1 represented the ideal scenario, where 25 µL of labeled ligand or substrate, 25 µL of inhibitor compound, and 25 µL streptavidin or α-galactosidase were used. All other combinations of respective volumes were chosen in a pseudo design of experiment (DOE) approach.
Experimental layout showing which volumes of each assay component were varied.
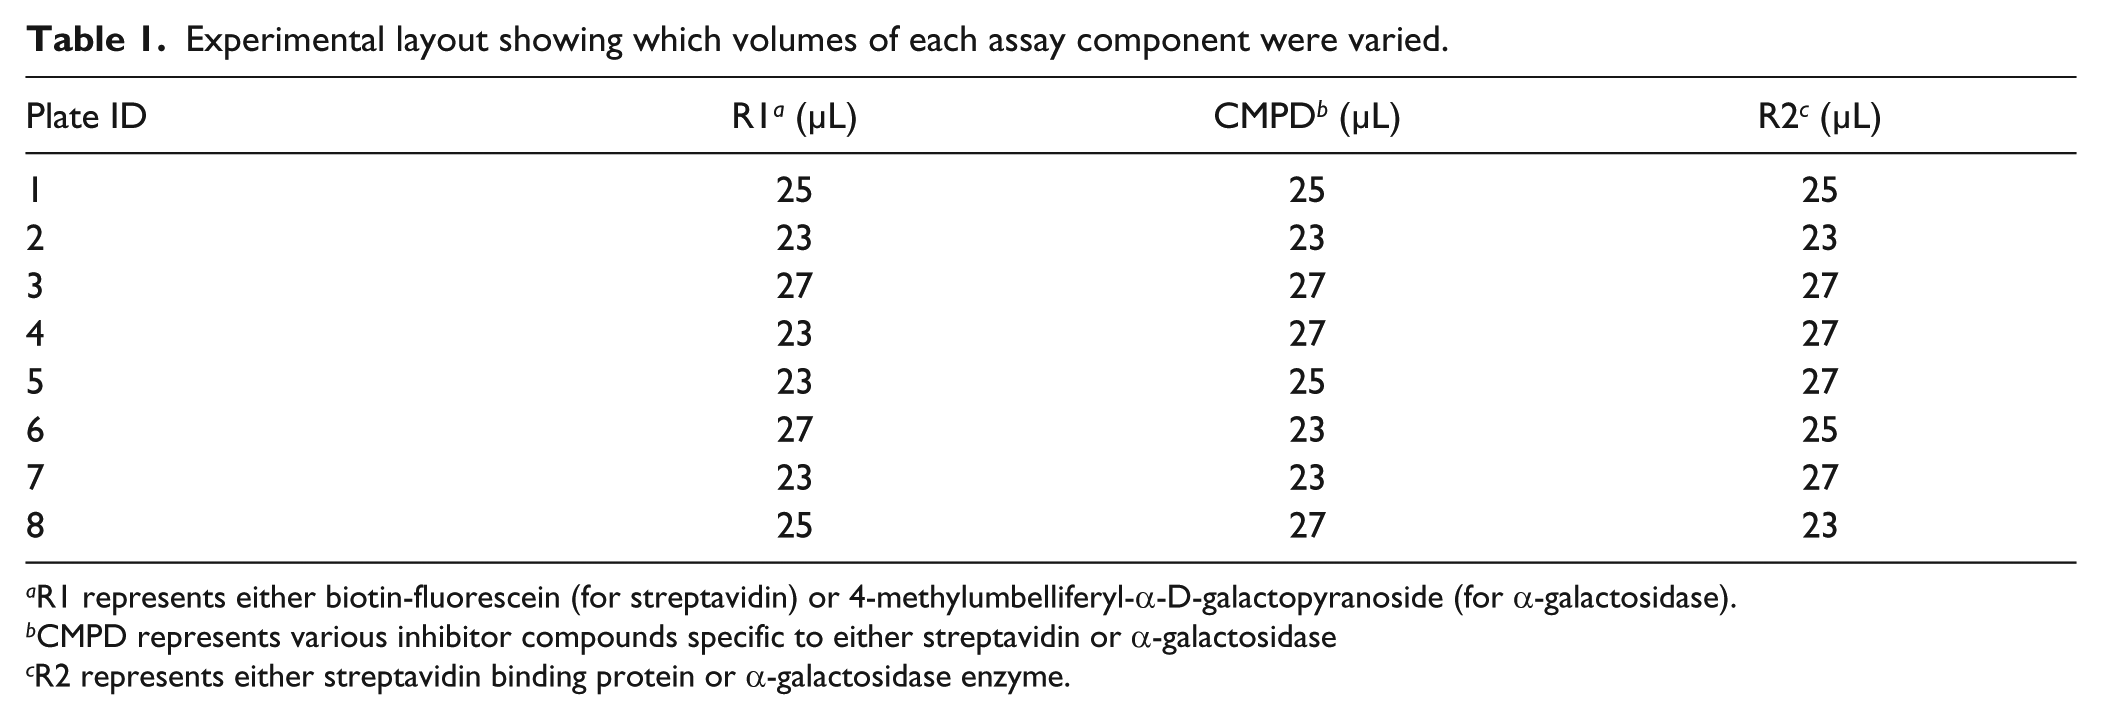
R1 represents either biotin-fluorescein (for streptavidin) or 4-methylumbelliferyl-α-D-galactopyranoside (for α-galactosidase).
CMPD represents various inhibitor compounds specific to either streptavidin or α-galactosidase
R2 represents either streptavidin binding protein or α-galactosidase enzyme.
Assay Development and Validation
Streptavidin and biotin-Fl assay concentrations were selected by first diluting biotin-Fl until at least the limit of quantitation (10× signal-to-noise ratio) was attained, then by titrating streptavidin until the minimal amount of that produced a saturated signal. BSA was used in the reaction buffer to prevent streptavidin from binding nonspecifically to the plate. Once the appropriate concentrations were determined, variability studies were conducted using three different liquid handlers: manual 8-channel Finnpipette F2 (Thermo Scientific), MicroFlo Select (BioTek) peristaltic dispenser, and Precision XS automated pipetting station (BioTek).
Initial α-galactosidase assay conditions were selected by first determining Michaelis-Menten kinetics. Initial rates were determined by exposing 1 mU/mL of α-galactosidase to various substrate concentrations. In addition, two pHs (5.9 and 4.5) were evaluated and compared. Once the Km and Vmax enzyme parameters were calculated using nonlinear regression using GraphPad Prism 6 (GraphPad Prism Software, La Jolla, CA), the substrate concentration was fixed at 100 µM.
For both assay systems, variability was assessed by calculating average, standard deviation, coefficient of variation, signal/background, and Z-factor from replicates of minimum and maximum signal.
Potency Determinations
All inhibitor compounds were serially diluted threefold in replicate starting at 100 µM to yield 10-point dilution curves, and the reactions were analyzed by fluorescence detection. The signals were plotted against log concentration, and the resulting inhibition curves were analyzed using the “log(inhibitor) vs. response – Variable slope (four parameters)” preloaded nonlinear regression model within GraphPad Prism 6, which is fit to “Y=Bottom + (Top-Bottom)/(1+10^((LogIC50-X)*HillSlope)).” The resulting IC50s (potencies) were compared across the various liquid dispense volumes for each compound. Compounds with a range of potencies against either streptavidin or α-galactosidase were chosen.
Results and Discussion
Evaluation of Liquid Handler Quality Control Method and Performance
Because the goal of this work was to examine the effect of precision and accuracy on assay performance, it was critical to understand the liquid handler quality control methodology. As described previously, the MVS Multichannel Verification System was chosen as the quality control methodology because it easily determines both precision and accuracy and it already has a predetermined level of uncertainty around measurements. Although the system is calibrated to the strictest level, users can still substitute different plate types for what is recommended by the vendor. Therefore, this study, in part, was designed to examine the impact of using various plate types for liquid-handling performance verification. Artel Verification Plates were compared to four alternative off-the-shelf 96-well clear-bottom plate types from other sources. These plates represent plate types commonly found in HTS laboratories.
Three different volumes (e.g., 10 µL, 20 µL, and 50 µL) of Artel Range B Sample Solution were dispensed by the Precision XS system across all 96 wells of each plate type. Diluent was then added to each well for a final volume of 200 µL, followed by proper vortex mixing as recommended by the manufacturer. It is important to note that the order of Artel reagent addition approximated the actual assay as closely as possible. In the case of this study, smaller-volume reagents were added first followed by larger-volume reagent addition, which aids in mixing. On the other hand, if assay components were added by something other than an air displacement pipette (e.g., a pintool device 25 ), then one would prefill the Artel Verification plates with diluent prior to adding nanoliter volumes of Sample Solution. Critical to the success of a liquid-handling quality control program are to understand how the liquid handler performs on its own as well as in the context of the complete assay, including time, temperature, mixing, and so forth.
As Figures 1A-C show, there are differences in measured dispense volumes across the various plate types. Considering the same liquid handler dispensed the same Range B Sample Solution and all plates were read on the same absorbance reader, any accuracy and precision differences are due solely to the plate type. It is worth noting that both the precision and accuracy are best when using the Artel Verification plates, which makes sense because of the careful plate dimension measurements that the Artel uses in its volume calculations. Further, although liquid-handling verifications can be performed with alternative plates, accuracy can be measurably affected. This is especially important if different plate types are used to determine performance characteristics for different liquid handlers among different laboratories. These data demonstrate that the use of noncharacterized plates can lead to liquid handler miscalibration by as much as 10% depending on which plate type is used.
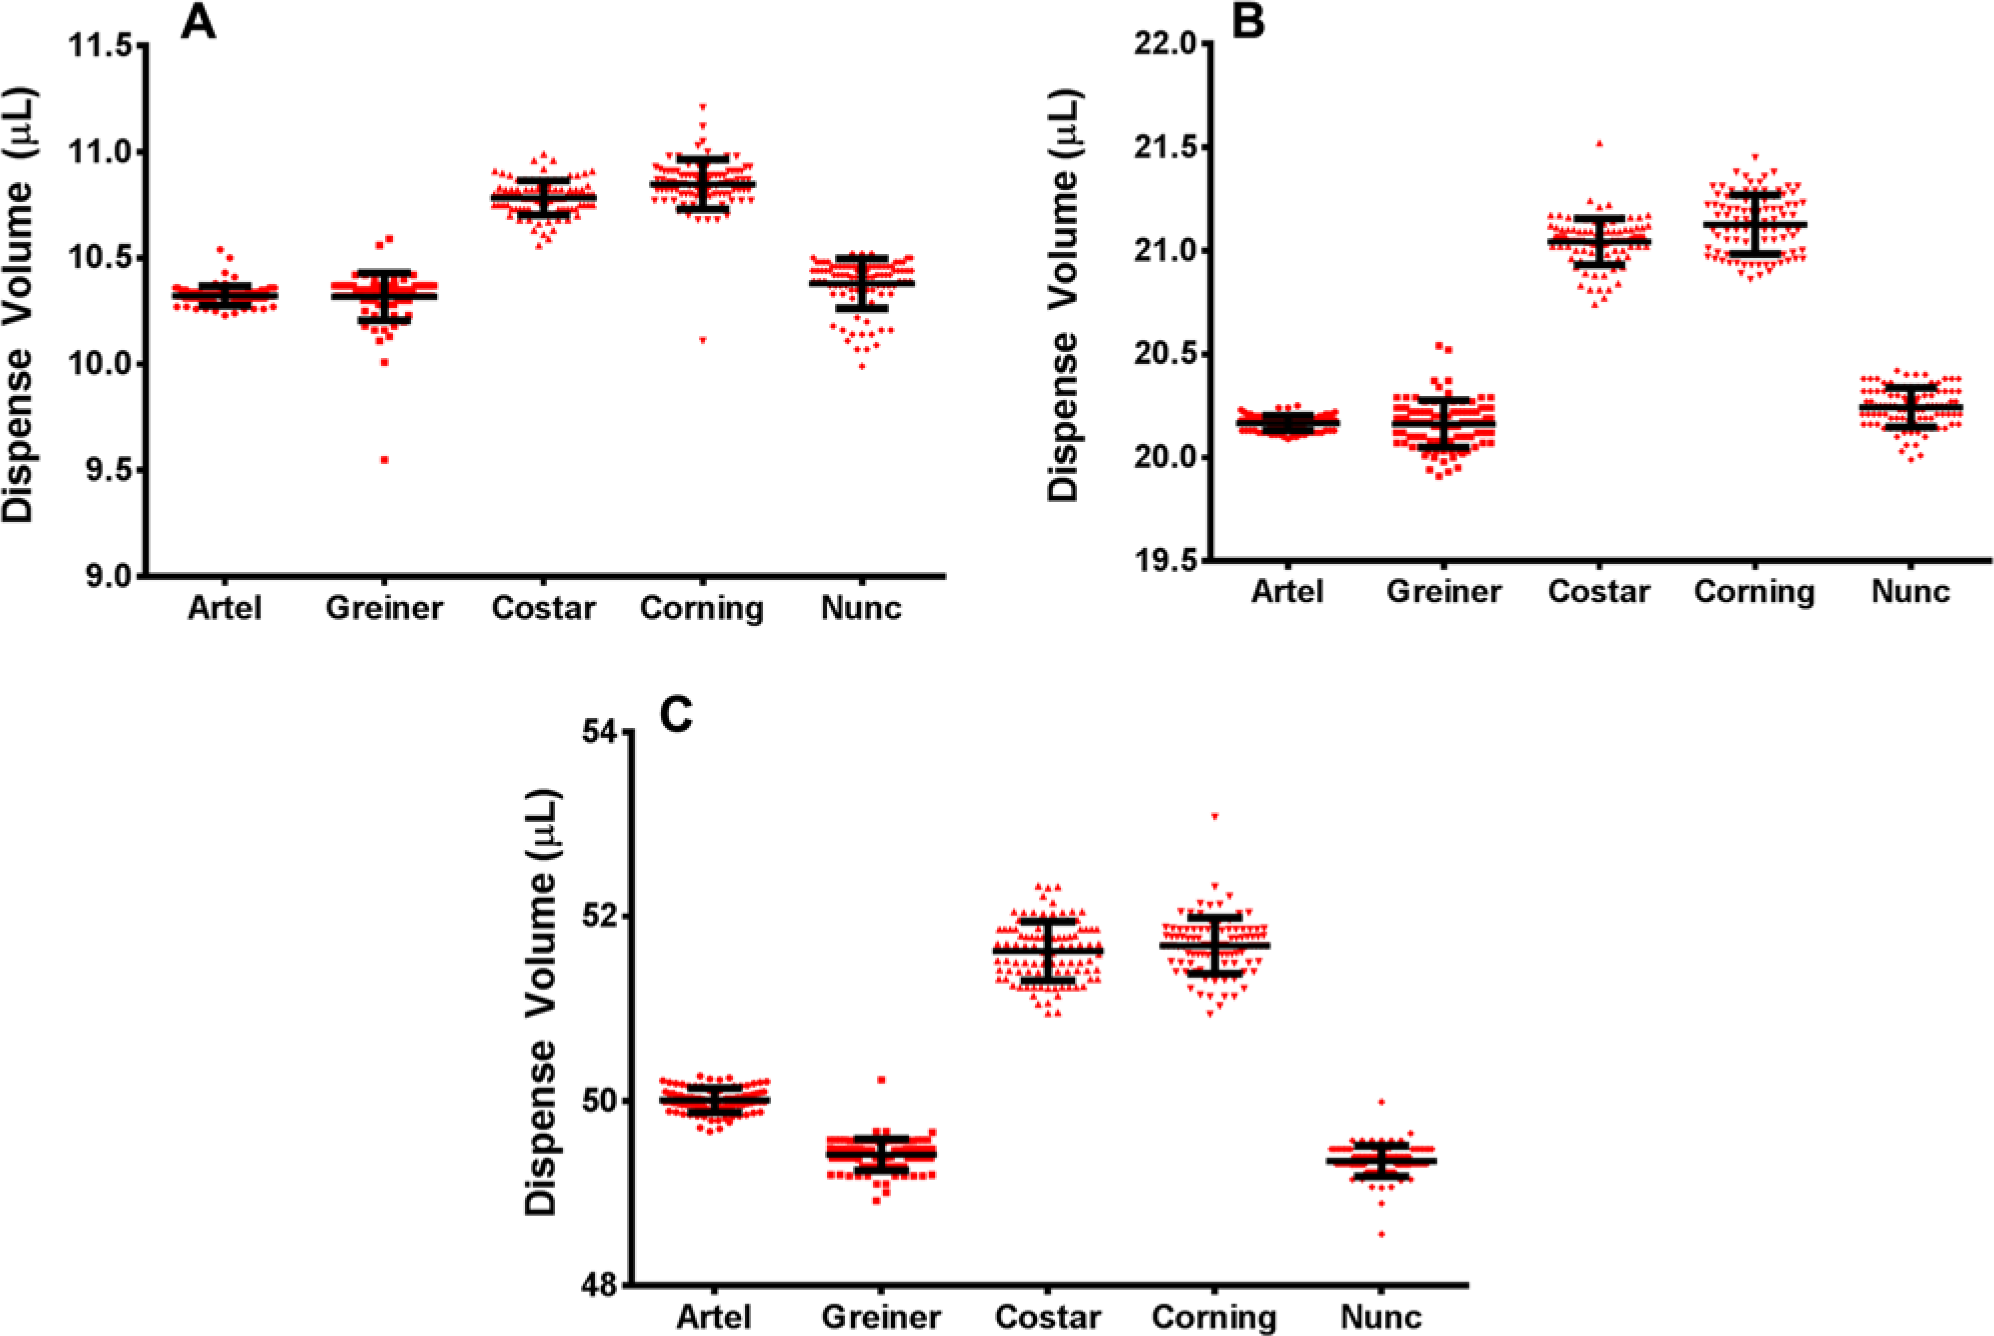
Effect of plate type on dispense volume accuracy and precision: (
Finally, the relative inaccuracy and coefficient of variation were determined to be 0.85% and 0.20%, respectively, for the Precision XS delivering a volume of 20 µL.
Effect of Liquid-Handling Variability on Assay Performance
Protein Binding Model Assay
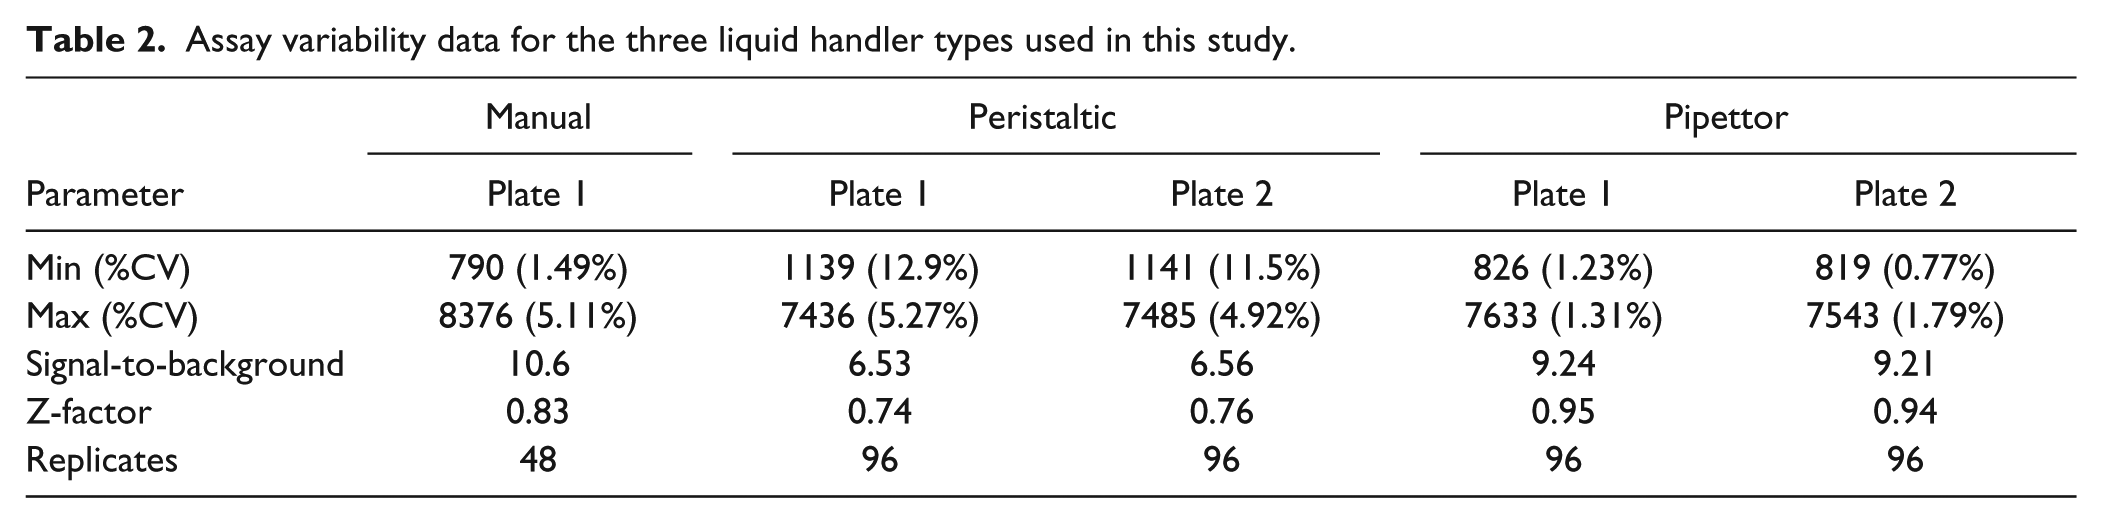
The concentrations of biotin-Fl and streptavidin were optimized to 30 nM and 7 nM, respectively, where the ratio of ligand to protein indeed correlates to the number of binding sites (four) inherent to streptavidin. Full plate variability studies were then conducted to assess performance of the various multichannel liquid handlers: manual (Finnpipette), peristaltic (MicroFlo), and pipette (Precision XS). As Table 2 illustrates, the same assay conducted on three different liquid handlers yielded three different sets of results in terms of accuracy and precision. It should be noted that each of the liquid handlers was used as is out-of-the-box and that all three performed as designed by the manufacturer. In particular, the Precision XS performed the best in terms of assay precision, with a Z-factor of >0.94. Furthermore, and as shown in Figure 2 , there is little or no drift across or down the plates. Because the intent of this research was to compare inhibitor potencies by intentionally changing dispense volumes, dispense precision was a critical parameter. Therefore, the Precision XS was used for the remainder of the study.
Assay variability data for the three liquid handler types used in this study.
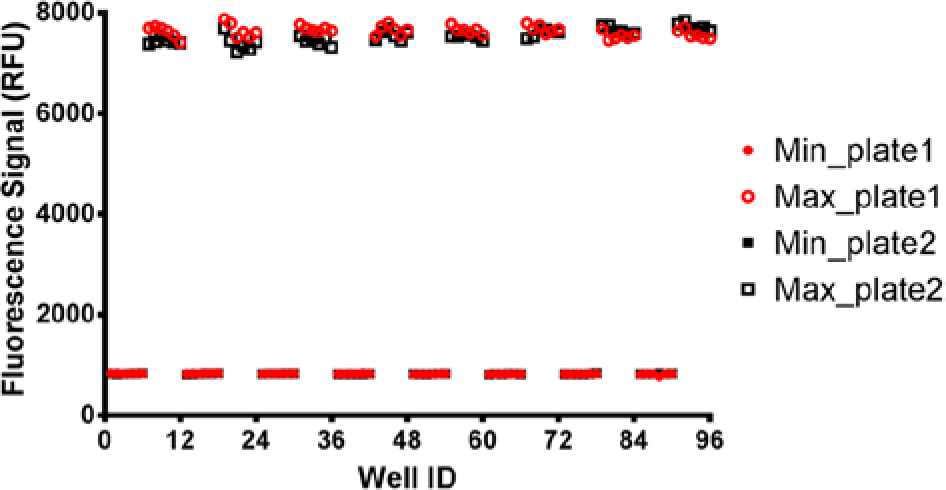
Inter- and intraplate variability for streptavidin binding assay. The assay was assembled by a Precision XS automated liquid handler.
In an effort to determine whether volume inaccuracy can affect the results of a high-throughput screen, a model protein binding assay was chosen whereby a fluorescein-labeled biotin (biotin-Fl) competes with several biotin analogs for binding on streptavidin. Upon binding to streptavidin, the fluorescence signal of biotin-Fl is quenched. During a competitive binding event, the fluorescence signal of biotin-Fl increases in a manner directly proportional to the inhibitor concentration.
Several biotin analogs, known to bind competitively to the streptavidin binding sites, were used in a confirmation assay format by performing threefold serial dilutions in 10-point dilution curves for each compound in quadruplicate. The IC50 (or potency) was then determined to compare the effect of small but intentional changes in liquid dispense steps (refer to Table 1 ). The volumes of each reagent addition were chosen to reflect the volume discrepancy (±10% of the desired volume) that might result from a miscalibrated liquid handler. In this case, Plate 1 represents the desired volume of 25 µL for each of the three assay components.
Biotin inhibitors with a range of potencies yielded noticeable and calculable differences in assay performance and potency ( Fig. 3A–D ). The assay performance and compound potency values are summarized in Table 3 , whereby the common plate statistics and compound potency values are compared across the various assay component volumes. By looking only at plate statistics, the only parameter to yield a noticeable difference due to liquid handler variability is the plate maximum (Max), whereas the signal-to-background and Z-factor are relatively unaffected. On the other hand, it is clear that compound potency is affected as a function of assay component volume. In the cases of lower potency inhibitors, the Δ potency (as defined by the maximum average potency – minimum average potency across plates 1–8) was 4573 nM. In fact, even the higher potency inhibitors yielded measurable D potencies.
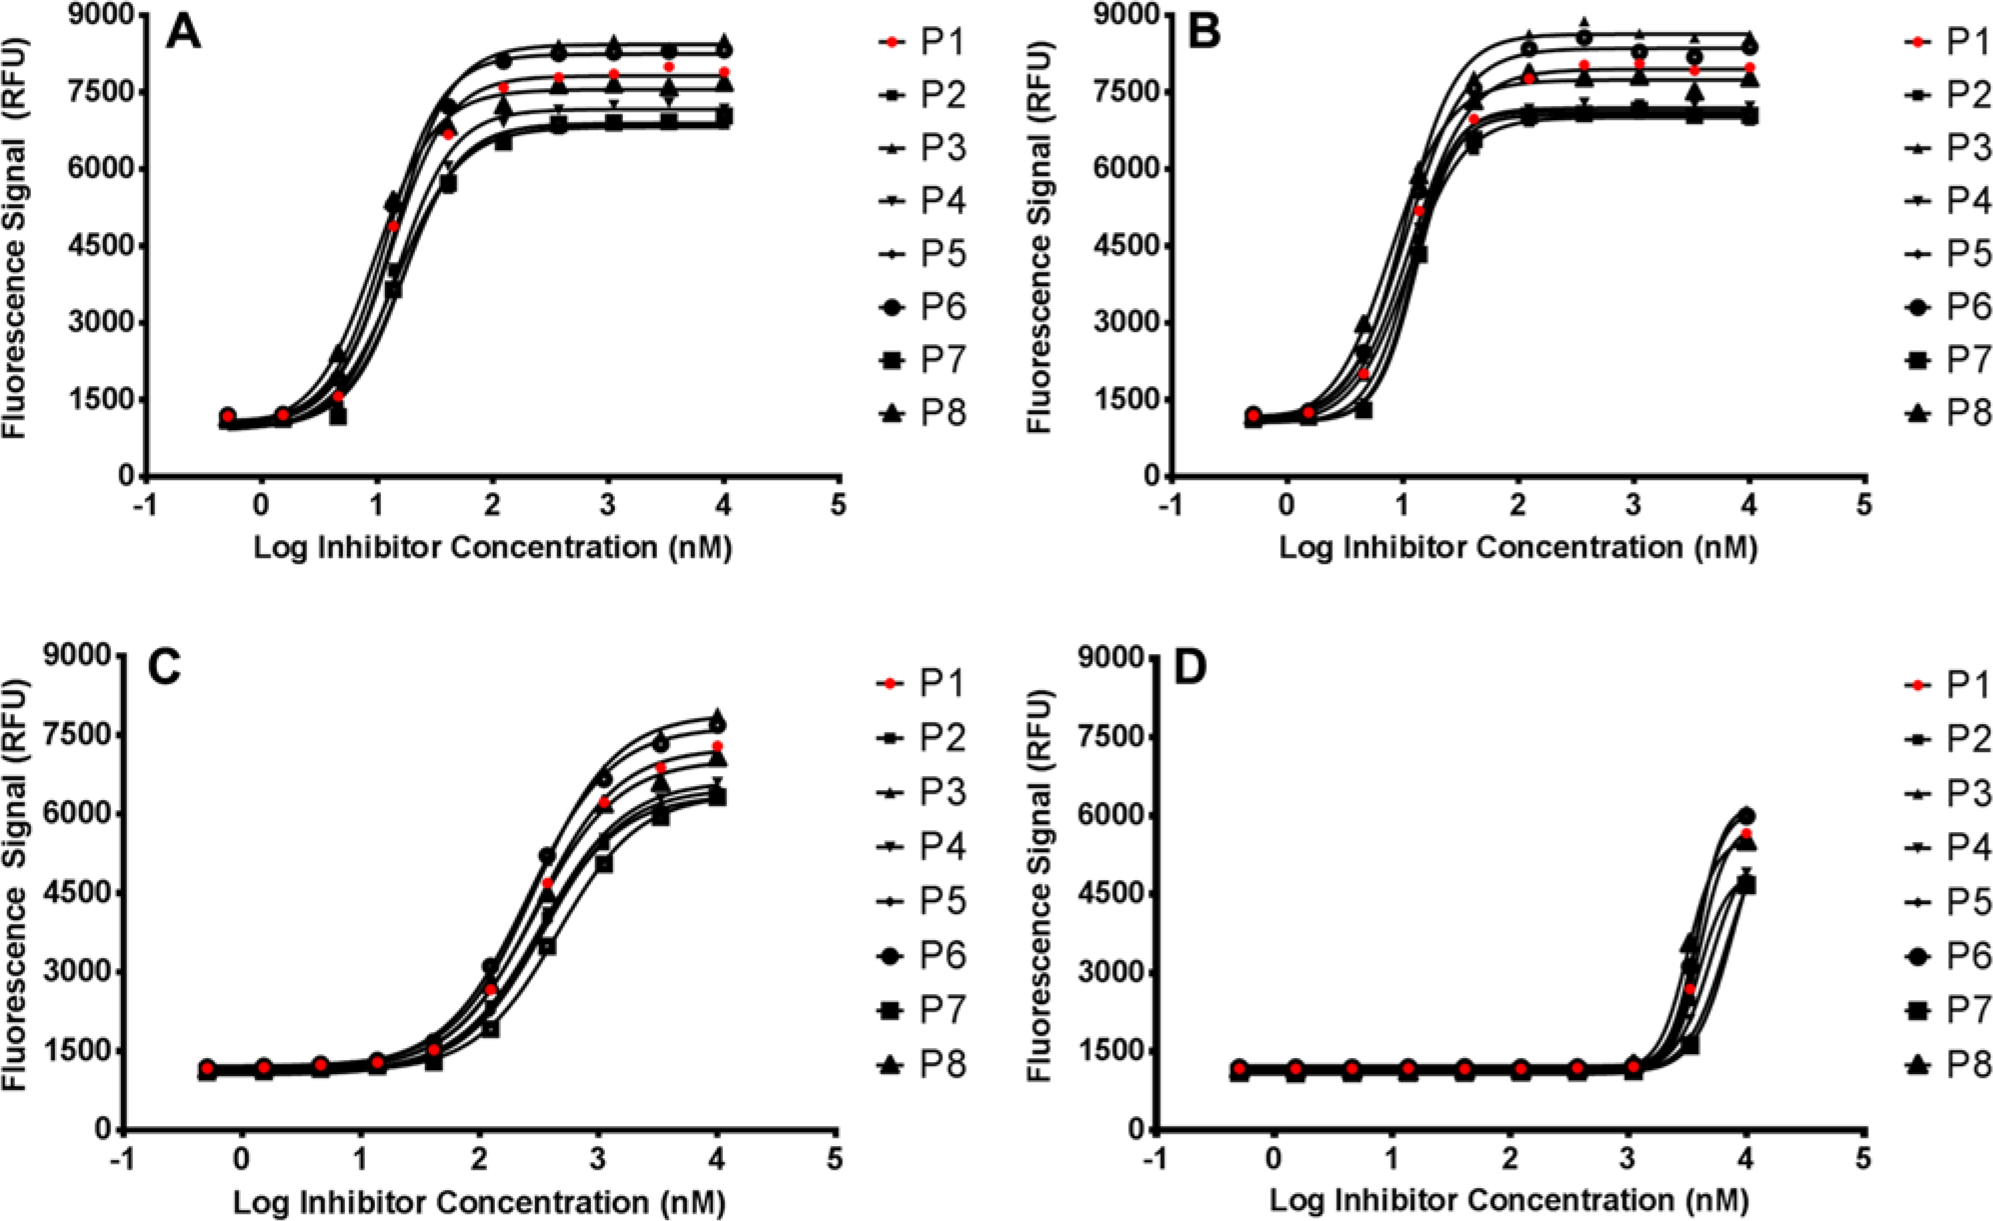
Effect of liquid-handling accuracy on the potency of (
Results summary for the streptavidin binding assay.
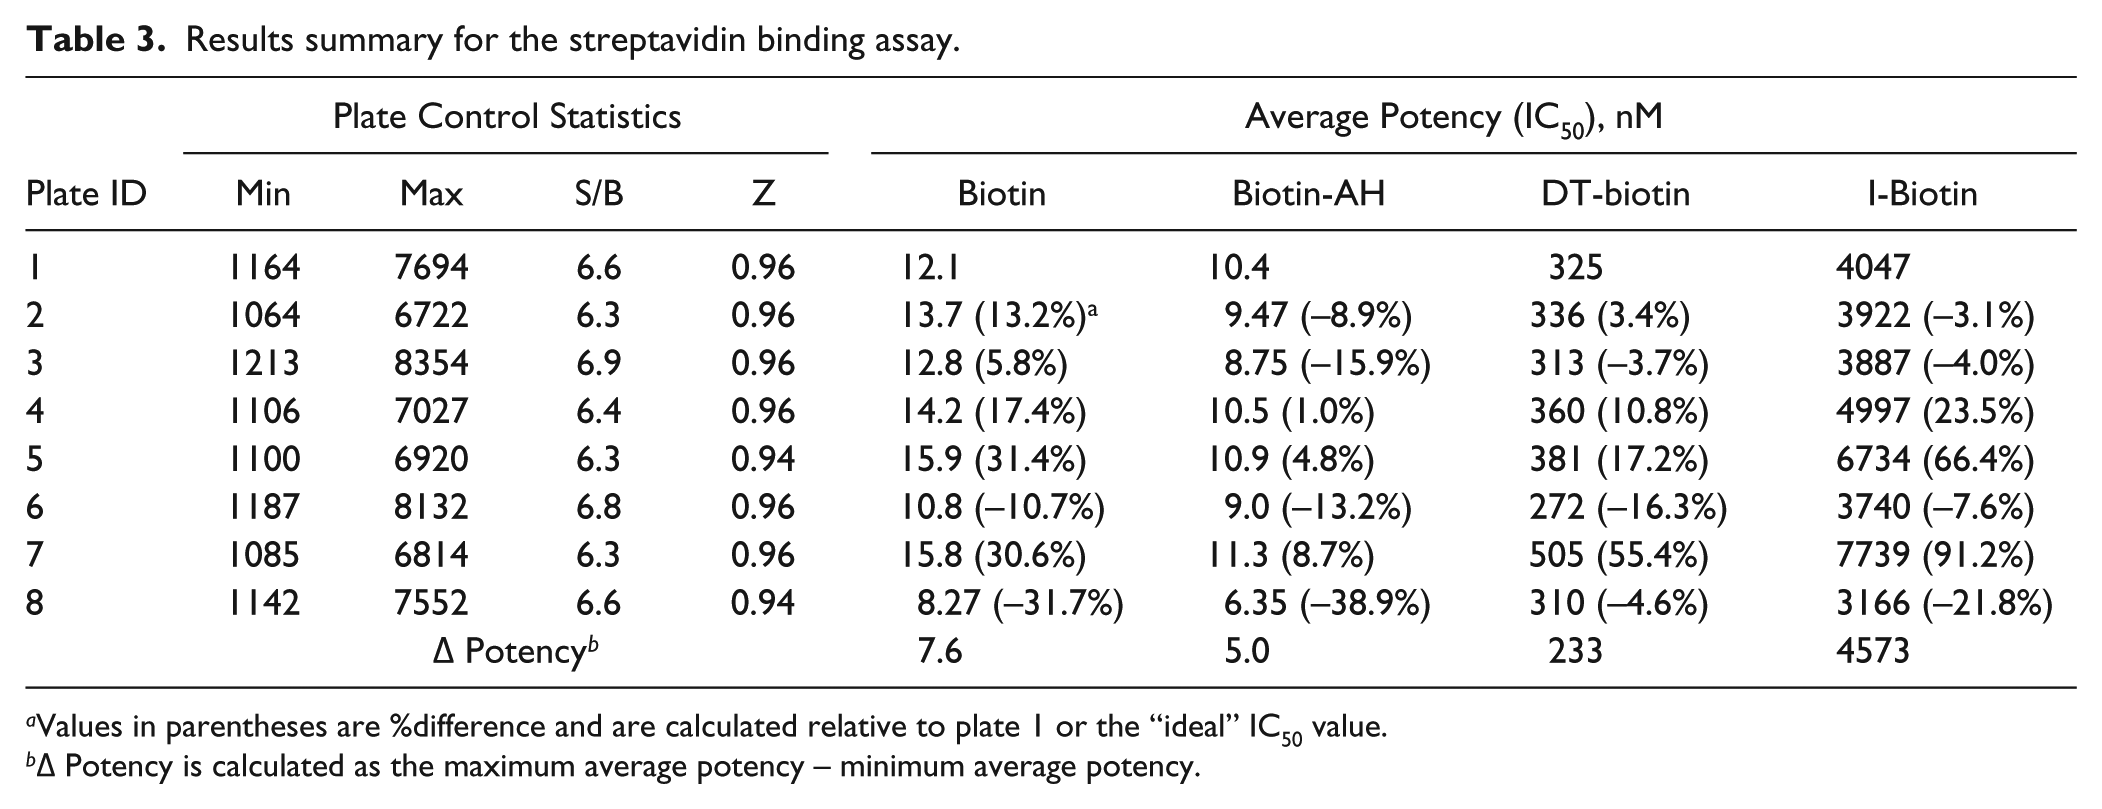
Values in parentheses are %difference and are calculated relative to plate 1 or the “ideal” IC50 value.
Δ Potency is calculated as the maximum average potency – minimum average potency.
Enzyme Inhibition Model Assay
As an additional verification on the hypothesis that liquid handler accuracy directly affects the quality of an assay, another mechanistically different assay was used in the same manner as the binding protein model assay. In this case, an enzyme-substrate system was chosen in which the biochemical mechanism is completely different from the simple protein-ligand binding. α-Galactosidase was chosen because the enzyme is readily available and very stable. Is this assay, the substrate, 4-methylumbelliferyl-α-D-galactopyranoside, is cleaved by α-galactosidase into a base sugar and fluorescent product. Upon inhibition, the signal decreases proportionally to concentration or potency of inhibitor.
Assay development consisted of determining Michaelis-Menten kinetics in two different reaction buffers: pH 4.5 and 5.9. Both reaction buffers have been reported in literature,24,26 but the buffer at pH 4.5 was clearly optimal for this study. As depicted in Figure 4 , α-galactosidase had similar Km values (177 µM vs. 173 µM for pH 4.5 and 5.9, respectively), but the Vmax for pH 4.5 was nearly 4.5 times greater than that for pH 5.9. Therefore, a pH of 4.5 for the reaction buffer was chosen for the remainder of the study. The assay was formulated such that 25 µL of buffer/inhibitor was added to 25 µL of substrate, followed by a 25-µL addition of α-galactosidase. The reaction was allowed to proceed at room temperature for 40 min, followed by addition of 125 µL of stop reagent. For the purposes of this study, only the reaction reagents were varied to simulate inaccurate volume calibration. The volume of stop reagent was not altered. Using the ideal conditions, the typical minimum-maximum (Min-Max) signal study was carried out whereby the assay was repeated in triplicate across separate full-plate experiments. The average Z-factor was >0.93 for the Min-Max study (data not shown).
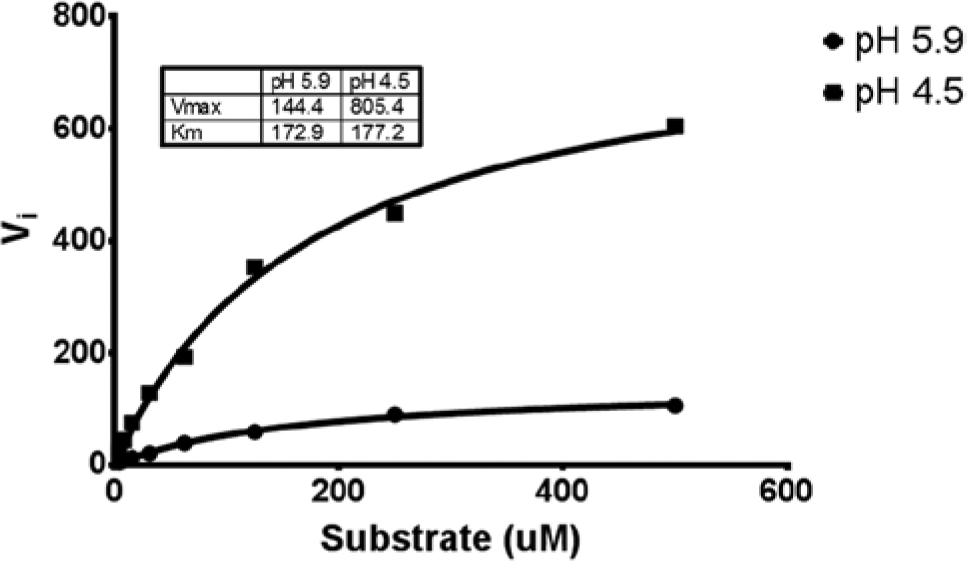
Michaelis-Menten kinetics for α-galactosidase (0.001 U/mL). Kinetic parameters were determined for reaction buffers at pH 4.5 and 5.9.
Similar to the protein binding study, compounds with known or suspected inhibitory activity against α-galactosidase were tested in confirmation assays by performing threefold serial dilution in 10-point dilution curves. Then small but deliberate changes to the volume in each reaction reagent addition were made (see Table 1 ). Again, the volume changes were chosen to reflect the expected volume discrepancy that might result from a miscalibrated liquid handler.
By performing a similar analysis as for the protein binding study, the compounds did indeed yield calculable differences in potencies (see Figures 5A–C ). It should be noted that although compound 9305 ( Fig. 5B ) was not potent enough to generate full dose-response curves, enough data were obtained to observe the same trend, indicating that inaccurate liquid delivery will result in a noticeable change in potency. The summarized data (presented in Table 4 ) indicate a similar trend compared with the protein binding assay: Plate-based statistics alone are not necessarily affected by inaccurate pipetting, in contrast to potency, which yields measureable changes.
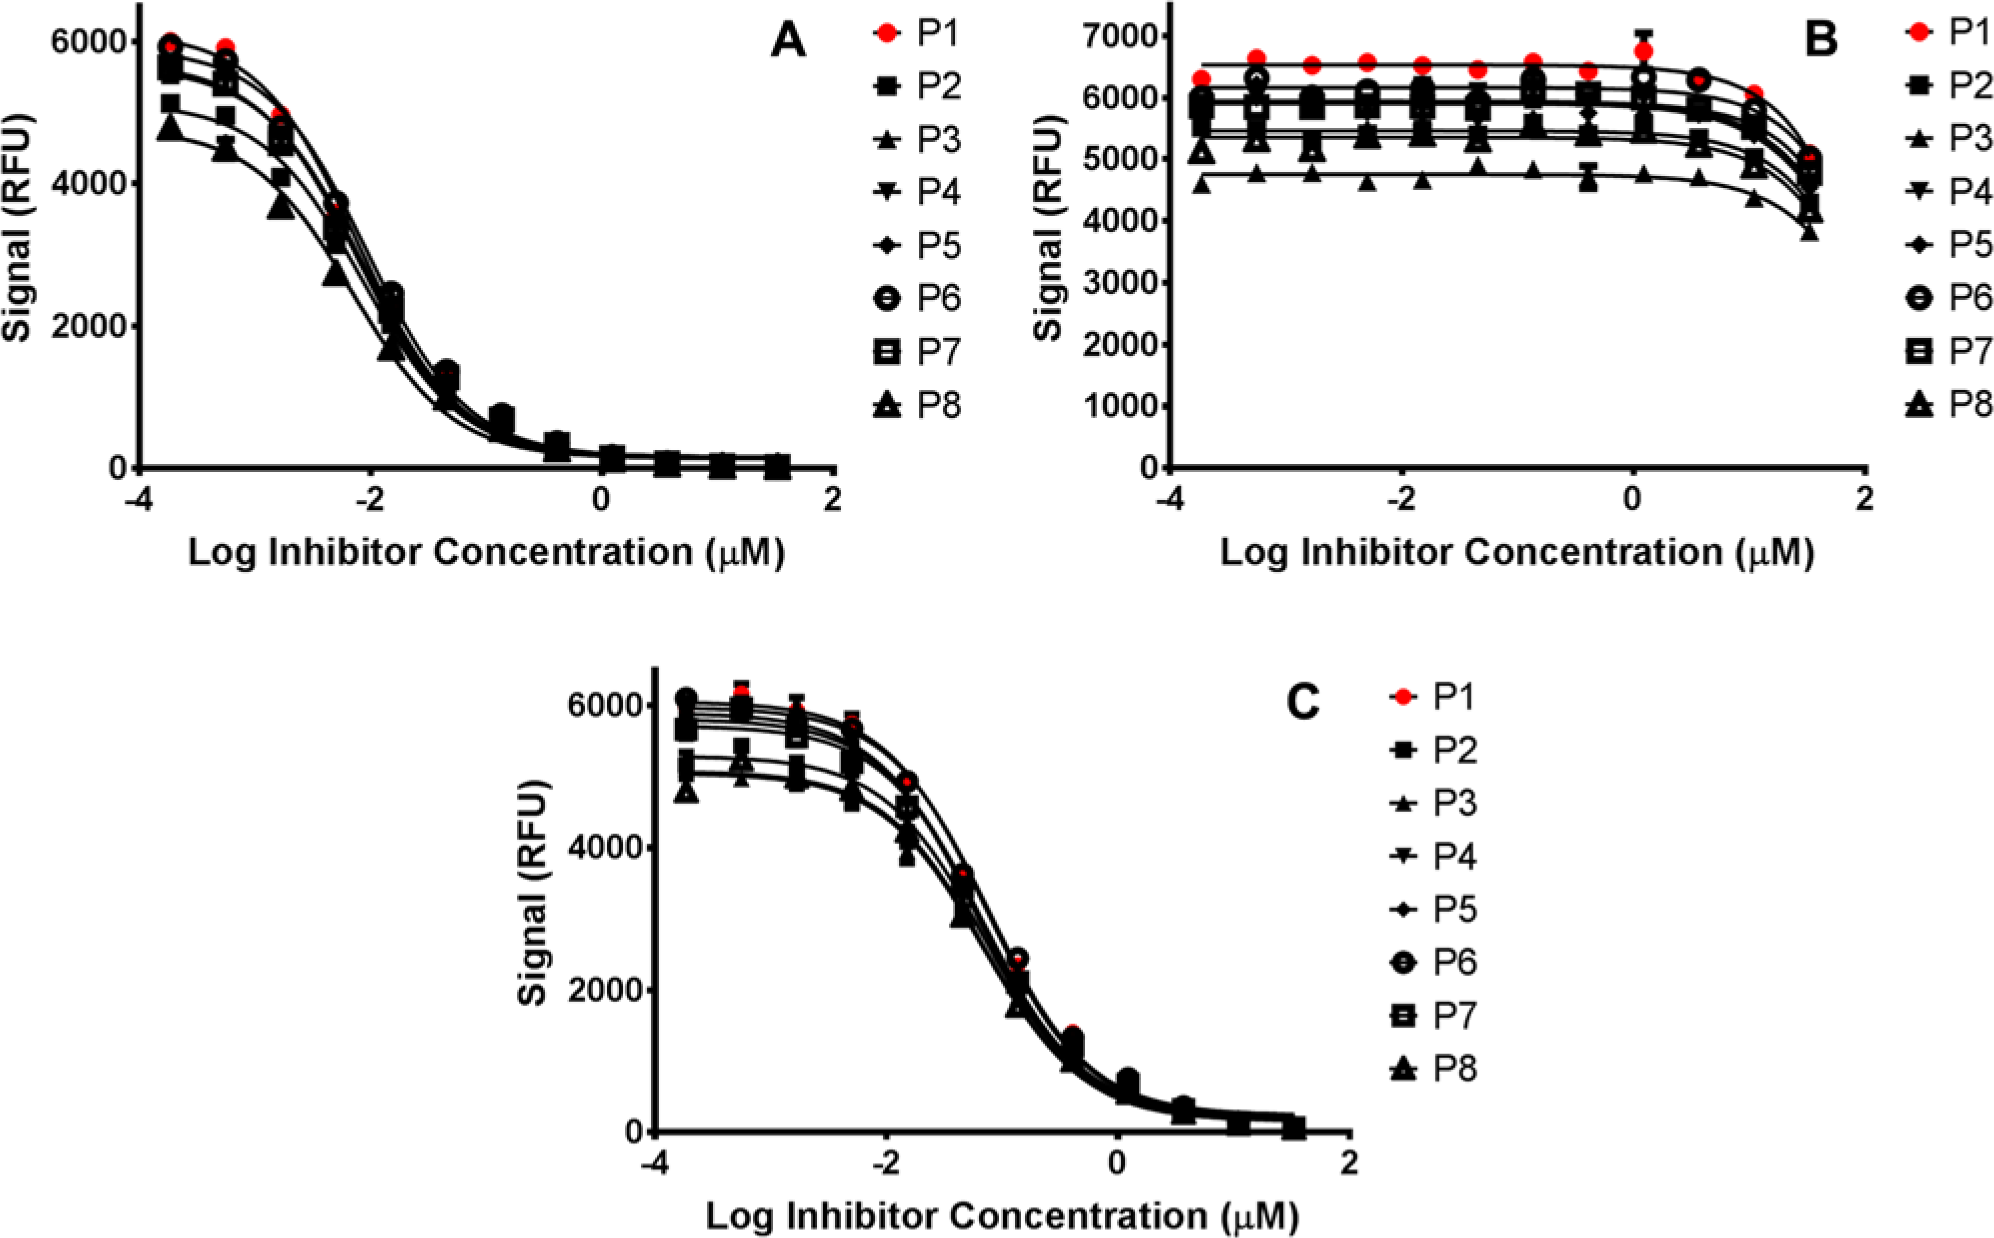
Effect of liquid-handling accuracy on the potency of compound (
Results summary for the α-galactosidase inhibitor assay.
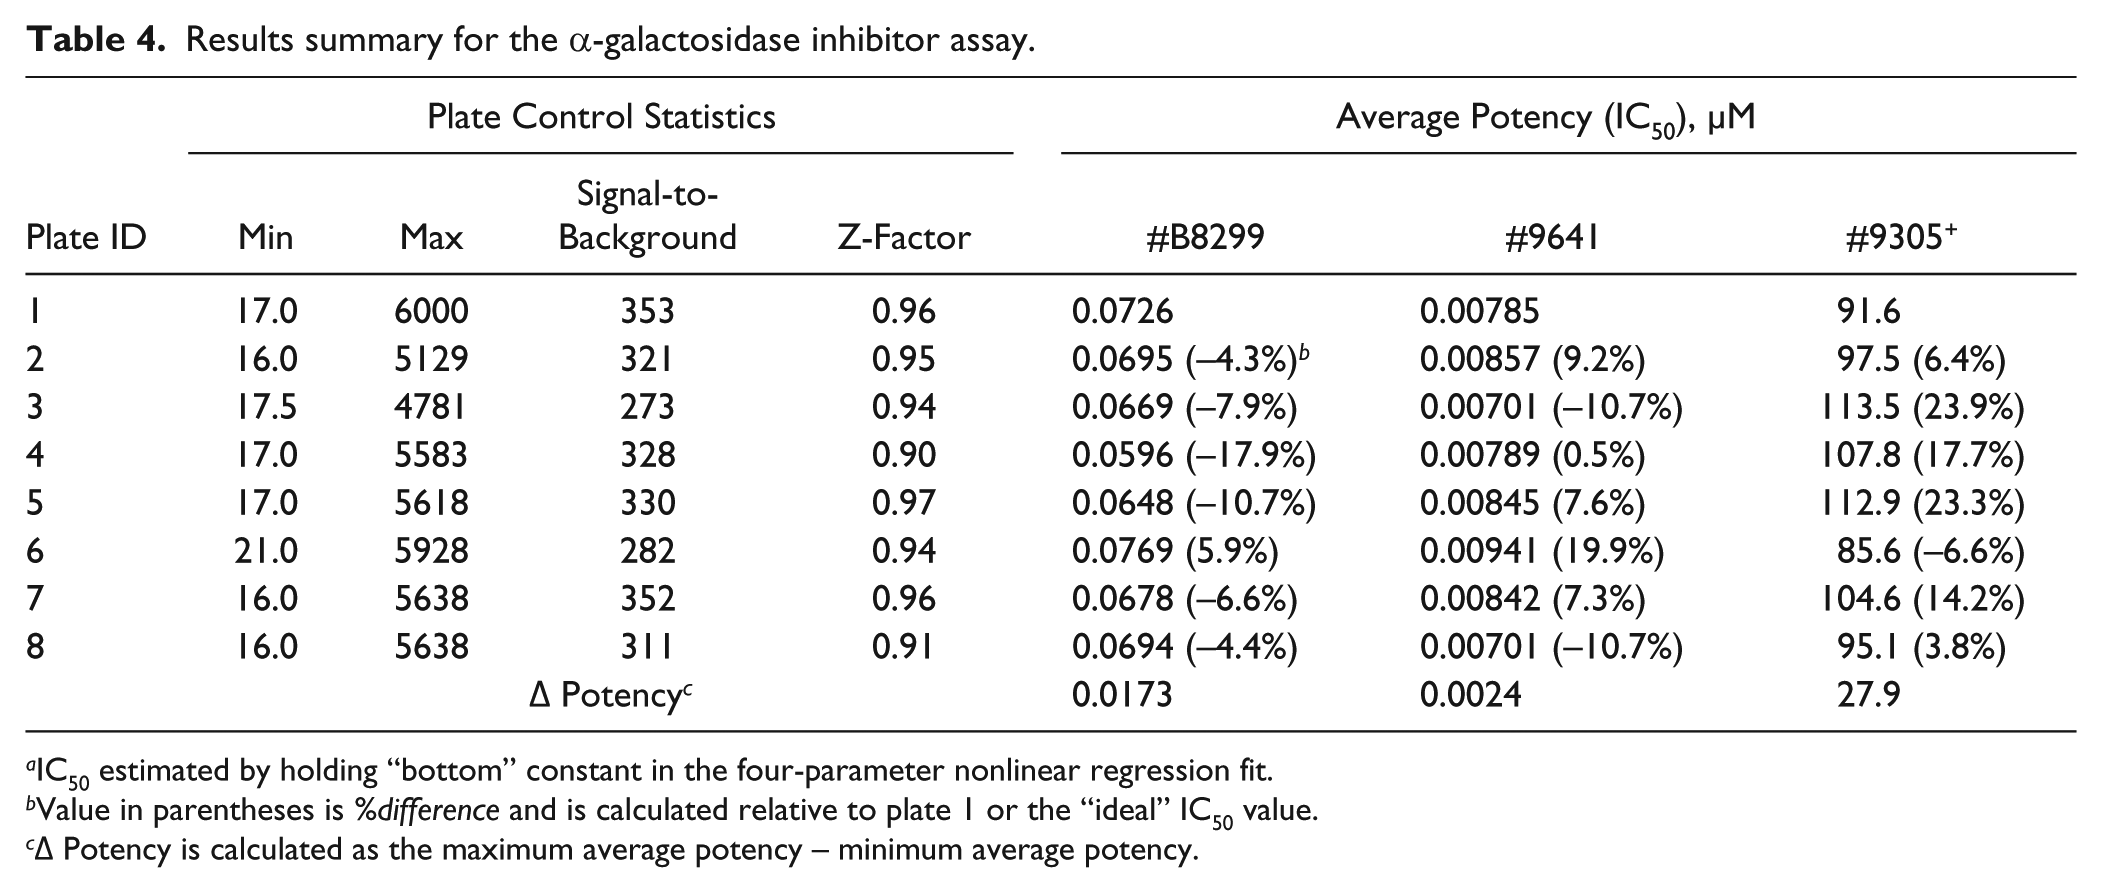
IC50 estimated by holding “bottom” constant in the four-parameter nonlinear regression fit.
Value in parentheses is %difference and is calculated relative to plate 1 or the “ideal” IC50 value.
Δ Potency is calculated as the maximum average potency – minimum average potency.
Because the design of the enzyme assay did not address whether the 125 µL stop reagent could have altered any change in potency due to liquid handling, the experiment was repeated by monitoring the reaction before and after addition of stop reagent. In this case, the same experimental conditions were used whereby eight plates were set up according to Table 1 , using only compound 9641. Because the substrate conversion still elicits a fluorescence signal (albeit smaller) even in the absence of stop reagent, the plates were read before and after addition of stop reagent. The IC50s were calculated and compared by analyzing the spread across the entire plate set. The Min, Max, and Mean IC50 values for “before stop” were 5.4, 11.4, and 8.1, respectively, whereas those for “after stop” were 6.8, 9.7, and 8.2, respectively. The results indicate that there is no appreciable masking or enhancing affect by adding stop reagent.
For both the protein binding and enzyme assays, it may seem surprising that the Z-factor was not appreciably affected. In fact, the Z-factors for both cases were all greater than 0.9 ( Tables 3 and 4 ), indicating high-quality assays. Because the Z-factor is a measure of both signal window and assay variability and the volumes were intentionally changed with a high degree of precision, the overall assay variability was not affected. It is important to consider that Z-factor measurements can detect liquid handler variability when due to tip-to-tip problems (e.g., damaged tips, clogged tips, improperly seated tips, etc.). However, if the tips are all performing perfectly (good precision) but the liquid handler is miscalibrated, potency inaccuracies may go unnoticed.
Conclusions
With the rise of automation in drug discovery over the past decade, liquid handling is increasingly relied upon in an unattended fashion. In doing so, it is critical to ensure the proper functioning of each component of the automation system, including liquid handling. There are three components to ensure proper functionality of liquid handling (manual or automated): regular maintenance (e.g., cleaning, inspection, and lubrication), performance checking, and calibration. Both the performance checking and calibration should involve precision (variability) and accuracy (delivered versus expected volume) measurements. Oftentimes, only precision is used as a quality indicator for liquid handlers.
It has been demonstrated that liquid-handling accuracy does indeed affect assay performance. In the two cases presented in this article, both signal-to-background and Z-factor are not appreciably affected. However, compound potency is measurably affected, especially drastic for lower-potency compounds.
Liquid-handling accuracy has several implications. First, lower potency compounds may simply be missed due to cutoff criteria. This scenario can lead to missing important chemical scaffolds.
Second, the assay loses resolution for high-potency compounds that have similar IC50s. Loss in discriminating power can allow incorrect compound scaffolds to be chosen for further development.
Third, liquid handlers that are not properly calibrated, both in terms of precision and accuracy, make assay transfer unnecessarily difficult. For example, it is not uncommon for different liquid handlers to be used during transitions from assay development to automation validation, HTS to confirmation, confirmation to lead generation/lead optimization, and so forth. Furthermore, when considering replacement components in the event that a particular liquid handler used during a screening campaign becomes inoperable due to clogged orifice, bad circuit board, power failure, and so forth, the replacement liquid handler needs to deliver the same precision and accuracy to yield similar results as the original component.
Fourth, it is not enough to rely simply in precision to qualify liquid handlers in screening campaigns. Both precision and accuracy can have a measurable impact on data quality, as was demonstrated in this article.
Finally, it is possible to use a DOE approach to match reagents to an appropriate liquid handler. This can be accomplished by identifying reagents sensitive to variability as well measuring liquid handler performance. Assay variability can thus be minimized by pairing sensitive reagents with the best performing liquid handlers. This approach can be especially true for automation systems with multiple liquid handlers that dispense different reagents. Research in this area is under way in our laboratory.
Footnotes
Acknowledgements
The authors thank Dr Keith Albert and Bernadette Danis from Artel for helpful comments and suggestions during the preparation of this manuscript.
Declaration of Conflicting Interests
The authors declared no potential conflicts of interest with respect to the research, authorship, and/or publication of this article.
Funding
The authors received no financial support for the research, authorship, and/or publication of this article.