
Abstract
Clinical laboratories need to test patient samples precisely, accurately, and efficiently. The latest member of the Roche cobas modular platform family, the cobas 8000 modular analyzer series allows compact and convenient consolidation of clinical chemistry and immunochemistry assays in high-workload laboratories with a throughput of 3 to 15 million tests annually. Here we present the results of studies designed to test the overall system performance under routine-like conditions that were conducted at 14 laboratories over 2 y. Experiments that test analytical performance of the new module were integrated with overall system functionality testing of all modules in different configurations. More than two million results were generated and evaluated for ~100 applications using serum/plasma, urine, or EDTA blood samples. During the workflow studies, eight configurations of the possible 38 combinations were used, covering all available analytical modules. The versatility of the module combinations makes the system customizable to fit the needs of diverse laboratories, allowing precise and accurate analysis of a broad spectrum of clinical chemistry and immunochemistry parameters with short turnaround times. This new system will contribute to the ability of clinical laboratories to offer better service to their customers and support vital clinical decision making.
By providing essential information to diagnostics and monitoring, clinical laboratories are vital in clinical decision making both in the hospital and out-patient setting. To reliably fulfill these tasks laboratory tests need to be performed precisely, accurately and efficiently. Cost pressure as well as constraints in space and qualified technical personnel continuously increases the need for automation and consolidation of clinical chemistry (CC) tests and immunochemistry (IC) tests in high-throughput serum work areas. By integrating CC and IC, new generation analyzers should also allow shortened turnaround times and the use of smaller sample volumes.
The cobas 8000 modular analyzer series, hereafter referred to as cobas 8000, is a new member of the Roche cobas modular platform family. This high-speed platform is designed to significantly improve overall workflow processes while maintaining excellence in quality and reliability well known from the established Roche MODULAR ANALYTICS1–3 and cobas 6000 platforms. 4
The new platform allows the compact and convenient consolidation of CC assays (ion-selective electrode [ISE], spectrophotometry, immunoturbidimetry) and heterogeneous IC assays in high-workload laboratories with a throughput of 3 to 15 million tests per year.
One cobas 8000 configuration consists of up to four analytical modules and is built with a fast rack transport unit, an optional ISE unit (cobas ISE module), two high-throughput CC modules (cobas c 702 and cobas c 701 module), a midvolume throughput CC module (cobas c 502 module), and the IC module (cobas e 602 module). Combinations of those modules offer more than 38 configurations with many choices to tailor solutions to individual laboratory needs. The reagent cassette concept is optimized for high-workload laboratories, using concentrated solutions in compact containers. The high volume of produced data is handled by the integrated Data Manager software.
Here we present the results of five studies conducted to test the overall system performance at 14 laboratories. Almost all analytical performance data including those for method comparisons were generated by using site-specific routine request profiles, allowing us to test the analytical performance as well as the functionality of the whole system under real intended use conditions. 5
Materials and Methods
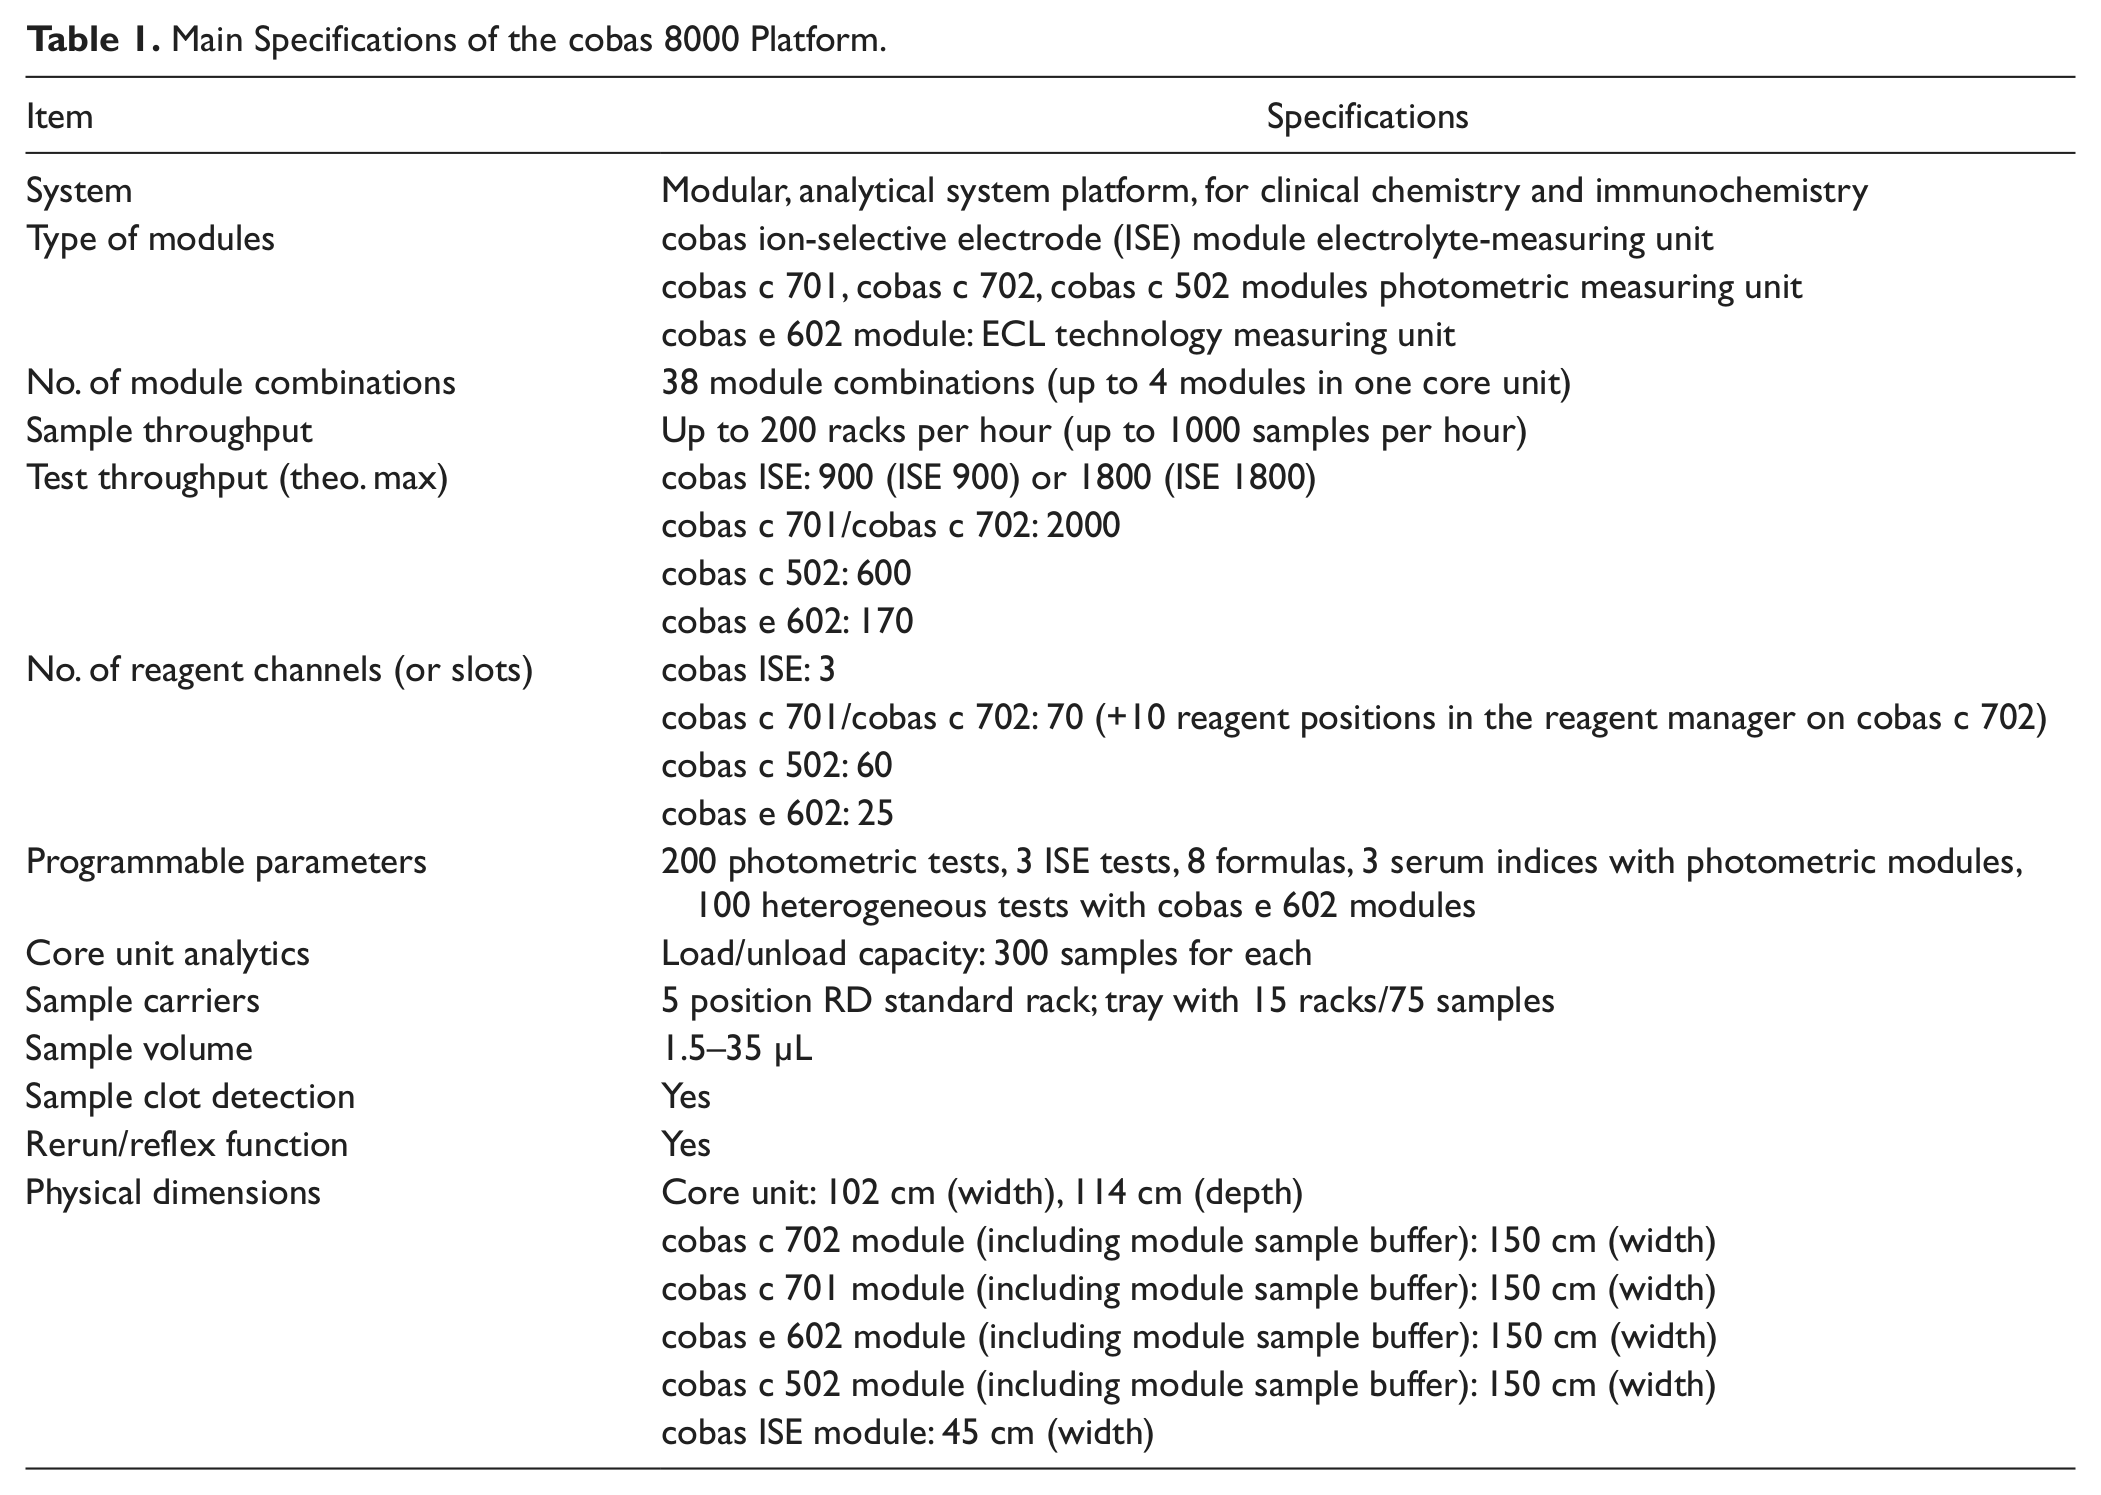
The main specifications of cobas 8000 are listed in Table 1 . Figure 1 shows the basic elements of this platform: the core unit (rack loading/unloading and rack transport unit), the ISE unit, the module sample buffer (MSB), and the cobas c 701 module (one of four possible modules).
Main Specifications of the cobas 8000 Platform.
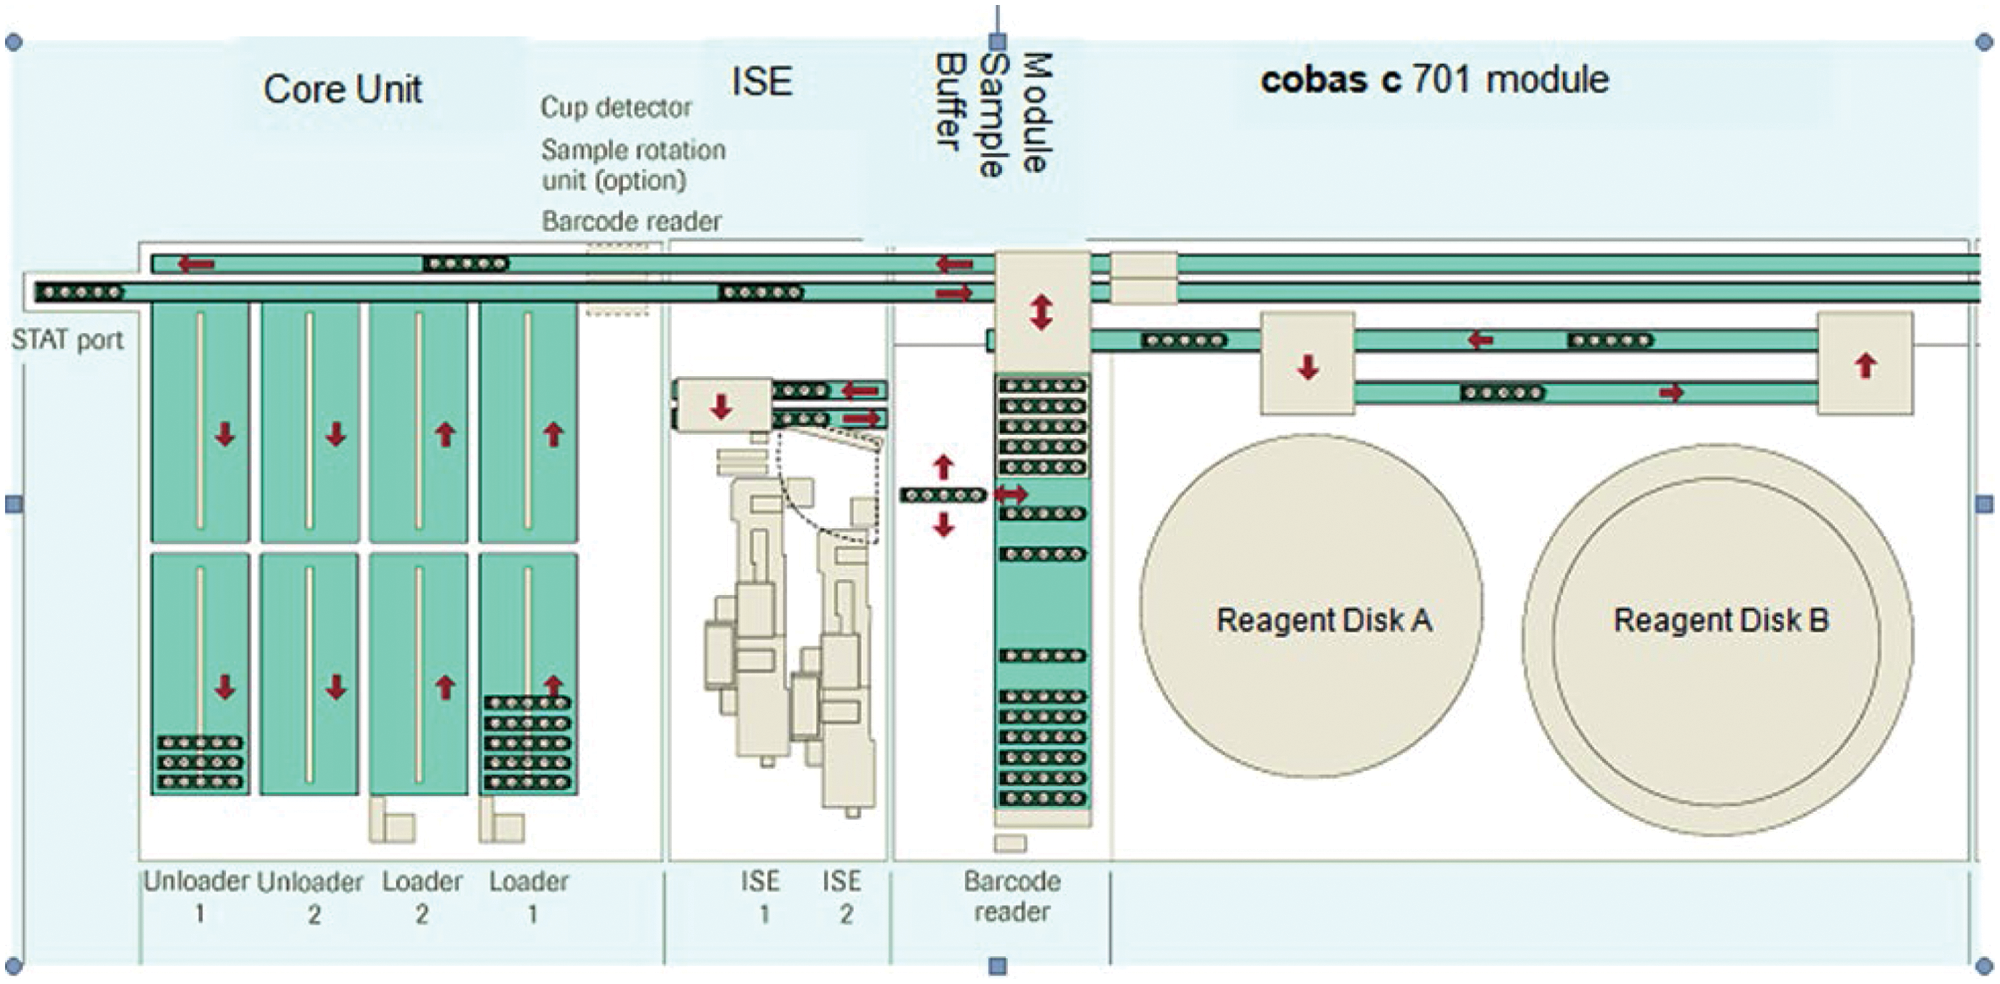
Basic elements of the cobas 8000 platform.
Free rack traffic flow throughout the system is supported by independent transportation and return lines. The independent processing line in the ISE and each analytical module as well as the unique MSBs and switch gates at each module further optimize efficient sample routing. Each module can dynamically manage 25 sample racks, including five quality control (QC) racks in an environmentally controlled area in the MSB. Another feature relevant for the high throughput of the cobas c 701 and cobas c 702 modules is the parallel processing of two sample probes, each with a cycle time of 3.6 s, resulting in an effective cycle time of 1.8 s. This is combined with parallel pipetting of four reagent probes, two from each of the cooled reagent storage compartments referred to as “reagent disks” with a capacity for 35 reagent cassettes each. Different from the cobas c 701 module, the cobas c 702 module allows continuous reagent cassette loading during operation via a reagent manager with a capacity of 10 reagent cassettes, integrated on top of the MSB.
All processes within the analytical system are managed by the control unit software, whereas data and workflow management is handled by the integrated Data Manager software. In addition, the Data Manager provides an interface between the instrument, the Lab Information System (LIS), and the Roche TeleService-Net enabling access to, and routing of, remote information and functionality to and from Roche.
The evaluated cobas 8000 configurations, comparison instruments, and distribution of tests over the participating sites are listed in Table 2 .
Overview of cobas 8000 Configurations, Comparison Instruments, and Distribution of Tests over the Participating Sites.
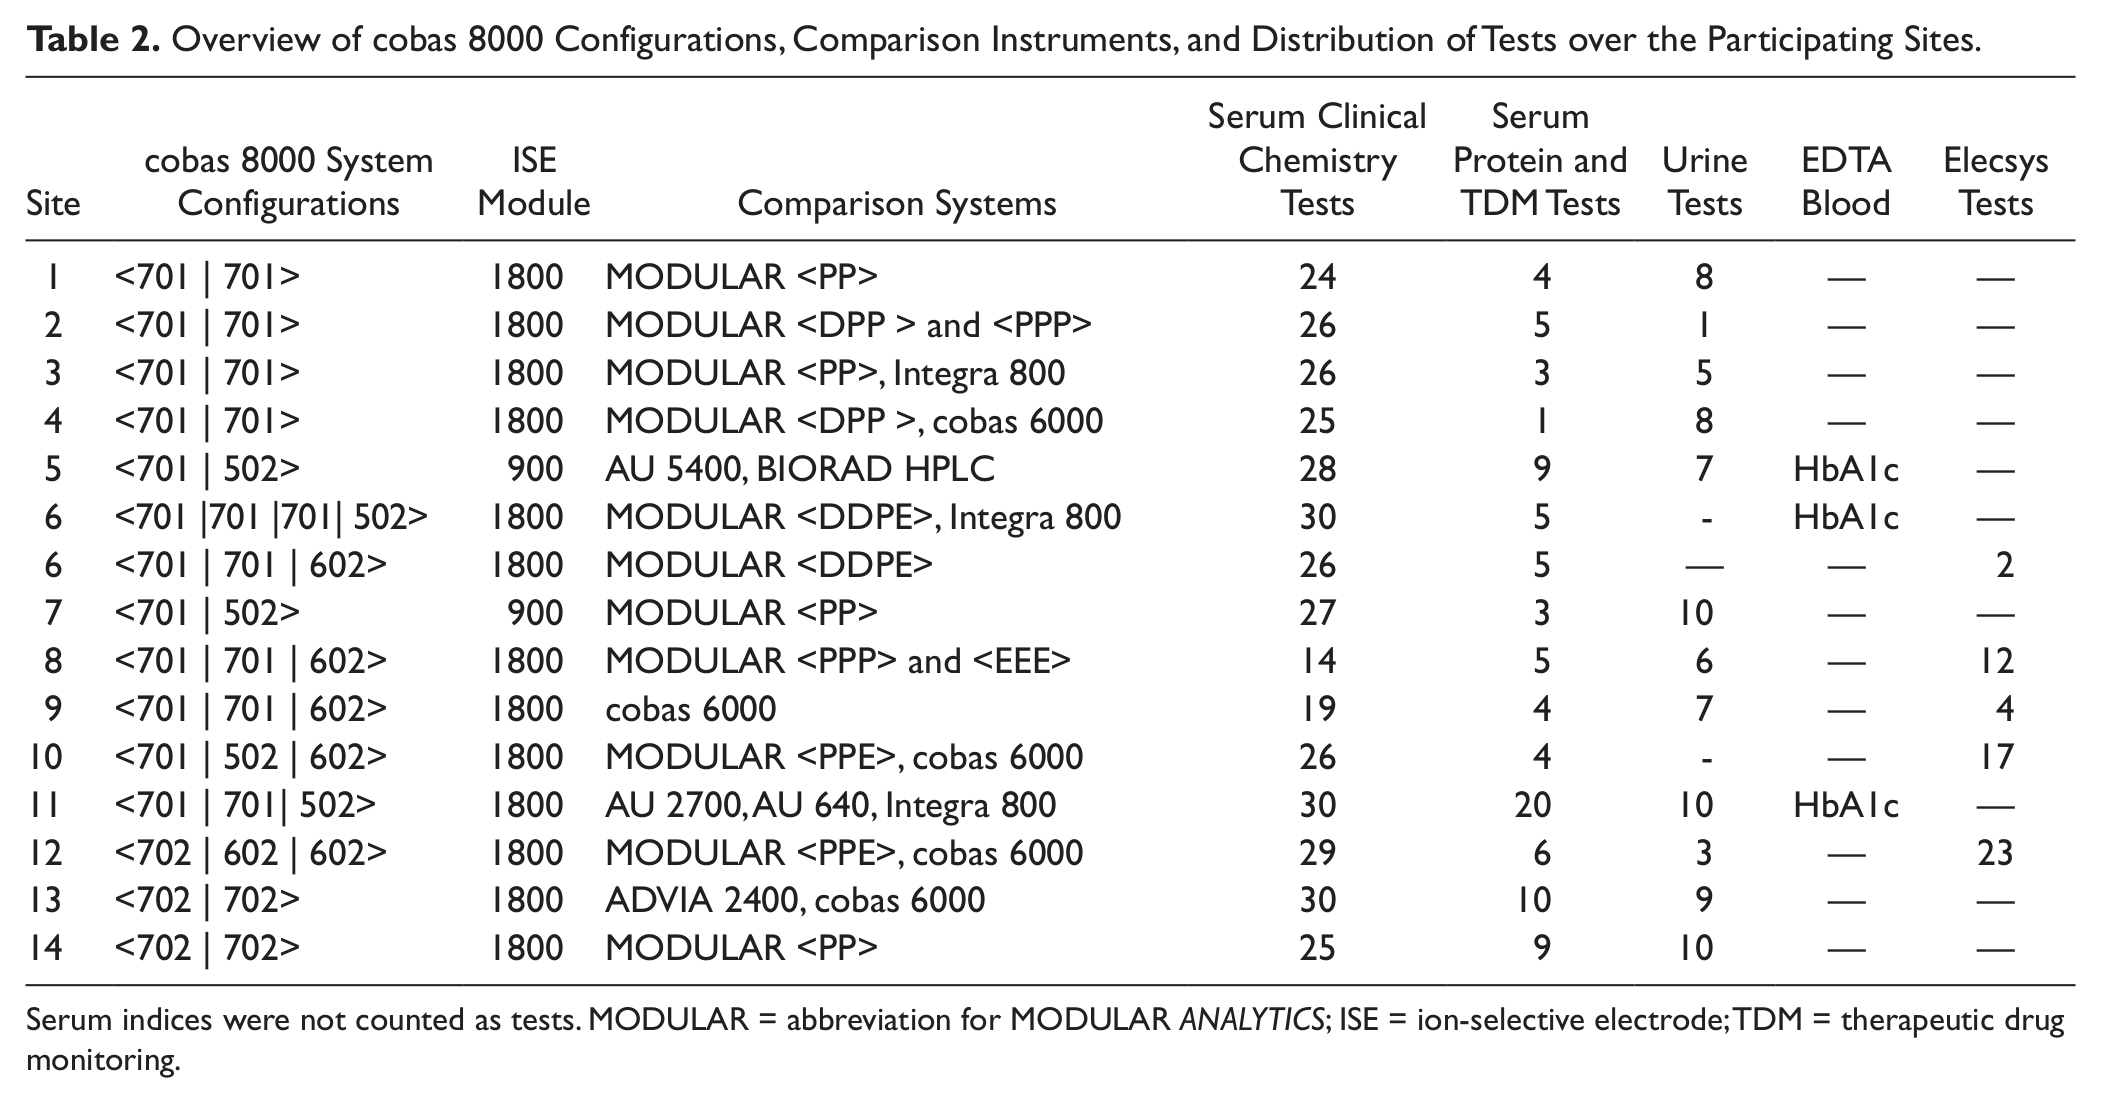
Serum indices were not counted as tests. MODULAR = abbreviation for MODULAR ANALYTICS; ISE = ion-selective electrode; TDM = therapeutic drug monitoring.
Calibrator and control materials as well as cobas 8000 reagents and auxiliary materials were provided by the manufacturer. No adjustments or method adaptations of the regular routine assays were made for this study. All materials were used according to the recommendations of the manufacturer.
Depending on the experiment, either control materials or human specimens (serum or plasma, urine, and EDTA blood) were used. The study was supported by the software program WinCAEv (Windows-based computer-aided evaluation). 6 All experiments were defined using this program, sample and test requests were generated, and data were transferred online from the analyzers to WinCAEv, allowing traceable, reliable, convenient, and fast data validation by the evaluators and by the Roche staff.
Evaluation Protocol
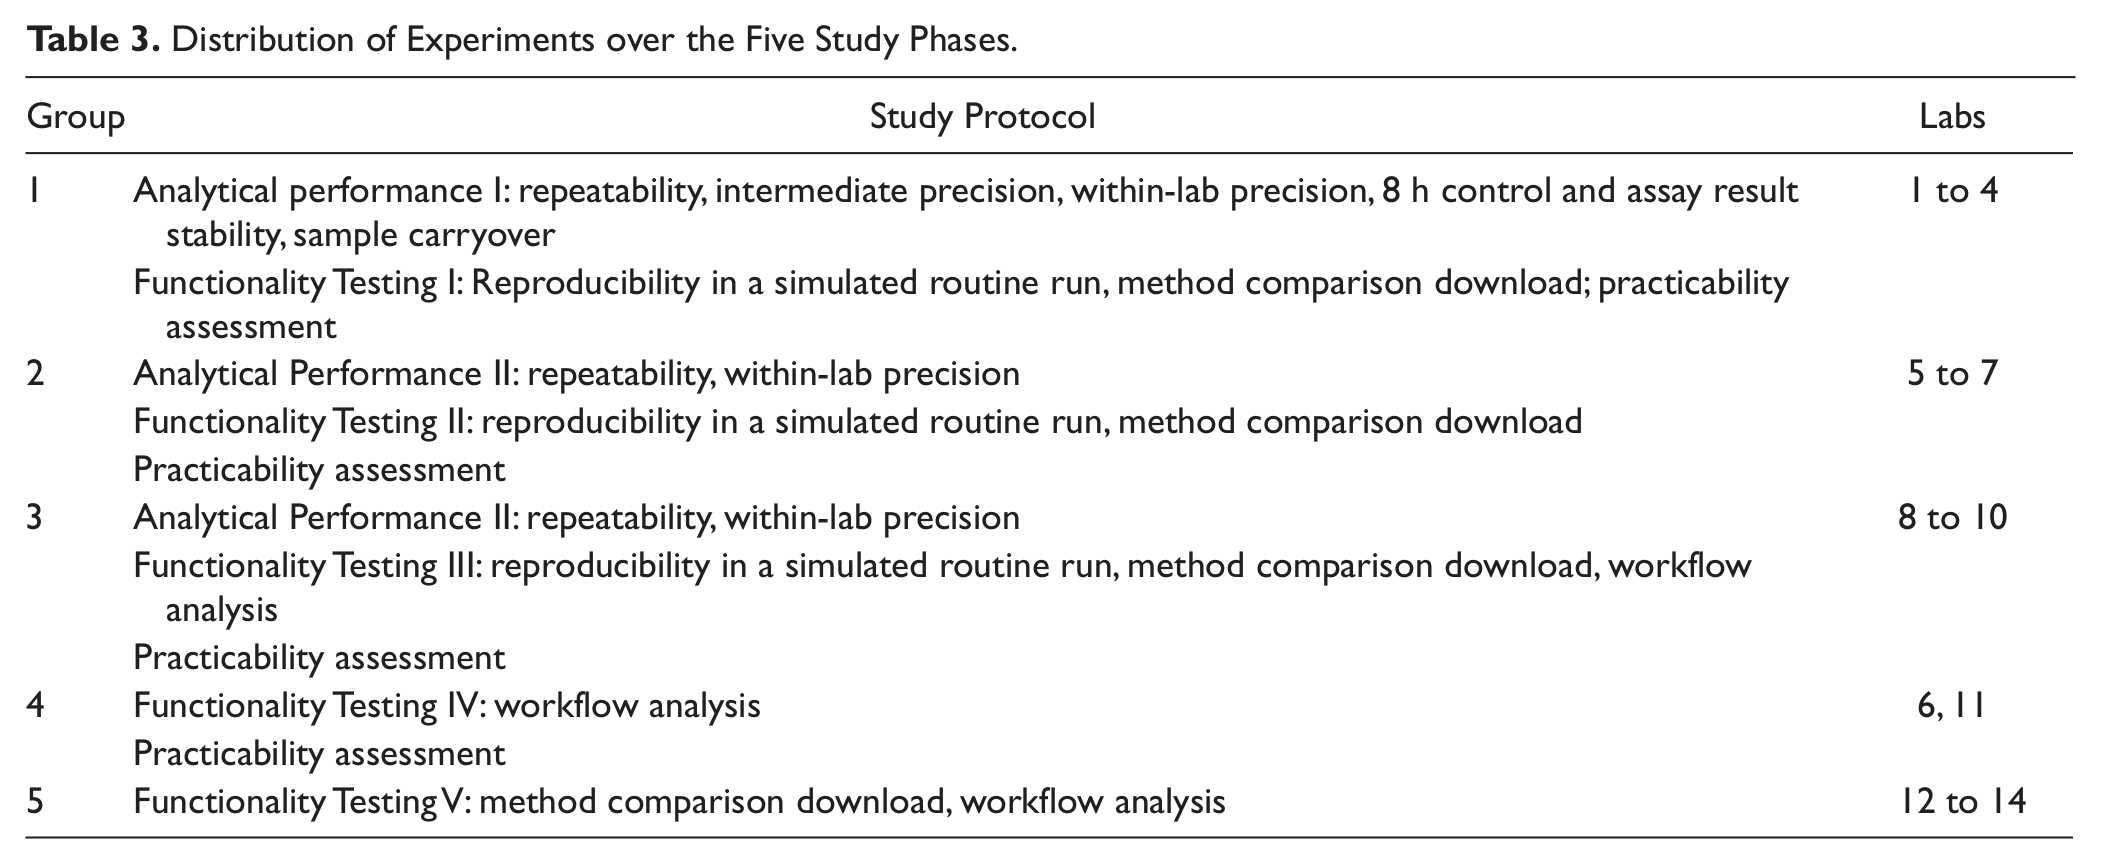
The cobas 8000 combines well-established analytical modules from Roche MODULAR ANALYTICS (ISE module; E170) and cobas 6000 platforms (cobas c 502, analytical unit identical to cobas c 501; cobas e 602, analytical unit identical to cobas e 601) with the new analyzers cobas c 701 and cobas c 702. The study performed over five phases was designed to integrate experiments describing important analytical features of the new module in the first phase, whereas the performance of all modules was covered in the following phases, as shown in Table 3 . The acceptance criteria for the analytical performance data are listed in Table 4 .
Distribution of Experiments over the Five Study Phases.
Acceptance Criteria of Analytical Performance Data.
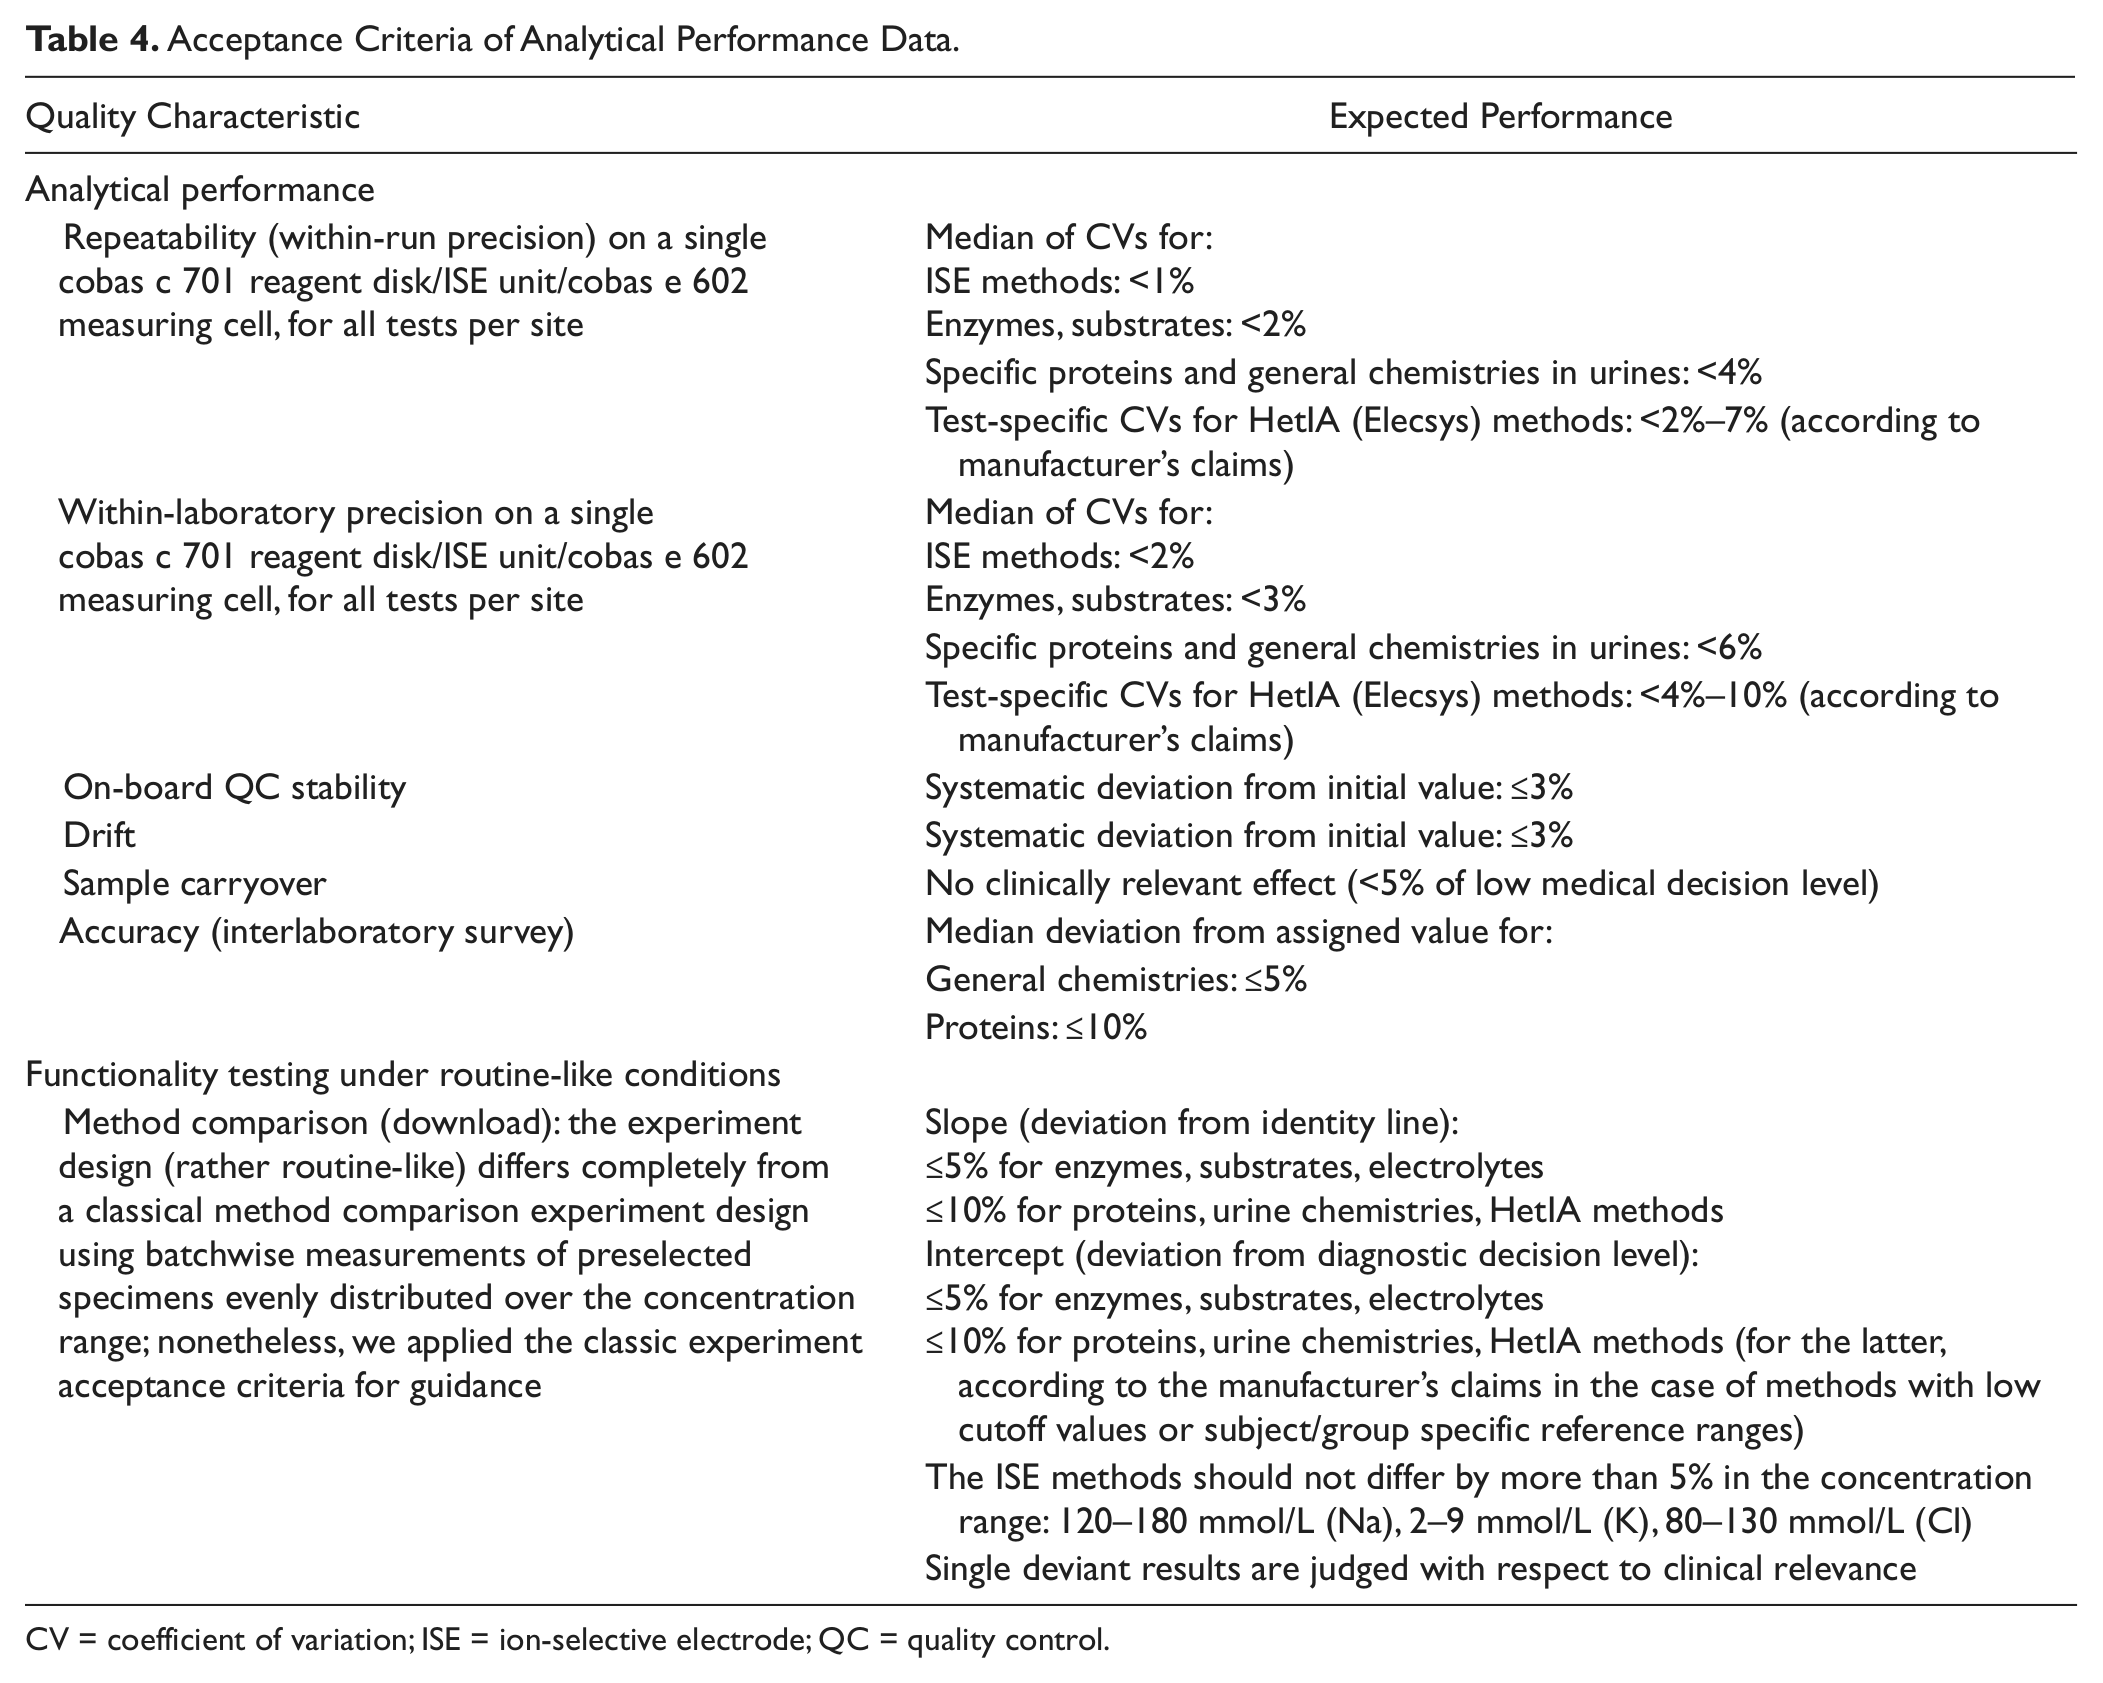
CV = coefficient of variation; ISE = ion-selective electrode; QC = quality control.
Analytical Performance
Precision
On modular systems, samples with requests for a given assay may not necessarily be processed via the same route (i.e., using the same disk and/or module).
Repeatability is the variation in measurements on the same disk under the same conditions, thus, that with the lowest variance component. Therefore, when considering the variance of aliquots processed via the different routes, we deal not only with repeatability but also with an intermediate precision embracing repeatability, disk-to-disk, and module-to-module variation even within the same run.
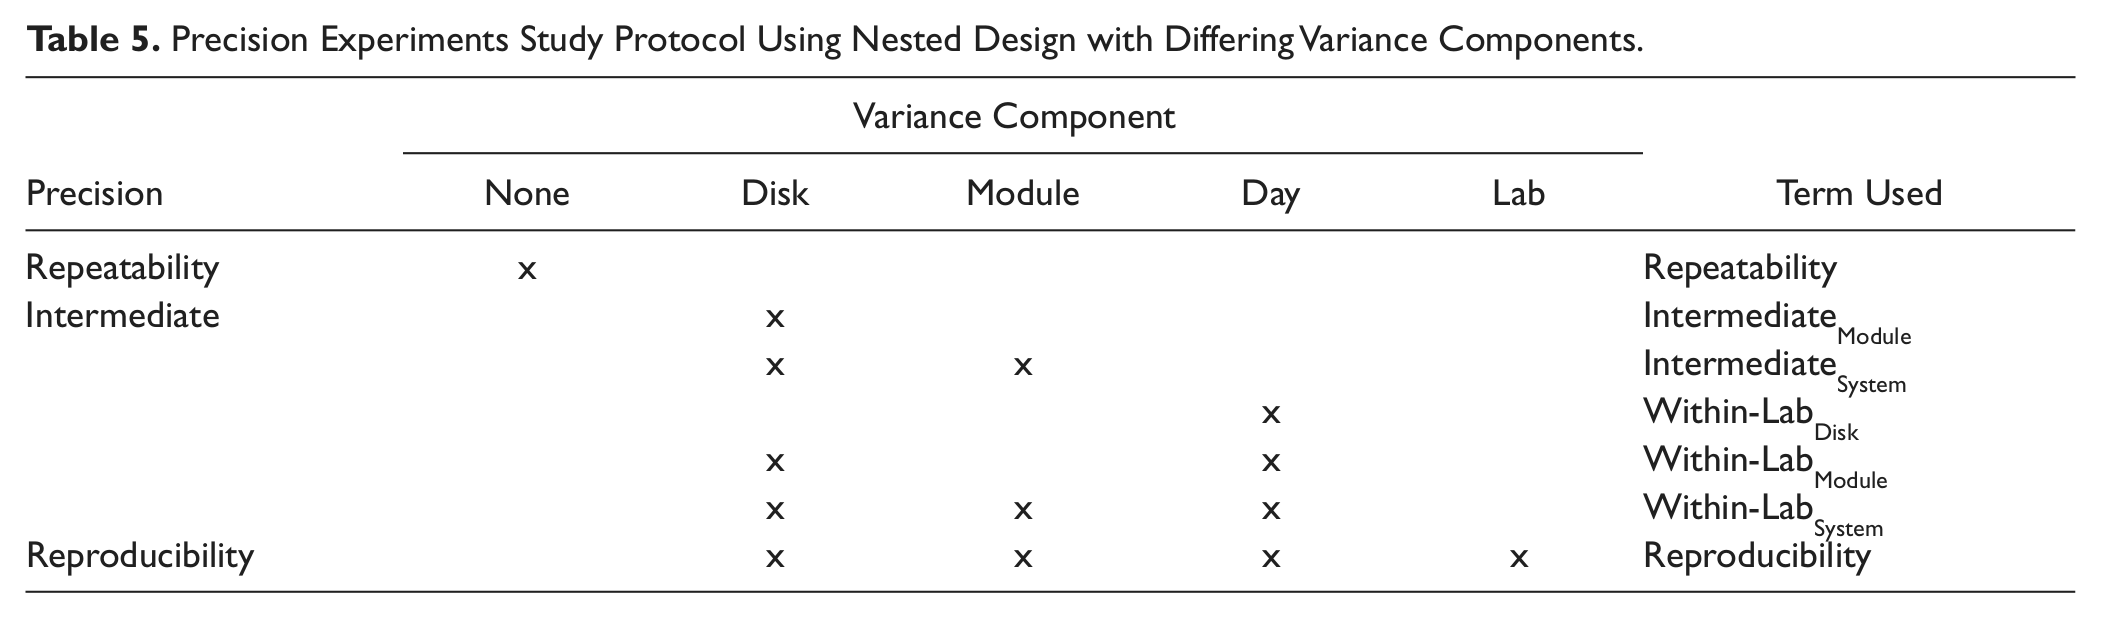
In the precision experiments, we had a nested design with differing variance components, as shown in Table 5 .
Precision Experiments Study Protocol Using Nested Design with Differing Variance Components.
Repeatability and Intermediate Precision
The testing protocol was designed to allow comparison of the precision when a test is processed using a single reagent disk (Repeatability) with that when using both reagent disks within a module (IntermediateModule) or when using two modules within a dual-module configuration with four reagent disks (IntermediateSystem).
Note that each cobas c 701 module reagent disk is coupled with one sample and two reagent probes, thus generating a disk-specific calibration per test allocation. This experiment was performed during study phase I only with the 11 so-called “core assays” (assays processed per reagent disk on cobas c 701 at all sites in phases I to IIII), AST, Ca, CHOL, CREAJ, CRP, GGT, GLUC, UREA, on cobas c 701 and ISE (Na, K, Cl).
Sample materials were two serum pools for CRP and pools of the normal and pathological controls for the general chemistry analytes, 21 replicates per run, 3 d. Additional repeatability data were obtained by all sites for all assays allocated to one reagent disk during the reference run of the routine simulation precision experiments (see the “Reproducibility in a Simulated Routine Run” section).
Within-Lab, between-Lab Precision
To capture routine-like precision over a period of 21 d, the daily QC processing in singleton at two or more analytical concentration levels was used. The QC runs were repeated once to simulate two-fold analysis. Within-lab coefficients of variation (CVs) per assigned reagent disk and control material were calculated from the 42 results generated for each assay. Corresponding to the above described Intermediate precision, the 11 selected core assays were tested on all cobas c 701 reagent disks (2–6 units, depending on study site) and on the ISE units over 21 d at nine study sites.
Except for some tests on cobas c 502 requiring assay-specific controls, all assays were tested in this experiment. Site 8 could not perform this experiment because of time and capacity limitations.
For the core assays, the total CV per assay and material was calculated per disk (Within-LabDisk), per module (Within-LabModule), per system (Within-LabSystem, over two to four disks per system for single and dual cobas c 701 configurations, respectively), as well as over up to nine labs (Between-Lab). In the case of AST, CREA, and GGT, in which two different methods per assay were distributed among the labs, n is <9.
Stability of Results over 8 h
On-board QC stability
Control materials and selected core assays (listed in the “Precision” section) were used to test the stability of QC material stored in the MSB QC compartment over 8 h. Defined volumes of the control materials were filled in 13 × 75 mm secondary tubes (standard tube or special low dead volume tube distributed by Roche) and measured automatically every hour using the appropriate QC functionality.
8 h drift experiment
The three materials, calibrator for automated systems (Cfas), Precinorm U (PNU), and PrecipathU (PPU), with different analyte concentration levels were analyzed over 8 h for the following assay groups: electrolytes, Ions (Ca, Cl, Fe, K, Mg, Na, PHOS), substrates (ALB, BIL-D, BIL-T, CHOL, CREA, GLUC, TP, TRIG, UA, UREA), and enzymes (ALP, ALT, AMYL, AST, CK, GGT, LDH, LIP).
At hour 0, the base value was determined in triplicates, followed by single determinations every 30 min over 8 h. The pooled materials were stored at 2 to 8 °C, and 500 µL portions were transferred into Hitachi standard cups 10 min before each measurement series. Each assay was measured on one reagent disk (or ISE unit) only.
Sample Carryover
A slightly varied version of the Broughton model 7 was used for this experiment. Three aliquots of a high-concentration sample (h1 . . . h3) were followed by measurements of five aliquots of a low-concentration sample (l1 . . . l5). The sequence was repeated five times. The sample-related carryover median (l1 – l5) is compared with the imprecision of the low-concentration sample for the analyte in question. In addition, the clinical relevance at the diagnostic decision level is assessed.
Analytes with expected high concentration differences as follows were tested on the cobas c 701 analytical module and the ISE unit: CK (~10 000 U/L → ~50 U/L), urinary CREA (~3 g/L) → serum CREA (<1 mg/dL), serum ALB (~40 000 mg/L) → urinary ALB(~20 mg/L), and urinary K (~80 mmol/L) → serum K (~4 mmol/L).
Accuracy-Related Experiments
In addition to using the control materials from the manufacturer every working day before each experiment, the accuracy of selected methods was checked at sites 1 to 4 using Roche value assigned controls (ILS 1 and 2) and certified reference materials (SRM 909b, 727c, 967 8 and ERM DA472/IFCC, level 1).
Functionality Testing under Routine-like Conditions
The following experiments are designed to test the overall system functionality under simulated routine conditions 9 using the respective laboratory’s request patterns and, in most parts, routine sample leftovers.
Method Comparison Download
Routine workloads were replicated and reprocessed in part or total on cobas 8000 using WinCAEv to capture the requests from the routine analyzers via a download file from the LIS. As a rule, 200 to 1200 primary tubes were processed in one run depending on the schedule and sample retrieval process at the individual sites.
Data were evaluated using the Passing-Bablok regression analysis 10 and checked for large deviations. In this article, we focus on comparisons of cobas c 701 modules with the same methods used on the routine systems by the various study sites.
Workflow Analysis
The primary goal was to let each participating laboratory examine whether the installed configuration meets their workflow requirements.
Experiments described in the “Method Comparison Download” section were in part used for analysis of workflow. In a few cases, instead of using the single fresh samples, the respective site-specific routine request patterns were replicated and reprocessed using aliquots of pooled QC or pooled residuals from patient samples for these timing studies.
The test and sample throughput as well as the time to results were calculated for each processed workload. Further details of the various environments tested are provided under the Results section.
Routine Simulation Series 1/2, Modules 1/2
These routine simulation experiments were also combined with the Method Comparison Download experiment described under the “Method Comparison Download” section as follows.
For Series 1/2, the same samples and routine request patterns from the above experiment were used in a second run and the reproducibility of the results compared.
For Module 1/2, samples were measured on analytical module 1 followed by testing on analytical module 2. This experiment run only at sites 1 to 4 included the selected “core tests” and any additional tests assigned to both cobas c 701 modules as well as Na, K, and Cl on both ISE units.
The data from both experiments were evaluated using the Passing-Bablok regression analysis and checked for deviations that might indicate any system malfunction.
Reproducibility in a Simulated Routine Run
This experiment was used to test for systematic and/or random errors by comparing the reproducibility of reference results processed in a standard batch (n = 21 or n = 11 per test) with results processed in the same run from randomized requests (n ≥ 21 per test) that mimic the routine of the corresponding site.
Two variations of this experiment were performed. The first was done without additional operator interaction during the run, whereas further experiments challenged the functionality by integration of various “provocations,” which may occur in routine use.
Typical sample-related provocations (short samples, empty cups, clots, barcode errors, rerun and repeat limit flagging, introduction of STAT samples, rack read errors), reagent-related provocations (reagent short with and without standby packs, replace during operation, module masking or “P masking,” i.e., tests masked for sample processing but active for calibration and QC), and process-related provocations (introduction of QC and calibrators via STAT port, blocking results for test with QC error on data manager) were included.
Pooled QC or pooled residuals from patient samples (serum, urine, or EDTA blood) were used as sample material.
Practicability
Using a questionnaire with more than 200 questions, 11 the following five main groups of attributes were rated by 11 sites: Installation (installation environment requirements, spatial arrangement, operation and training), Daily Workflow (start up/shut down, sample processing, reagent handling, workflow and timing, data processing), Quality Assurance (monitoring of the various analyzer processes, calibration and QC characteristics, tracing results to reagent/calibrator/controls), and Maintenance, Troubleshooting, and Versatility.
The assessment of each attribute was done according to a scale ranging from 1 to 10, where a score of 1 means useless or poor, a score of 10 excellent, and a score of 5 acceptable or comparable with the present laboratory situation. The scores were combined with a weight factor 1 to 3 (low to high importance).
Results
More than two million results were generated and evaluated for ~100 applications in these studies between April 2009 and April 2011.
Analytical Performance
Precision: Repeatability, Intermediate, within Lab, and between Lab
At the study sites 1 to 10, a total of 3181 repeatability data were obtained, corresponding to 66 801 results, many of them produced during the reference runs of routine simulation precision experiments. The median CVs were 0.4% for the ISE tests; between 0.7% and 0.8% for enzymes, substrates, and electrolytes; between 1% and 2.4% for protein and urine tests; and 1.1% for the heterogeneous immunoassays ( Table 6 ).
Median Repeatability (Within-Run Precision, n = 21) Data on ISE, cobas c 701, cobas c 502, and cobas e 602 Analytical Modules.
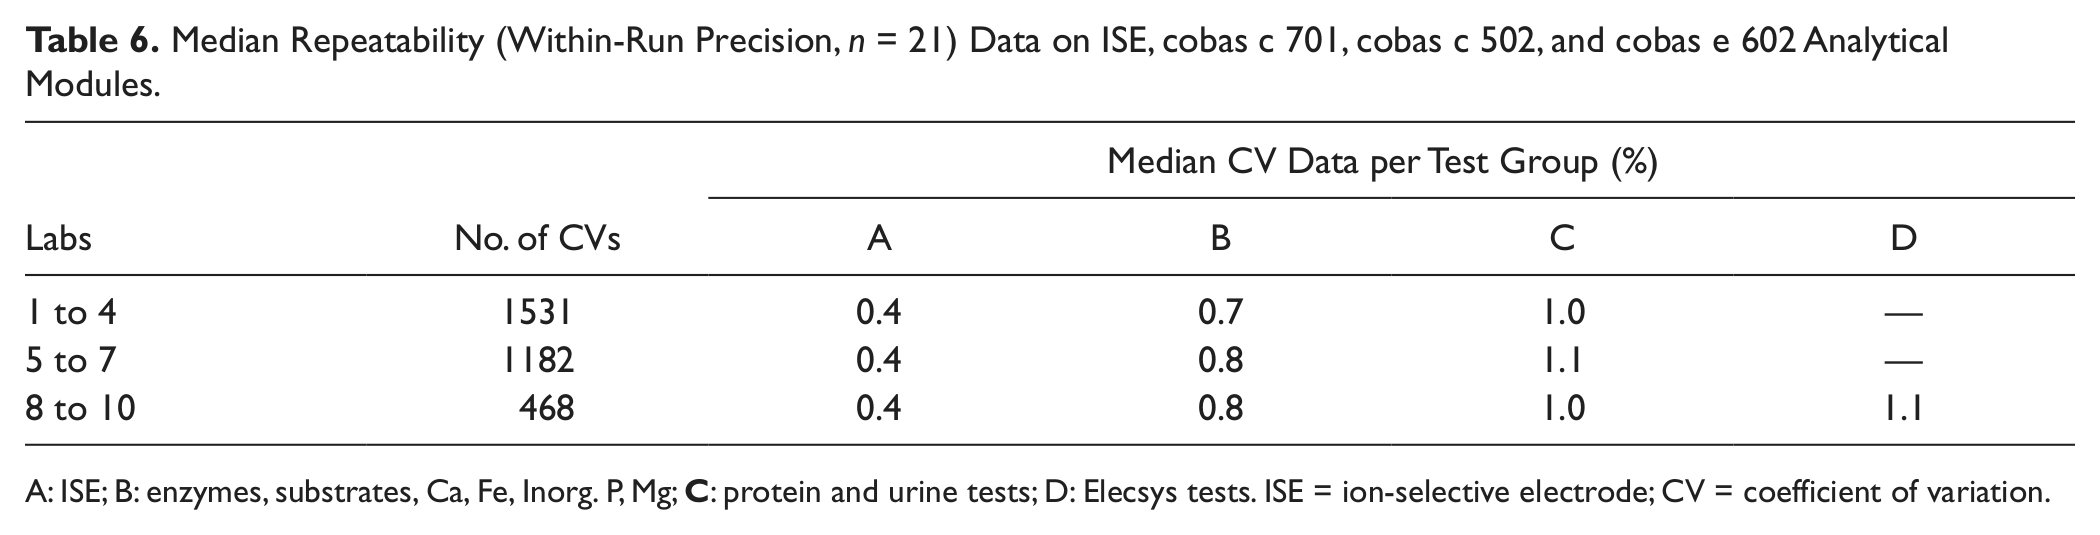
A: ISE; B: enzymes, substrates, Ca, Fe, Inorg. P, Mg;
In Figure 2a , b , CVs from the 11 core analytes are presented, comparing median Repeatability CVs of data measured on single disks versus Intermediate CVs over multiple reagent disks. For the low control, Intermediate CVs from two ISE units or two modules (four disks) range from 0.5% (K, Na) over 0.7% (Ca) up to 2.9% (AST with Pyp), with minor increases from one to multiple analytical units.
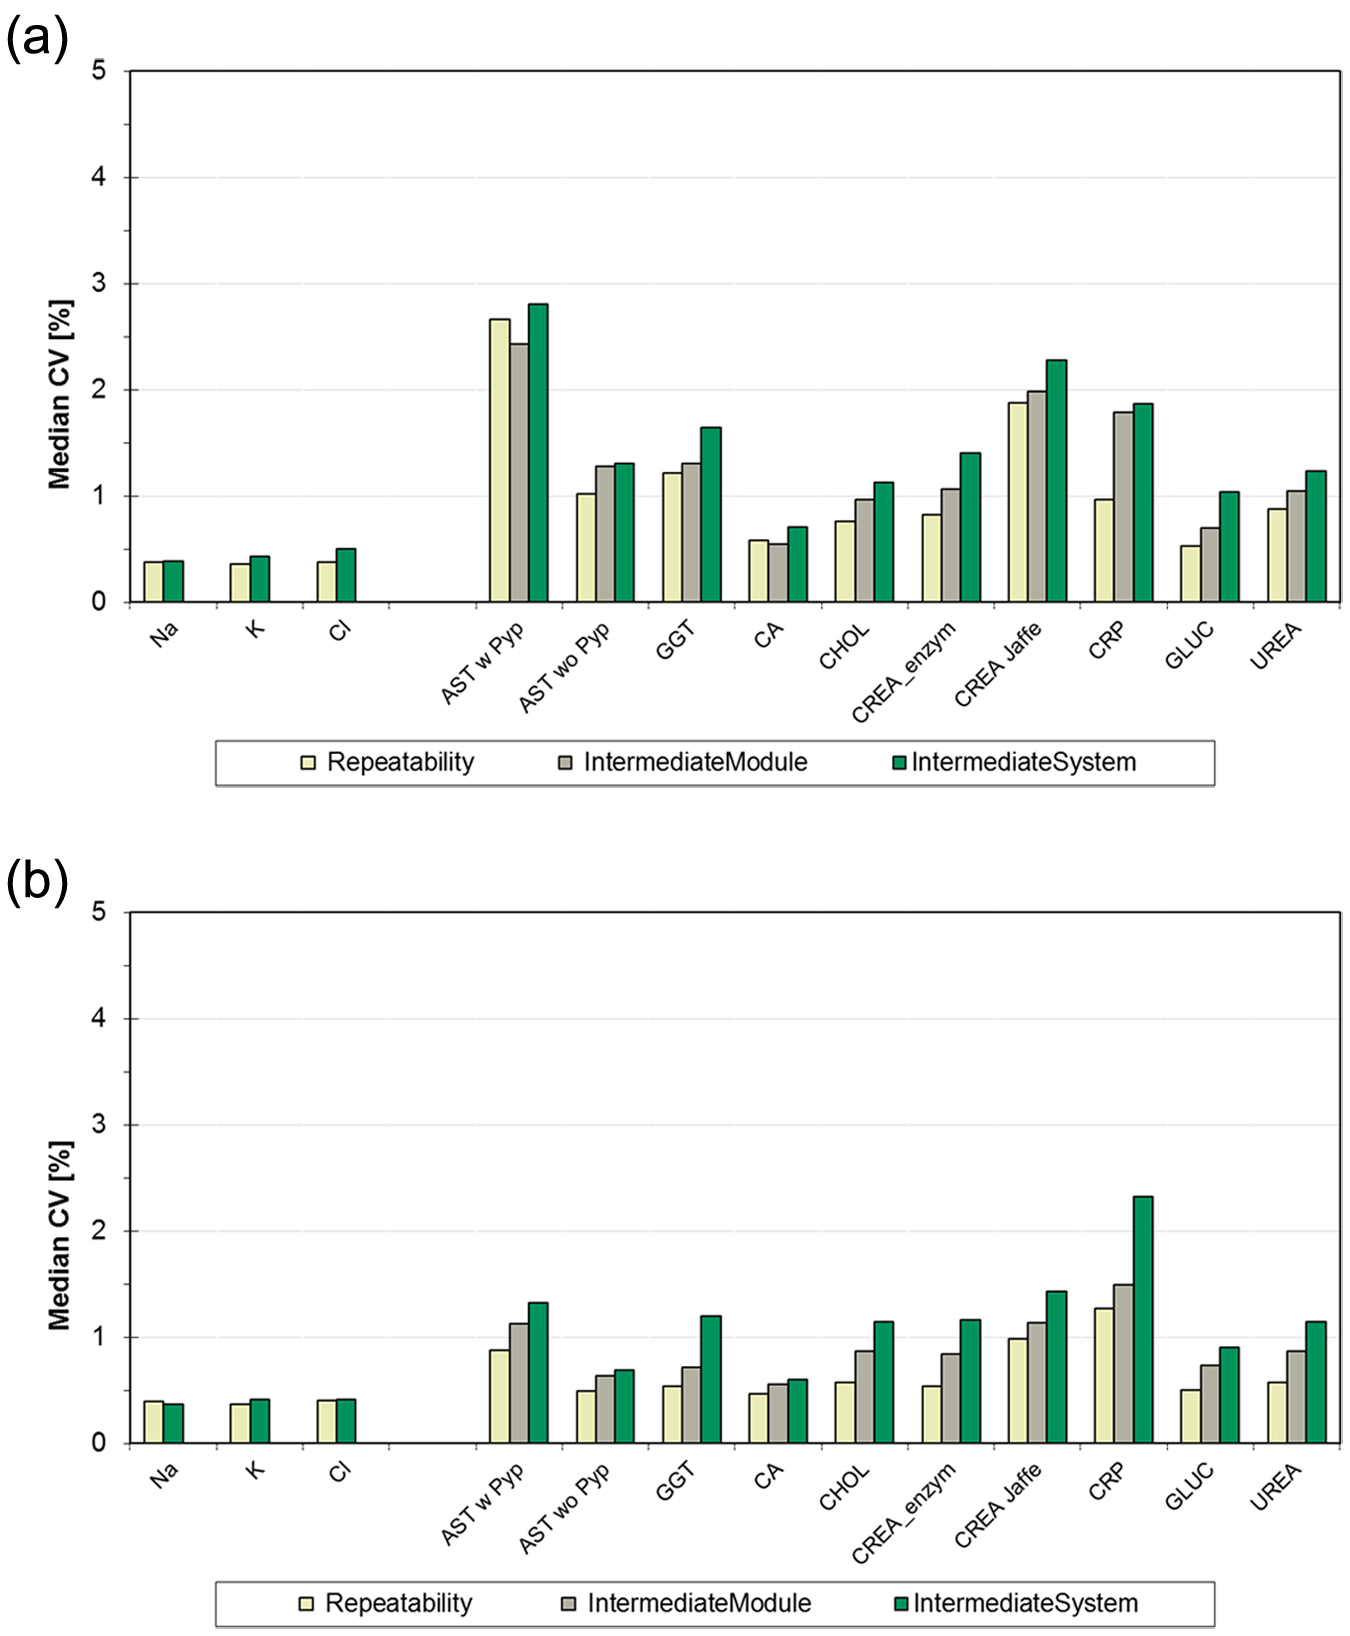
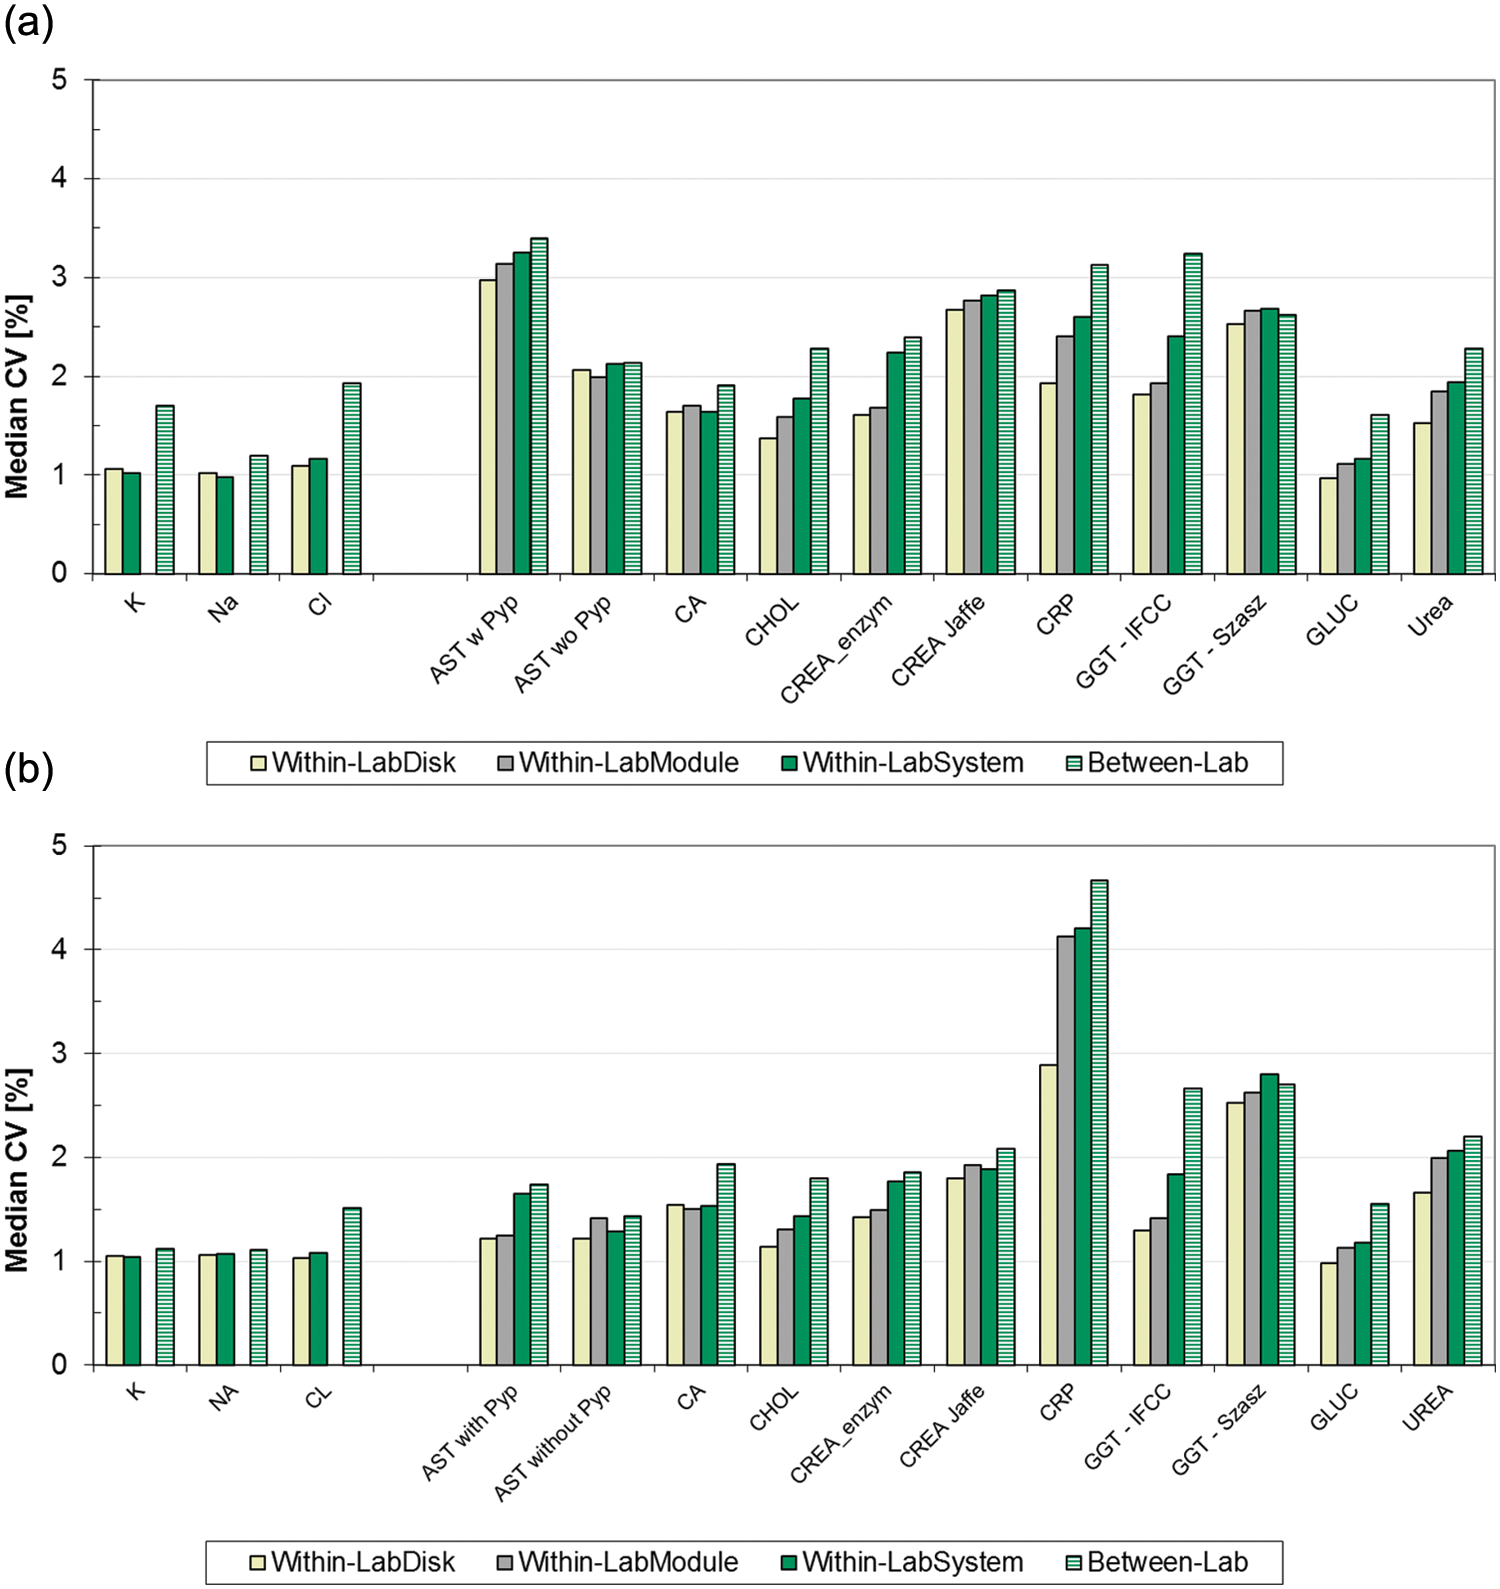
Median precision data labs 1 to 4 from low-concentration controls (a) and high-concentration controls (b), core assays: coefficients of variation (CVs) over n = 21, Repeatability (from one disk/ion-selective electrode [ISE] unit), IntermediateModule (two disks), and IntermediateSystem (two modules with four disks/two ISE units) compared.
Data of similar quality were obtained in the 21 day within-lab precision experiment ( Fig. 3a , b ). Here the Between-Lab CV per method and material over the participating labs was also calculated. In the low controls, the Between-Lab CV over the pooled results from up to nine sites was ≤0.5% higher than the Within-LabSystem CV calculated over two modules or ISE units for 11 of the 14 methods analyzed. In case of the potassium data, for example, the 0.7% CV increase is due to the systemic deviations from two sites (3.34 and 3.55 mmol/L), whereas the mean values from the other seven sites are in very close agreement (from 3.40 to 3.43 mmol). Similarly for chloride, the mean at one site is 81.6 mmol/L versus 84.1 mmol/L as the group median from eight sites, whereas for GGT IFCC, the means over the six labs ranged from 41.6 U/L to 46.1 U/L.
(
Compared with the low controls, increases of CVs for results measured on dual disks or ISE units to the pooled results from up to nine sites were small for all analytes in the high controls ( Fig. 3b ). All CVs were less than 3% except for CRP.
Result Stability over 8 h
The 11 core analytes tested showed no drift of analyte recovery in QC stored on board over 8 h. Results of the same quality (±3%) were obtained in a drift experiment with respect to the on-board stability of 24 assays.
Sample Carryover
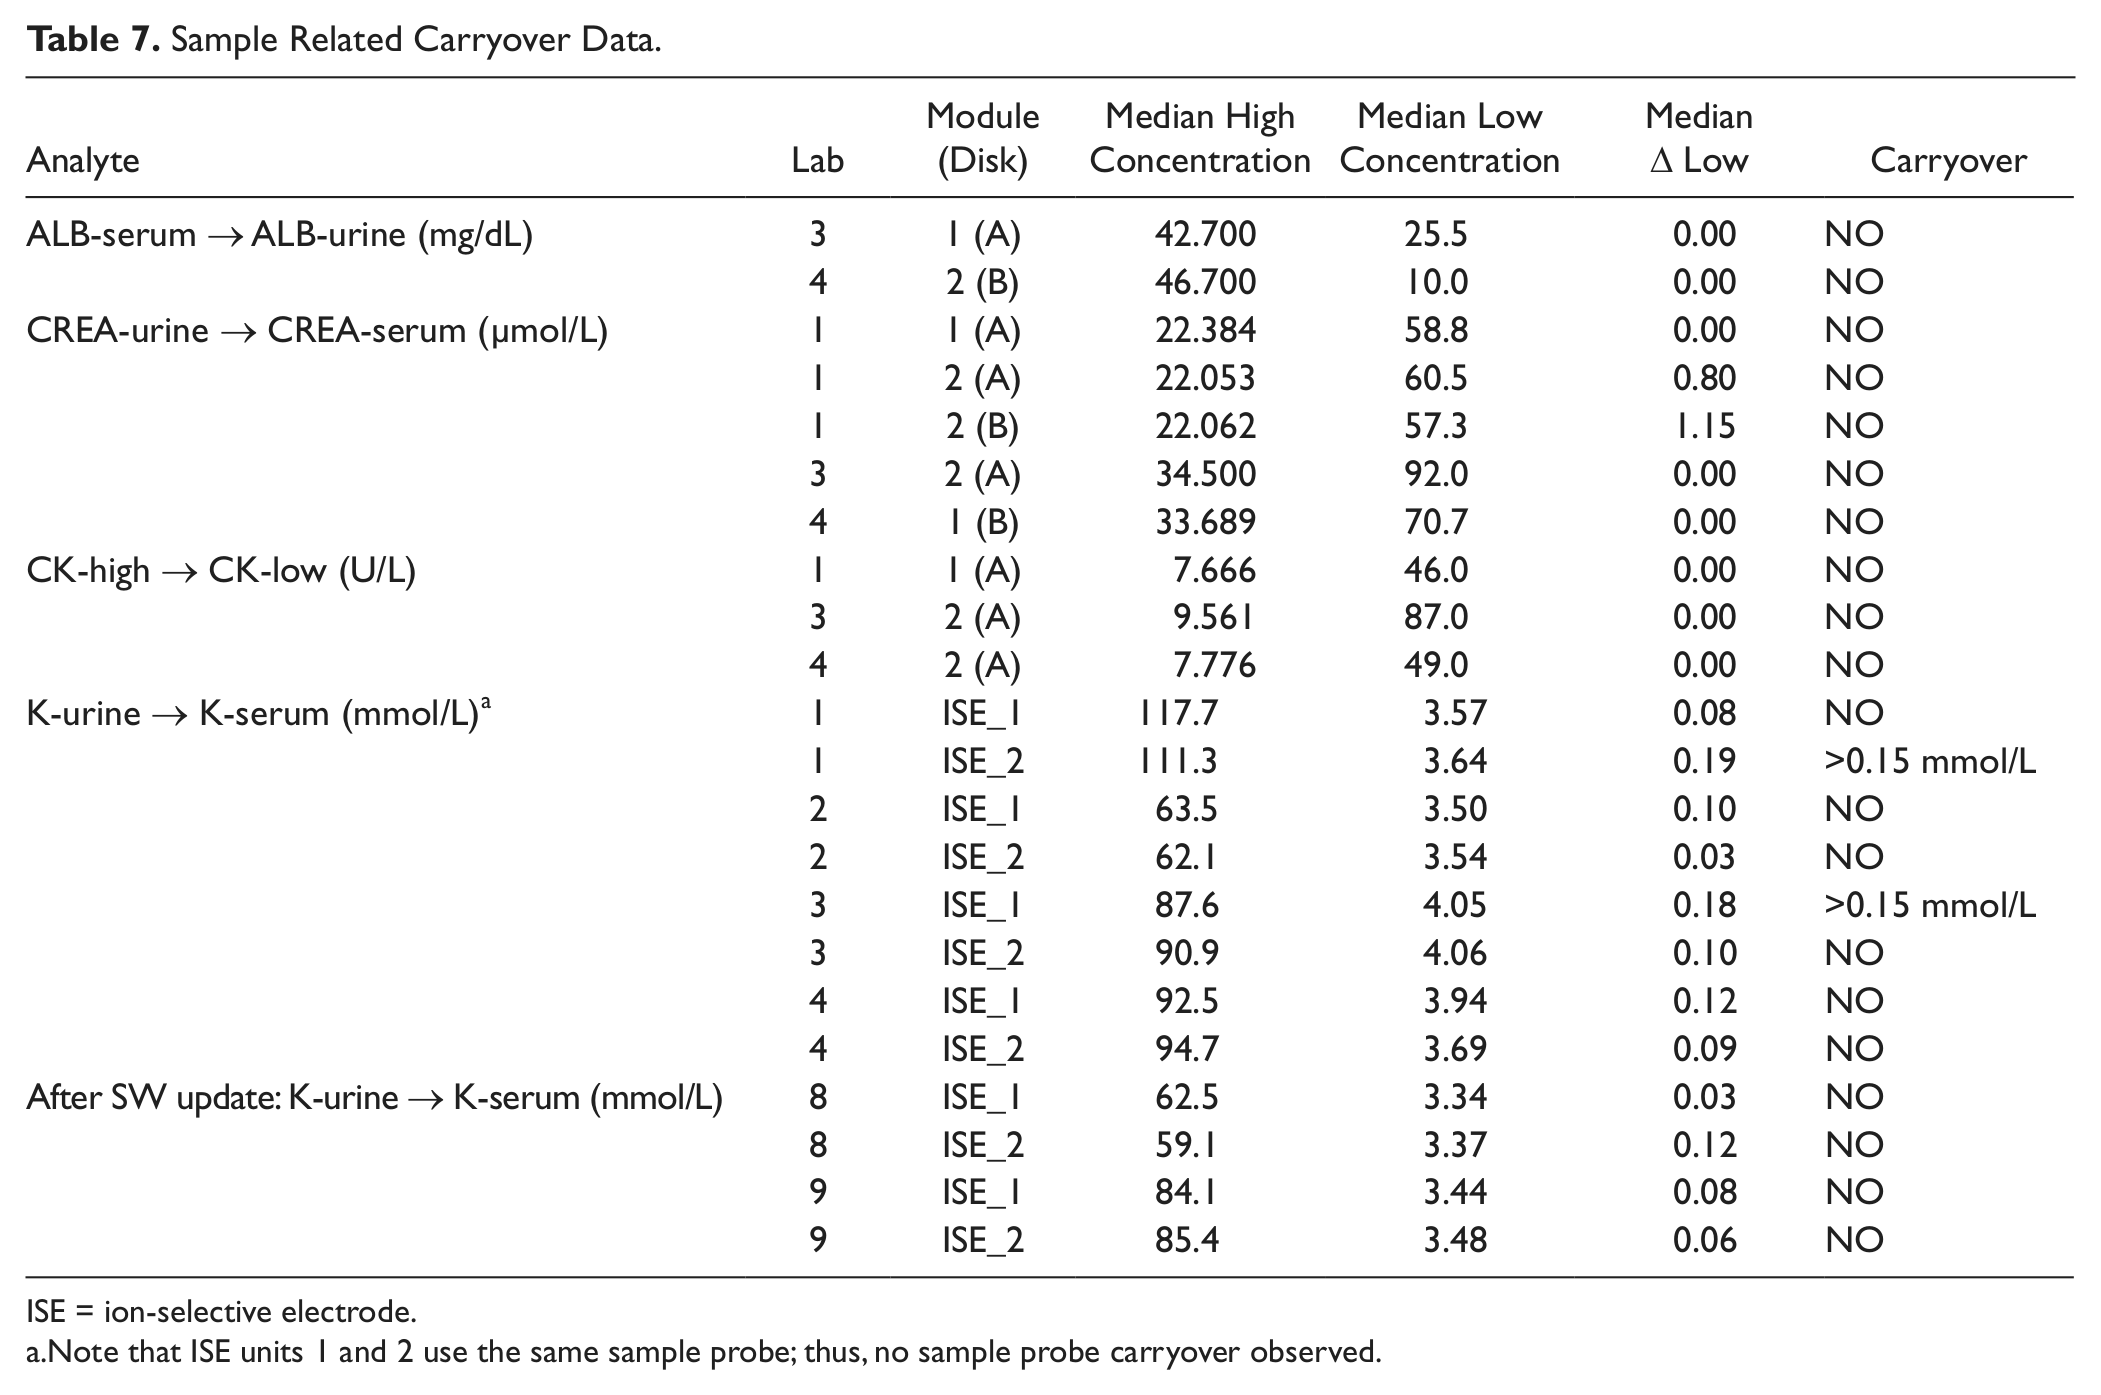
Sample related carryover data are listed in Table 7 . No effects were seen from serum to urinary albumin, from urinary to serum creatinine, and from high to low concentrated CK. An increase of serum potassium results exceeding the acceptance limits was observed after processing urine samples on one of the two installed ISE units, at two of the four sites. Neither the sample itself nor the sample probe was contaminated. The effect was caused by splashing during the sample-aliquot dilution process in the respective ISE units mixing vessel. This phenomenon was corrected in the meantime by sample dispensation optimization with appropriate hardware adjustments and a software update (see postmodification results in Table 7 ).
Sample Related Carryover Data.
ISE = ion-selective electrode.
Note that ISE units 1 and 2 use the same sample probe; thus, no sample probe carryover observed.
Accuracy
QC data
Roche quality controls were measured for each assay before every experiment during the whole study period. More than 81 000 QC results were generated during the first three studies over time periods between 3 and 4 mo each. The precision of these measurements is reported in the “Precision: Repeatability, Intermediate, within Lab, and between Lab” section. Manufacturer target values were recovered within the declared limits.
Interlaboratory survey with reference materials
In addition to Roche control material, six reference materials were measured in this study. Data from 13 of the 14 assays tested are shown in Figure 4 . Although uric acid was measured in SRM 909b I and II, the results are not included in this article. In a certificate revision for SRM 909B issued in March 2010, the uric acid values are noted only as guidance and are no longer declared. Median recoveries were as expected for all analytes in SRM materials. The deviations outside the target range of ±5% in the ring trial experiment for Cl is caused by a matrix-related effect due to the low nonphysiological bicarbonate level in SRM 909b I.
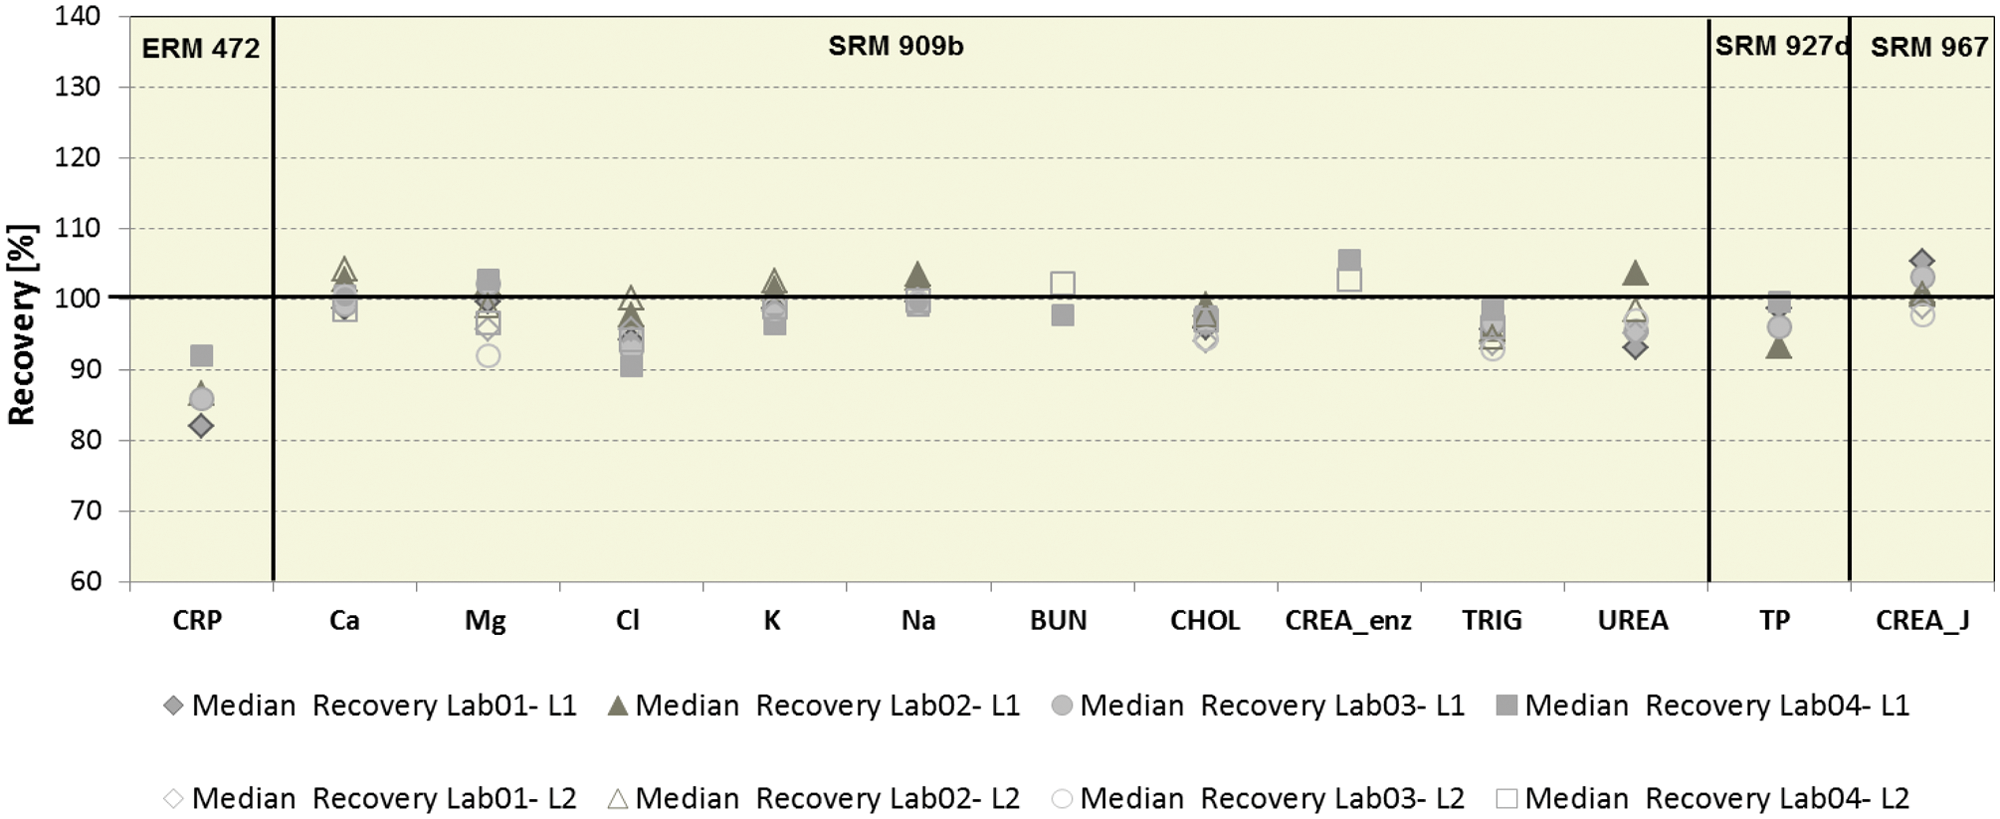
Analyte recovery in certified reference materials (SRM 909b levels I, II; SRM 727c, SRM 967 levels I, II; and ERM DA 472) on cobas 8000 at four labs.
In the case of CRP, Roche is using two different CRP reagents (Gen 3 on cobas systems and Gen 2 on COBAS Integra systems). The Gen 2 reagent is standardized based on ERM 472. The Gen 3 reagent is standardized to Gen 2 via a method comparison using patient samples with analyte concentrations over the entire measuring range. This approach results in a close agreement (slope of 1.0) between both reagents in patient sera, whereas recoveries in the reference material differ.
Functionality Testing under Routine-like Conditions
Workflow Analysis
General remarks
Eight different module combinations were used for these experiments incorporating all available analytical modules (cobas c 701, cobas c 702, cobas c 502 and cobas e 602 with ISE 1800 or ISE 900). We present here the workflow aspects analyzed for 14 representative workloads processed on these systems at 12 sites. The key workflow parameters discussed below are request throughput (cumulative requests ordered over time) and sample processing time (SPT; time from request order to final result). Request ordering is initiated when the sample passes the barcode reader just after entering the transportation line (see system schema in Figure 1 ). The optimal sample routing within the system is determined by the system software, and the sample is transported accordingly. The sample turnaround time (TAT; time from sample placement on the sample loader to final result) was calculated for some workloads. In this case, manual documentation of the sample load time by the operator was required, whereas all other mentioned time stamps for SPT calculation are captured electronically by the system.
The request patterns represented varied commercial and hospital laboratory needs, including medium- to high-level assay consolidation as well as integration of STAT samples, as shown in Table 8 .
Overview of Processed Workloads (1 to 14) at the Participating Laboratories (Workload Number ≠ Lab Number).
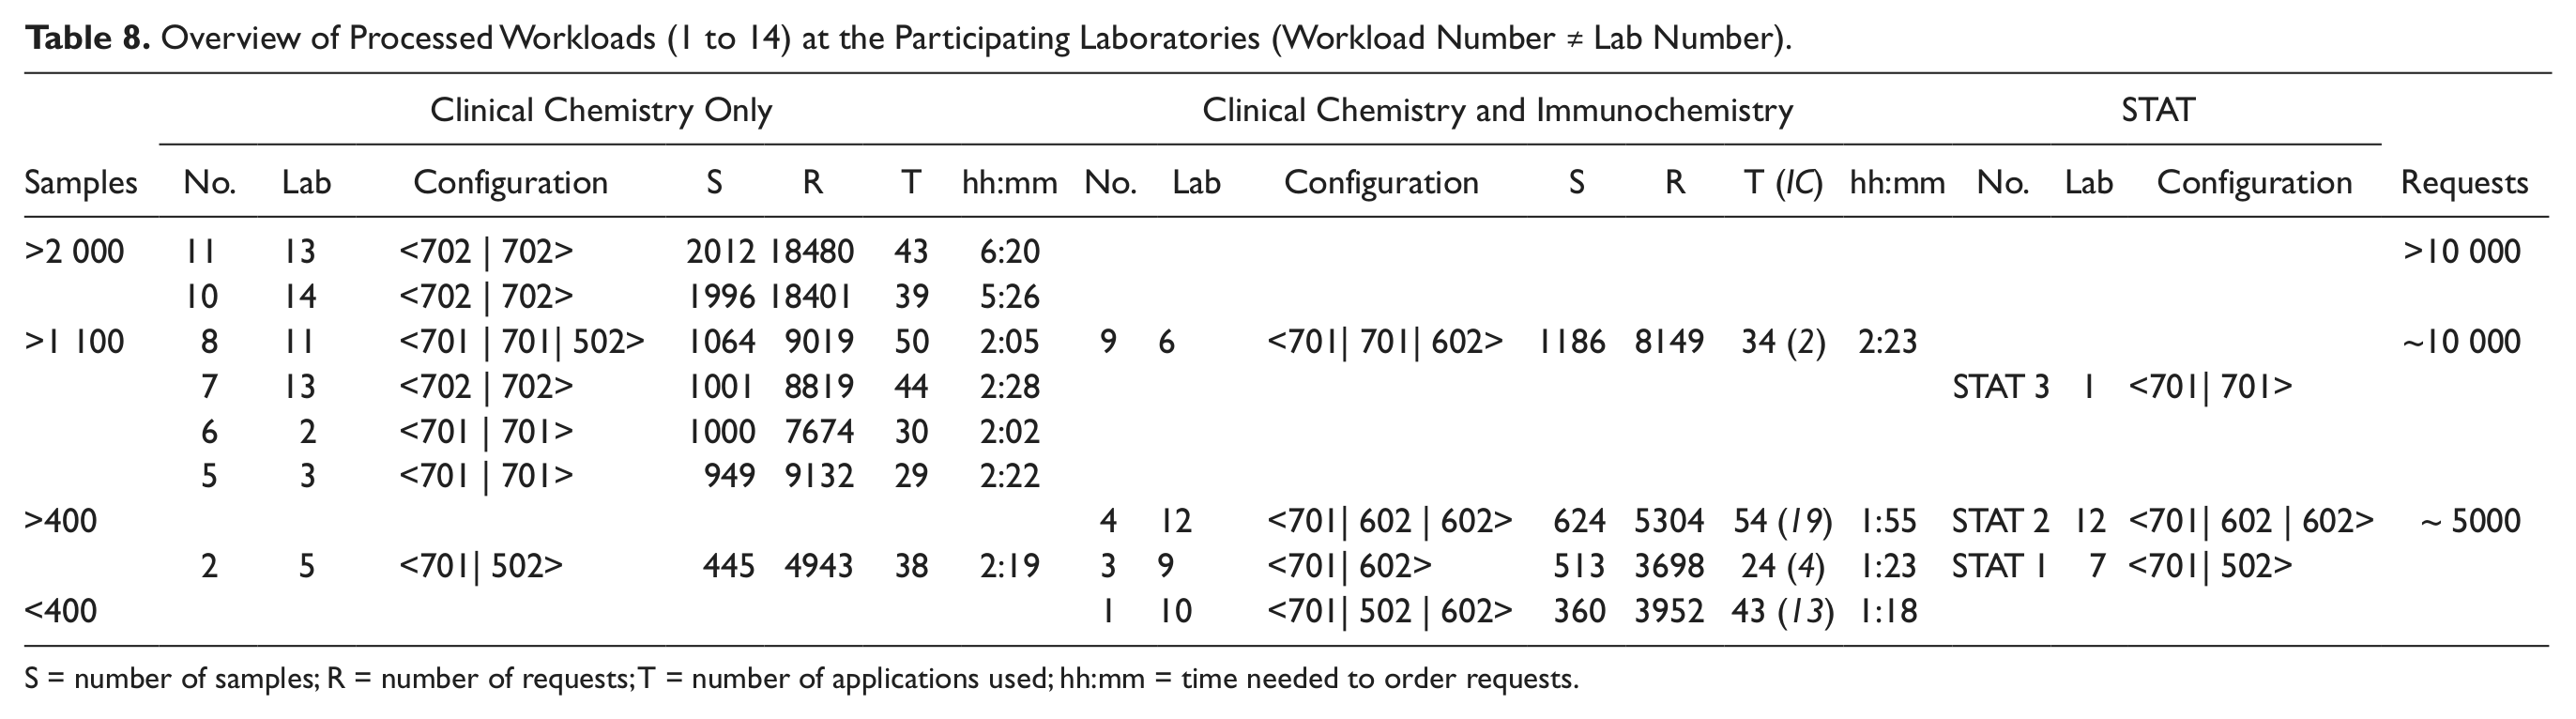
S = number of samples; R = number of requests; T = number of applications used; hh:mm = time needed to order requests.
Four workloads (1, 3, 4, and 9) combine general chemistry plus homogeneous immunoassay (CC) testing with heterogeneous immunochemistry (IC) testing, each on different hardware configurations. CC-only workloads (5, 6, 7, and 8) of ~1000 samples for 29 to 50 applications were processed on three different hardware configurations. Two further CC-only routine workloads were run on dual cobas c 702 configurations with (11) and without (10) automatic reagent loading during operation at the respective sites. One lower-volume workload (2) for general chemistries and specific proteins including EDTA blood challenged the performance when the maximum test volume is assigned to the medium-volume cobas c 502 module in combination with a cobas c 701 module. The integration of STAT samples was investigated on CC-only and CC/IC–combined configurations (STAT 1, STAT 2, STAT 3).
The systems were continually fed with samples while processing the respective workloads. Adherence to a standardized stringent procedure was not specified across all sites, so small feeding breaks resulting in variations between labs and workloads were taken into consideration and deemed acceptable for the analysis.
CC-only workloads
Despite the varied degree of assay consolidation ranging between 29 and 50 methods, as well as the differing site-specific request patterns (5 and 7 represent hospital laboratories in Australia and Europe, 6 and 8 commercial laboratories in Germany and the United States), we see that the time required to process the requests for the four workloads on dual cobas c 701 or cobas c 702 configurations is quite similar, between 2 and 2½ h ( Table 8 ).
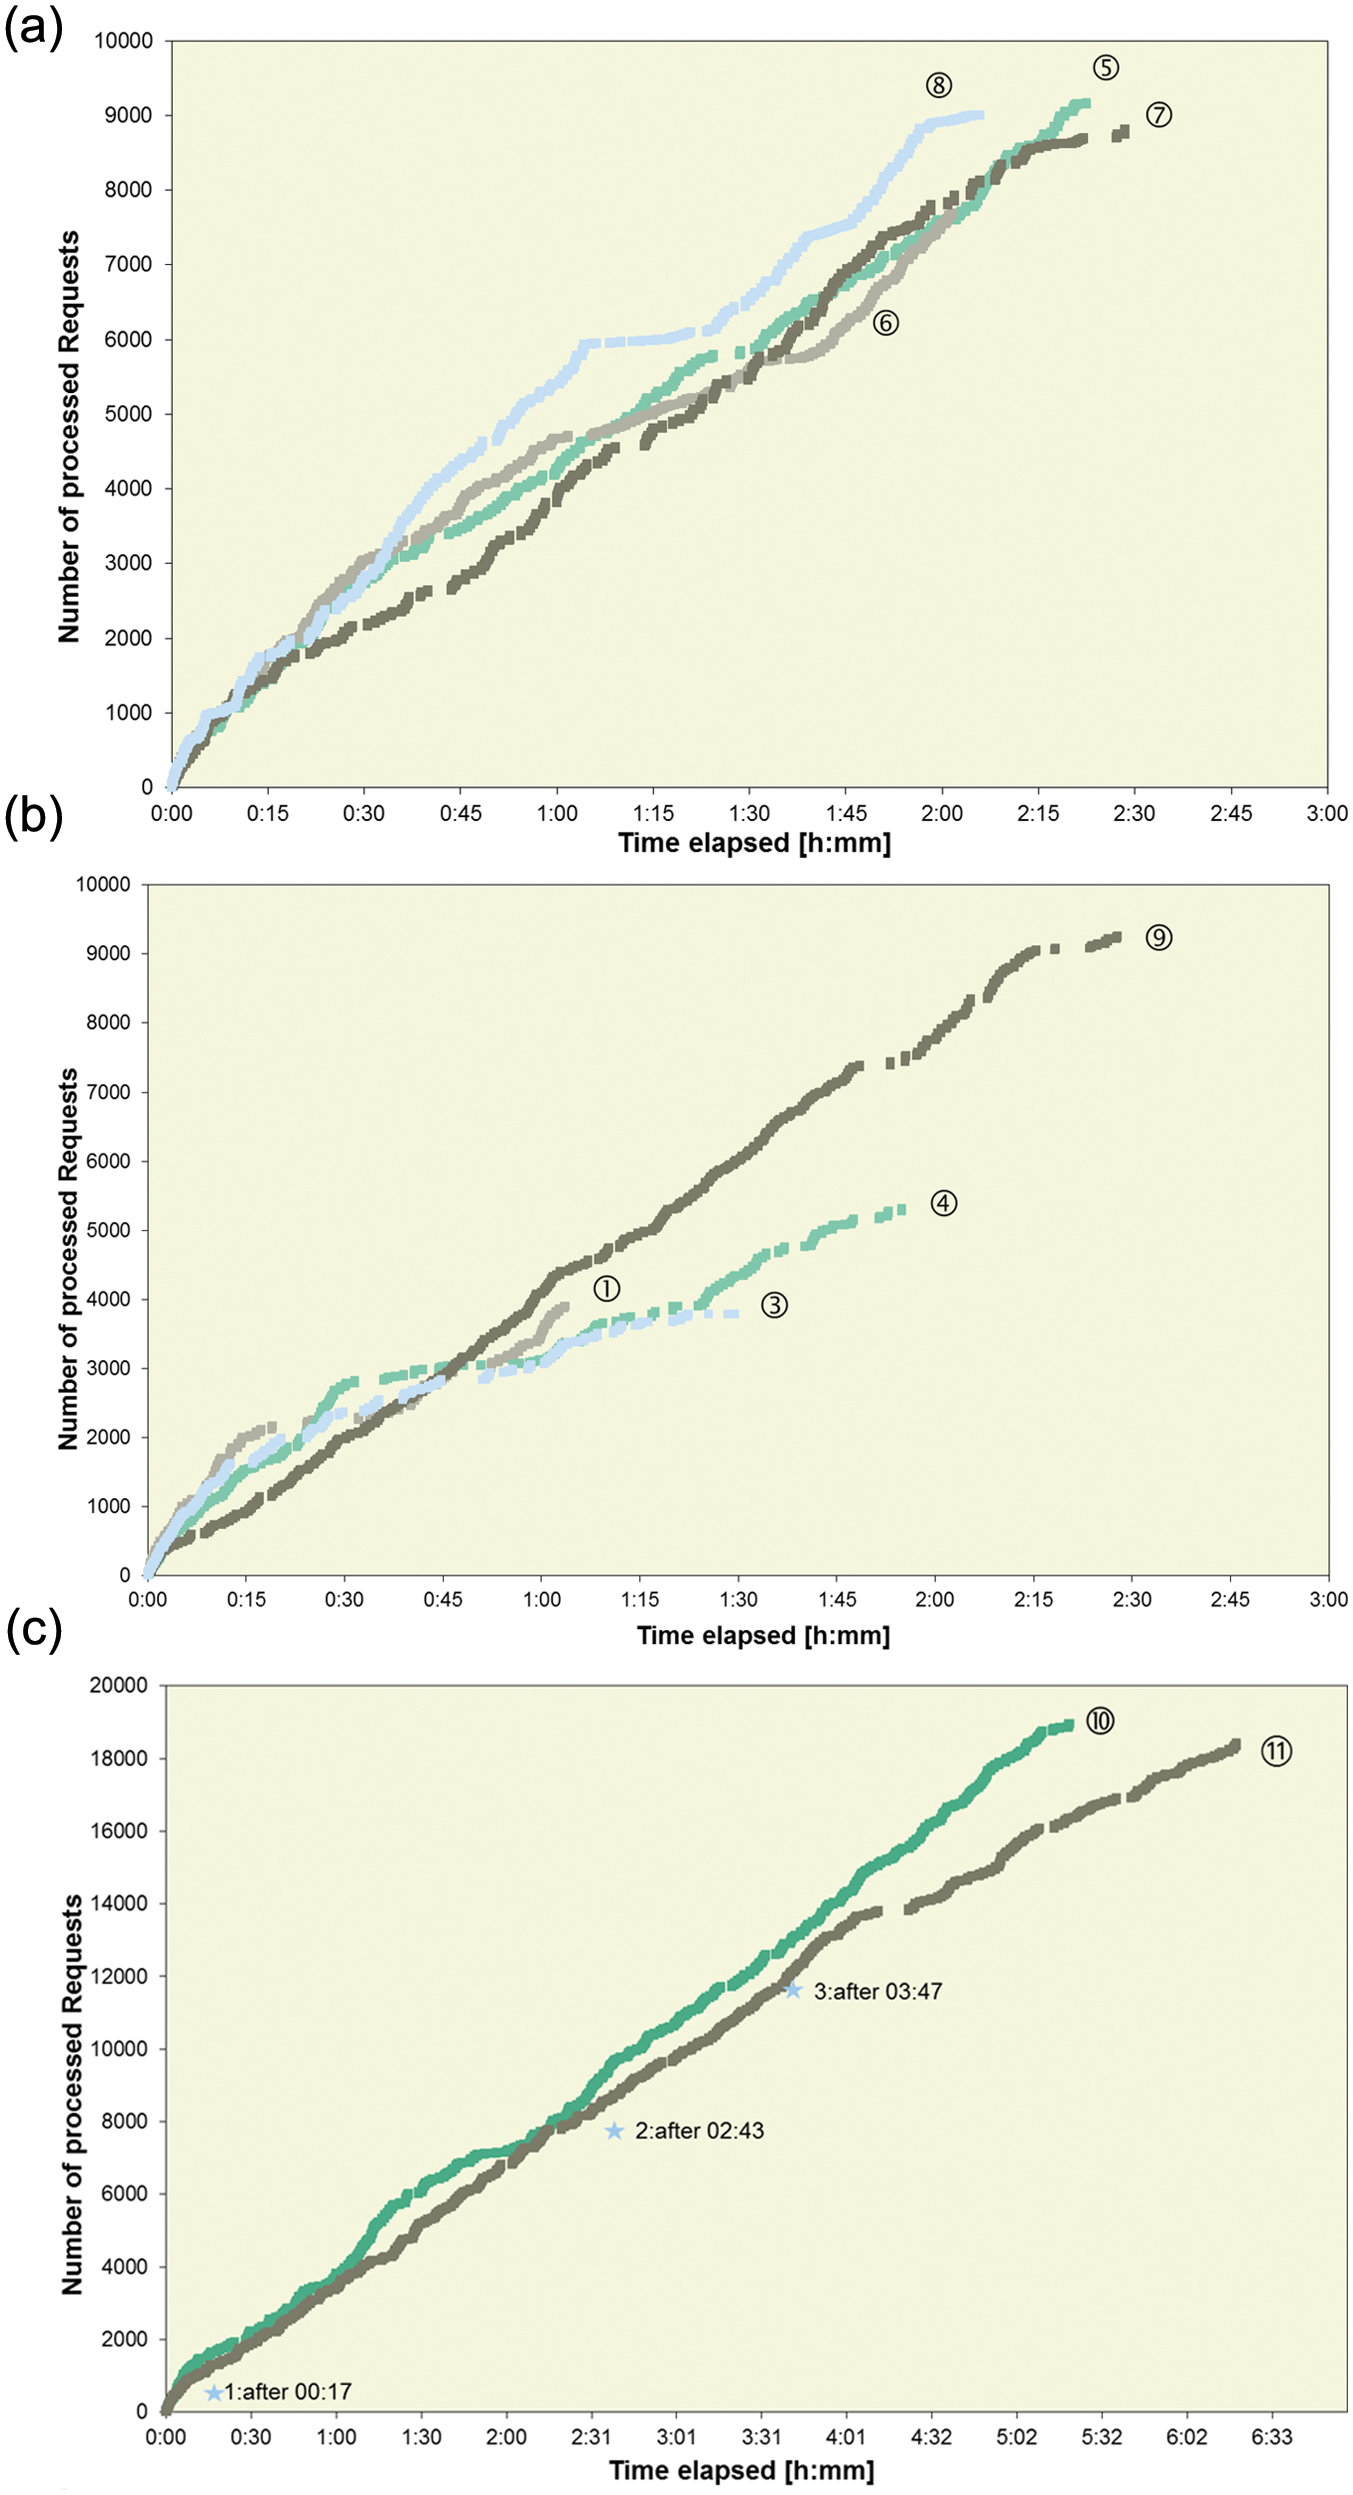
As shown in Figure 5a , after 2 h, ~8000 requests were registered for three (5, 6, and 7) of four workloads on dual configurations and about 9000 requests for workload 8. Prior to starting the studies at site 11, the routine workloads were analyzed using the cobas 8000 simulator, a tool that serves as an aid to research and development (RD) staff in identifying the module combinations most suitable to meet the specific laboratory’s needs. Being equipped with the same workflow engine that is embedded in cobas 8000, this simulator allows a real-world laboratory workload analysis, thus supporting the identification of the best fit solution for the lab.
(
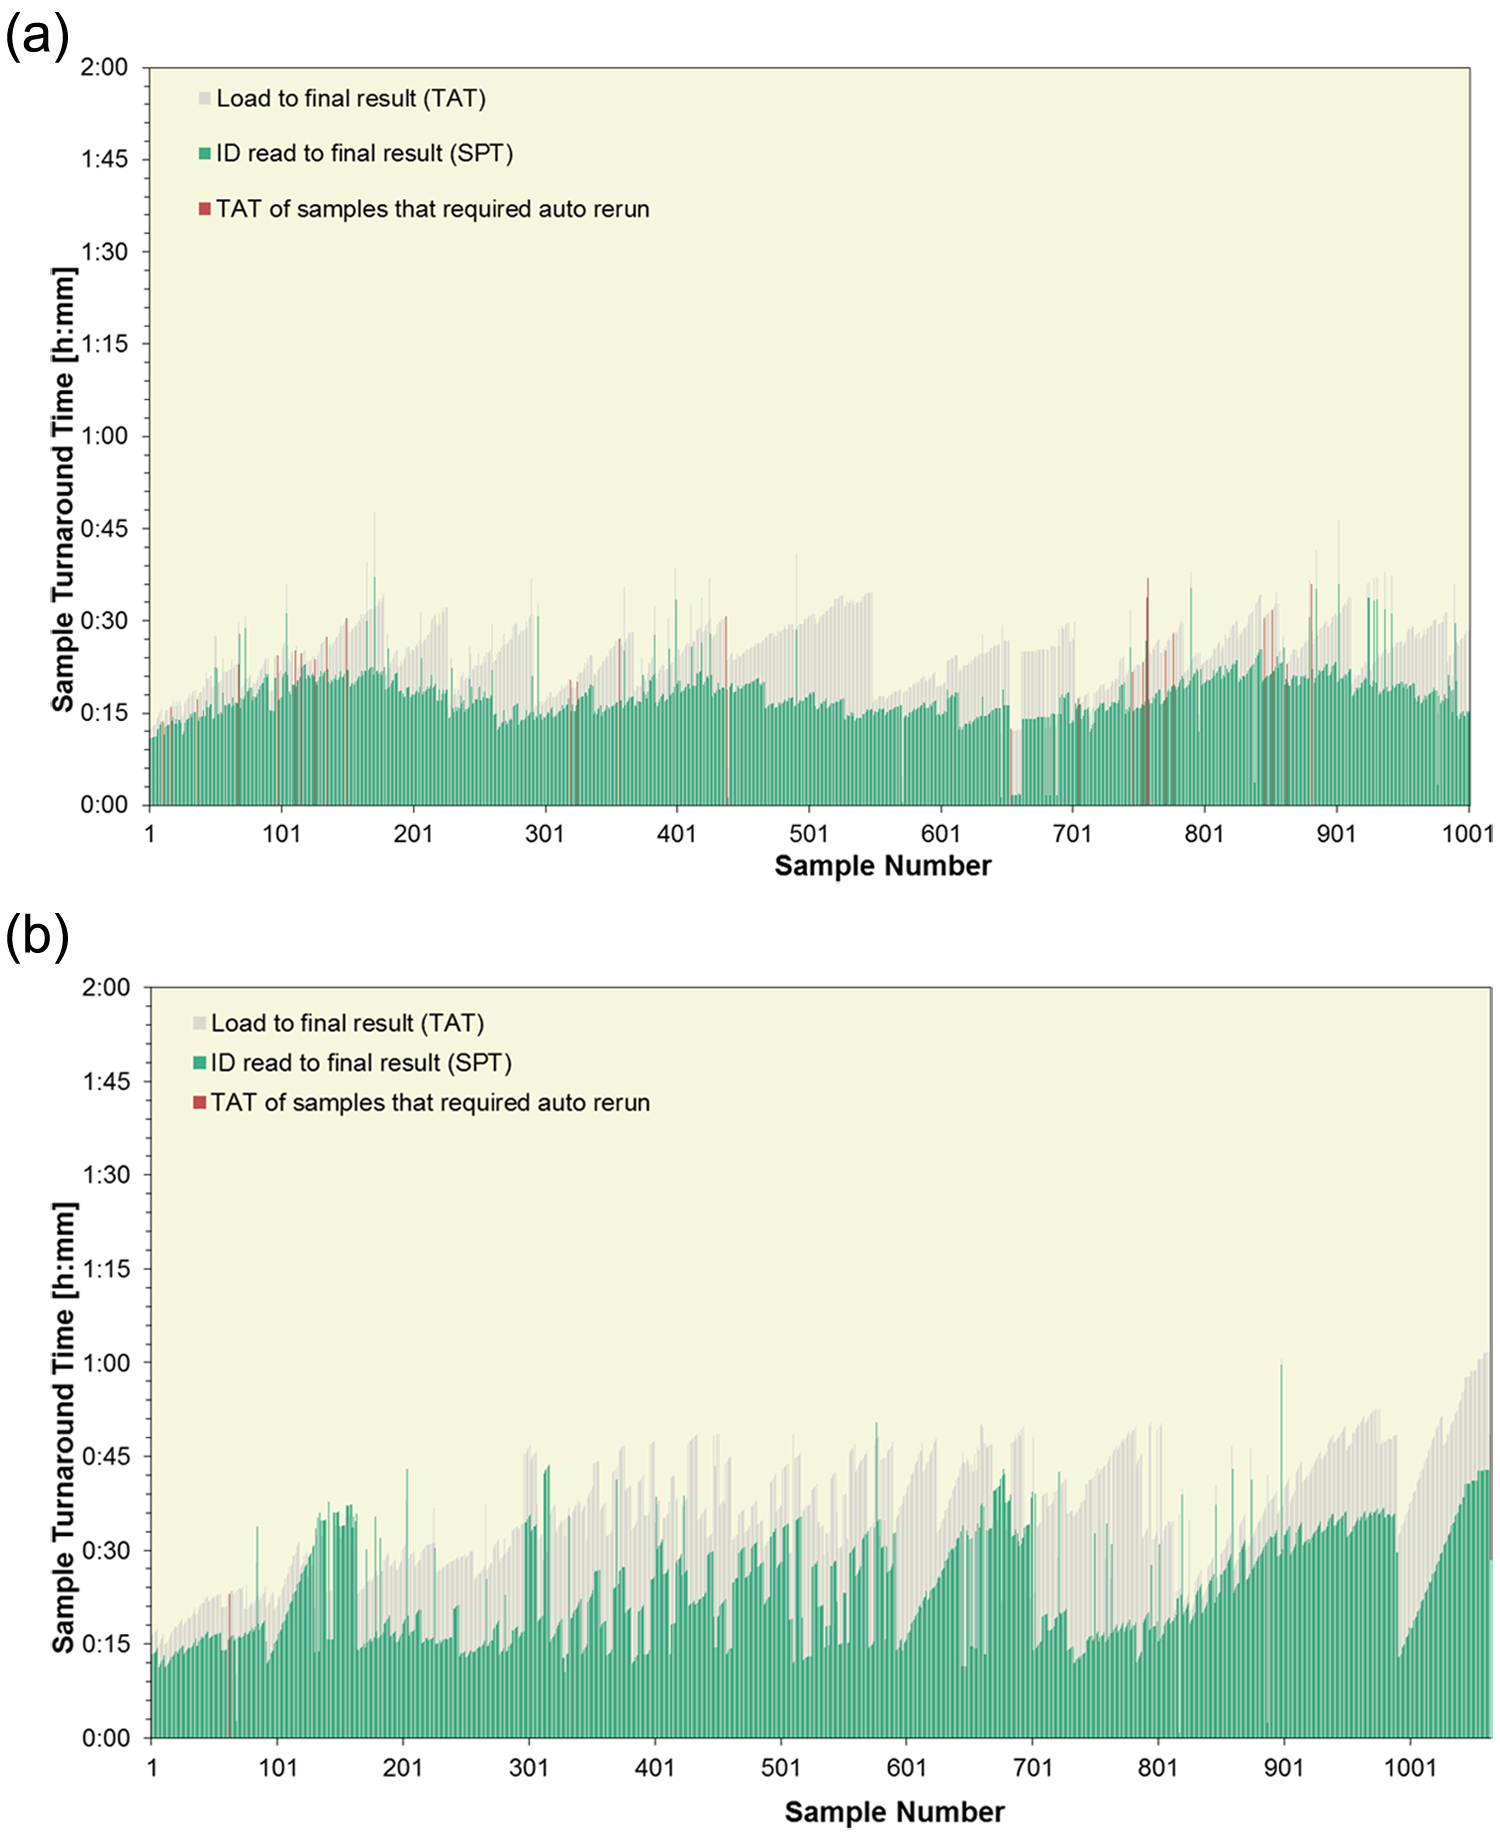
The median SPT for the four ~1000 sample volume workloads was between 14 and 21 min, with >96% processed within 40 min and all samples processed within 1 h. Sample TATs, time from loading on the sample input buffer to final results, are shown for workloads 7 and 8 in Figure 6a , b . All but four of workload 7 samples were ready within 40 min; 95% of samples in workload 8 were completed within 60 min, with reruns included in both cases. The median TATs were 25 min and 37 min, respectively. Although the SPT remains quite stable and reproducible throughout similar workloads (see the median sample processing time for workloads 5, 6, 7, 10, and 11 in Table 9 ), the dwell time on the sample loader prior to sample registration, which is the time added to SPT for sample TAT calculation, depends largely on the sample loading or feeding habits practiced in the laboratory.
(
Workflow for 11 Workloads (7 CC Only and 4 CC + IC: 1, 3, 4, 9): Median SPT and Percentage of Samples Processed within 40 min and within 60 min per Workload. a
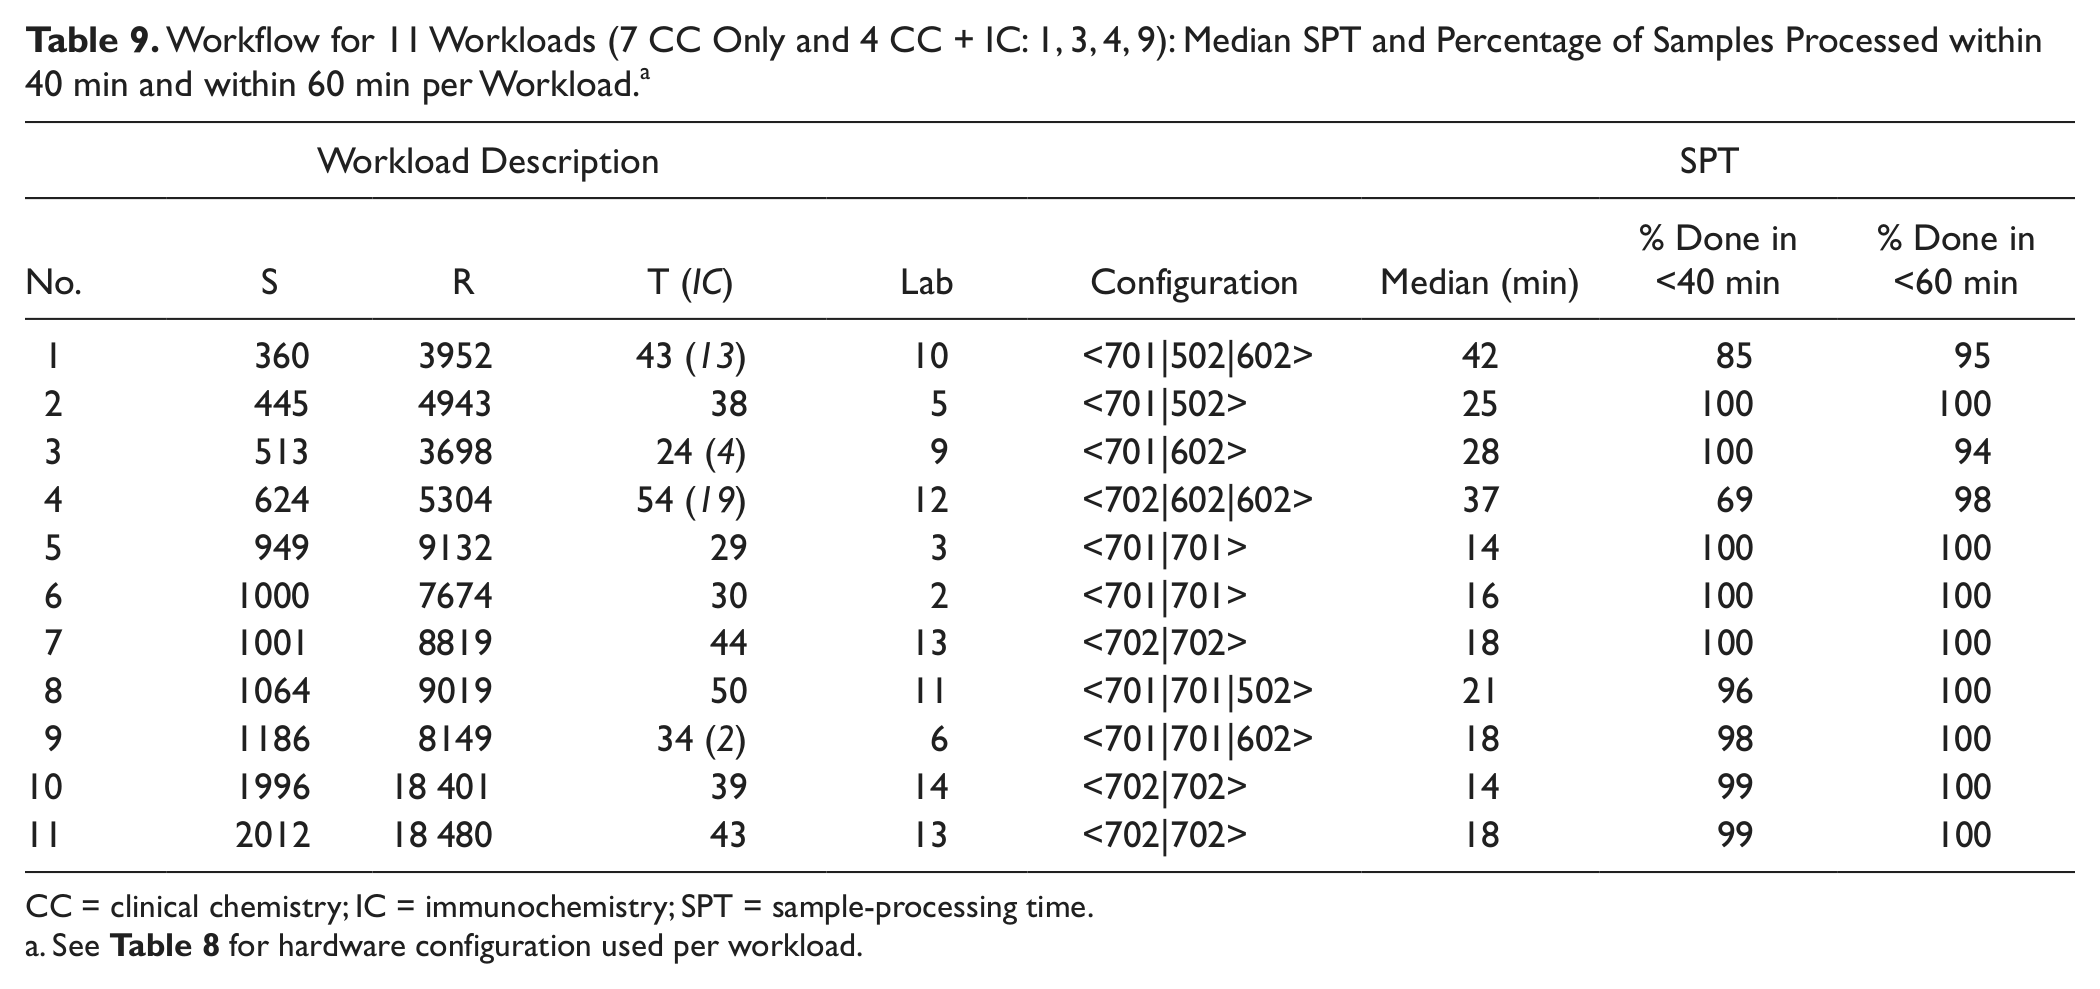
CC = clinical chemistry; IC = immunochemistry; SPT = sample-processing time.
See Table 8 for hardware configuration used per workload.
If the operator ensures that every empty 75-position tray is immediately replaced with a new one, thus continually using the maximum loading capacity of 300 samples, the higher TATs observed for workload 8 apply. The feeding pattern for workload 7 does ensure continual feeding of samples to the system but without exhausting the buffer capacity of 300 samples in the loader. For processing, the system automatically feeds the samples onto the tracks in the chronological placement order of the trays with up to 75 samples each. Labs can apply the loading practices best suited to their working environment.
For workload 2 ( Table 8 ), the request patterns were modified to simulate maximum utilization of the medium-volume cobas c 502 module in combination with a high-volume cobas c 701 module. The rule of thumb to maintain the efficiency of the cobas c 701 within this combination is allow for maximum 10% of all wet chemistry requests to process on the cobas c 502. For workload 2, it was 11% (438 on cobas c 502, 3845 on cobas c 701, and 629 on ISE). In addition, a sample predilution or pretreatment step was needed for 186 of the 438 specific protein requests. These, however, were balanced out by a similar number (~200) of automatic sample predilutions required for urine chemistries on the cobas c 701 module. The median SPT is 25 min, and all requests were processed within 40 min ( Table 9 ). The overall operation time of the cobas c 502 module (2 h 28 min) exceeded that of the cobas c 701 module by 9 min, an idle nonproductive time. Nonetheless, after 1 h, ~2500 requests were registered on this hardware configuration.
Consolidation of CC and IC
Workloads 1, 3, 4, and 9 are each processed on different hardware configurations and vary in degree of consolidation, with requests for between 2 and 19 ICs ( Fig. 5b ). As expected, the processing speed is driven by the number of CC modules. After 1 h, ~3000 requests are ordered on both configurations including one cobas c 701 or cobas c 702 module (3, 4), ~3500 requests on the configuration that also includes a cobas c 502 module (1), and ~4100 requests on the dual cobas c 701 configuration (9). Similarly, the SPTs differ on configurations using a single versus dual high-throughput CC modules for similar workloads (SPT of 18 min for workload 9 using dual cobas c 701 modules versus 28 min for workload 3 using a single cobas c 701). With an increasing number of IC assays being processed, the SPT rises accordingly (median SPT of 37 and 42 min for 4 and 1, respectively). The distribution of CC and IC requests for these four workloads is presented in Table 10 . It is interesting to note that 29% of the samples from workloads 1, 4, and 9 have requests for CC plus IC despite the big difference in number of ICs installed at the respective sites. With 19 ICs on the dual cobas e 602 modules used to process workload 4, there is room for further menu expansion on these IC modules, which were both in operation for 20 min less than the cobas c 702.
Distribution of Requests for the CC and IC Consolidated Workloads 1, 3, 4, and 9.
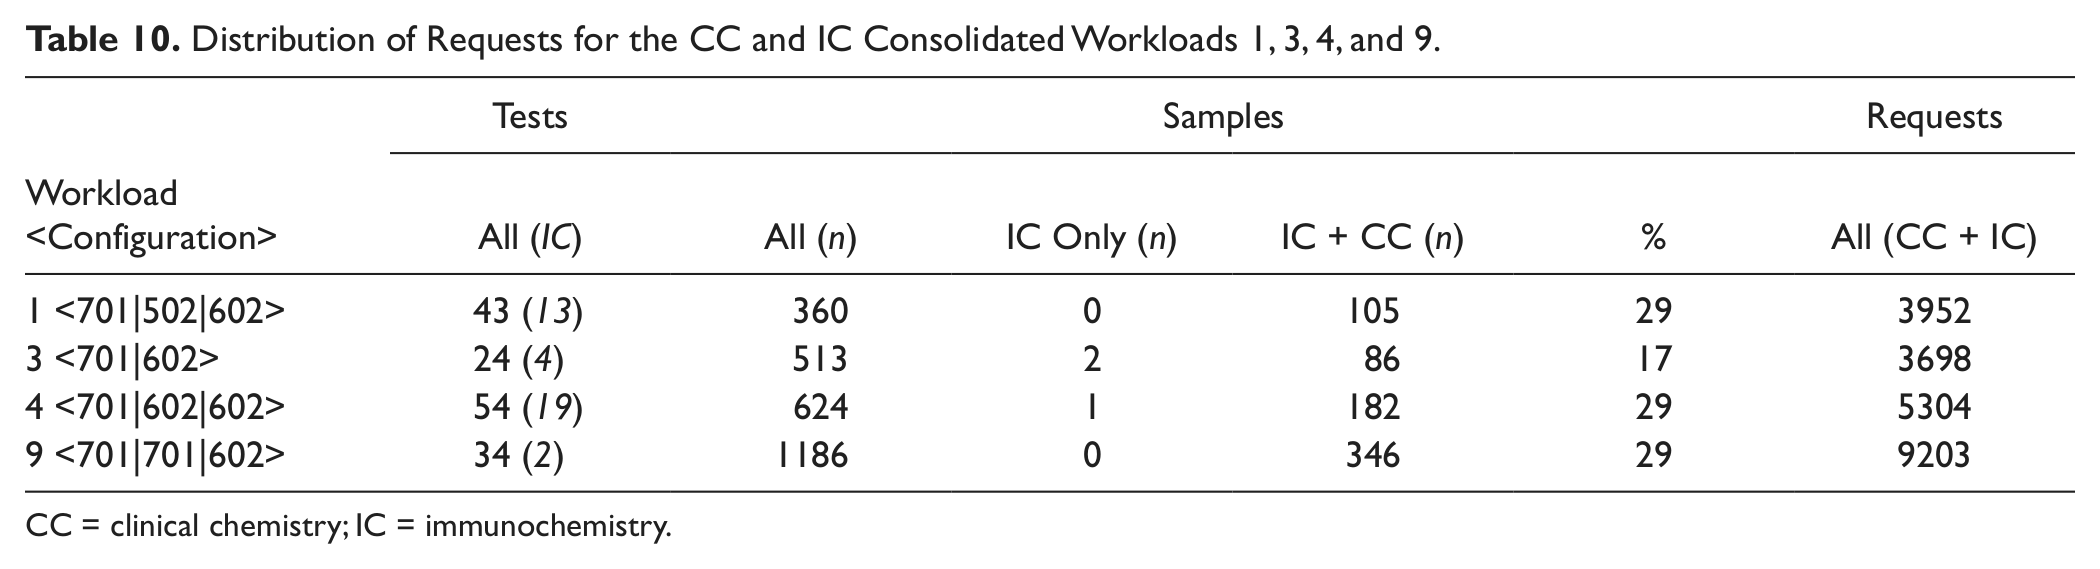
CC = clinical chemistry; IC = immunochemistry.
Application of special features
Automatic reagent loading during operation (“on the fly”) and corresponding automated analysis of QCs stored on board the system, including two hourly auto QCs of all assays throughout a main shift, were investigated during workload 11 on a dual cobas c 702 configuration.
Over the ~6 h operation time, three loading events were automatically triggered ( Fig. 5c ). The trigger that initiates such a loading event is a user-definable “remaining test count” setting. Various rules are applied to balance the need to sustain maximum system productivity while avoiding unnecessary reduction of the c-pack on-board stability by opening the pack hours before its first use. Workload 10, which is quite similar in size and request pattern to workload 11, was also processed on a dual cobas c 702 but without loading reagents during operation. The comparison of request ordering for the ~2000 samples in both workloads is presented in Figure 5c . With three loading events of 7 min each, the resulting module idle time of 21 min is equivalent to ~700 skipped pipetting steps during workload 11. The graph shows that at 4 h, 13 319 requests are registered for workload 11 and 14 137 for workload 10. This delta of 816 requests is very close to the theoretical 700 considering that the workloads are not identical and sample feeding by the operators was not standardized between the sites. The lag phases after 4 h for workload 11 are driven by delayed sample feeding and unloading, not by system inefficiency. Processing of nearly all (99%) samples was complete within 40 min ( Table 9 ) for workload 11.
To simulate the impact of a potential longer module maintenance or service action during routine operation on the <701 | 701| 502> configuration, one of the two cobas c 701 modules was masked and workload 8 reprocessed. Because the 26 high-volume assays were mirrored on both installed cobas c 701 modules, it was possible to complete the workload (9019 requests for 50 methods and 1064 samples) with one module masked in ~4 h.
STAT samples were integrated within typical routine workloads at three sites (labs 1, 7, and 12). The time to results are shown in Table 11 . During the CC-only workloads processed on two different hardware configurations, the median SPTs for STATs were 13 min and 20 min during combined CC and IC workloads.
Sample TATs for STAT Samples Processed during Peak Workloads on Three Different Hardware Configurations.
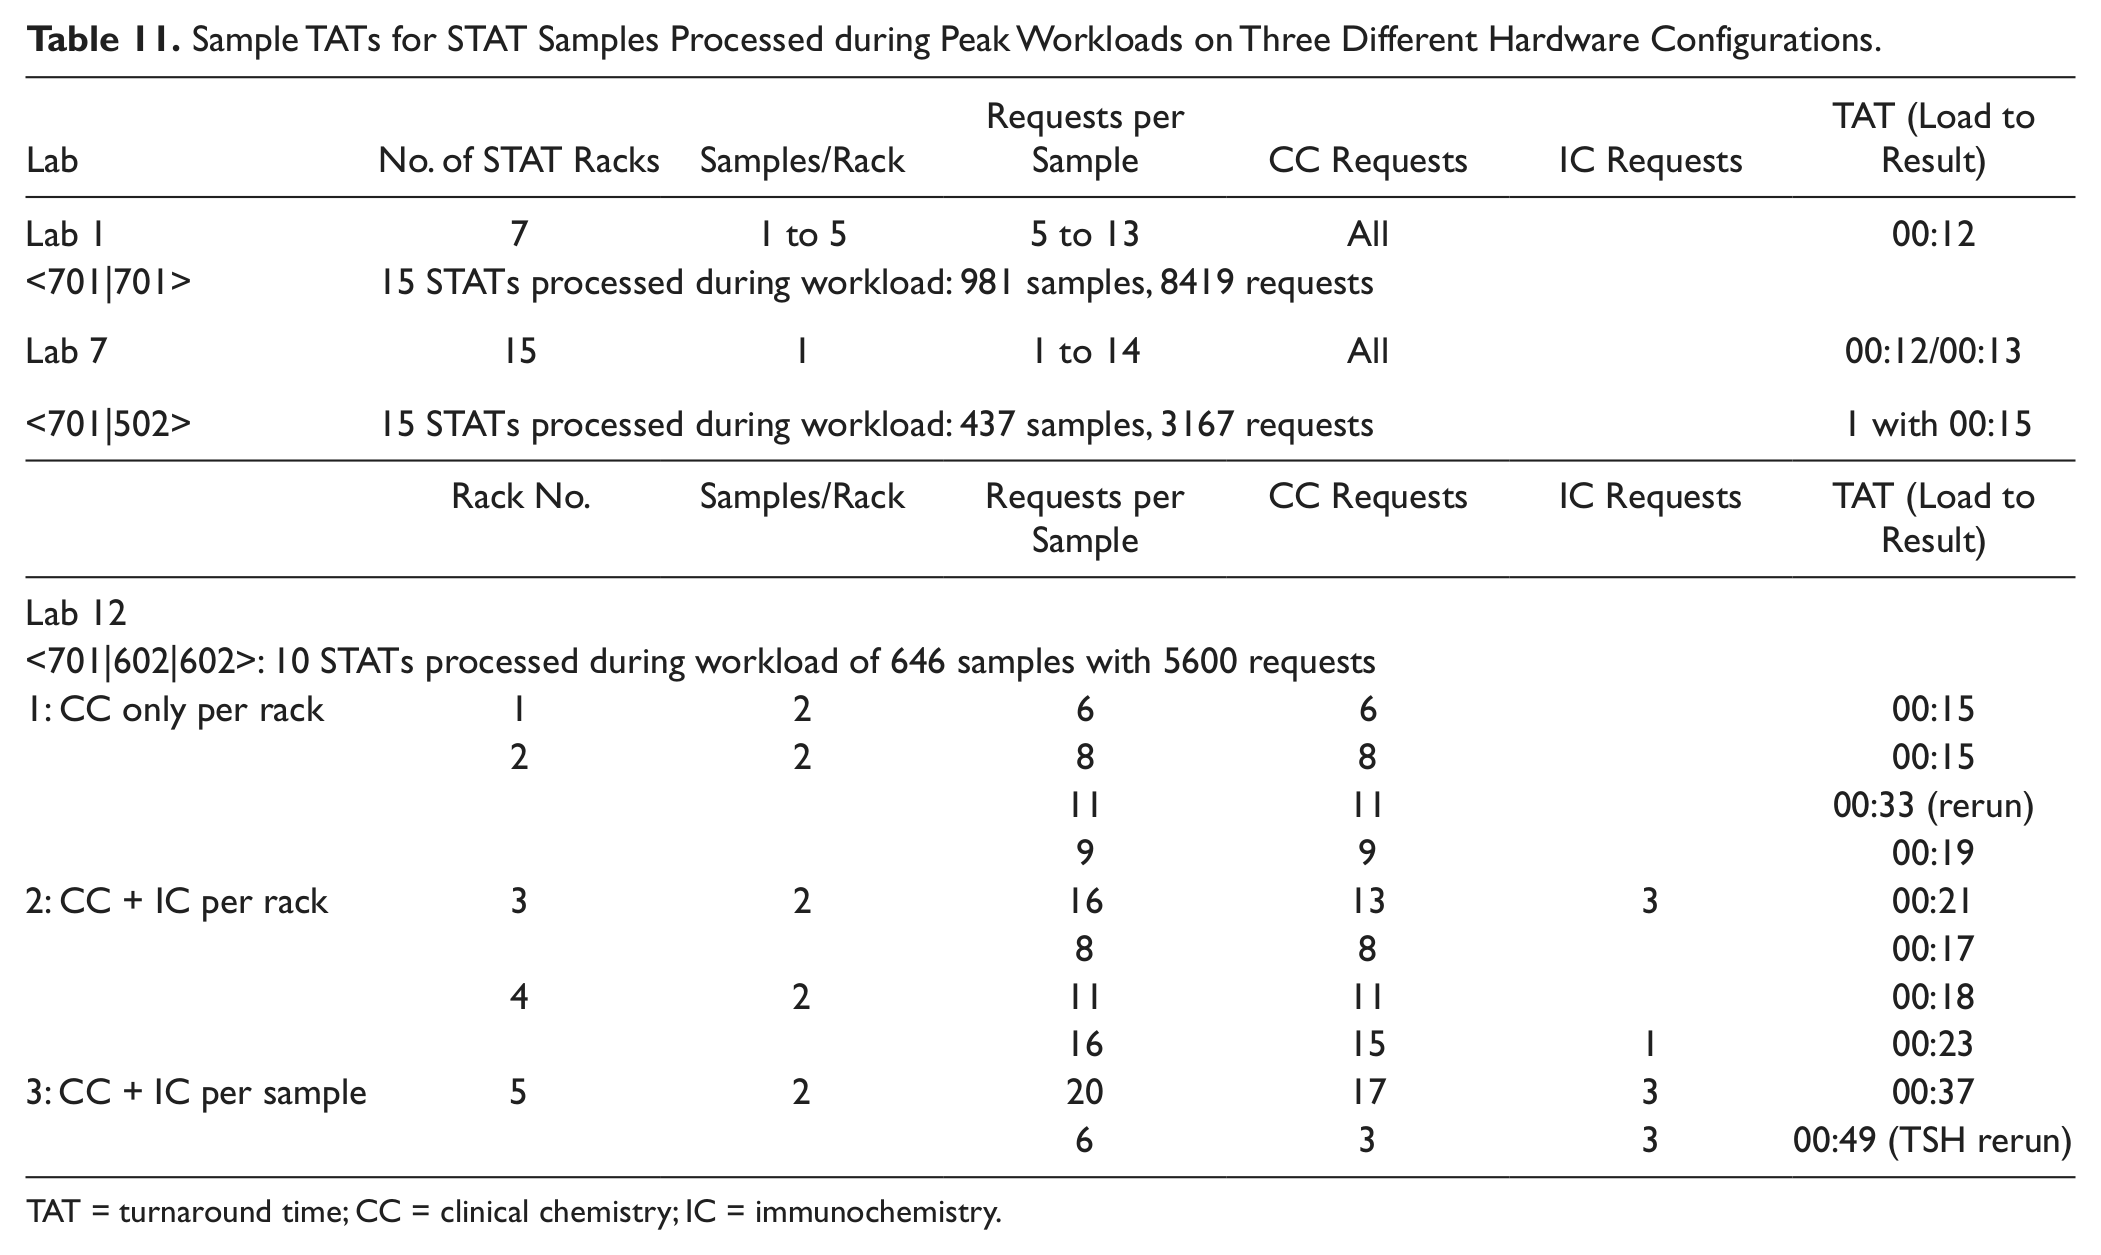
TAT = turnaround time; CC = clinical chemistry; IC = immunochemistry.
Method Comparison Download
Key statistical data from all comparisons whenever >50 samples were tested by the study sites are listed in Table 12 . Although all sites used different reagent and calibrator lots on their routine instrumentation, we pooled the data from all validated comparisons whenever the same comparison methods were used. The statistical key data from ~146 000 results represent a real-world comparison of the new platform with the established Roche routine instrumentation over about 2 y.
Key Statistical Data from Pooled Method Comparison Results. a
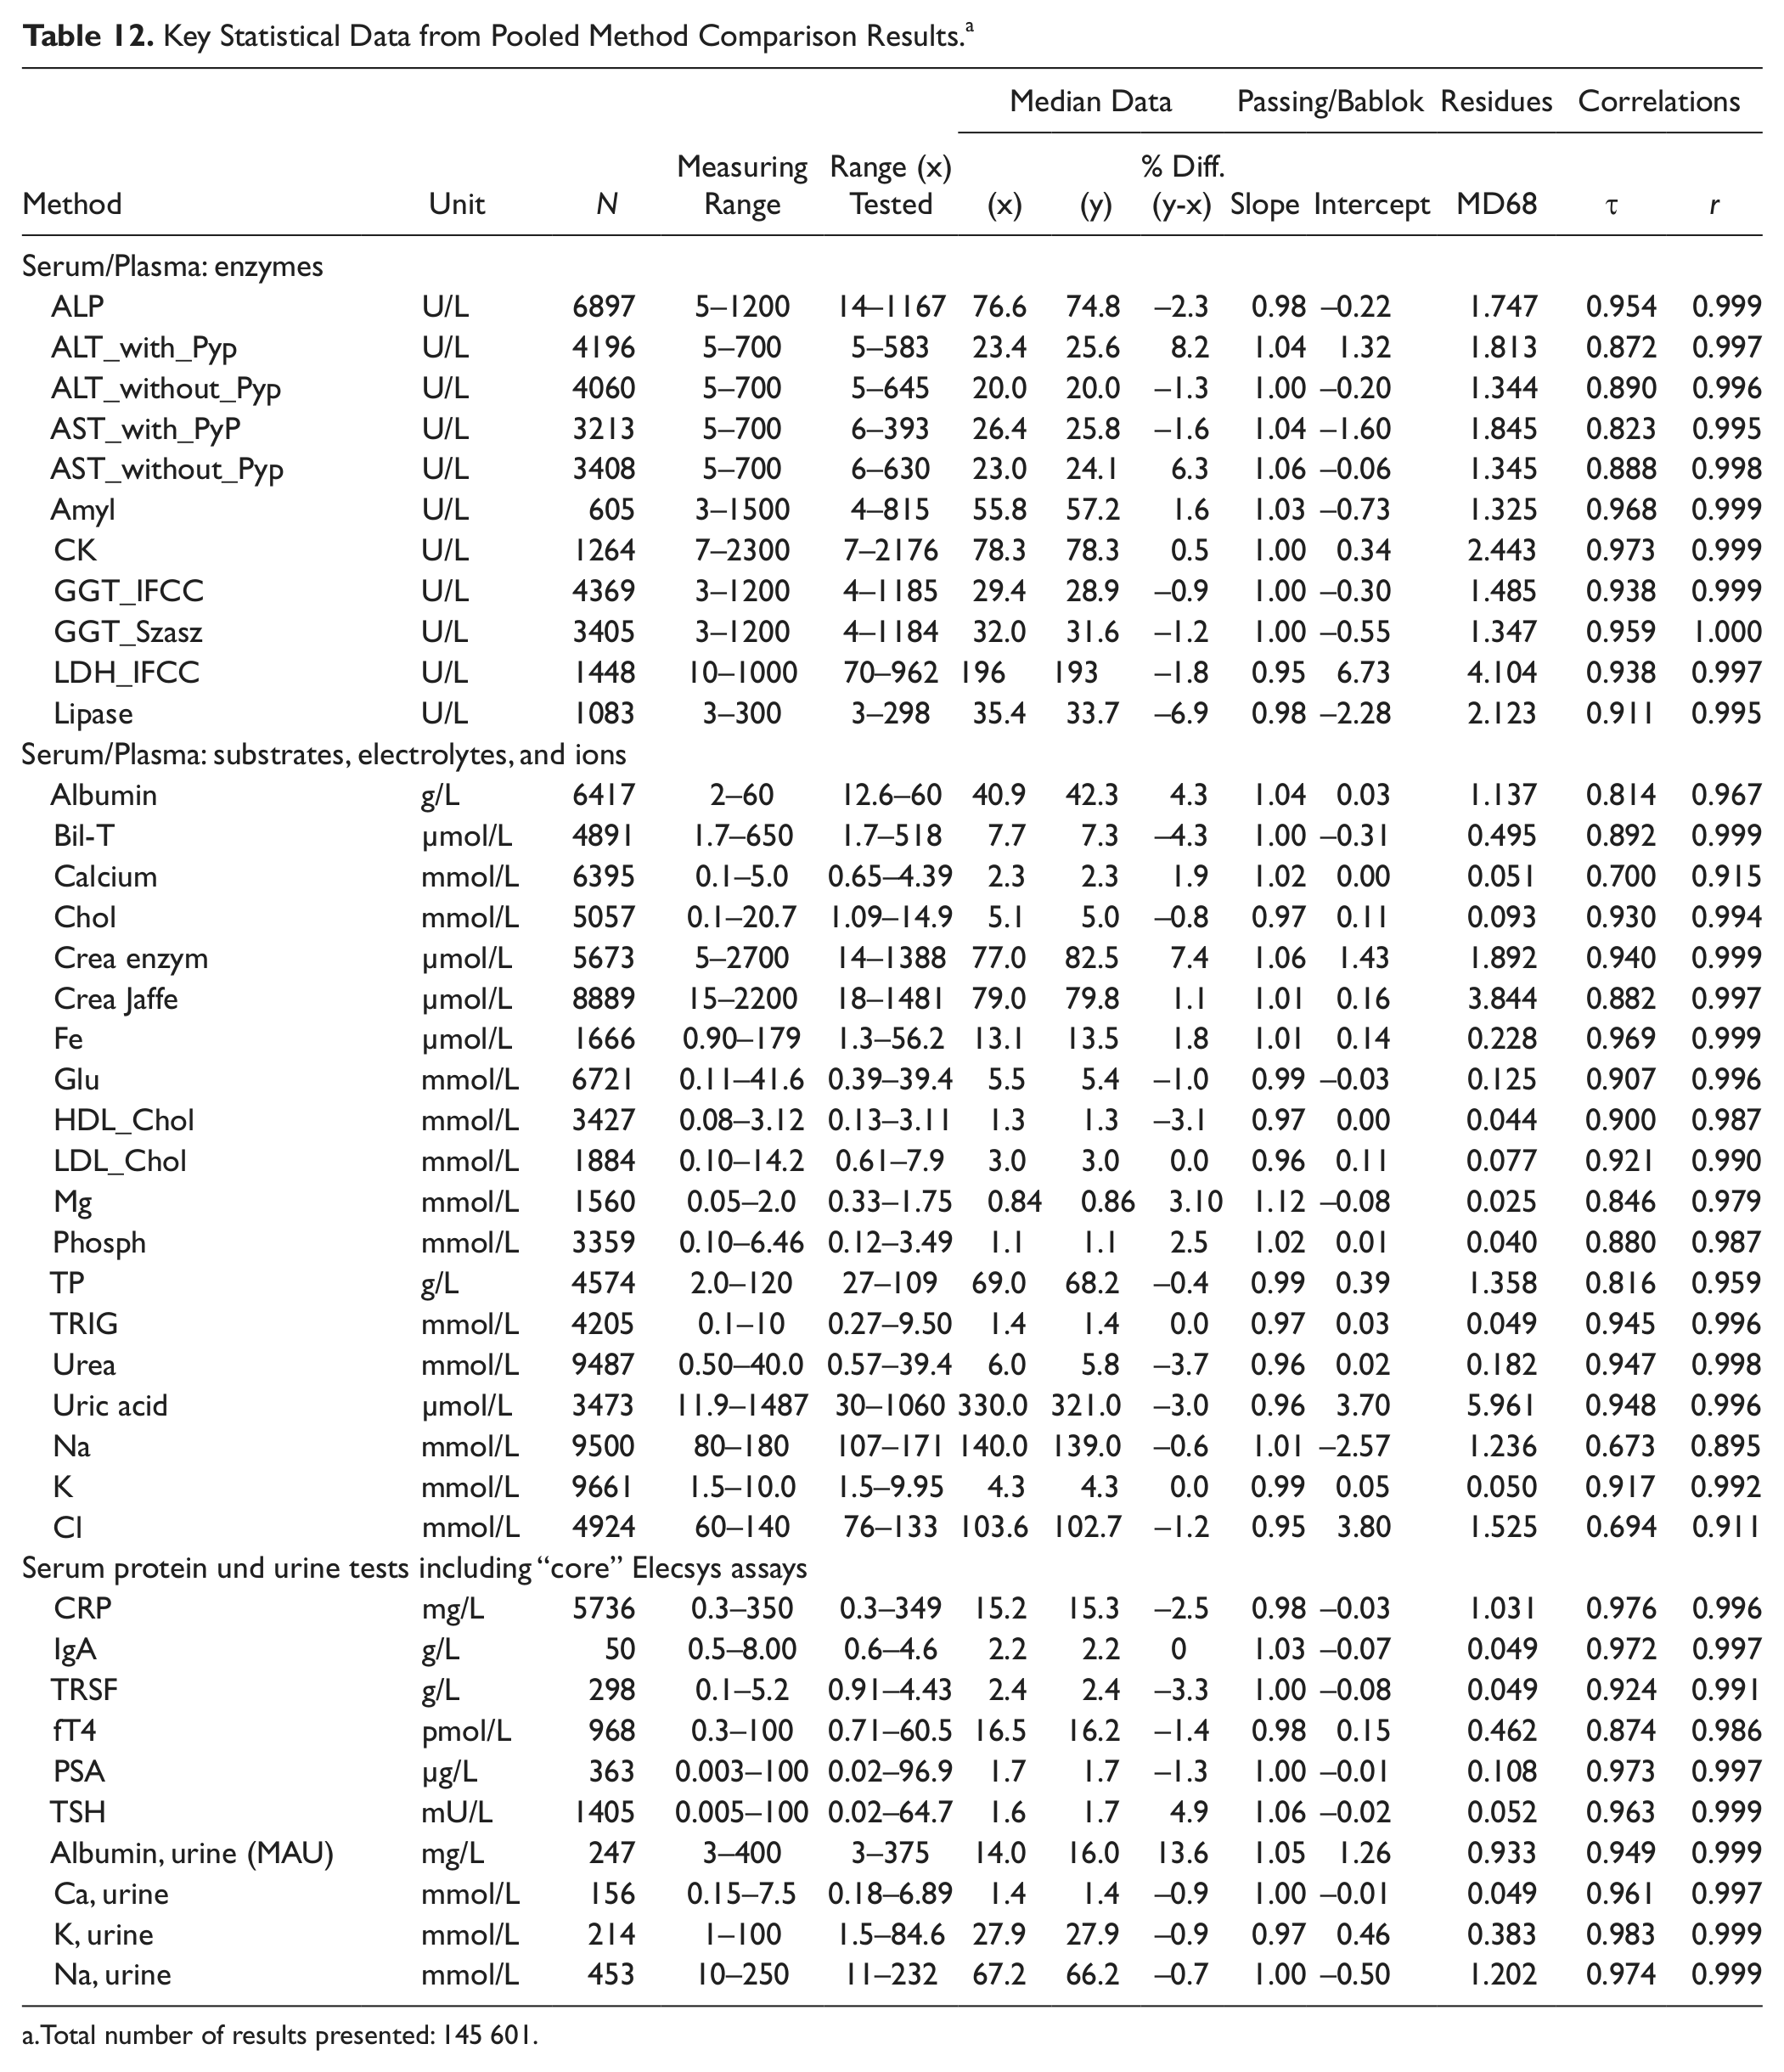
Total number of results presented: 145 601.
Slopes for 37 of 40 comparisons (37 CC, 3 IC) were within the relevant expected performance limits of ±5% or ±10%. Intercepts were negligible in all cases.
At sites 5 and 12, analytical systems from other manufacturers were used in this experiment, achieving acceptable results whenever the same methods were applied.
Reproducibility in a simulated routine run
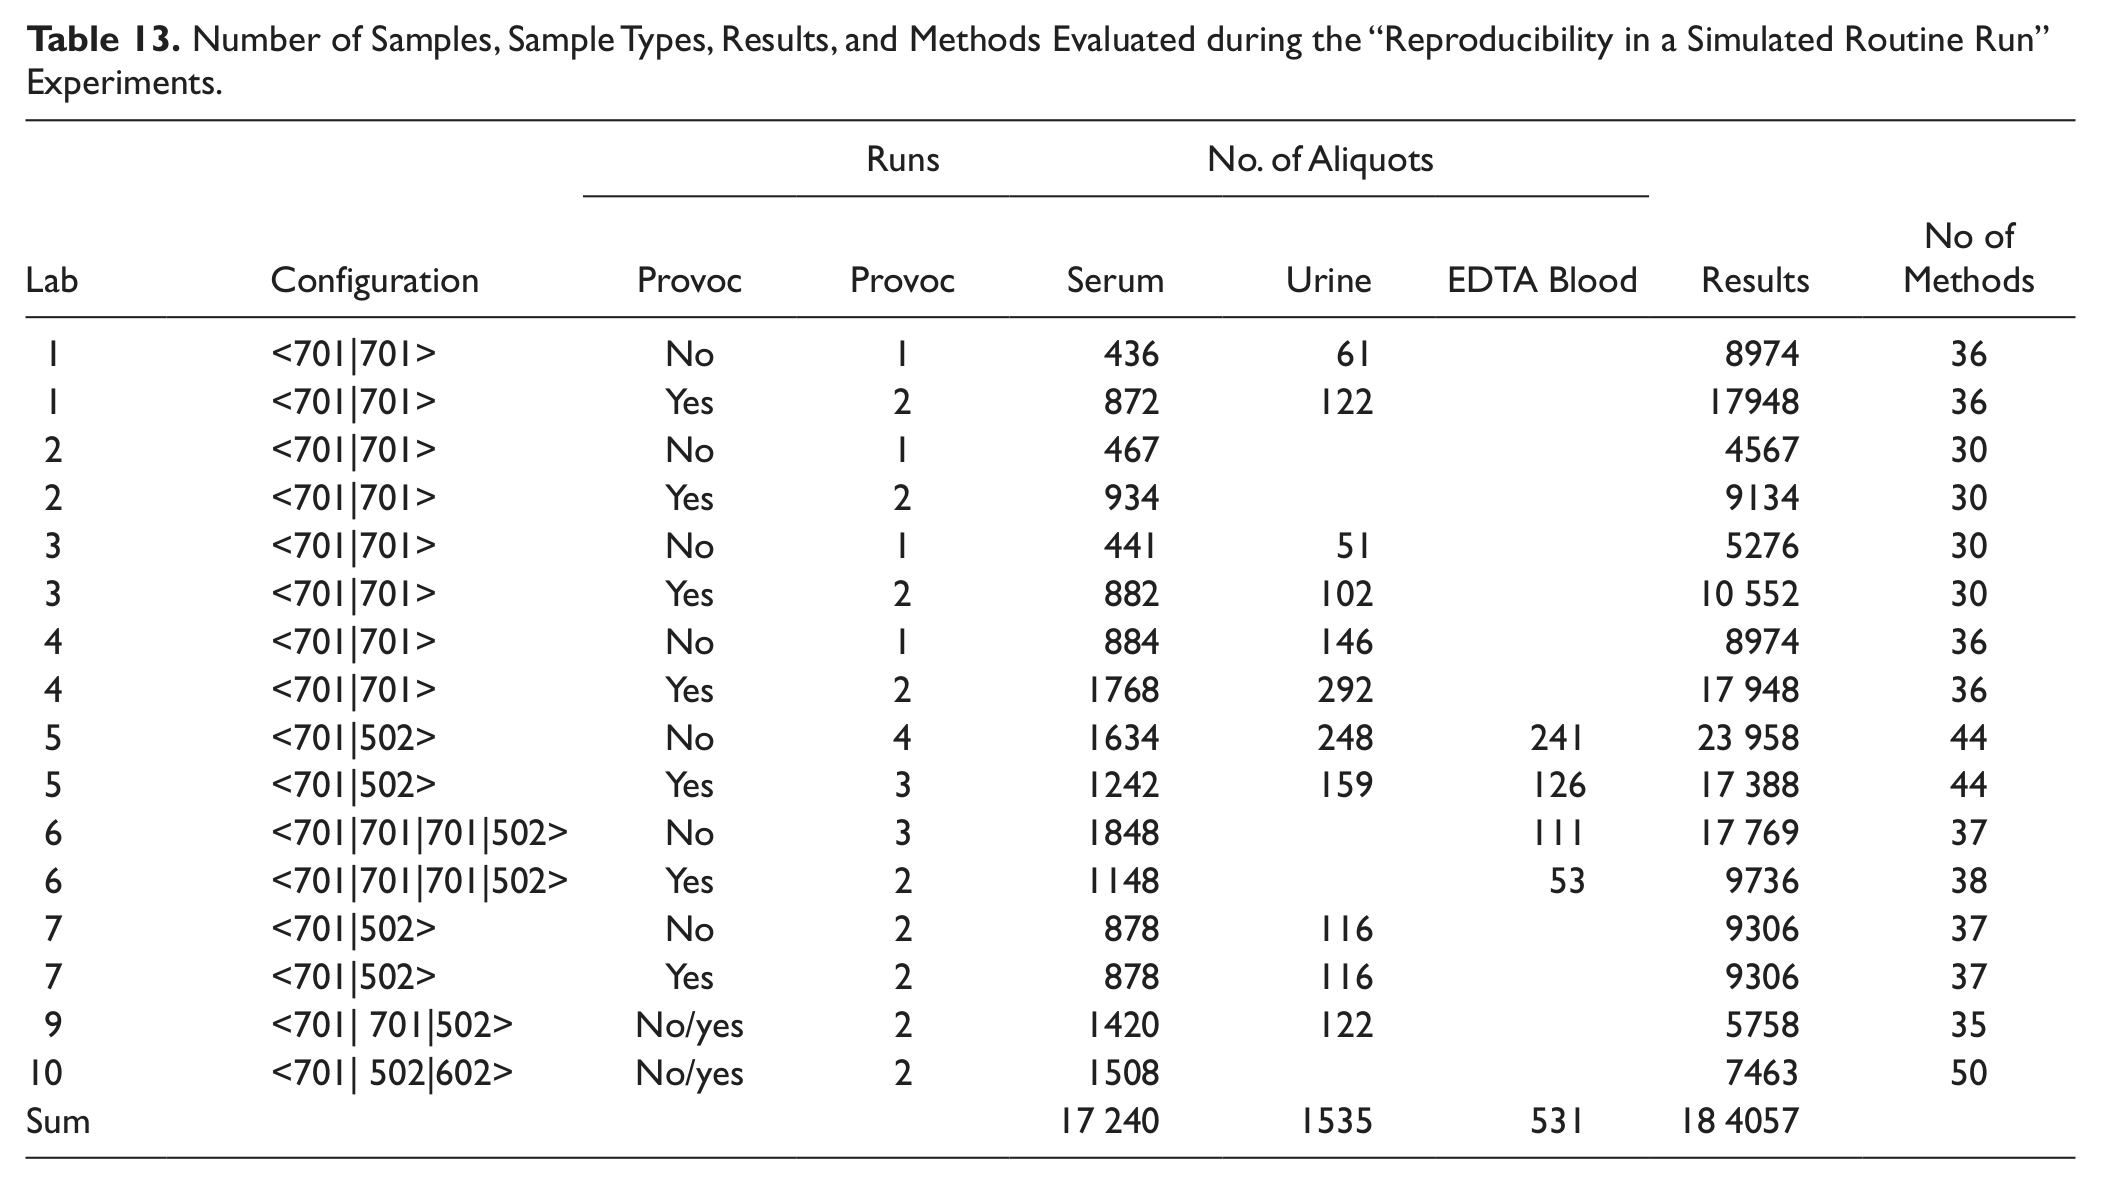
As shown in Table 13 , a total of >184 000 results using serum, urine, and EDTA blood were generated during these experiments. With the goal to check that the system reproduces results within our acceptance limits regardless of interaction or workload pattern used, all data were visually checked for large deviations using the graphical presentation form as displayed for one example in Figure 7 . Each obvious deviation was analyzed for potential random or systematic errors. Typical experimental design-related phenomena such as analyte instability or sample evaporation during longer lab bench stand times in combination with use of 0.5 mL volume sample per cup are not considered system-related systematic errors. Of particular interest was to check that, with high consolidation of assays and different sample types (serum/plasma, urine, and EDTA blood), there was no impairment of result quality due to interactions between chemistries, sample types, or concentration ranges.
Number of Samples, Sample Types, Results, and Methods Evaluated during the “Reproducibility in a Simulated Routine Run” Experiments.
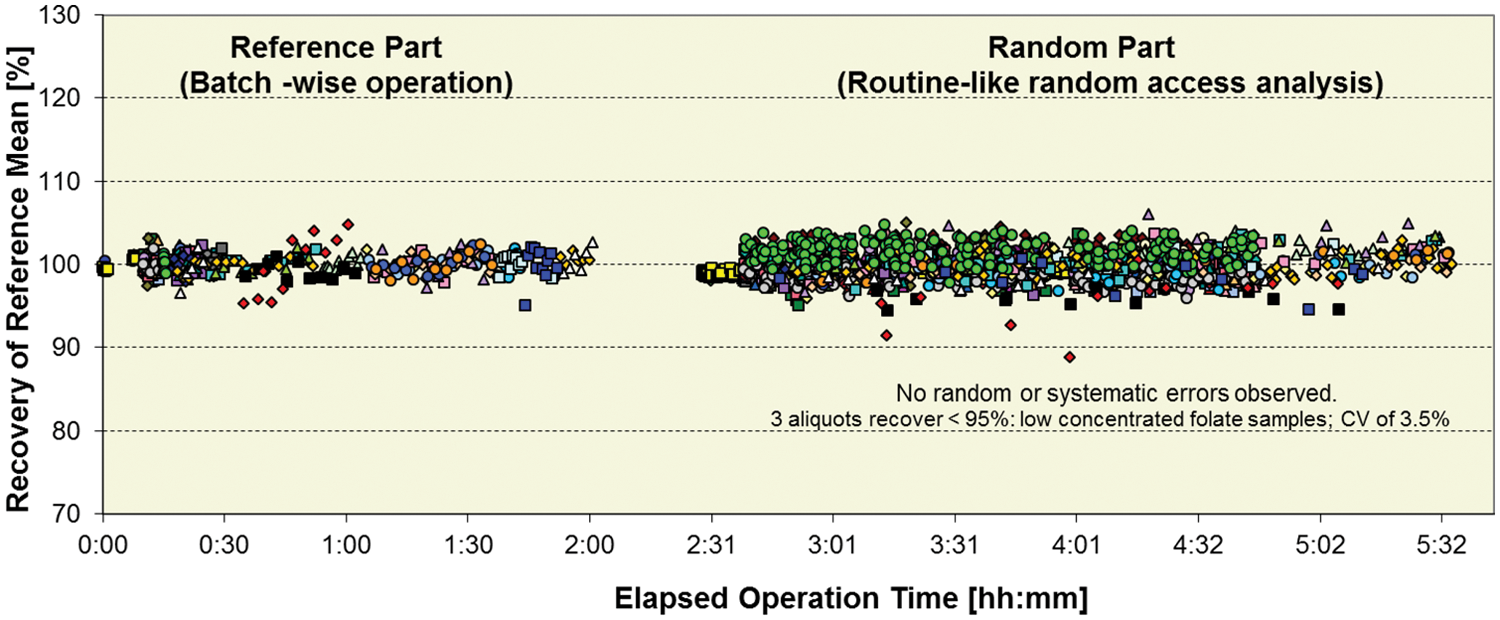
Reproducibility in a simulated routine run: testing for systematic or random errors in lab 10 on a <701|502|602> configuration. A total of 1250 samples with 2893 results for 50 assays illustrated above as colored symbols: 3 ISE, 22 on cobas c 701, 8 on cobas c 502, 22 on cobas e 602.
In addition, the behavior of the system was monitored as to whether or not it reacted to provocations as expected by the operator and if the required guidance to remedy a situation was offered.
Here we present a few examples of identified functionality errors, all resolved by appropriate measures before study close out and system launch. During the group I experiments (see Table 3 ), unstable communication between the Data Manager and the instrument control unit that led to run interruptions was resolved by a software update tested during the third experiment at each site. Similarly, some provoked sample-related data flags were not transmitted correctly to WinCAEv, and this error was corrected with a software update.
In lab 2, the root cause of one deviant IgM result was identified as interference due to Teflon debris on the cell walls from a misaligned laundry unit. In lab 9, the source of an erroneous cup sensor alarm indicating that a sample carrier was invalid or missing was finally identified as signal interference caused by friction between the sensor wiring and the rack transport belt. Both issues, not encountered at any other sites, were resolved by adjustment to specification by RD service.
Provocations were handled as expected, and routine operation was not negatively influenced by, for example, loading of samples, calibrators, or controls via the STAT port. These samples were integrated in the sample flow quickly without any interruption to the ongoing processes.
Similarly, the system reacts correctly to provoked reagent depletion by a seamless switch to standby reagent packs on cobas c 701, cobas c 502, or cobas e 602 modules or by automatic loading of reagents on the cobas c 702 module. To simulate a potential rack transportation breakdown, the so-called backup port located on each MSB to allow direct rack feeding to the analytical modules was tested by group II. Although system speed is obviously limited in this backup mode, the possibility to analyze all assays is maintained.
Routine Simulation Series 1/2 and Module 1/2
Group 1 ( Table 3 ) performed ~74 500 tests for ~10 500 samples during these experiments. Similarly to the previously discussed experiment, the main objective was to test for potential random errors, in this case using fresh human leftover material as samples.
The comparability between modules at all sites was excellent, with minimum scatter, slopes close to 1.0, and negligible intercepts (see Figure 8 ).
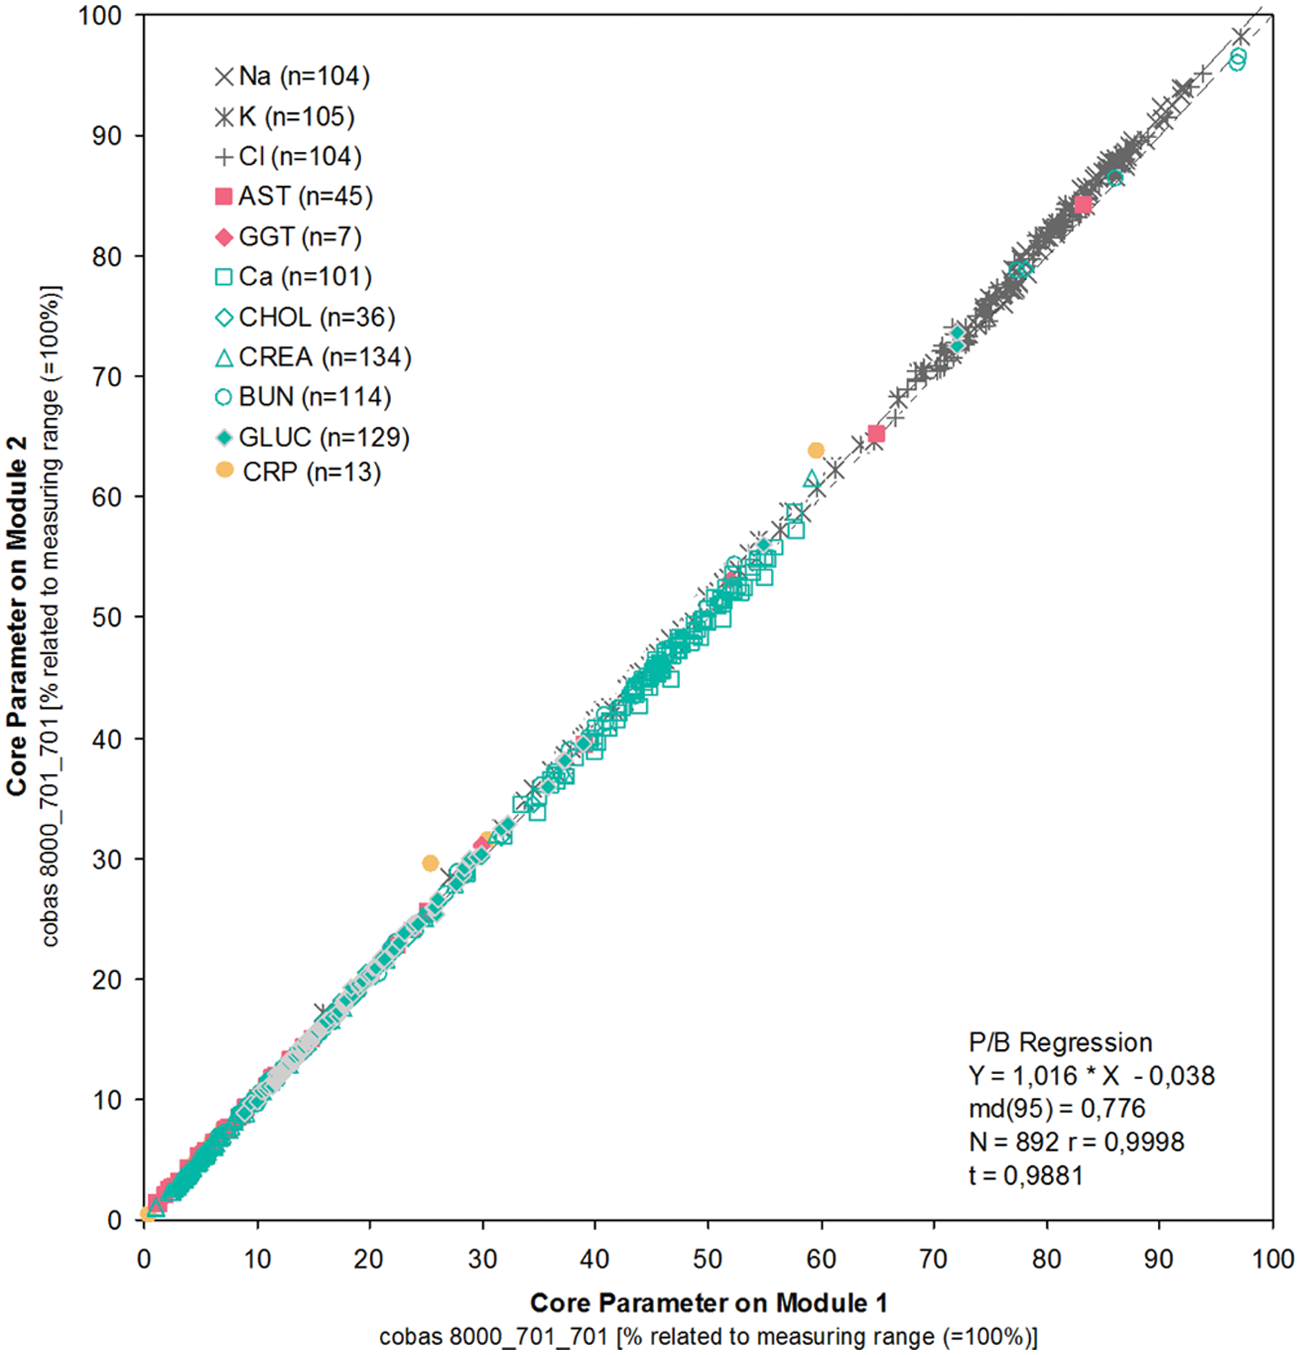
Routine-like testing: comparability of results for core analytes at lab 4 produced on module 1 and module 2 within a dual cobas c 701 module configuration with integrated ISE 1800. For this graphical presentation, the results from different assays were normalized with respect to upper measuring range limits.
Practicability
A questionnaire was used for practicability assessment of the new system compared with that used in the routine labs at the first 11 sites. The outcome ( Fig. 9 ) shows that cobas 8000 was rated to meet or exceed the evaluators’ expectations in 97% of the total ~2550 completed questions. There was no trend observed for the poorer ratings, but rather individual perceptions on single attributes. Of the few shortcomings reported by more than one site in phases 1 and 2, some were already appropriately modified by software updates before phase 3, such as, for example, a modification that reduced the operator hands-on time for monthly water bath cleaning or implementation of additional QC management features in the Data Manager. The high-speed, well-structured software; compact reagent concept; and excellent analytical performance were the feature clusters best rated by all sites.
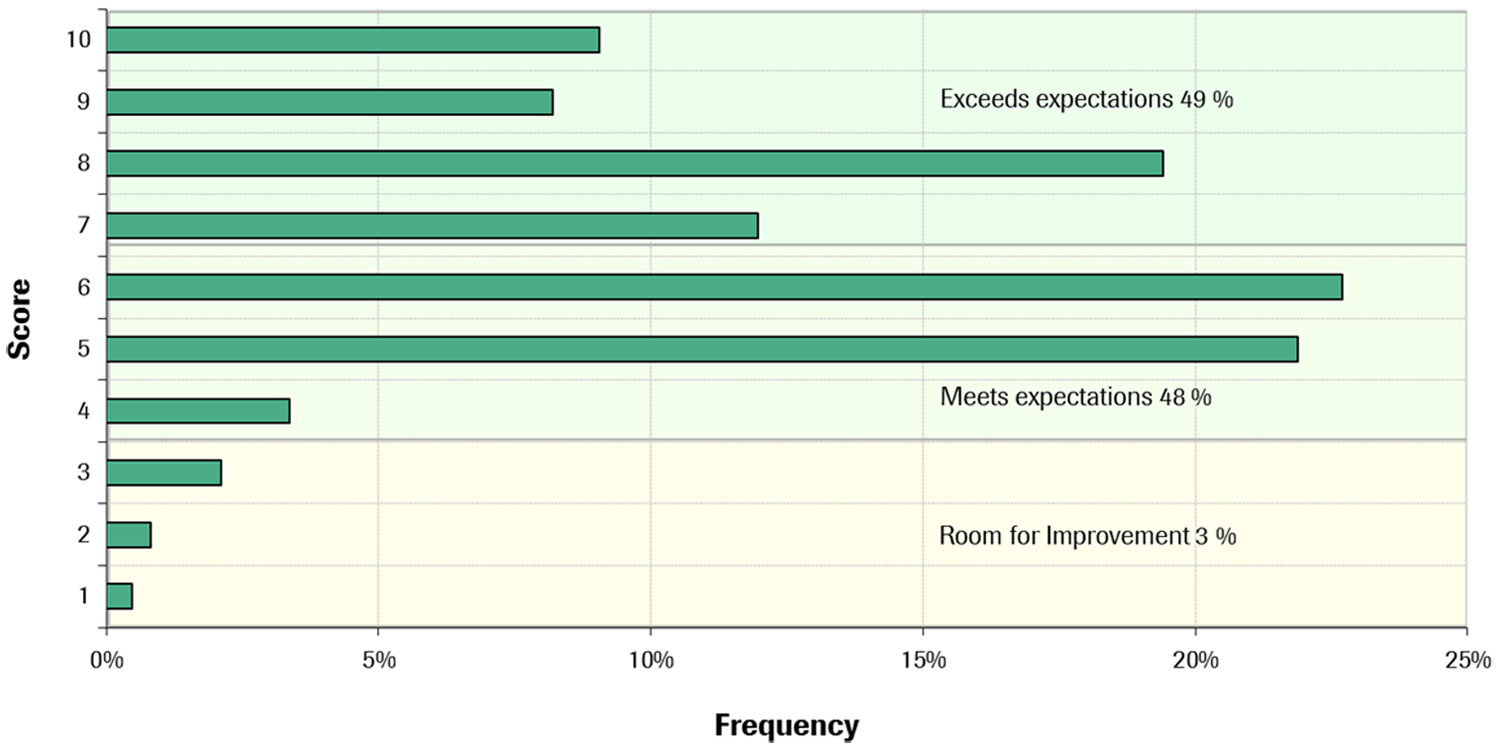
Grading of practicability by 11 labs.
Discussion
Analytical Performance
Despite the high pipetting speed and low sample volumes (e.g., 2 µL in case of the glucose assay), the new instrument produced remarkably reproducible results with only a minor increase of CVs for results processed from four versus one reagent disk.
There was a similarly low impact of reagent disk variations on the 21-day within-lab precision CVs. Even when pooling the data from all sites for calculation of the between-lab precision, an obvious increase of CVs was observed in only few cases.
The method comparison results represent a real-world comparison of the new platform with the established Roche routine instrumentation over about 2 y. A close agreement of results was obtained in the vast majority of assays tested, which is quite remarkable keeping in mind that the samples tested were taken from the daily routine without any preselection and that analysis on cobas 8000 was usually done 1 d later than in the routine.
Only 3 of 40 slope data were slightly outside the strict ±5% or ±10% limits, which can be explained by small but systematic bias effects from different calibrator lots in the case of AST without Pyp (slope: 1.06, median x and y: 23.0 and 24.1 U/L, respectively) and the enzymatic creatinine method (slope: 1.06, median x and y: 77 and 83 µmol/L, respectively) and by the narrow distribution of results in case of the serum Mg data. The median Mg data were in close agreement (0.84 [x] vs. 0.86 [y] mmol/L).
Comparison data from cobas c 502 and cobas e 602 are not listed in this article because the reagents and the analytical properties of these analyzers are identical to cobas 6000 c 501 and cobas e 601, respective MODULAR E 170, tested in earlier studies.
Equally as important as systematic slope data is the reliability of single results. Every data pair was checked for obvious deviations by using the relative difference plots; whenever such deviations were detected, if available, the samples were retested in triplicate on both analyzers. This procedure also allowed identification of the root cause for a larger deviation in almost all cases. Typical reasons for larger deviations were instability of analytes due to preanalytical variations (e.g., K related to hemolysis; glucose, when tested in serum) and systematic deviations of single samples in the case of different methods (identified by reproducible deviations). The method comparison results were obtained during random access conditions corresponding to the various request patterns of the different sites.
No result deviations indicating reagent or sample-related carryover were observed throughout the study, indicating that all measures taken by the manufacturer to avoid such interferences are sufficient to ensure result integrity in a routine environment.
Functionality Testing under Routine-like Conditions
The more features and consolidation power offered by a system, the greater the number of possible interactions the system is exposed to in routine use. With the holistic approach taken to design these studies, a key focus is on testing the overall system functionality in stressed simulated routine conditions. The previously discussed method comparison download experiments were used to compare the results produced on the new system under intended use conditions with the routine results. In addition, ~258 000 results were analyzed from further routine simulation experiments aimed at testing the result reproducibility within the new system itself. Such experiments offer the unique opportunity to identify potential malfunctions that would likely remain undetected using standard protocols.
For any observed systematic errors, such as, for example, the sporadic communication interruptions between the analyzer and data manager, root causes were identified and appropriate countermeasures were taken by the manufacturer. Similarly, the few individual observed random errors were tracked to hardware misalignment and can as a result be avoided in routine operation.
In the presented module-module comparisons, we see the result consistency between modules with fresh sample leftovers tested under random routine conditions. This is consistent with the results reported earlier from the precision experiments using QC material.
Workflow Analysis
Although the requirements are similar within the different types of laboratories, such as hospital institutes or commercial organizations, all labs are unique. Although cobas 8000 is designed to be customizable to meet all high-volume lab needs, we do have a limited scope, even within such a large study, to test the wide range of variables and their potential impact on workflow.
The primary goal, therefore, was to capture evaluators’ feedback on the key features through which cobas 8000 is designed to bring major benefits to the laboratory, such as speed and compactness, consolidation capabilities, and practicability. The speed of the new high-throughput modules cobas c 701 or cobas c 702 was rated very high by all sites. This high pipetting speed is combined with optimized sample routing determined at the entry point to the system. For every individual sample and rack, the most effective routing is calculated based on the workload situation of each module and the entire unit. As seen in the workload examples presented, this process ensures an optimized testing and traveling time for the transit through the configuration. Similar workload volumes but with varying request patterns are actually completed in about the same time, but the processing curves shown, for example, in Figure 5a do differ.
As the time for processing samples is reduced, the samples are released quickly and the overall sample availability is significantly improved. We see ( Table 9 ) that >95% of samples on CC-only configurations are processed, including reruns, within 40 min. Processing time on combined CC/IC configurations is of course affected by the longer measuring time for ICs, but the advantages of parallel processing on a single platform, like no sample split with reduced waste or less blood draw for the patients, certainly outweigh the slightly higher SPTs, having all results available at same time. Seamless STAT integration is supported by the MSBs and the optimized sample routing.
A further option to consolidate even more assays on a single CC module without needing slots reserved for standby packs is offered by the automated reagent-loading throughout operation on the cobas c 702 module. The low impact of loading on the fly was demonstrated in workload 11, in which 99% of samples were processed within 40 min. By offering user-definable settings to trigger the reagent loading events, this feature can be used to manage either partially or completely the reagent handling on the system. Similarly, the reagent-replenishing throughout operation is available on the medium-volume CC module, cobas c 502.
Combined with auto QC processing at reagent loading or switch, the system can manage all functions and maintain complete control of the quality assurance aspects while reducing hands-on time and increasing walk-away time.
During the workflow studies, 8 configurations of the possible 38 combinations were used, covering all available analytical modules and ~100 different applications for serum/plasma, urine, or EDTA blood. To find the optimal solution that meets the individual needs of a routine laboratory in a real-life setting, the cobas 8000 simulator is applied. This not only helps to identify the best fit module combinations but also supports customization within the module configurations to achieve optimal efficiency within the platform, as demonstrated by the results from laboratory 11.
Equally as important as the fast sample processing with consequent production of a high number of results within a short time is the ability of a system to efficiently manage the large volume of data. The cobas 8000 Data Manager has a complete package with data validation functionalities including rerun and reflex testing and offers various data-filtering and -sorting functions that support efficient data handling. It also offers traceability of all data to corresponding calibrations, QCs, and reagent lots. The comprehensive QC package including graphical presentation of QC results supports the option to block patient results being uploaded to the LIS if QC recoveries are out of range.
Practicability
High pipetting speed, combined with the flexibility for processing all general chemistry and homogenous immunochemistry, makes the new cobas c 701 and cobas c 702 modules true and superior successors to the manufacturer’s predecessor high-throughput MODULAR platform dispensing (D) and pipetting (P) modules. Alone, the freed-up space gain by possible replacement of current instrumentation with the cobas 8000 platform was rated very highly by all sites. Not only the savings in floor space but also the further bonus of reduced reagent storage space requirements plus ease of handling of the newly introduced compact reagent packs with up to 3000 tests each were among the favorite features.
A benefit of the stepwise study approach is no doubt the potential to timely countermeasure some possible disliked features. In this respect, a few shortcomings identified and poorly rated during the routine simulation experiments in phase I were appropriately modified prior to the following phases. Examples are the handling of a rack barcode read error that initially brought the system to an emergency stop or results for standby reagent pack controls not being plotted on the data manager QC charts.
Although the stability of the on-board QC was demonstrated in part I of the study, the associated convenience in combination with automated reagent loading was experienced during the studies using cobas c 702 module combinations. During this study, the manufacturer’s new bilevel multicontrol Precicontrol Clinical Chemistry I and II for all CC methods, including specific proteins, was also used and appreciated as a further step in the reduction of operator hands-on time.
Further features that free up staff for more valued responsibilities in the laboratory are the automated maintenance functions that allow the user-definable combination of instrument maintenance task to be executed automatically at defined times or upon manual initiation.
With the Data Manager, system monitoring becomes more convenient and at the same time offering more transparency, such as traceability information, sample status, and workflow statistics.
The data manager screen is basically a command and control center providing real-time status information from all system components, cobas 8000 modular analyzer instrument, Data Manager, and e-services.
Both the Data Manager and control unit software were rated as being well structured, easy to use, and fast.
Conclusion
In this multicenter evaluation, cobas 8000 proved to be a reliable and fast high-throughput platform. The versatility of the module combinations makes the system customizable to fit the needs of diverse laboratories, allowing precise and accurate analysis of a broad spectrum of CC and IC parameters with short turnaround times. Very good agreement between the test results of cobas 8000 and previous established platform generations facilitates the introduction of this new system that will contribute to the ability of clinical laboratories to offer better service to their customers and support vital clinical decision making.
Footnotes
Acknowledgements
The authors wish to thank all their coworkers and colleagues who worked on the studies in the respective laboratories and departments for their excellent support and dedication throughout the studies.
Declaration of Conflicting Interests
A. Kunst, A. Hubbuch, and M. McGovern are employees of Roche Diagnostics. The other authors declared no competing interests.
Funding
The authors disclosed receipt of the following financial support for the research, authorship, and/or publication of this article: This was a Roche-sponsored study. For the duration of the studies, Roche Diagnostics provided all participating sites with cobas 8000 modular analytics systems as well as the respective reagents and disposables. COBAS, cobas c, cobas e, COBAS Integra, ELECSYS, PRECINORM, and PRECIPATH are trademarks of Roche. Windows is a trademark of Microsoft.