
Abstract
As a novel effective label-free biomarker, the mechanical properties of cells have become increasingly important. However, the current methods of mapping cellular mechanical properties are mostly carried out manually, resulting in measurements that are time-consuming with low efficiency. In this article, a fully automated system of measuring the mechanical properties of cells based on atomic force microscopy (AFM) is proposed. In this system, the cells are recognized using an image-processing method and the relative position of the cell, and the AFM tip is accurately calibrated by the local scan method, meaning that the mechanical properties of cells can be measured sequentially without performing the step of AFM imaging. In addition, with the implementation of the automation, the high-throughput measurement of cellular mechanical properties can be performed rapidly. The capability of our system is validated on Raji cells, and the results indicate that the measurement rate of our system is 26 times faster than that of the traditional manual method, providing the technology for high-throughput measurement of cellular mechanical properties.
Introduction
Finding label-free biomarkers for living cells is a study area of rapidly increasing importance in life sciences. These biomarkers can be used not only in the drug efficacy test but also in the early detection of human diseases such as cancer. Since cellular mechanical properties are known to be strongly associated with cell function and play a crucial role in vital cell activities such as cell migration, proliferation, and deformation, it may serve as a novel effective label-free biomarker. 1 For example, Cross et al 2 were the first to investigate the stiffness of metastatic cancer cells and normal ones and found that the stiffness of the diseased cells was more than 70% softer than that of healthy cells, leading to the conclusion that the stiffness of the cell is very likely to serve as a novel biomarker for cancerous cells. Subsequently, Li et al 3 characterized the elasticity of normal human breast epithelial cells (MFC-10A) and their cancerous counterparts (MFC-7), respectively, and the experimental data showed that the malignant human breast epithelial cells (MFC-7) had a Young’s modulus lower (1.4–1.8 times) than normal ones at the physiological temperature of 37 °C. On the other hand, some drugs with satisfying efficacy were able to induce cellular mechanical property changes,4–6 indicating that further study into cellular mechanical properties may lead to the development of novel strategies for the early detection of serious diseases and new drug discovery. 7
Current investigative techniques such as micropipette aspiration, 8 optical tweezers, 9 and atomic force microscopy (AFM) 10 have been used to probe the mechanical properties of cells. However, AFM is the only method that can be used to characterize the mechanical properties of different types of cells on a nanoscale, with the advantage of high-force sensitivity, less cell damage, and strong adaptability. In recent years, AFM has been widely applied to investigate the cellular mechanical properties by scientists from different fields.1–6,10–13 However, most of the AFM-based cellular mechanical property measurements have been performed manually. Also, AFM imaging has to be carried out to determine the position of cells prior to AFM indentations to locate the AFM tip at the central region of the cell precisely, which is called the traditional manual method below and can be considered the scan-measure-move-scan cycle. Since the AFM tip cannot be located at the central region of the cell precisely by looking at video images, AFM imaging has to be performed. Then several AFM indentations at different locations at the central region of each cell can be taken and force curves will be recorded to calculate the corresponding Young’s modulus. Finally, until all the cells shown in the AFM image are measured, the motorized stage is controlled to bring other cells into the center of the field of view to repeat former procedures to perform a new cycle of cellular mechanical properties measurement. Since it is conducted manually and usually takes several minutes to acquire an AFM image, this scan-measure-move-scan cycle is time-consuming and inefficient. It cannot meet the demand of testing a large number of samples for meaningful biostatistics and impedes further understanding cellular mechanical properties. Therefore, an automated system of mapping cellular mechanical properties is developed in this article.
This system employs the image-processing method to detect cells and acquire the position of cells relative to the cantilever, based on which the quick local scan 14 is performed to get the precise relative position of cells and AFM tip without carrying out the step of AFM imaging. Subsequently, AFM position commands are generated by the automated AFM manipulation program to guide the motion of the AFM tip to accomplish the sequential cellular mechanical properties measurement. Finally, the motorized stage is controlled to bring other cells into the center of the field of view to repeat former procedures automatically to meet the requirements of measurements on a significant number of cells for statistical analysis. The experimental results showed that the measurement efficiency was 26 times higher than that of the traditional manual method, providing supporting technique for high-throughput measurement of cellular mechanical properties.
Fully Automated Cellular Mechanical Properties Measurement System
Instrumentation
The experimental system is shown in Figure 1 . It mainly consists of a commercial AFM (Dimension 3100; Veeco, Inc., Plainview, NY) equipped with a scanner (G type) that has a maximum XY scan range of 90 × 90 µm and a maximum Z range of 7 µm. Some peripheral devices such as a multifunction data acquisition (DAQ) card (PCI-6036E; National Instruments, Austin, TX) and two computers are also included. It can be divided into three parts: the AFM system, the local scan control module, and the automated AFM manipulation interface, as shown in Figure 1 .
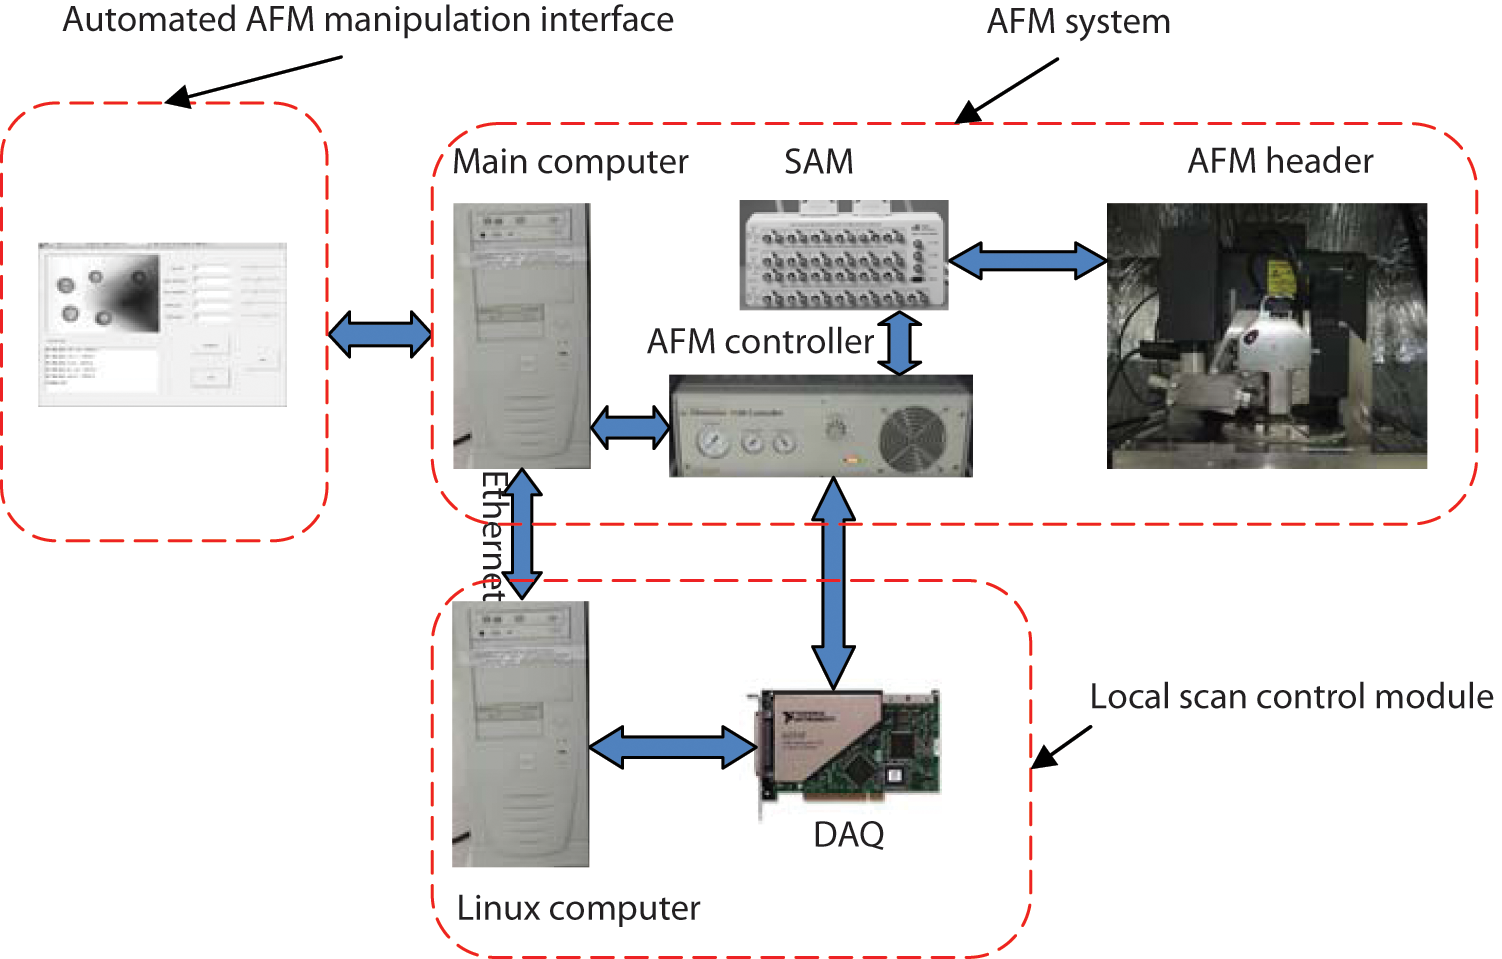
Configuration of the automated system of measuring the cellular mechanical properties. AFM, atomic force microscopy; DAQ, data acquisition; SAM, signal access module.
The AFM system comprises the AFM header, a signal access module (SAM), the AFM controller, the main computer, a charge-coupled (CCD) camera, and an optical microscope. The optical microscope equipped with a CCD camera is used to provide the vision feedback during AFM measurement. The SAM provides interfaces between the AFM header and AFM controller to facilitate the access of the real-time signals in the AFM system. The AFM header is controlled by the AFM controller through SAM. The local scan control module, consisting of a real-time Linux computer and a PCI-6036E DAQ card by National Instruments, is added to speed up the local scan 15 ; the drive signals of the AFM header for performing the local scan can be directly sent to the AFM controller, avoiding the influence of software commands transportation on the AFM response. The automated AFM manipulation program developed by using the interfaces provided by the AFM system is applied to provide an interactive interface for users to carry out the AFM measurement and acquire real-time vision feedback during AFM measurement.
Overall Operation Sequence
The flowchart of the automated system is shown in Figure 2 . With the objective of automating the cellular mechanical properties measurement, a set of procedures is conducted. First, a cell image is captured by CCD, and the image-processing algorithm is employed to recognize cells and acquire the position of cells relative to the cantilever positioned at the image center. Since the slim tip is fabricated under the cantilever out of vision, a local scan has to be carried out to acquire the precise position of the cell relative to the tip based on the cell-cantilever position acquired before. Simultaneously, several locations around the cell center are determined to act as the future measurement points to avoid any possible substrate-induced effects. 16 Subsequently, AFM position commands are generated by the automated AFM manipulation program to guide the motion of the AFM tip to acquire force curves at defined locations of the cell for calculating the corresponding Young’s modulus using Hertz’s model. It must be noted here that the method of calculating the cellular mechanical properties directly from the force curves in this automated method is identical to that of the traditional manual method. Only the method of acquiring the force curves is automated to improve the efficiency. Until all the cells identified are measured, the motorized stage is controlled to bring other cells into the center of the field of view to repeat former procedures automatically, allowing high-throughput measurement of cellular mechanical properties.
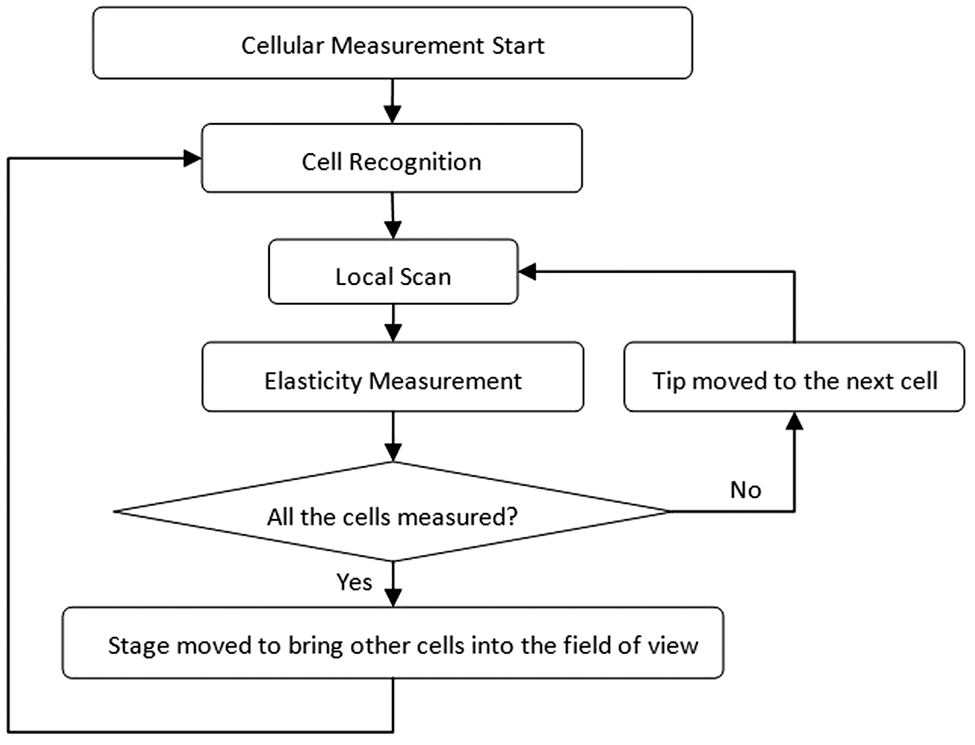
Flowchart of the automated mechanical properties measurement system.
Automated Cellular Elasticity Measurement
Automated cellular elasticity measurement is made possible by integrating (1) computer vision-based cell recognition and contact point determination and (2) local scan-based tip-cell position calibration.
Computer vision-based cell recognition and contact point determination
To reduce the influence of substrate effects on the elasticity measurement, contact points are usually chosen at the central region of the cell. Consequently, for the purpose of automating cellular elasticity measurement, the rapid positioning of the tip at defined locations of the cell has to be achieved, which means the position of cells needs to be determined in advance. The method for locating cells is presented in this section.
First, a cell image is captured through the CCD. Since the contour of the cell used in this study is close to a circle, we recognize cells by detecting circles in the cell image. Since the Hough transform (HT) is the most well-known method to detect circles from a digital image for shape recognition, 17 cells are identified by implementing the HT on the edge image, which can be acquired by using canny edge detection on the original cell image. After the cell is found, the center (a, b) and the radius (r) can be calculated, and the number of cells is known. Until now, the position of cells relative to the cantilever, which is supposed to be at the image center, can be expressed in pixels. The pixel size also can be calibrated with the aid of the standard lattice. A standard lattice is placed onto the sample stage and the optical microscope is focused on it, and thus the pixel size in a particular magnification can be calculated using the known size of the lattice. Hence, the physical distance between cells and the cantilever can be acquired, making the location of cells possible.
Local scan-based tip-cell position calibration
Although the relative position of cells and the cantilever is acquired, the precise positioning of the tip at the central region of cells is still unachievable because the slim tip is fabricated under the cantilever, which means the tip-cantilever position cannot be acquired through vision feedback. Therefore, a local scan method has been developed by our lab to solve this problem. By performing a quick local scan based on the cell-cantilever position, not only can the tip be located at the central region of the cell, but the position of the tip relative to the cantilever also can be determined. In addition, the time taken for performing the local scan is less than 1 s with the aid of the local scan control module.
As the position of the cell relative to the cantilever is obtained by using the image-processing algorithm described above, the tip can be guided to the left side of the cell. As shown in Figure 3 , after the tip is moved to the left side of the cell, a horizontal scan is performed. Two intersections, P and Q, between the cell boundary and the horizontal scan line, H, are acquired and will be used to determine the vertical scan line, V. Two intersections, M and N, between the cell boundary and the vertical scan line, V, which is perpendicular to the horizontal scan line, H, and crosses the middle point O1 of the two intersections, P and Q, are also recorded. The middle point, O, of the intersections M and N is the center of the cell, whereas the tip is at the end point, T, of the vertical scan line. By doing this, the precise positioning of the tip at the central region of the cell can be achieved, and the position of the tip relative to the cantilever becomes calculable.
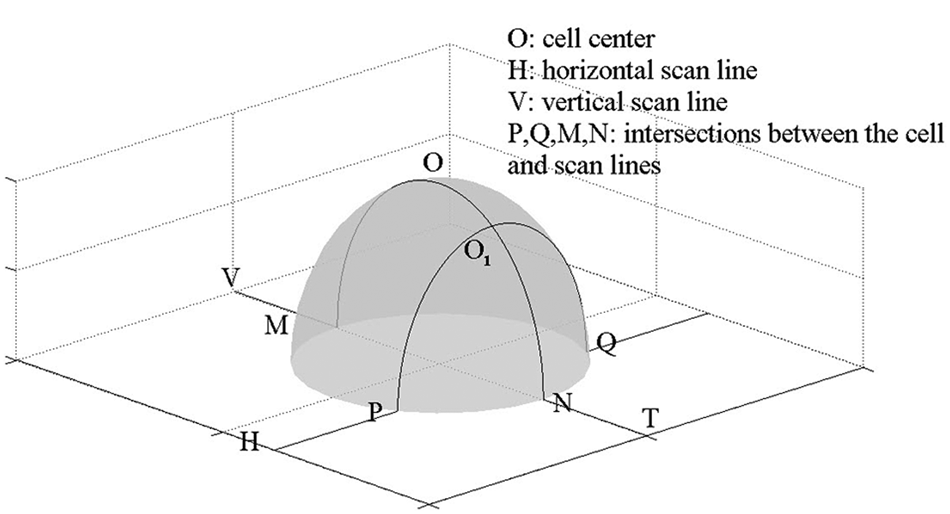
Diagram of the local scan method.
Experiment
Sample Preparation
Raji cells were used in this study. They were cultured in the RPMI-1640 culture medium containing 10% fetal bovine serum (FBS) at 37 °C with 5% CO2. For the experiments, a sample of the Raji cell suspension was dropped on the slide and spread to cover the entire surface, which had been processed with Poly-L-Lyle (PLL) one night before. After half an hour, the glutaraldehyde with a concentration of 0.25% was dropped into the cell sample to further fix the cell for 15 min. The slide was then kept in a Petri dish full of phosphate-buffered saline (PBS) solution for AFM measurement. In addition, the Petri dish was attached to a stage mounted on a vibration isolation platform, isolating it from the external disturbances.
AFM Measurement
A commercial Dimension 3100 AFM (Veeco) was used for imaging and elasticity measurement. A soft silicon nitride cantilever with a spring constant of 0.12 N/m was used. A CCD camera mounted on an optical microscope provided the vision feedback during AFM measurement.
AFM imaging was performed in contact mode. AFM images were recorded with a frequency of 1 Hz with 256 scan lines and 256 pixels per scan line. With these parameters, it takes 256 s to acquire an AFM image. In the experiments, the deflection of the AFM tip was recorded as a function of its Z position to form a force curve. Young’s modulus was then derived from the force curve using the Hertz model, which is discussed in detail in Li et al. 12 All experiments were performed at room temperature.
Results
To validate the efficiency of the automated system proposed in this article, we characterized the mechanical properties of a large number of cells using this automated method and the traditional manual method. The time taken for accomplishing the elasticity measurement of several cells also was recorded for performance comparisons. Given that there were on average four cells in the maximum AFM scan range in the experiments, the efficiency of this automated method and the traditional manual method was compared when four cells were shown in the AFM image.
First, this automated method was used to characterize the cellular mechanical properties. After the cell sample was placed onto the stage, an original gray cell image was captured ( Fig. 4A ). The HT was then employed to recognize cells by detecting circles in the edge image ( Fig. 4B ), which was acquired by using canny edge detection on the original cell image ( Fig. 4A ). After the cells were identified, the center coordinates with the image center as the zero point and the radii of all the cells could be calculated. As shown in Figure 4C , the circles detected for cell recognition were directly shown on the original cell image to validate the performance of the image-processing algorithm. The physical position of cells relative to the cantilever also was acquired based on the calibrated pixel size, particularly the magnification.
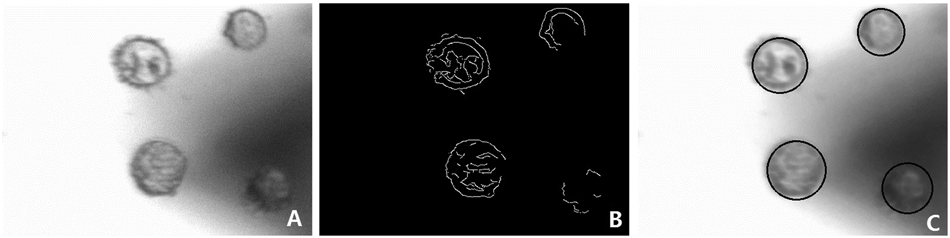
(
Based on the cell-cantilever position, the AFM tip could be moved to the left side of the cell automatically and the local scan was performed, allowing the precise positioning of the tip at the central region of the cell. The topography of a cell formed by two scan lines is shown in Figure 5 . Then the tip was guided to the defined locations around the cell center for elasticity measurement. This process was repeated several times until all the cells were measured and the time taken for elasticity measurement was recorded. Finally, the stage was moved to bring other cells into the field of view automatically for another batch of cellular elasticity measurements.
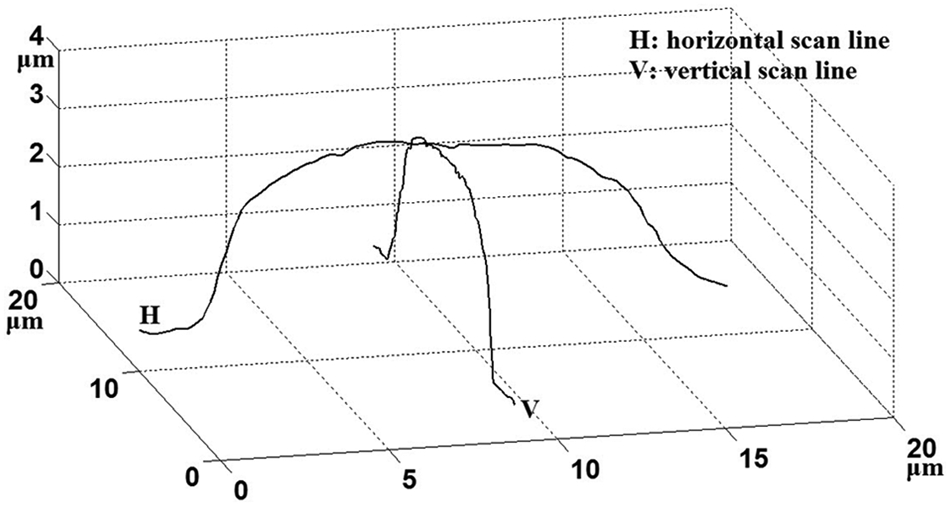
The topography of a cell formed by two scan lines.
Subsequently, we also carried out elasticity measurement of the same cell sample using the traditional manual method. First, AFM imaging was performed in contact mode and the AFM image was recorded with a frequency of 1 Hz with 256 scan lines and 256 pixels per scan line. Through the AFM manipulation program provided by the AFM system, the AFM tip could be positioned at several defined locations at the central region of the cell, and AFM indentations were then performed to acquire several force curves. This process was repeated several times until all the cells shown in the AFM image were measured and the time taken for elasticity measurement was also recorded. Finally, the stage was moved to bring other cells into the field of view manually for another batch of cellular elasticity measurements. It is worth noting here that we had to withdraw the tip before we could move another batch of cells into the field of view for AFM measurement due to the limitation of the supporting software provided by the AFM system, although we did not have to do this when using the automated method.
Performance comparisons of mapping the cellular mechanical properties using two different methods are summarized in Table 1 . Using the traditional manual method, we achieved an average speed of 81 s per cell. Since the tip could not be precisely positioned at the central region of the cell through vision feedback, AFM imaging had to be performed, and it took 256 seconds with the parameters mentioned before. In addition, after all the cells were measured, the tip had to be controlled to leave the sample surface for enabling the movement of the AFM stage and reapproach the sample surface, so the time taken for tip movement in the vertical direction, described as engage time in Table 1 , had to be taken into account. Experimentally, the time taken for tip movement from one cell to another and stage movement was usually less than 1 s due to the high traveling speed of the tip and the stage, so it is negligible.
Performance Comparisons of This Study’s Automated Method and the Traditional Manual Method
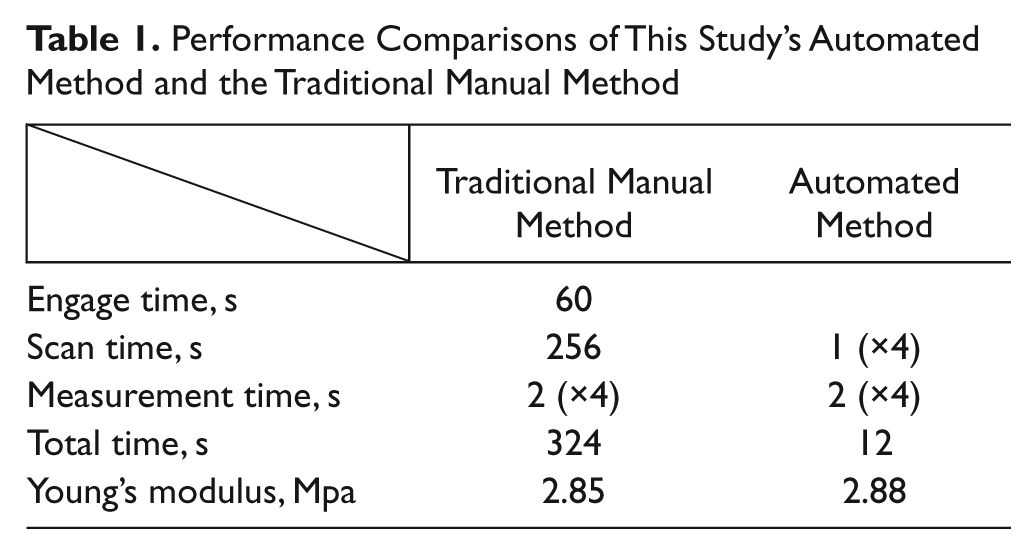
When this automated method was used for mapping the cellular mechanical properties, the average speed was 3 s per cell ( Table 1 ). Moreover, with the aid of the local scan control module, the time taken for performing the local scan was actually less than 1 s. The time taken for measuring one cell, which is the same as that of the traditional manual method, was also 2 s ( Table 1 ).
The Young’s modulus of one cell derived from force curves acquired using this automated method and the traditional manual method was 2.88 Mpa and 2.85 Mpa, respectively ( Table 1 ). Considering the inevitable difference of the contact points on the cell, little difference is acceptable.
Overall, this study demonstrates that the automated method proposed in this article produces a higher operation speed (approximately 3 s per cell vs 81 s per cell) than the traditional manual method without sacrificing accuracy, allowing cellular mechanical properties measurement in a high-throughput manner for meaningful biostatistics.
Discussion
This article presented an AFM-based automated system for measuring cellular mechanical properties. In this system, the cells are recognized using an image-processing method, and the relative position of the cell and AFM tip is accurately calibrated by the local scan method without performing the step of AFM imaging. Thus, this system could measure cellular mechanical properties at an average speed of 3 s per cell, allowing measurement on a significant number of cells for statistical analysis. The potential impact of this automated method extends beyond mapping the cellular mechanical properties, and it can also be used in other AFM-based applications. The developed automated system, including employing the image-processing method, local scan method, and automation introduction, opens up a new avenue for automated nanomanipulation and nanomeasurement based on AFM.
Future research work possibly includes further studies into the cellular mechanical property changes caused by environmental changes or the cellular response to the molecules using this automated system. It is also a desired goal to develop other automated systems to facilitate the AFM-based nanomanipulation and nanomeasurement.
Footnotes
Acknowledgements
We thank Changlin Zhang and Meijuan Zheng for generous technical assistance.
Declaration of Conflicting Interests
The authors declared no potential conflicts of interest with respect to the research, authorship, and/or publication of this article.
Funding
The authors disclosed receipt of the following financial support for the research, authorship, and/or publication of this article: This study was supported by the National Natural Science Foundation of China (60904095, 61175103), the National 863 project (2012AA020100) and Chinese Academy of Sciences State Foreign Expert Bureau International Partnership Program for Creative Research Teams.