
Abstract
We demonstrate that endogenous cellular magnesium levels can be used as an accurate determinant of total cell number by inductively coupled plasma techniques, increasing the throughput and reproducibility of nanoparticle-uptake studies. Uptake of either gold nanoparticles or quantum dots did not affect intracellular concentration of Mg. To demonstrate this technique, we show the decreased uptake of nano-urchins in A549 cells compared with gold nanospheres.
Keywords
Introduction
An understanding of how the nanoparticle physicochemical properties dictate cellular interactions in vitro and in vivo is currently a major research focus in nanotechnology. These studies provide guiding principles for designing nontoxic and environmentally benign nanomaterials for clinical, electronic, and biological applications. A critical step for these studies includes the quantification of nanoparticles in cells and tissues. Inductively coupled plasma (ICP) techniques coupled either with atomic emission spectroscopy (ICP-AES) or mass spectrometry (ICP-MS) are currently the gold standard in measuring the amount of nanoparticles residing in a cell because many nanoparticles contain gold, silver, cadmium, iron, or other metal atoms.1–5 ICP techniques use electromagnetic induction to produce an argon plasma whose temperature can range from 6000K to 10 000K, which is enough to break most molecular and ionic bonds. For ICP-AES, a sample’s atoms are excited by the plasma, and a spectrometer is used to resolve and quantify the electromagnetic radiation emitted by the various atoms. In ICP-MS, the plasma is used to atomize and ionize the sample, and the mass-to-charge ratio is obtained for each ion using a mass spectrometer. Using the aforementioned techniques on cells requires detaching the cells from plastic surfaces with a trypsin solution and counting live cells using viability dyes such as propidium iodide or Trypan blue. Because of the use of two separate quantification methods, analysis of nanoparticle concentrations in cells and tissues is a relatively slow process and could lead to experimental variability between replicates due to the extra steps in the quantification process. To improve experimental accuracy, previous studies have added rare elements such as uranium into biological samples to determine cell number using ICP-MS. 6 Here we determined whether the endogeneous ions (e.g., magnesium) in a cell could be used to quantify cell number. This would allow for the simultaneous quantification of nanomaterial concentration and total cell number with the same analysis.
Materials and Methods
Analysis of cell’s elemental content
HeLa and MDA-MB-435 cells were cultured in DMEM and RPMI, respectively, supplemented with 10% fetal bovine serum. The day of the experiment, cells were detached from cell culture flasks with a cell scraper and counted using Trypan blue exclusion assay. Cells were added at specific numbers into separate tubes, centrifuged at 400g for 5 min at 4 °C, and washed with phosphate-buffered saline (PBS). For serum starvation experiments, 2 × 10⁶ cells were seeded in six-well plates overnight and the following day, serum-supplemented media were removed, and cells were incubated with media containing 0.2% bovine serum albumin (BSA).
ICP-AES analysis
Prior to ICP-AES analysis, samples were lysed with 500 µL nitric acid, transferred into 1.5 mL conical tubes, and incubated for 30 min in a 70 °C water bath. Samples were then chilled on ice for 1 min, pulse centrifuged to collect all the liquid, and diluted in 3 mL double-distilled ultra-pure water. All conditions were performed in triplicate. Samples were analyzed using a Perkin-Elmer Optima 3000 ICP-AES system. Sample introduction conditions: Teflon Mira Mist nebulizer, 0.5 L/min auxiliary argon flow, 1.1 L/min sample flow, 0.8 L/min nebulizer gas flow, high purge gas flow. Plasma was set to 1500W with a gas flow of 15 L/min. Measurements were preformed with a read delay of 45 s, with an integration time of 5 to 10 s, and done in triplicate. Aqueous calibration curves of Au, Mg, and Cd were prepared from certified elemental standards (High Purity Standards, Charleston, SC).
Nanomaterials synthesis
The 575-nm-emitting CdSeS/ZnS quantum dots (TriliteTM) were purchased from Cytodiagnostics (Burlington, Ontario, Canada). The quantum dots were rendered water soluble via a ligand-exchange procedure with thioglycolic acid adapted from Chan and Nie. 7 The 15 nm gold nanoparticles were synthesized using the Frens method 8 with reagents purchased from Sigma-Aldrich. The 70, 85, and 90 nm gold nanoparticles were synthesized using hydroquinone-mediated growth of the 15 nm seeds. 9 Nano-urchins were prepared using hydroquinone-mediated growth of the 15 nm seeds described by Li and others. 10 Nanoparticle and nano-urchin diameters were confirmed by dynamic light scattering and electron microscopy. The hydroquinone-synthesized nanomaterials were washed thrice using a solution of 3.4 mM sodium citrate tribasic (Ci). Protein adsorption was performed using 0.34 mM Ci and 4 mg/mL transferrin. After 1 h incubation at 37 °C, BSA was added to the transferrin-coated AuNPs at a 0.1% concentration to ensure AuNP stability during centrifugation steps. The AuNPs were washed twice in a 0.1% BSA solution and used in cell uptake
Cell uptake studies
The cell uptake assays were performed on cells preincubated overnight in six-well plates at 85% confluency at the start of experiment. The following day, media was removed and cells were exposed to nanomaterials in serum-free media (RPMI + 0.2% BSA). At the end of the experiment, cells were washed thrice with PBS and frozen as a monolayer until analysis by ICP-AES. For gold nanoparticle studies, we added 1.2 × 10¹¹ 15 nm nanoparticles in 1 mL of media and compared it to the equivalent volume of gold for 70 nm (2.80 × 10⁹) and 90 nm (1.32 × 10⁹) AuNPs. For nano-urchin studies, 5 pM (3 × 10⁹ total) of either urchins or size-matched nanoparticles were added to A549 cells. The total number of urchins and nanoparticles was determined by calculating their molecular weight. The molecular weight of spherical nanoparticles was calculated using the average diameter measured by electron microscopy, material density, and atomic weight. The number of gold atoms per nano-urchin was calculated by dividing the total number of gold atoms required for synthesis by the total number of 15 nm gold nanoparticles added as seeds for hydroquinone-mediated growth.
Results and Discussion
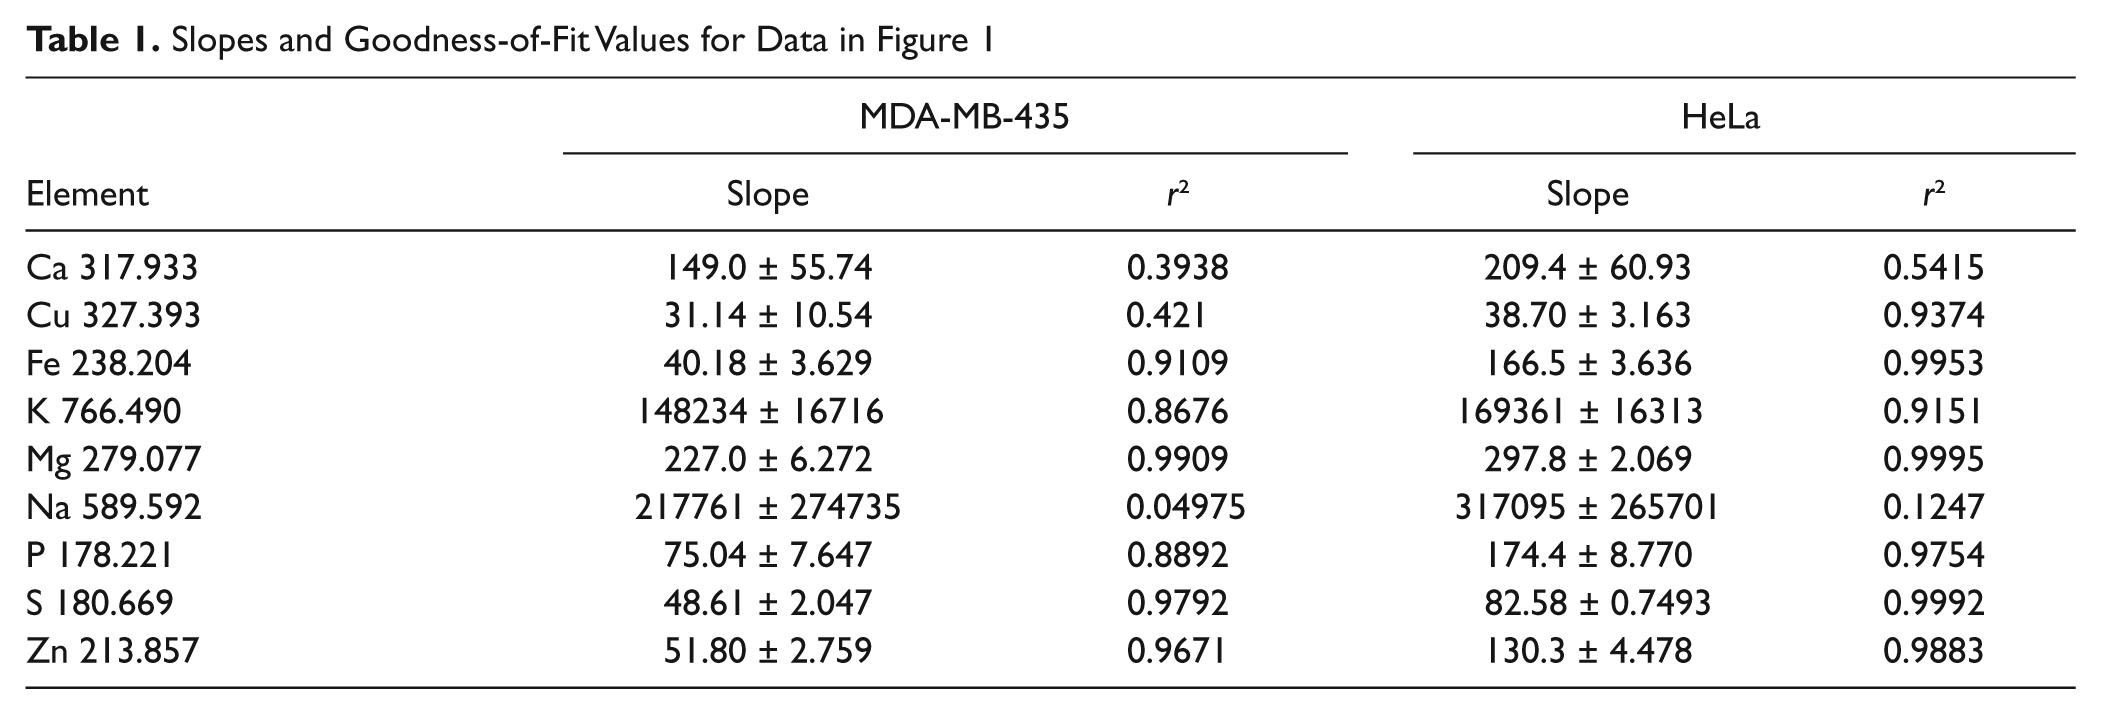
We evaluated nine elements—Ca, Cu, Fe, K, Mg, Na, P, S, and Zn—for quantifying cell numbers using ICP-AES ( Fig. 1 ). These elements were chosen because they all possess well-known roles in cell function and general metabolism. To determine how each of these elements correlated with total cell numbers, we prepared nitric acid digestates ranging from 0.25 to 5 × 10⁶ MDA-MB-435 or HeLa cells. Of these nine elements, Mg showed the highest correlation with cell number, followed by S and Zn ( Table 1 ). All three elements showed strong correlation (r2 > 0.96) with total cell number in both cell lines. Interestingly, correlation was consistently higher in HeLa cells for all the elements tested. Certain elements, such as Ca and Cu, showed poor correlation, and this may be due to quantities below the detection limit of the ICP-AES. Other elements such as Na and K also showed poor correlation due to the presence of these elements in the PBS used to wash cells prior to acid digestion.
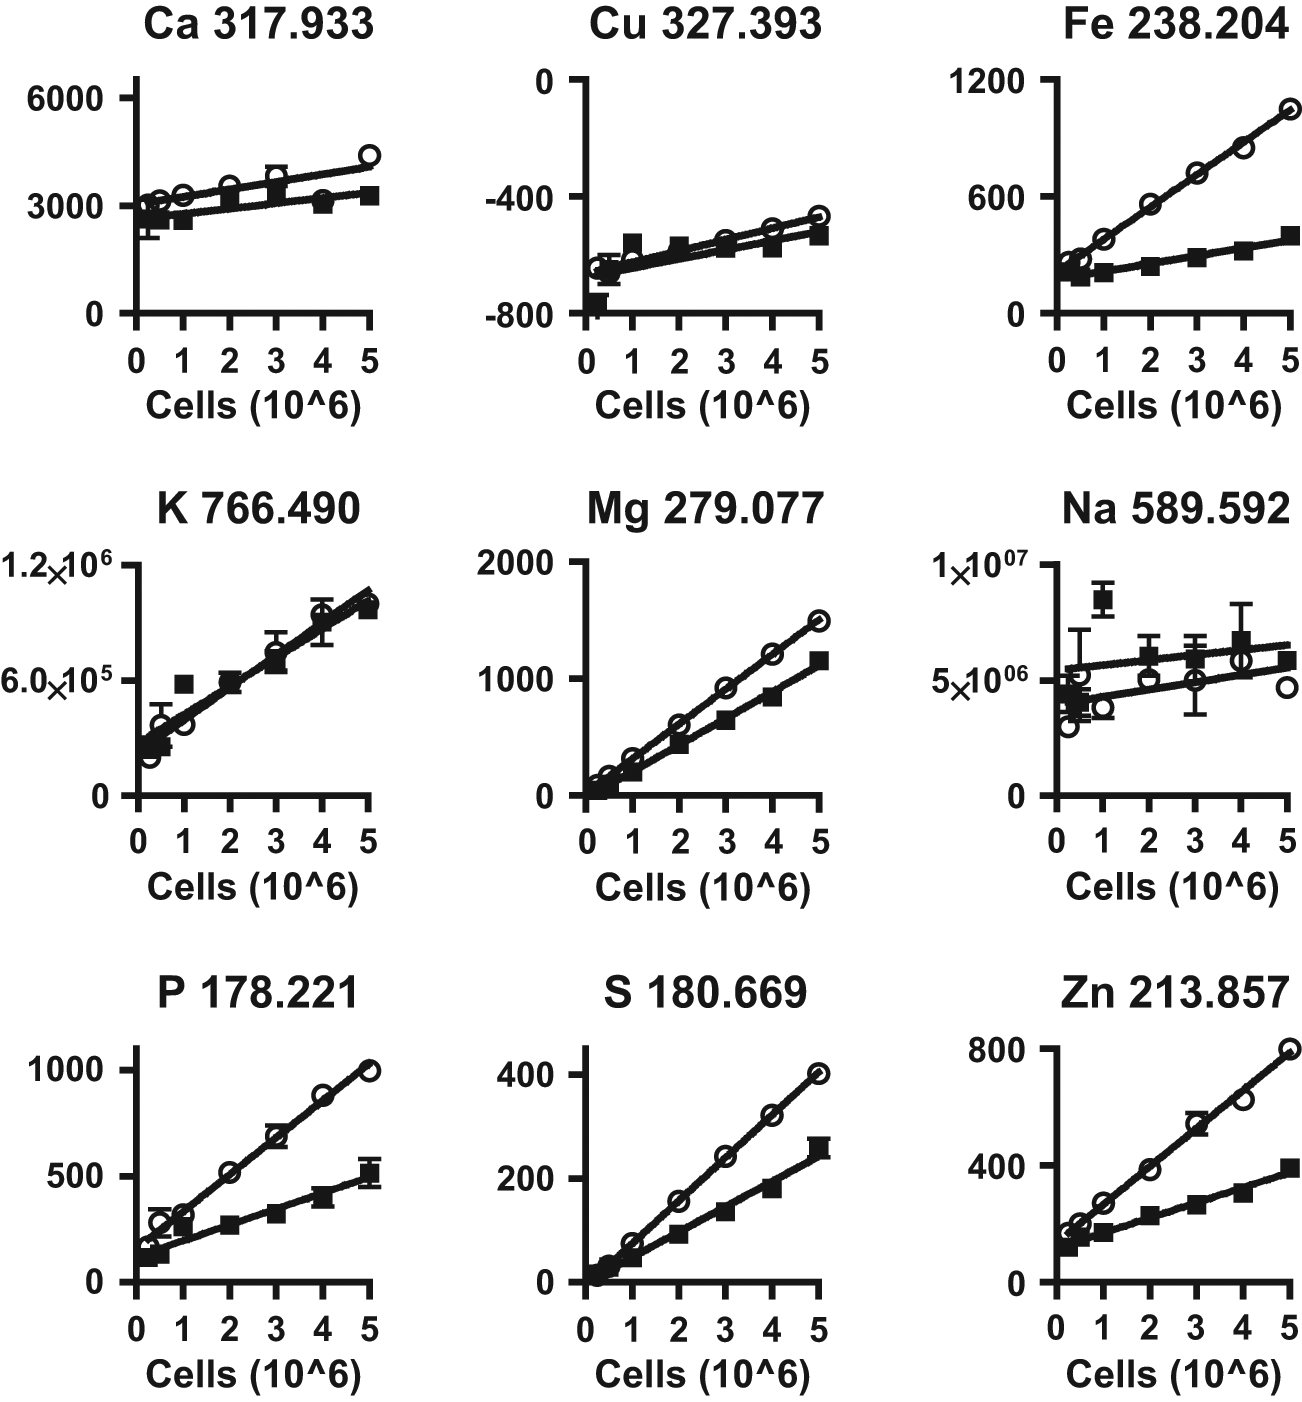
Signal in counts per minute for each element analyzed by ICP-AES in MDA-MB-435 (black boxes) and HeLa (open circles) cells. Graph titles consist of the element analyzed and it’s corresponding wavelength.
Slopes and Goodness-of-Fit Values for Data in Figure 1
Next, we evaluated whether a change in the metabolic state of the cell would affect the ability to measure cell numbers using Mg, S, or Zn. Cells were serum starved for up to 6 h. Over this time, intracellular content of Mg, S, and Zn showed some slight variation ( Fig. 2 ). By 6 h, Zn content increased <5%, Mg increased 5 to 10%, and S increased 20 to 30%. The large change in S suggests a time-dependent increase of albumin in the digestates. Each albumin molecule contains 35 cysteines and by extension 35 S atoms. Both Zn and Mg showed small but significant increases, which may be due to a change in cellular metabolism.
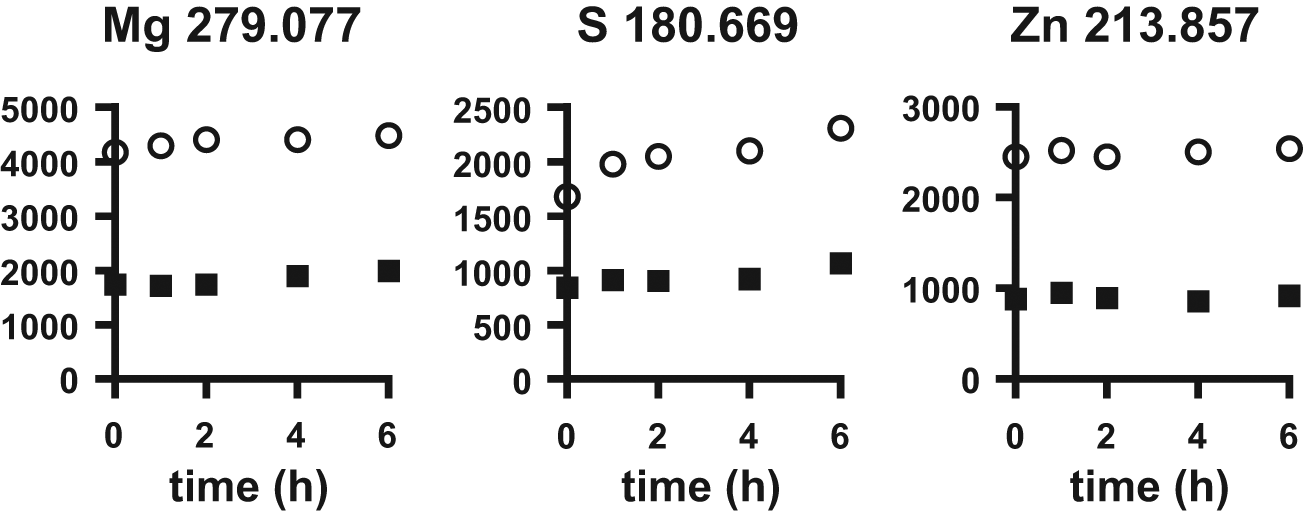
Change in elemental composition after serum starvation of MDA-MB-435 (black boxes) and HeLa (open circles) cells.
All three of these elements would be suitable for ICP-AES–based cell quantification. However, measuring all three would be redundant, and we proceeded to pick the most advantageous candidate for nanomaterial cell studies. Unfortunately, ZnS is often used to cap quantum dots, and this eliminates both S and Zn as markers for cell numbers. Also, the large number of S atoms in many proteins makes this element a poor candidate for cell quantification. Because Mg is not present in many nanomaterials and showed the highest correlation with cell number, we tested whether this element was suitable for cell quantification. Mg plays an important role in biological systems because of its catalytic properties. Mg2+ is one of the most abundant divalent metal ions in cells, participating in many cellular processes and the regulation of hundreds of enzymatic reactions. 11 For example, Mg ions bind to polymerases and act as a cofactor in DNA and RNA synthesis. Also, intracellular magnesium concentration is similar for both apoptotic and intact cells. 12 The high cellular content of Mg and its stable intracellular concentration make this element suitable for cell quantification by ICP.
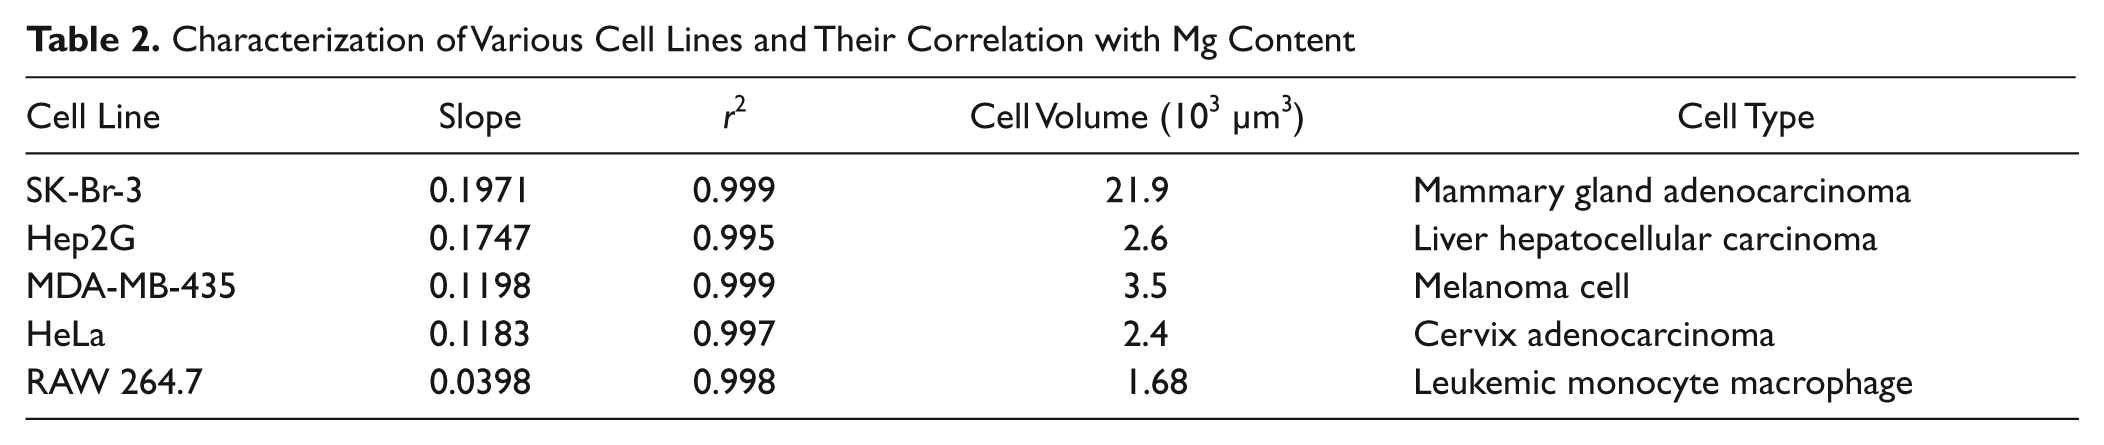
To validate this proposed technique, cell standards were prepared from five different cell lines and compared with a Mg standard ( Fig. 3 ). All cells showed an excellent correlation with Mg concentration (r2 > 0.99), albeit with different slopes ( Table 2 ). When comparing the calculated slope for each cell line, we noticed a correlation with cellular volume4,13–15 ( Table 2 ). Generally, smaller cells, such as the RAW 264.7, possessed a smaller slope (0.0398) compared with the much larger SK-BR-3 cells (0.1917). However, Hep2G and SK-BR-3 cells have similar slopes and drastically different sizes, suggesting that cell phenotype also influences the total content of Mg per cell type. These findings demonstrate excellent correlation between cell number and Mg concentration in an acid-digested sample. Because each cell type possesses its own intracellular concentration of Mg, a full standard curve or some reference samples are essential for accurate quantification of cells. Based on the serum starvation studies ( Fig. 2 ), it is necessary to prepare the cell standards or references with cells exposed to the experimental conditions used to account for small but significant fluctuations in intracellular Mg concentrations.
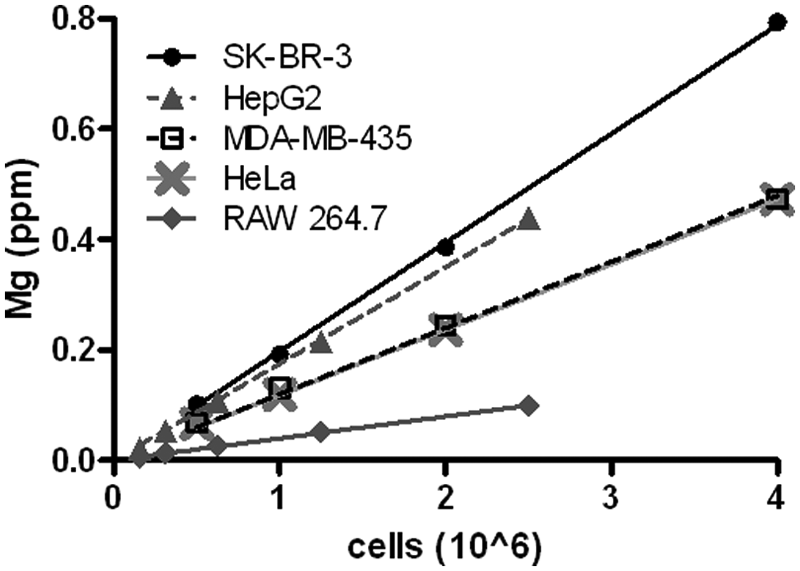
Correlation between magnesium content and cell number for multiple cell lines.
Characterization of Various Cell Lines and Their Correlation with Mg Content
Once Mg-based cell quantification was validated, it was important to verify whether incubation with nanomaterials would alter intracellular concentration. Two frequently used nanomaterials are gold nanoparticles and CdSeS/ZnS quantum dots. To determine the effect of nanomaterial uptake on intracellular Mg concentration, we incubated cells with one of these two nanomaterials for 6 h and monitored the differences in Mg concentration. Based on previous experiments, 6 h incubation was long enough to ensure >80% of maximum nanomaterial uptake into cells. 1 We tested 15, 70, and 90 nm gold nanoparticles coated with transferrin protein and incubated these NPs with three different cell lines. The inclusion of transferrin on the surface of nanoparticles was to promote receptor-targeted endocytosis, a common strategy for nanomaterial uptake. In all three cell lines, which express the transferrin receptor,16,17 we detected significant uptake of gold nanoparticles without any changes to cellular Mg content ( Fig. 4A ). All three cell lines show much higher uptake of the 90 nm nanoparticles than 15 nm. Uptake of the 70 nm nanoparticles was similar to 15 nm in SK-BR-3 and HeLa cells but significantly higher in MDA-MB-435 cells, demonstrating some cell phenotype-based variability in uptake. Similar findings were also observed for thioglycolic acid–capped 575-nm-emitting CdSeS/ZnS quantum dots. When Hep2G and RAW264.7 cells were incubated in quantum dots for 6 h, some cell uptake was apparent after 6 h, with no change in cellular Mg content ( Fig. 4B ). Similar to gold nanoparticles, the quantum dots also show distinct uptake quantities based on cell phenotype. With regard to cell quantification, our data show that uptake of gold nanoparticles and quantum dots do not significantly alter intracellular Mg concentrations. These findings confirm the accuracy of this cell quantification technique in nanomaterial uptake studies.
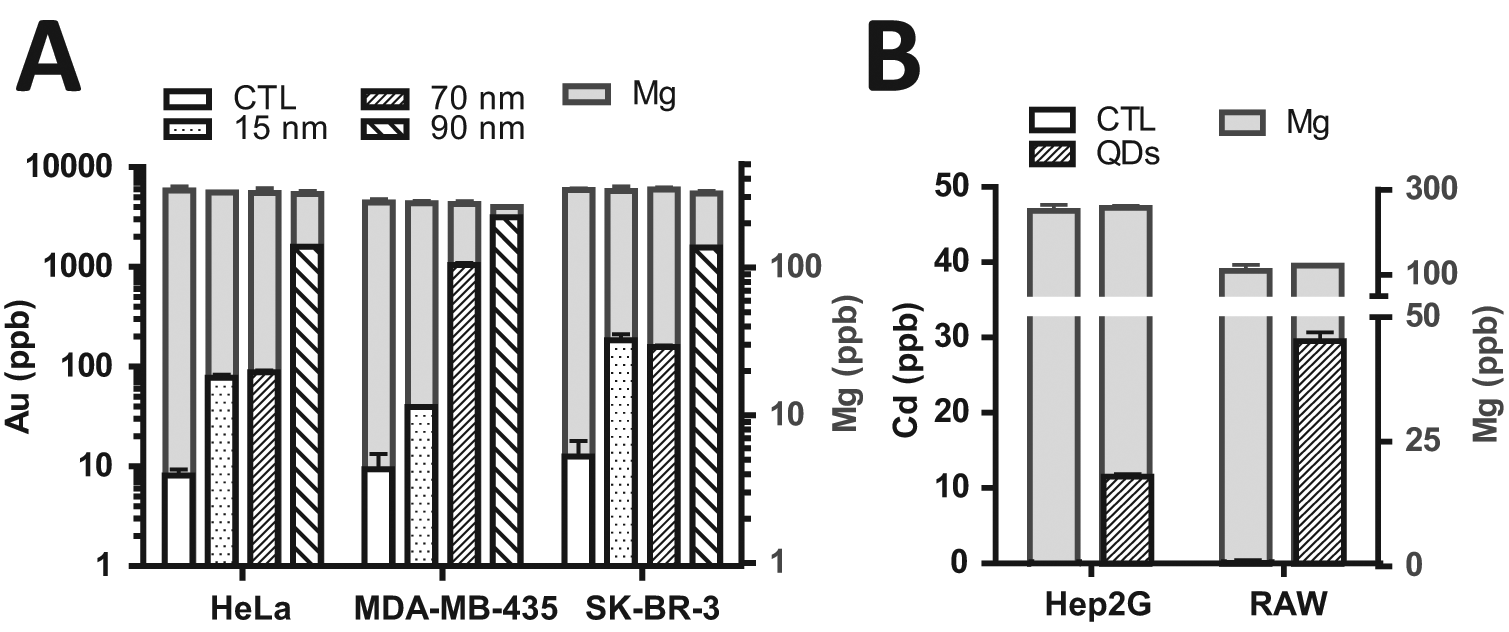
No effect of nanomaterial uptake on Mg. Cells were incubated with transferrin-coated gold nanoparticles (
To highlight the advantages of our technique, we decided to assess the effect of nano-urchin shape on cell uptake. These novel nanostructures possess interesting optical properties that make them excellent candidates for the design of SERS probes and hyperthermia-based therapies. 18 However, their characteristic protrusions render their surface asymmetrical and pointy. Because most uptake studies focus on relatively smooth nanomaterials (spheres, cubes, prisms), we wanted to determine whether the spikes on the surface of a gold nanosphere would alter cellular uptake. We used the A549 lung carcinoma cell line to compare the uptake of transferrin-coated nanoparticles and nano-urchins over various time points. Cells were incubated with the nanomaterials, washed, and lysed directly on the plate with nitric acid. In addition to the cell digestates, we prepared five Au standards, five Mg standards, and two duplicate A549 references counted by Trypan blue exclusion assay (1 × 10⁶ and 2 × 10⁶ cells). Based on our elemental standards and cell references, we were capable of quantifying both the number of nanostructures and total cell number per digestate using only ICP-AES ( Fig. 5 ). The Mg content of most samples did not change with any statistical significance, except for the 15 h time point, at which we noticed an ~10% increase in Mg likely due to cell proliferation. For a given set of experimental replicates, normalizing Au concentration to Mg reduced the standard error compared with the Au values alone. The gold uptake studies revealed a decreased internalization rate for the nano-urchins compared with nanoparticles during the first 2 h (170.5 vs. 343 NP cell–1 h–1). Beyond the 2 h time point, no significant differences were detected. The differences observed in the early time points lead to a different uptake half-life for the nanoparticles (3.18 h) compared with nano-urchins (4.35 h). These findings reveal a decreased uptake of nano-urchins by A549 cells during short exposure times, likely due to irregular morphology.
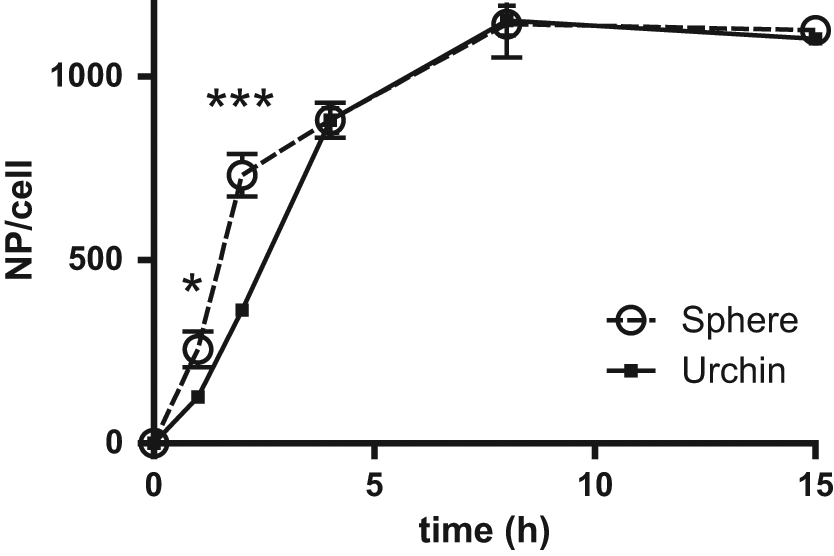
Uptake of gold nano-urchins. A549 cells were incubated with 5 pM transferrin-coated gold nanoparticles or nano-urchins.
Conclusion
Our findings confirm that Mg can be used to quantify cell numbers in a given sample. Using this approach, it is possible to resuspend the nanomaterial-treated cell monolayer with nitric acid directly in the cell culture plate, eliminating the need for trypsinization. Our method provides a label-free internal standard to ensure that the quantity of nanomaterials detected in a given sample is for a specific number of cells. This technique reduces the variation coefficient between replicates by minimizing sample loss-related errors and will speed up the analysis of nanoparticle interaction with cells. The quantification of cellular elements such as Mg or Zn can also be used to assess the effect of nanoparticles on the state of a cell. For example, during long experiments, this technique can account for either cytotoxicity or cell proliferation and eliminate any sample-to-sample bias caused by a change in cell numbers. With the constant production of novel nanomaterials destined for biological applications, this technique will simplify the study of nano-bio interactions and ensure accurate measurements of cell uptake.
Footnotes
Declaration of Conflicting Interests
The authors declared no potential conflicts of interest with respect to the research, authorship, and/or publication of this article.
Funding
The authors disclosed receipt of the following financial support for the research, authorship, and/or publication of this article: This work was supported by the Natural Sciences and Engineering Research Council of Canada (BiopSys Network, grant No. NETGP35015-07; Discovery Grant, grant No. RGPIN 288231-09), Canadian Institute of Health Research (MOP-93532). A. Albanese was supported by the Ontario Graduate Scholarship. K. M. Tsoi was supported by the Surgeon-Scientist Program (University of Toronto) and by the Natural Sciences and Engineering Research Council of Canada.
References
Supplementary Material
Please find the following supplemental material available below.
For Open Access articles published under a Creative Commons License, all supplemental material carries the same license as the article it is associated with.
For non-Open Access articles published, all supplemental material carries a non-exclusive license, and permission requests for re-use of supplemental material or any part of supplemental material shall be sent directly to the copyright owner as specified in the copyright notice associated with the article.