
Abstract
Bacterial biofilms are a persistent source of contamination, and much effort has been invested in developing antifouling surfaces or coatings. A bottleneck in developing such coatings is often the time-consuming task of screening and evaluating a large number of surface materials. An automated high-throughput assay is therefore needed. In this study, we present a promising technique, laser scanning cytometry (LSC), for automated quantification of bacteria on surfaces. The method was evaluated by quantifying young Staphylococcus xylosus biofilms on glass surfaces using LSC and comparing the results with cell counts obtained by fluorescence microscopy. As an example of application, we quantified bacterial adhesion to seven different sol-gel-based coatings on stainless steel. The surface structure and hydrophobicity of the coatings were analyzed using atomic force microscopy and water contact angle measurements. Among the coatings tested, a significant reduction in adhesion of S. xylosus was observed only for one coating, which also had a unique surface microstructure. LSC was particularly sensitive for quantification at low cell densities, and the adhered bacteria could be quantified both as cell number and as area coverage. The method proved to be an excellent alternative to microscopy for fast and reproducible quantification of microbial colonization on abiotic surfaces.
Introduction
Biofilms cause problems in many industries where equipment surfaces are exposed to water. These include, for example, ship hulls and ballast water tanks, medical instruments, and process equipment in the food industry.1,2 Frequent removal of biofilms is costly but necessary, as they cause corrosion and microbial contamination. Much research effort is put into developing antibacterial surfaces, and there are two main strategies to prevent biofilm formation: One is to release a biocide or biofilm-inhibiting compound from the surface, 3 and the other is to weaken cell attachment by modifying the physical or chemical properties of the surface. 4 Development of new antibacterial surfaces requires a fast and reproducible method to screen the surfaces for fouling resistance by quantifying bacterial attachment and biofilm formation.
A truly high-throughput biofilm assay is the spectrophotometric quantification of biofilm in microtiter plates after staining with crystal violet. 5 However, this method can only examine the antifouling properties of soluble compounds and is not suitable for evaluation of different surface materials. Bacterial attachment to different surface materials is instead evaluated by incubating samples in a bacterial culture under controlled conditions in some form of biofilm reactor. This is a simple setup and allows simultaneous incubation of many surfaces. The time-consuming part of the analysis lies in the subsequent enumeration of the attached cells. Methods for enumeration can broadly be divided into indirect and direct quantification methods. Indirect methods quantify bacteria after detaching the cells from the surface, and these methods are often used due to the ease of analysis. Cells are typically detached from the surface by sonication and subsequently quantified as colony-forming unit (CFU) counts. 6 However, only living and cultivable cells can be quantified by CFU counts, and cells in aggregates cannot be counted individually. The total number of cells (living + dead) can be also quantified by flow cytometry 7 or by DNA extraction followed by quantitative PCR (qPCR). 8 All indirect methods have one source of bias in common—namely, the need to detach the cells prior to quantification. Depending on the bacterial species, the surface material, and the time allowed for attachment, the detachment step can be more or less efficient. It is therefore difficult to predict the accuracy of the methods, particularly when quantifying biofilm formation by mixed microbial communities.
Direct quantification methods rely on the enumeration of attached bacteria without the removal of the cells from the surface. Electrochemical impedance spectroscopy 9 records the resistance and capacitance components of the impedance response of a system. It allows measurement without damaging the biofilm, and in addition to being fast, it also allows continuous studies of the biofilm. However, the method does not provide information about cell numbers per se. A relatively new method was developed to quantify surface-attached biofilms by measuring the relative fluorescence units (RFU) of the fluorescently stained bacteria. 10 Finally, a commonly used method is simply counting attached bacteria by microscopy. Here cells are typically stained with nucleic acid–specific dyes and visualized by fluorescence microscopy. 11 An advantage of this approach is the possibility of recognizing and excluding false positives caused by nonspecific staining or autofluorescent particles on the surface. However, manual cell counting is cumbersome. To increase sample throughput, fluorescence microscopy can be combined with image acquisition followed by digital image analysis, making the cell quantification partly automated. Software such as DAIME 12 and COMSTAT 13 are available for processing the image data in 2D and 3D, and the number, area, or volume of cells can be calculated. In general, direct quantification by microscopy is advantageous by being less biased than indirect methods, but the laborious nature of the analysis limits their application for high-throughput screening (HTS) of surfaces.
Laser scanning cytometry (LSC) automates not just image analysis but also fluorescence microscopy. The method was originally developed for studies of cell cycle, protein expression, ploidy, immunohistochemisty, histopathology, and other applications in eukaryotic cells.14–16 However, it also has potential for use in microbiology for cell enumeration and location of subpopulations within heterogeneous microbial communities (see Katsuragi and Tani 17 for review). We here evaluate the sensitivity and reproducibility of LSC for automated quantification of bacteria attached to surfaces. A similar approach, solid-phase cytometry, was demonstrated for quantification of single bacteria in low abundance on filters used to sample, for example, air and drinking water. 18 We here show that LSC is a promising approach to HTS of biofilm formation directly on functionalized surfaces. We compare the performance of LSC with a conventional approach for biofilm quantification and investigate the experimental boundaries for its use. As an example of application, we evaluate the antifouling properties of seven different sol-gel-based silica/ceramic coatings on stainless steel. The organic-inorganic hybrid thin-film coatings obtained by the sol-gel route was recently proposed as a new way of preparing glass-like coatings from silica precursors in mild conditions. 19 The physical and chemical properties of inorganic coatings, such as silica, can be extended by introduction of organic molecules into the inorganic silica matrix. The resulting thin-film coating can be designed to have a specified surface hydrophobicity, transparency, porosity, microstructures, and roughness. Coatings based on organosilanes are a promising solution to battle biofouling. 20 This has been attributed to the versatile nature of organic-inorganic hybrid coatings.
Materials and Methods
Bacterial Strain, Growth, and Suspension Preparation
Staphylococcus xylosus DSM 20266 (Braunschweig, Germany) and S. xylosus C2a (harboring pSB2019, expressing green fluorescence protein) were used as the model organisms. A single colony of S. xylosus was inoculated into 5 mL 1% tryptic soy broth (TSB) and grown in a conical tube overnight at 30 °C with shaking. Then, 1 mL from the culture was transferred to 100 mL 1% TSB and grown under the same conditions. Cells were harvested during late exponential phase (OD600 0.8–1.0) by centrifugation at 3000 g for 10 min. A bacterial cell suspension was prepared by washing the harvested cells twice and resuspending in phosphate-buffered saline (PBS) to OD600 0.05 to 0.07.
Preparation of Test Surfaces
Standard glass microscopy slides (76 × 26 × 1 mm) were used for evaluation of LSC for bacterial quantification, whereas sol-gel coatings were applied to stainless steel, and bacterial adhesion to the coatings was compared with adhesion to bare stainless steel.
Seven different ceramic sol-gel coatings were studied for their ability to prevent bacterial adhesion. Coatings A, B, C, and D were prepared by organosilane precursors. Furthermore, three modified coatings were prepared: Coatings C and D were modified to become more hydrophobic by addition of 1% TEGO Protect 5000 (Evonik, Essen, Germany), a polydimethylsiloxane-based resin (coatings C-TEGO and D-TEGO). Coating C was also modified by addition of Fluorolink D 40/H (Solvay Solexis, West Deptford, New Jersey) (coating C-Fluoro). Fluorolink D 40/H also increases surface hydrophobicity as this resin is based on perfluoropolyether derivatives. Sol-gel coatings were spin coated onto 316b stainless steel slides (76 × 26 × 2 mm) for 8 s at 1000 rpm using a Polos MCD200-NPP (SPS-Europe B.V., Putten, the Netherlands). Prior to spin coating, the stainless steel slides were degreased with acetone and subsequently submerged into 20% Tickopur TR 13 (Monmouth Scientific, Somerset, UK) (aq.) overnight. Slides were thoroughly washed with demineralized water after incubation and dried with compressed air. The average coating thickness obtained was ~5 µm (data not shown). Coating A was cured at room temperature overnight. Other coatings were cured at 140 °C for 1 h. All coatings were freshly prepared for each experiment. Prior to the bacterial adhesion assay, sol-gel coatings and glass slides were incubated in 0.03% Tween-80 overnight and rinsed sequentially for 5 min each in demineralized H2O, acetone, demineralized H2O, 96% ethanol, and demineralized H2O.
Determination of Surface Roughness
Surface roughness of the sol-gel coatings and stainless steel was measured by atomic force microscopy (AFM). AFM images were obtained using a NanoWizard II atomic force microscope (JPK Instruments, Berlin, Germany). Intermittent contact mode imaging was done at room temperature under ambient conditions with a scan rate of 0.6 Hz, using silicon cantilevers (OMCL-AC160TS; Olympus, Tokyo, Japan) (k = 12–103 N/m, f = 200 and 400 KHz, tip radius = 10 nm). Surface roughness (Ra and Rz values), expressed in nanometers (nm), was determined using Scanning Probe Image Processor (SPIP, version 5.1.0; Nanoscience Instruments, Phoenix, AZ) software from 10 × 10-µm2 images after flattening, using the JPK image-processing software. Images were acquired from three different samples for each surface, and three images were acquired for each sample from randomly chosen areas on the sample. Individual images were treated as individual replicates in calculating the mean and standard deviation since the variation within samples was larger than between samples (one-way analysis of variance [ANOVA]; p > 0.1). Difference in the roughness values between sol-gel coatings was analyzed by one-way ANOVA. Roughness difference between individual sol-gel coatings and stainless steel was analyzed by Student’s t-test, wherever needed.
Determination of Surface Hydrophobicity
Surface hydrophobicity was approximated as the water contact angle using a KRÜSS DSA 100 (KRÜSS, Hamburg, Germany) contact angle measuring system under ambient conditions. Surfaces were cleaned as described earlier prior to contact angle measurements. Measurements were done with deionized H2O. Contact angles were calculated from the images using the DropSnake plug-in of ImageJ (National Institutes of Health, Bethesda, MD). 21 Three measurements were taken from different locations on three different samples for each surface. Statistical analysis was done as described for the roughness measurements.
Bacterial Adhesion
Test surfaces were placed in a circular rack in the biofilm reactor containing 2 L of bacterial suspension prepared as described above and incubated with stirring (120 rpm) for 2 h at room temperature to allow the bacteria to adhere. Experiments evaluating LSC as a tool for bacterial quantification were designed to facilitate adhesion of bacteria at a range of densities. In these experiments, surfaces were incubated in bacterial suspensions prepared at OD600 of 0.02, 0.03, 0.04, 0.08, and 0.19. Experiments evaluating bacterial adhesion to sol-gel-coated surfaces in comparison to stainless steel were all performed at OD600 of 0.05.
Surfaces were recovered and nonadhered bacteria were gently removed by dipping the rack in sterile PBS three times. The remaining bacteria on the surfaces were stained with 20 µL of 20× SYBR Green II RNA stain (2 µL mL–1 of 10 000× SYBR Green II stock [Sigma-Aldrich, St. Louis, MO]), covered with glass cover slip, and sealed with nail polish to avoid evaporation. Slides were kept in the dark at 4 °C until quantification of adhered bacteria.
The biological variation can cause some differences in the total amount of adhered bacteria obtained in different experiments, although adhesion tests were carried out with cultures that had the same optical density. Stainless steel controls were therefore included in all experiments, and the amount of adhered bacteria on sol-gel coatings was expressed relative to the stainless steel reference from the same incubation. The result was thus a fraction of two means, and we therefore calculated the total standard deviation using the multiplication rule for handling means with standard deviations (equation (1)).

where X = A/B, A = the mean area coverage of sol-gel surfaces, B = the mean area coverage of stainless steel, and σ = standard deviation (n = 3).
Quantification of the Adhered Bacteria
Evaluation of LSC as a quantification method was done by repeating the bacterial adhesion assays at many different cell culture densities to obtain a range of different cell densities on the surfaces. All samples were first analyzed by LSC and then by manually counting the cells using fluorescence microscopy. A correlation between the values obtained with the two quantification methods could then be made, and the sensitivity and accuracy of LSC quantification at different cell densities were evaluated.
LSC (CompuCyte Corp., Cambridge, MA) is a microscope-based cytofluorometer equipped with a 488-nm argon and a 623-nm HeNe laser. The sample is excited through the objective lens by a laser beam, which rapidly scans the chosen area. The size of the laser beam is approximately 2.5 µm when using a 40×/0.75 NA objective. A computer-controlled motorized stage moves the sample at 0.5 µm steps per laser scan, perpendicular to the scan. Fluorescence emitted by the sample is collected by the objective lens and directed to a CCD camera for imaging. A part of the light is directed to the photomultiplier, and the fluorescence from individual pixels of the scanned area is calculated by the software. A review of the working principles of LSC can be obtained from Darzynkiewicz et al. 16 A standardized scanning procedure was established to ensure reproducibility. The number of cells and the area they cover were quantified for at least 12 randomly chosen scan areas of 2000 × 4000 µm (0.08 cm2) on each sample. The signal intensity was optimized by adjusting the photo-multiplication percentage (PMT%). A sharp boundary and high contrast between cells and the background were obtained by increasing the PMT% until the signal intensity was saturated for all cells. The background contour threshold was then adjusted to clearly define the cell boundary from the background. The effect of varying the PMT and background contour threshold values was first assessed by keeping the threshold constant and varying the PMT% or vice versa. In all following analyses, a PMT% value of 25 and threshold intensity of 10 000 was chosen as standard for all samples.
Manual cell counting was performed using a Zeiss Axiovert 200M epifluorescence microscope (Carl Zeiss GmgH, Jena, Germany) equipped with Zeiss filterset 10 and 63× or 100× oil immersion objectives. Cells were counted in 190-µm2 or 120-µm2 grids (depending on the magnification used) in random positions on the slide until a minimum of 1000 cells had been counted on each sample.
Results
Evaluation of LSC for Quantification of Adhered Bacteria
Quantification of adhered bacteria by LSC can be done by counting the number of particles or by summarizing the area of counted particles (cell area coverage) within a defined scan area. The cell area was highly dependent on the PMT% and threshold contour settings and increased with increasing PMT% or decreasing threshold value (
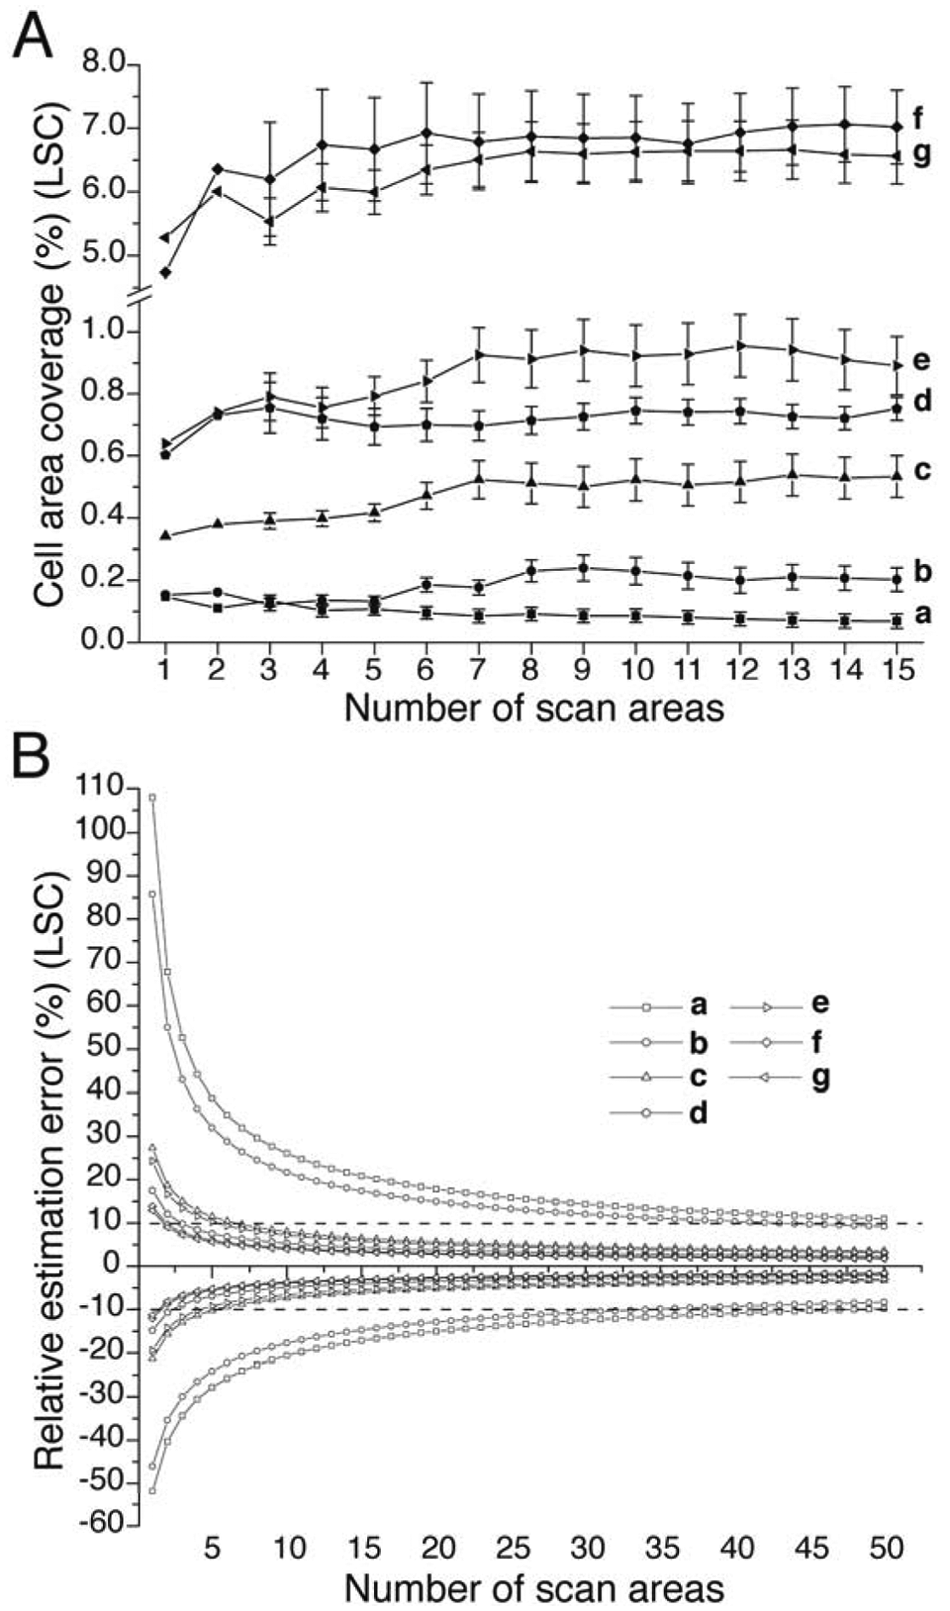
The number of scan areas required to accurately represent the cell coverage of a sample was evaluated by calculating the running average of the cell area coverage at an increasing number of scan areas ( Fig. 1A ). As the number of scan areas increased, the standard deviation of the average cell area coverage decreased. The relative estimation error for the running average of cell area coverage was within ±20% after scanning two areas and within ±10% after scanning seven areas ( Fig. 1B , series c–g). To standardize the protocol, we scanned 12 scan areas (0.96 cm2) on each sample. Acquisition of three independent series of 12 scan areas within one sample did not result in significant differences in cell area coverage per cm2 (ANOVA F = 0.55, p = 0.58).
(
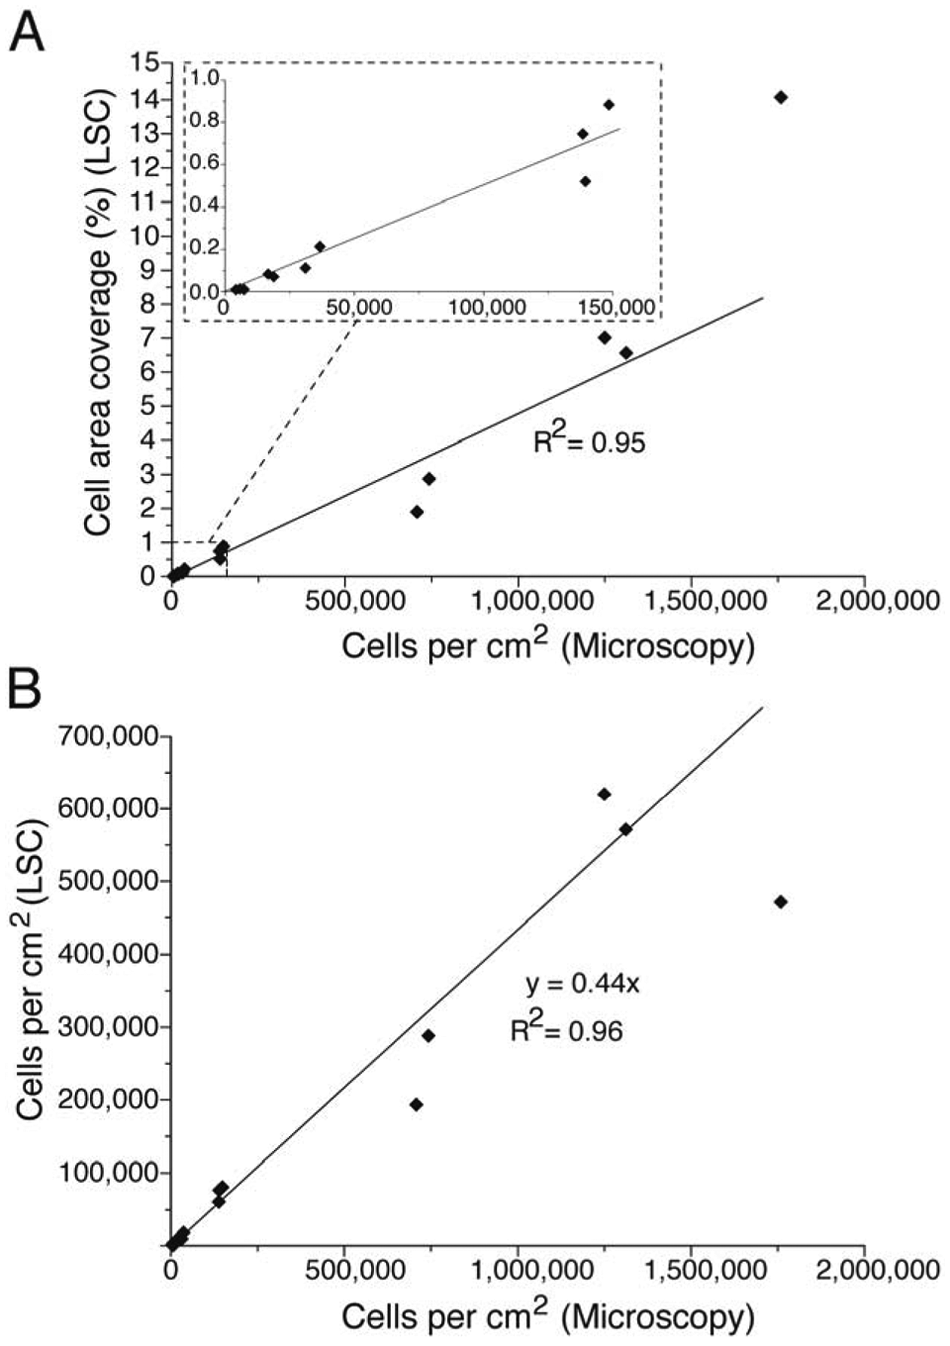
Quantification of the cell area coverage by LSC was compared sample by sample with manual cell counting by fluorescence microscopy ( Fig. 2 ). Each data point represents the cell area coverage on a single sample quantified by LSC and fluorescence microscopy. We analyzed samples with cell densities between 4.2 × 10³ and 1.8 × 10⁶ cells per cm2. A linear correlation between values obtained by the two methods was obtained at cell densities up to 1.3 × 10⁶ cells per cm2 ( Fig. 2A ). A similar correlation was obtained when comparing cell counts obtained by LSC with manual cell counts obtained by microscopy ( Fig. 2B ).
Cell area coverage (
Repeated scans of the same area caused bleaching of the fluorescent signal, and progressively smaller values of cell area coverage were obtained for each scan (
Characterization of Sol-Gel Coatings
The roughness and water contact angle measurements for sol-gel coatings and stainless steel are summarized in Table 1 . All sol-gel coatings were very smooth, with Ra values in the low nanometer range. Coating A had the highest roughness among the sol-gel coatings. Its roughness was similar to that of stainless steel (p > 0.05), but the coating had a distinct surface topography with 1-µm pores in an otherwise flat surface ( Fig. 3 ). The topography of other sol-gel coatings revealed no distinct patterns. The water contact angle of the sol-gel coatings ranged between 70 and 107 degrees, and application of additives to coatings C and D made these coatings more hydrophobic.
Roughness, Water Contact Angle, and Bacterial Adhesion on Sol-Gel-Coated and Uncoated Stainless Steel (SS) Surfaces
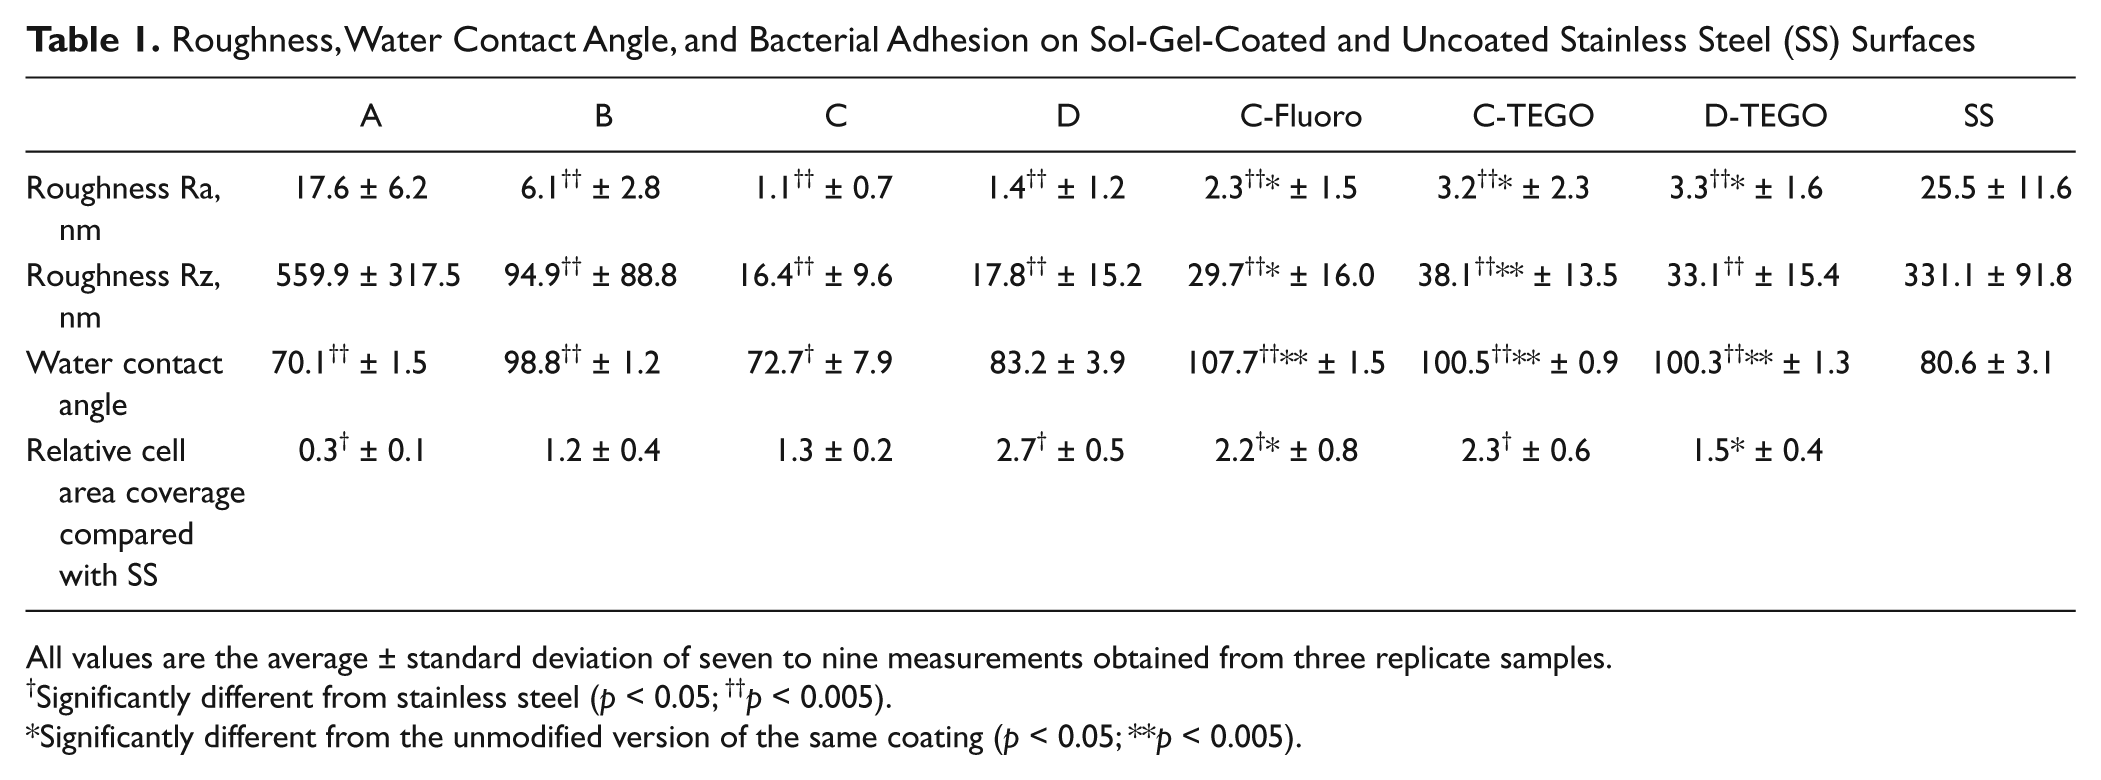
All values are the average ± standard deviation of seven to nine measurements obtained from three replicate samples.
Significantly different from stainless steel (p < 0.05; ††p < 0.005).
Significantly different from the unmodified version of the same coating (p < 0.05; **p < 0.005).
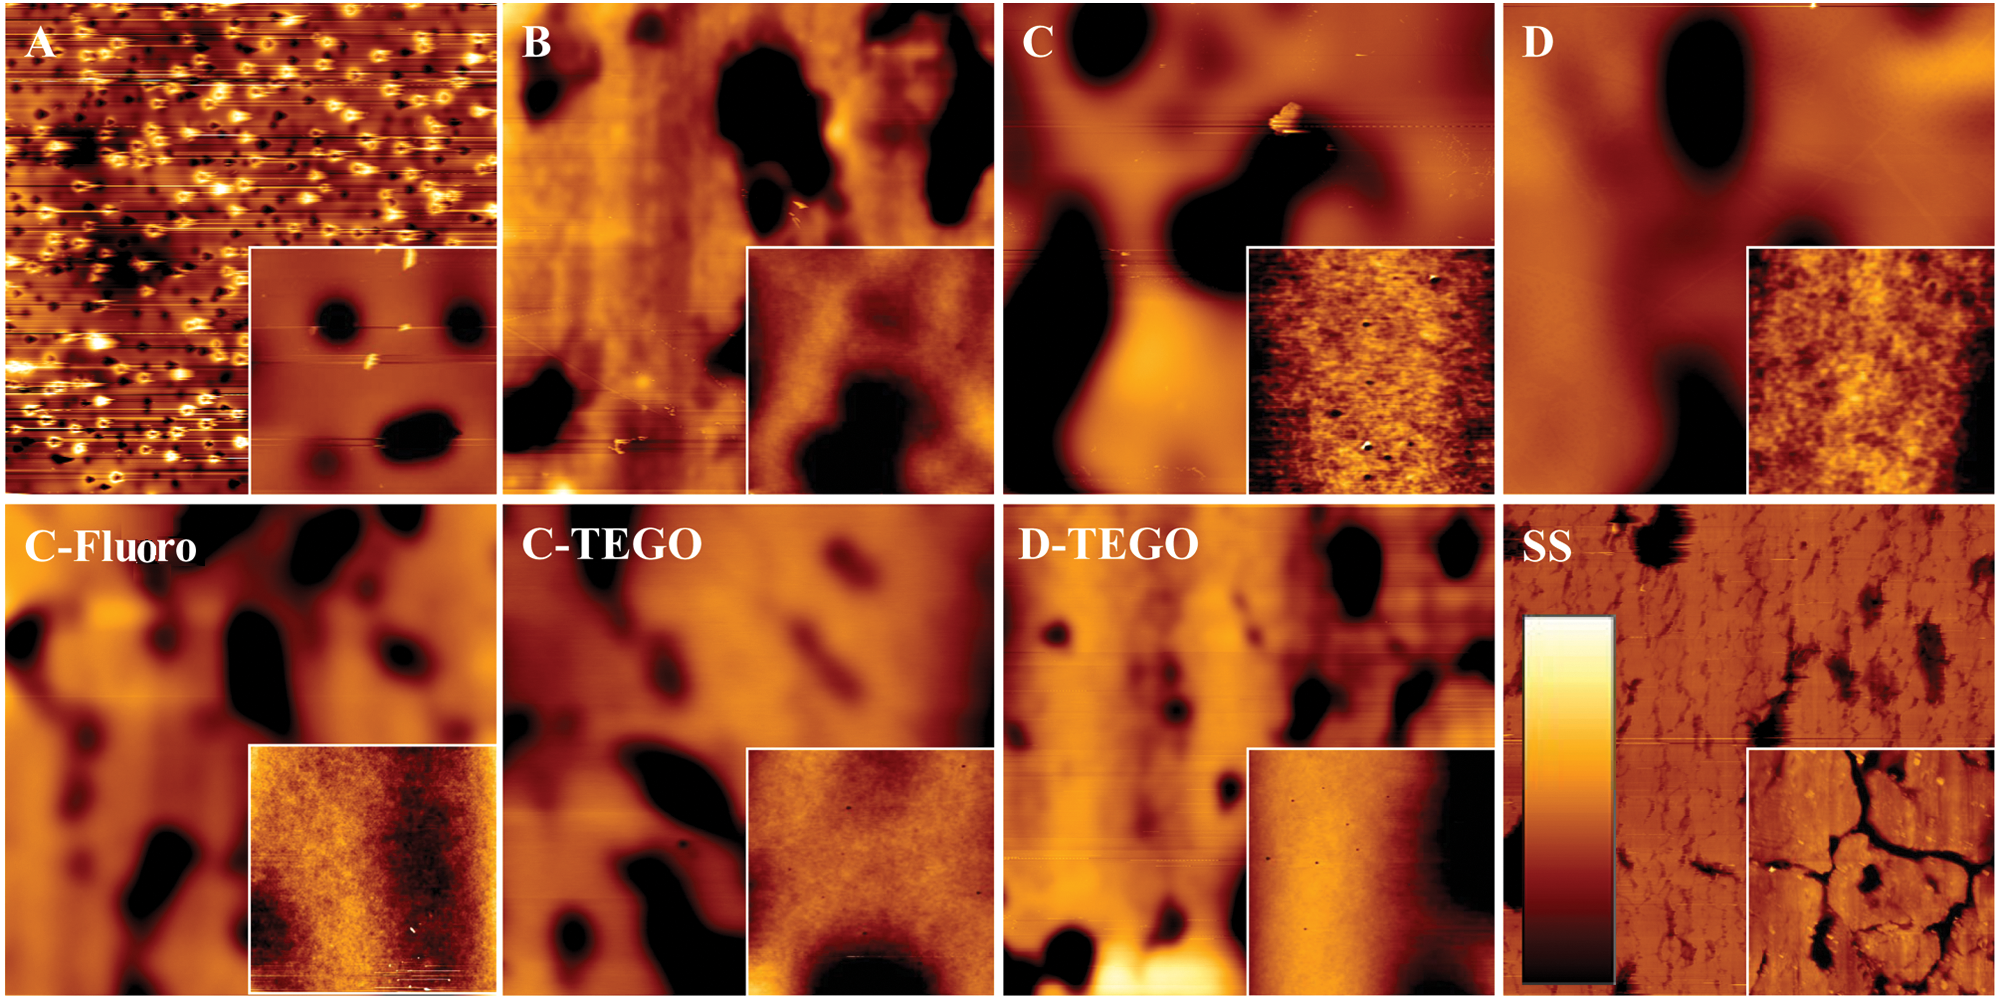
Atomic force microscopy images of sol-gel coatings (A, B, C, D, C-TEGO, C-Fluoro, and D-TEGO) and stainless steel (SS). Larger images are 100 × 100 µm (height scale [nm]: 250 for sol-gel coatings and 1800 for SS), and the inset images are 10 ×10 µm (height scale [nm]: 150 for A and SS; 25 for B and D-TEGO; 3 for C, D, C-TEGO, and C-Fluoro) scan areas.
Bacterial adhesion to sol-gel coatings was expressed as the cell area coverage on sol-gel relative to the cell area coverage on stainless steel ( Table 1 ). Surprisingly, most coatings contained the same or more cells compared with stainless steel. Only coating A demonstrated a significant reduction in bacterial adhesion compared with stainless steel.
Discussion
We evaluated LSC as a direct biofilm quantification method where microscopy and cell quantification are automated in a one-step process. An advantage of automated microscopy and cell quantification is the ability to analyze a large surface area without increasing the labor intensity. Analysis of large sample areas helps to overcome the problem of sample heterogeneity often encountered when quantifying bacterial adhesion and biofilm formation. We quantified and summarized the adhered cells in several discrete scan areas and found that a total scan area of 0.96 cm2 was sufficient to reproducibly quantify S. xylosus on the surfaces ( Fig. 1A ). One may choose to increase the scan area further when analyzing highly heterogeneous samples. For comparison, the area analyzed by epifluorescence microscopy was typically 20 fields of view, corresponding to 0.007 cm2. Hence, LSC not only reduces sample processing time but potentially also increases the reproducibility of the analysis by increasing the analyzed sample area. An area of 0.007 cm2 could be scanned by LSC in only a few seconds, whereas it took 20 to 30 min by epifluorescence microscopy. As we chose to scan a larger sample area by LSC, the real sample analysis time was longer (minutes), but the operator did not need to attend to the instrument during that time.
LSC quantifies both the cell number and the cell area coverage. Individual cells in a microcolony cannot be distinguished, and cell aggregation therefore leads to underestimation of the total cell number. Most S. xylosus cells occurred as duplets on stainless steel (data not shown), and as a result, the cell number quantified by LSC was consistently half of that obtained by manual counting ( Fig. 2B ). We therefore chose to quantify adhered cells based on their cell area coverage rather than cell number.
All quantification methods have an upper and lower detection limit between which reproducible results can be obtained. The lower detection limit of microscopy-based methods depends on how large a sample area can be analyzed. The ability of LSC to scan large areas (up to 19 cm2) therefore allows reliable quantification of adhered cells at very low densities. We were unable to prepare samples with cell densities lower than 4 × 10³ cells per cm2, and we could therefore not determine the lower detection limit. The upper detection limit is approximately 106 cells per cm2 for S. xylosus. At cell densities above 1.3 × 10⁶ cells per cm2, there was no linear correlation between cell numbers quantified by manual counting and the cell area coverage quantified by LSC. Quantification of cells by LSC is thus more accurate at lower cell densities. The nonlinear correlation at higher cell densities was most likely caused by cell aggregation. The number of cells estimated by LSC was not surprisingly underestimated, as aggregated cells are counted as one. In contrast, LSC overestimated the number of adhered bacteria when measured as area coverage at high cell densities. This did not seem intuitive at first, but when inspecting the images, we noticed that small gaps between aggregating cells were included in the cell area, and this could explain the slightly overestimated total cell area of aggregating cells versus single cells.
Quantification methods based on fluorescence microscopy and digital image analysis involve careful adjustment of the exposure and threshold settings during image acquisition and the subsequent image analysis to ensure comparable results from different samples. Quantification by LSC requires similar considerations. Equivalent to how the cell area is affected by exposure time and threshold settings in digital image acquisition, the cell area measured by LSC is affected by the PMT% and threshold settings (
One must take special care to minimize bleaching during sample handling whenever fluorescence labeling is used for cell quantification. It is not possible to entirely avoid bleaching during sample analysis, and it is therefore important that the same area of a sample is not analyzed multiple times. Multiple lasers provide the possibility for using multiple fluorophores, and this is particularly useful in evaluating the functionality of antimicrobial surfaces, as live and dead cells can be quantified simultaneously by SYTO9 and propidium iodide staining. 22 Cells that are killed upon contact with an antimicrobial surface can remain adhered, and the total cell number may therefore not truly reflect the antibacterial effect of a surface in short-term adhesion tests. Similarly, in multispecies biofilm, subgroups of bacteria can be differentially labeled by fluorescence in situ hybridization and their fraction of the total cell number quantified. 23
Using the protocol established above, bacterial adhesion was investigated on a number of sol-gel coatings and compared with stainless steel, a material commonly used in food processing equipment. Sol-gel-derived silica/ceramic coatings can alter the surface topography and add new functionality to a substrate. This is interesting from an antifouling perspective as the adhesion and proliferation of bacteria on abiotic substrates are influenced by their physicochemical properties.19,24 Properties such as hydrophobicity, roughness, hardness, and topography of sol-gel coatings can be controlled by using one or several additives in the coating formulation. Four different base coatings (A–D) were tested in this study, and two coatings (C + D) were modified with surface migrating additives to make them highly hydrophobic. Such surfaces are commonly termed nonstick surfaces because they repel fluids.
S. xylosus was able to colonize all the sol-gel coatings tested, and only coating A contained fewer cells than stainless steel. Bacterial adhesion to all other coatings was either similar to (coating B + C) or higher than stainless steel ( Table 1 ). Bacterial adhesion is generally considered to be more favorable on rough surfaces, 25 and we had therefore expected to find fewer bacteria adhering to the sol-gel-coated stainless steel. The coatings were overall smooth, with Ra values below 18 nm, but contained a few large grooves (coatings B–D) or evenly distributed pits (coating A). This inhomogeneous topography resulted in a large difference between the roughness parameters Ra and Rz and illustrates that it is not straightforward to predict how surface topography described through these parameters might influence bacterial adhesion. When considering the Ra value, the only coating that had an Ra value similar to stainless steel (coating A, p > 0.05) was the only coating to which fewer bacteria adhered. It is thus likely that surface chemistry played a larger role than topography in affecting bacterial adhesion to the sol-gel coatings tested here. Coating A differed from other sol-gel coatings by being more hydrophilic and by having well-defined and uniformly distributed circular cavities of approximately 1 µm in diameter. Such cavities are a well-known phenomenon in sol-gel coatings. 26 Several factors influence the surface microstructure of sol-gel thin films, such as the structure and reactivity of the inorganic species, timescale of film formation, evaporation rate, film thickness, and the shear and capillary forces applied during the deposition process. 27 Understanding the details of what caused the appearance of the cavities is beyond the scope of the present study. These microstructures have clearly contributed to the higher surface roughness of coating A, and the rationale behind the effect on bacterial adhesion needs further investigation.
The hydrophobic modification of coating C resulted in increased adhesion. Several studies have shown that most bacteria adhere better to hydrophobic than to hydrophilic surfaces,28–30 and one could therefore speculate that the hydrophobicity of “nonstick” surfaces has the opposite effect when the surface is continuously submerged in an aqueous solution. Our results, however, cannot be explained that simply, as hydrophobic modification of the already moderately hydrophobic coating D had the opposite effect.
In summary, LSC is a rapid and reproducible method for direct quantification of bacteria on surfaces. It provides a broad window of detection and is excellent for quantification of bacteria in low densities because it retrieves information from a large sample area with minimal effort. Using two or more lasers, it is furthermore possible to simultaneously quantify differentially stained groups of bacteria in the same sample, such as living and dead bacteria. As exemplified by screening the fouling properties of ceramic sol-gel coatings, this approach is highly useful for studies that require quantification of bacteria on any type of nonfluorescent, flat substrate.
Footnotes
Acknowledgements
We thank Kristoffer Piil, Arhus University for statistical guidance. We thank Dr. Friedrich Götz, Professor, Dept. of Microbial Genetics, Universität Tübingen, for providing S. xylosus C2a strain and Dr. P. J. Hill, Associate Professor of Microbiology, School of Biosciences, University of Nottingham, for providing the GFP plasmid, pSB2019.
Declaration of Conflicting Interests
The authors declared no potential conflicts of interest with respect to the research, authorship, and/or publication of this article.
Funding
The authors disclosed receipt of the following financial support for the research, authorship, and/or publication of this article: Danish Agency for Science, Technology and Innovation (grant numbers 2106-07-0013 and 272-05-0020); Alfa Laval A/S; and the Carlsberg Foundation (grant number 2009-01-0270).
References
Supplementary Material
Please find the following supplemental material available below.
For Open Access articles published under a Creative Commons License, all supplemental material carries the same license as the article it is associated with.
For non-Open Access articles published, all supplemental material carries a non-exclusive license, and permission requests for re-use of supplemental material or any part of supplemental material shall be sent directly to the copyright owner as specified in the copyright notice associated with the article.