
Abstract
An automated FTIR method for the determination of the base content (BCpKa) of oils at rates of > 120 samples/h has been developed. The method uses a 5% solution of trifluoroacetic acid in 1-propanol (TFA/P) added to heptane-diluted oil to react with the base present and measures the ν(COO−) absorption of the TFA anion produced, with calibrations devised by gravimetrically adding 1-methylimidazole to a heptane-TFA/P mixture. To minimize spectral interferences, all spectra are transformed to 2nd derivative spectra using a gap-segment algorithm. Any solvent displacement effects resulting from sample miscibility are spectrally accounted for by measurement of the changes in the 1-propanol overtone band at 1936 cm−1. A variety of oils were analyzed for BC0.5, expressed as mEq base/g oil as well as converted to base number (BN) units (mg KOH/g oil) to facilitate direct comparison with ASTM D2896 and ASTM D974 results for the same samples. Linear relationships were obtained between FTIR and D2896 and D974, with the ASTM methods producing higher BN values by factors of ~1.5 and ~1.3, respectively. Thus, the FTIR BC method correlates well with ASTM potentiometric procedures and, with its much higher throughput, promises to be a useful alternative means of rapidly determining reserve alkalinity in commercial oil condition monitoring laboratories.
Introduction
Base number (BN) is an oil quality parameter typically used as a measure of the base present in new or in-service high-ash combustion engine crankcase lubricants. Combustion engines require lubrication under hostile, high-temperature, and acid-producing environments. In operation, crankcase lubricants are exposed to soot, water, and metal wear debris as well as acidic combustion by-products, such as sulfuric acid (H2SO4) and nitric acid (HNO3), and carboxylic acids produced by oxidative processes. To enhance lubrication performance and counter acid accumulation, lubricant formulations typically contain alkaline detergents and dispersants, antiwear agents, and antioxidants, among other additives, the formulation being adjusted in relation to the fuel type and quality and the expected engine load and/or operating conditions. For diesel engine oils, acid neutralization is a priority, and overbased detergents, predominantly metal carbonate-overbased calcium sulfonates, are incorporated into the oil formulation, with new oils typically having BN values in the range of 7 to 12 mg KOH/g oil. 1 During operation, the detergent is slowly neutralized as acidity develops, and it is important to ensure that in-service oils have adequate levels of reserve alkalinity to counter acid accumulation and minimize corrosion. In the case of natural gas engines, which burn cleaner and run at higher temperatures, little or no detergent is incorporated, with dispersants taking priority, as high-ash oils tend to result in excessive engine deposits. Gasoline engines generally lie between these extremes, with lubricants in smaller, high-rpm engines containing some detergent, whereas most lubricants destined for noncombustion applications tend to be devoid of detergents and dispersants.
The American Society for Testing and Materials (ASTM) has several official methods for measuring BN in lubricants, all of which are titrimetric procedures and report BN in units of mg KOH/g of lubricant. The most commonly employed are potentiometric titration using perchloric acid (ASTM D2896) or HCl (ASTM D4739),2,3 with ASTM D974 4 being a colorimetric titration also using HCl. Owing to its use of perchloric acid (pKa ~ −7.0) in glacial acetic acid, D2896 is considered capable of measuring both the stronger alkaline contributions of the detergents and the much weaker contributions of the dispersants and is thus commonly used to determine BN of newly formulated oils. 2 In-service, high-ash oils tend to be assessed using D4739, which uses HCl (pKa ~ −4.0) and is considered to have a minimal response to weaker alkaline dispersants that may be present. In-service, low-ash oils, which have minimal or no detergent component as part of their formulation, tend to be assessed for acid accumulation through the determination of acid number (AN),4,5 rather than BN, as there is little, if any, base to measure. Regardless of which method is used, sample throughput is limited to ~15 samples/h in the automated form of these titrimetric procedures. 6 Aside from this analytical speed constraint, these methods are generally considered tedious, labor intensive, and problematic from the standpoint of accuracy and reproducibility as well as undesirable in terms of reagent use and disposal. Thus, any automated methodology that is capable of delivering reliable BN or AN data in a more efficient and environmentally friendly manner should be of interest to commercial laboratories that contend with high sample volumes.
Fourier transform infrared (FTIR) spectroscopy is an analytical tool that has undergone extensive development over the past 10 years in relation to lubricant as well as edible oil analysis. 7 From the standpoint of lubricant analysis, its original and still predominant application is as a qualitative condition monitoring (CM) or screening tool8–10 used to flag samples that might need to undergo further testing, typically for AN or BN and/or moisture, acidity in combination with moisture being indicative of the potential for corrosion. Given the importance of these key analyses and the fact that they are all problematic titrimetric methods, the McGill IR Group has endeavored to develop alternative, quantitative FTIR-based methods to measure these important lubricant parameters.11–14 For the determination of AN and BN, the approach that has been taken entails the use of infrared (IR)–active bases and acids, respectively, that exhibit readily measurable spectral changes upon reacting with the acids or bases present in an oil sample. The AN and BN methods initially developed 11 were based on a split-sample analysis, whereby an oil-miscible reagent/solvent mixture was added to one portion of the sample, solvent only was added to the other portion, and a differential spectrum was obtained by subtracting the spectrum of the latter from that of the former. This split-sample approach worked well and minimized the problematic spectral interferences associated with highly variable matrices such as lubricants, but it had the drawback of requiring that two samples be prepared and analyzed to obtain a single result, which is obviously cumbersome and undesirable from the standpoint of analytical efficiency. Accordingly, further work was conducted to address this drawback, resulting in the recent development of an improved FTIR single-sample method for determining acidity in oils. 14
As noted above, the unifying principle of our FTIR methodologies is the addition of a spectrally active acid or base to an oil sample to react with the bases or acids present, followed by FTIR spectroscopic measurements to quantify the amount of the added reagent that has been consumed by the acid-base reaction. As such, the results obtained depend on the acid or base strength of the reagent employed, just as the results obtained by various titrimetric procedures employed for the determination of AN or BN depend, among other factors, on the titrant used. Given that the latter are simply reported as AN or BN values, without any distinction being made as to the titrant employed, the original FTIR methods cited above were similarly referred to as methods for the determination of AN and BN. 11 Recently, in converting the original split-sample FTIR AN method into a single-sample method, 14 we proposed that the FTIR measure of acidity be designated acid content (ACpKa) as opposed to AN, both to clearly differentiate it from the traditional titrimetric measure and to reflect its dependence on the strength of the spectrally active base employed for its determination (e.g., sodium hydrogen cyanamide [NaHNCN; pKa ~9.5] in the single-sample method, potassium phthalimide [pKa ~9.9] in the original split-sample method). Extending this and other concepts used in the development of the FTIR acid content (AC) method, as well as introducing new procedural and computational techniques, this article describes the conversion and upgrading of the original split-sample FTIR-based BN method to a single-sample, FTIR base content (BC) method.
Materials and Methods
Reagents, Calibration Standards, and Sample Preparation
Reagent-grade 1-methylimidazole (1-MeIm; 99%), 1-propanol, heptane, and trifluoroacetic acid (TFA) were obtained from Sigma-Aldrich (St. Louis, MO). Additive-free mineral oil (P-100) and Lubrizol base additive packages as well as a variety of brand-name, high-ash new and in-service oils were obtained from various sources (Canadian Tire, Toronto, Ontario, Canada; Hewitt, Pointe-Claire, Quebec, Canada; WearCheck, Burlington, Ontario, Canada; and Thermal-Lube, Inc., Point-Claire, Quebec, Canada). The reagent used for BC determination was an “aged” 5% (w/v) solution of TFA in 1-propanol (TFA/P). The TFA/P reagent solution requires “aging” for 24 to 48 h as TFA slowly converts over this period of time from its initial dimeric form in solution to its monomeric form as well as esterifying (~8%) to some degree with 1-propanol; although these changes do not affect the overall reactivity of the TFA/P solution, they are associated with changes in the spectrum of the solution near the region of measurement, and thus the solution should not be used until these changes are complete. The suitability of the TFA/P solution for use is verified by measuring its absorbance at 1787 cm−1 referenced to a baseline at 1860 cm−1 (A1787/1860 cm−1) and at 1740 cm−1 (
BC calibration standards were prepared by accurately weighing out pure 1-methylimidazole and adding it to a premixed 1:3.333 (v/v) heptane-TFA/P solution. The concentration of 1-methylimidazole in the calibration standards is expressed in mEq base/mL and is termed unit basicity (UB).

where
UB n = unit basicity for nth standard (mEq of base/mL of reagent solution)
W = weight of 1-methylimidazole in nth standard (mg)
V = volume of heptane-TFA/P in nth standard (mL)
MW1-MeIm = molecular weight of 1-methylimidazole (82.11 g/mol)
The standardized protocol devised for sample analysis in either the manual or the autosampler mode consists of weighing ~2.0 g of oil into a 30-mL screw-capped vial, adding 4.5 mL of heptane to dilute the sample, mixing in the diluent by swirling the sample, and then adding 15 mL of the TFA/P reagent solution. The vial is then capped with a septum cap equipped with a Mylar liner and vortexed for 2 s. The prepared samples may then be positioned in autosampler racks and placed in a sonication bath held at 60 °C for 30 min.
FTIR Spectroscopy
The instrument used is a COAT (Continuous Oil Analysis and Treatment) FTIR analyzer (Thermal-Lube, Inc.), which integrates an ABB Bomem WorkIR FTIR spectrometer, an autosampler, and a micro-pump to facilitate automated sample analysis ( Fig. 1 ). This multifunctional analytical system is controlled by a laptop computer (not shown) and can be configured and programmed to carry out quantitative AN, BN, or H2O analysis as well as ASTM CM analyses. 9 The COAT system is controlled by UMPIRE (Universal Method Platform for InfraRed Evaluation), a proprietary software package developed by Thermal-Lube for methodology development and implementation. For the present study, the spectrometer was equipped with a 100-µm CaF2 transmission flow cell.
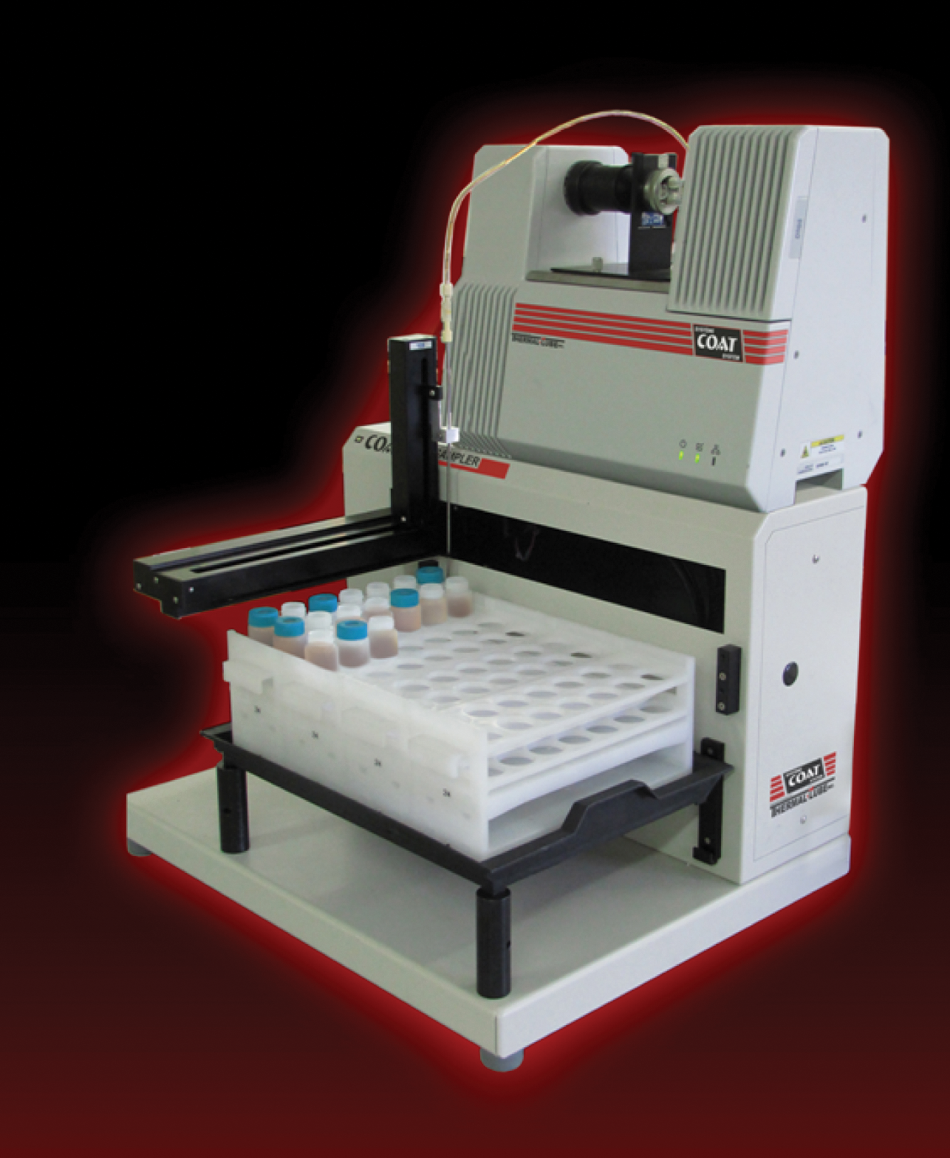
Multifunctional autosampler-equipped Fourier transform infrared (FTIR)–based COAT (Continuous Oil Analysis and Treatment) system used to determine base content, acid content, or H2O in oils as well as carry out American Society for Testing and Materials (ASTM) condition monitoring analyses.
Samples prepared as described above were loaded into the autosampler tray of the COAT system for either manual or automated IR analysis. In the case of automated analysis, the first two vials in the autosampler tray were reserved for the reagent blank (1:3.333 (v/v) heptane-TFA/P), with the reagent blank in the first vial being used to condition the cell prior to collection of the spectrum of the reagent blank from the second vial. For sample spectral collection, ~12 mL of the preprepared 20-mL sample in the vial was manually aspirated or automatically pumped through the cell to wash out the previous sample and then load the cell. All spectra were collected by co-addition of 16 scans at a resolution of 4 cm−1 and ratioed against an open-beam background spectrum.
Calibration and Sample Spectral Data Processing
Because the spectra of calibration standards and samples are processed in an identical manner, the term calibration standard may be substituted by sample in the following; RB refers to the spectrum of the reagent blank, typically composed of 4.5 mL heptane and 15 mL of TFA/P, which is collected at the beginning of each calibration or analytical run. Following measurement of the height of the 1-propanol overtone band at 1936 cm−1 relative to a baseline at 1859 cm−1 (Abs1936/1859 cm−1) in the RB, the same measurement is made in the spectrum of each calibration standard (Cx). Using these two measures, a dilution correction factor (DCF) for each standard is calculated by dividing the value of Abs1936/1859 cm−1 for the RB by that of each respective standard or sample.

where A = Abs1936/1859 cm−1.
Subsequently, the spectrum of each standard is multiplied by its DCF value (to correct for any dilution due to miscibility and/or density changes relative to the reagent solution) and the resulting spectrum saved as a corrected calibration spectrum (Cc x ).

In the case of the calibration standards, the DCF value is effectively 1.0 with negligible variation; however, for samples, the DCF will vary depending on the miscibility of the sample with the reagent solution. The RB is then subtracted from each corrected calibration spectrum (Cc x ) to obtain the differential spectrum Ccd x :

A 5-5 gap-segment second derivative of the differential spectrum (Ccd x ) for each calibration standard is taken and multiplied by 100 to bring the spectral values into a manageable range to produce the final calibration standard spectrum, Cf x . Intensity measurements at 1676 cm−1 are made in these second derivative spectra and plotted against the respective UB values calculated from the weights of 1-MeIm used in preparing the calibration standards. Linear regression is then used to derive the best-fit universal UB calibration equation.
As noted above, sample data processing follows the same procedure. After processing of the 1676 cm−1 intensity measure through the UB calibration equation, the value obtained is multiplied by the volume of reagent solution and divided by the sample weight to obtain the sample BC, expressed as mEq base/g sample. Multiplication of this value by 56.11 (Mw of KOH) converts BC into a “pseudo-BN” value, enabling direct comparisons of the FTIR results with those of ASTM BN methods.
Validation
After substantial experimentation, optimization, and ultimately standardization, the FTIR BC method was used to analyze a wide range of in-service and new engine oils as well as BN additives and P-100 base oil spiked with 1-MeIm. These samples were also analyzed independently by the Hewitt Fluid Analysis Laboratory using ASTM D2896 without disclosure of the values to the other party until all analyses were complete. All FTIR analyses were carried out in duplicate on separate days. Selected samples were also run in duplicate by ASTM D2896 to allow for a direct statistical comparison of the reproducibility of the two methods.
Results and Discussion
FTIR Base Content
As noted in the Introduction, the terms AC and BC have been introduced into our FTIR methodologies to clearly differentiate the results obtained from those provided by the traditional AN and BN methods, with a subscript being appended to denote the pKa of the IR-active base or acid used in the determination of AC and BC, respectively. Accordingly, the measure of basicity in oils in the present work is designated BC0.5, as the IR-active acid employed is TFA (pKa ~0.5). Although TFA is a much stronger acid than aliphatic carboxylic acids (pKa ~4.5) owing to its highly electronegative fluorine atoms, it is many orders of magnitude less acidic than either HCl or HClO4 used in ASTM D4739 3 and D2896, 2 respectively. It may be noted, however, that the original split-sample FTIR BN method, which also used TFA, correlated well with both D4739 and D2896, the correspondence being close to 1:1 in the former but not the latter case. 11 More important, TFA is a sufficiently strong acid to react with metal carbonates, incorporated in overbased detergents to neutralize carboxylic and stronger acids associated with corrosion, and hence the FTIR BC0.5 method does provide the information of consequence for in-service oils.
Calibration Issues
One of the cornerstones of our FTIR methodology is the use of universal (i.e., oil-independent) model calibrations that are simple to implement and are applicable to a wide range of oil samples, Thus, the BC0.5 method is calibrated by relating the unit basicity (UB, expressed as mEq base/mL) of calibration standards consisting of known amounts of a single base added to the TFA reagent solution to the intensity of the ν(COO–) band of trifluoroacetate at 1676 cm−1. Because the calibration is in terms of UB as opposed to BC, it is independent of the sample preparation protocol (i.e., the amount of sample weighed out and the volume of reagent solution added to it); this provides the flexibility to accommodate a wide range of sample BC values and to tailor the calibration and the sample preparation protocol to the range of BC values likely to be encountered in the samples to be analyzed.
In our earlier FTIR BN method, 11 the base employed in the preparation of the calibration standards was dodecylamine (pKa ~10.2), which is somewhat more basic than the metal carbonates incorporated in overbased detergents (pKa of ~9.0), such that it is not necessarily representative of the latter in terms of the extent of reaction with added TFA/P. Accordingly, in the present work, dodecylamine was replaced by the much weaker base 1-methylimidazole (1-MeIm; pKa ~7.5), which was also found to be easier to work with, by virtue of being a liquid at room temperature, and hence produced more consistent calibrations. The question of whether 1-MeIm meets the requirement of reacting fully with TFA in an alcoholic solvent was evaluated spectroscopically by comparing a UB1-MeIm calibration plot with a corresponding plot obtained by addition of standardized KOH to the same reagent solution (for the purposes of this experiment, a solution of TFA in ethanol was employed). The slopes of the linear regression equations for these two plots (equations 5 and 6) were virtually identical, confirming that 1-MeIm reacts fully with TFA.


Reagent Issues
In terms of making the conversion from our original split-sample FTIR BN method to a single-sample method, the original intent was to parallel the approach employed in developing the single-sample AC method. 14 The concept behind the AC method was to use a polar, oil-immiscible solvent (ethanol) to deliver the spectrally active base NaHNCN into an oil sample and facilitate its reaction with the acids present and then allow the oil and solvent phases to separate. Because the AC was determined from the FTIR spectrum of the solvent phase, this approach minimized potentially interfering spectral contributions from the oil. However, in developing the BC method, it was found that the addition of an ethanolic solution of TFA to new oils and additive packages caused the detergents present in these samples to coalesce, gel, or precipitate, preventing consistent quantitative results from being obtained. By replacing ethanol with 1-propanol, these problems were minimized, but inconsistent results were still obtained for concentrated base additives. The BC values determined for the latter exhibited a strong dependence on the weight of sample analyzed, with the values rising as the sample weight decreased, ultimately reaching a steady value. A similar but much more muted effect was observed for P-100 base oil formulated with these additives. This effect was traced to the reagent:sample ratio, with sample viscosity also playing a role. It was found that with the addition of a minimum amount of heptane to such samples prior to TFA/P addition, consistent and reproducible BC values could be obtained. By assessing a variety of sample:heptane:TFA/P ratios, it was found that a ratio of 1:2.25:7.5 (w/v/v) produced reproducible results for samples having BN values of <25 mg KOH/g. For samples having higher BN values, the weight of the sample had to be decreased proportionately or the sample diluted with additive-free mineral oil to ensure no sample weight dependency was observed.
Sample Analytical Issues
Based on extensive testing and optimization, a standardized sample preparation protocol suitable for both the manual and the autosampler mode of analysis was developed, using 2.0 g of sample, 4.5 mL of heptane, and 15 mL of 5% TFA/P, with the reagent solution-sample mixture being held in a sonicating bath for 30 min at 60 °C to ensure the acid-base reaction with TFA/P was complete. A series of calibration standards were subsequently prepared by weighing defined amounts of 1-MeIm and adding a premixed solution of heptane-TFA/P prepared in a 1:3.333 ratio. A plot of the UB values of these standards versus the intensity values (multiplied by 100) measured at 1676 cm−1 in their second derivative spectra ( Fig. 2 ) is presented in Figure 3 and produced the following UB calibration equation:

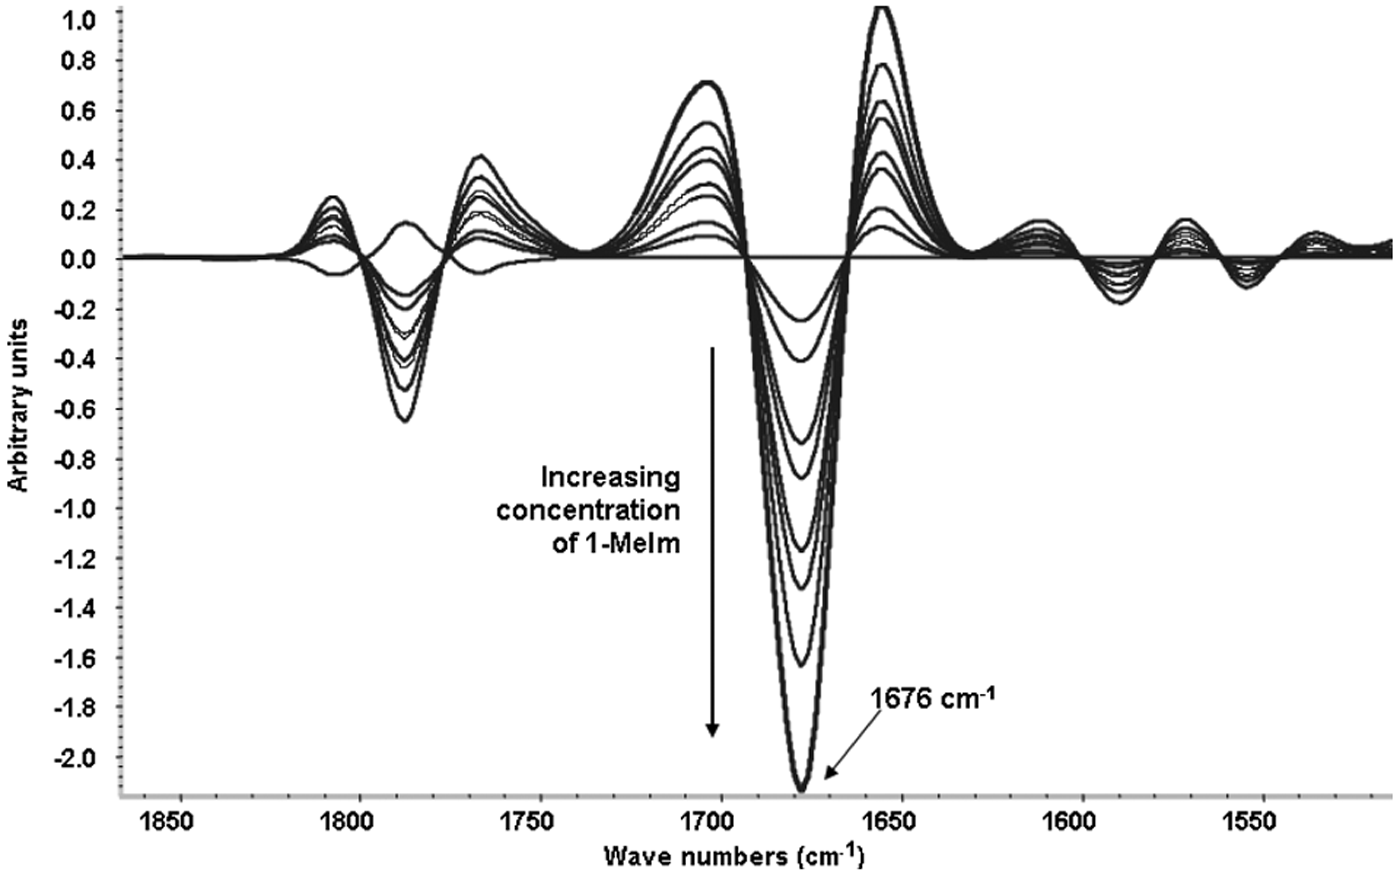
Typical series of second derivative calibration spectra obtained by adding defined amounts of 1-methylimidazole to a 1:3.333 heptane–trifluoroacetic acid in 1-propanol (TFA/P) reagent solution, producing proportionate amounts of the trifluoroacetate anion (νCOO– band at 1676 cm−1).
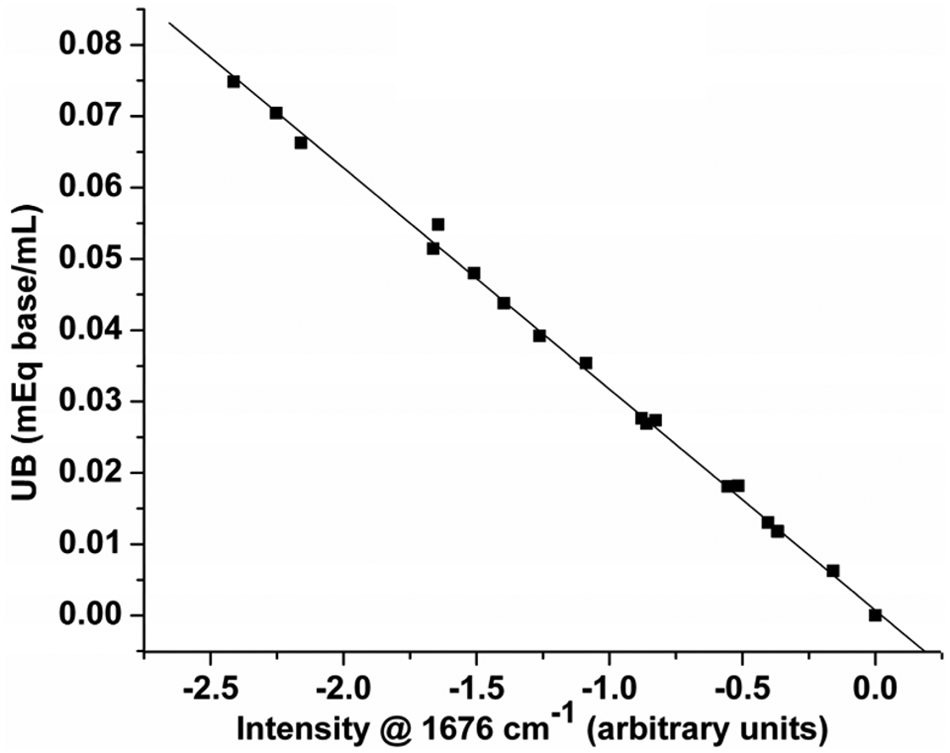
Calibration plot of unit basicity (UB) versus intensity (multiplied by 100) of the trifluoroacetate absorption band at 1676 cm−1 in the second derivative spectra of calibration standards prepared by gravimetric addition of 1-MeIm to 1:3.333 heptane–trifluoroacetic acid in 1-propanol (TFA/P) reagent solution.
This “universal” model calibration is predicated on the assumption that the sample is immiscible with the reagent solution. Accordingly, prior to applying this calibration to determine the UB of the reagent solution after it has been reacted with an oil sample, any dilution of the reagent solution, changes in its density, or displacement effects caused by the sample must be compensated for. Even when using an oil-immiscible reagent solution, as was the case in the AC method, 14 such a correction had to be made to ensure accurate results. Given that the TFA/P reagent solution employed in BC analysis is miscible with most mineral and ester-based oils, this correction becomes much more important. The dilution correction procedure devised is based on comparison of the intensity of an overtone absorption band of 1-propanol at 1936 cm−1 in the “sample” spectrum (i.e., the spectrum of TFA/P solution that has been mixed with the oil sample, the latter having been premixed with heptane as per the sample preparation protocol) with the intensity of this band in the spectrum of the reagent blank (a 1:3.333 heptane-TFA/P mixture). As this band is positioned in a region of the spectrum where few other organic components absorb and is thus rarely interfered with, the ratio of these two measured intensities can be used to accurately calculate a DCF, given that the heptane:TFA/P ratio in the “sample” and the reagent blank is identical. Multiplying the “sample” spectrum by the DCF and then subtracting out the spectrum of the reagent blank produces a spectrum that corresponds to the differential spectrum that would have been obtained in the absence of any dilution effects. This correction makes it valid to apply the UB calibration (equation 7) developed simply by adding 1-Melm to a 1:3.333 heptane-TFA/P mixture. The UB value thus obtained is then multiplied by the volume of heptane + TFA/P used in preparing the sample and divided by the sample weight to determine the sample’s BC (mEq base/g sample) or, if the latter value is multiplied by 56.11, to obtain a corresponding “pseudo-BN” value expressed in mg KOH/g sample.
A second issue arising from the miscibility of most oils with the TFA/P reagent solution is the potential for spectral interferences, which were largely absent in the AC method owing to its use of an oil-immiscible reagent solution. This issue has been addressed in this study through the transformation of all acquired absorbance spectra to second derivative spectra, a form of “mathematical resolution enhancement” in that it sharpens spectral features and hence reduces overlap between adjacent bands. We established that the use of a gap-segment algorithm with a gap of 5 and a segment of 5 was optimal and provided second derivative spectra with superior signal-to-noise ratios as compared to conventional second derivative spectra (computed by the simple first-difference approach). A mathematical treatment of gap-segment derivatives has been presented by Morimoto et al. 15 in relation to its application in near-IR spectroscopy.
Analytical Validation
The performance of the FTIR BC method was assessed using the standardized protocol by analyzing 15 in-service diesel oils, 5 fresh brand-name engine oils, and 2 Lubrizol base additives as well as P-100 formulations thereof. All these samples were prepared and analyzed in duplicate by the FTIR method, with selected samples being also analyzed in duplicate by ASTM D2896. For purposes of comparison with the results of the latter, the BC results were multiplied by 56.11 to convert them to pseudo-BN values. A plot of the duplicate FTIR pseudo-BN results is presented in Figure 4a , and the corresponding linear regression equation relating the day 1 and day 2 (D1 and D2) FTIR data is given in equation (8):

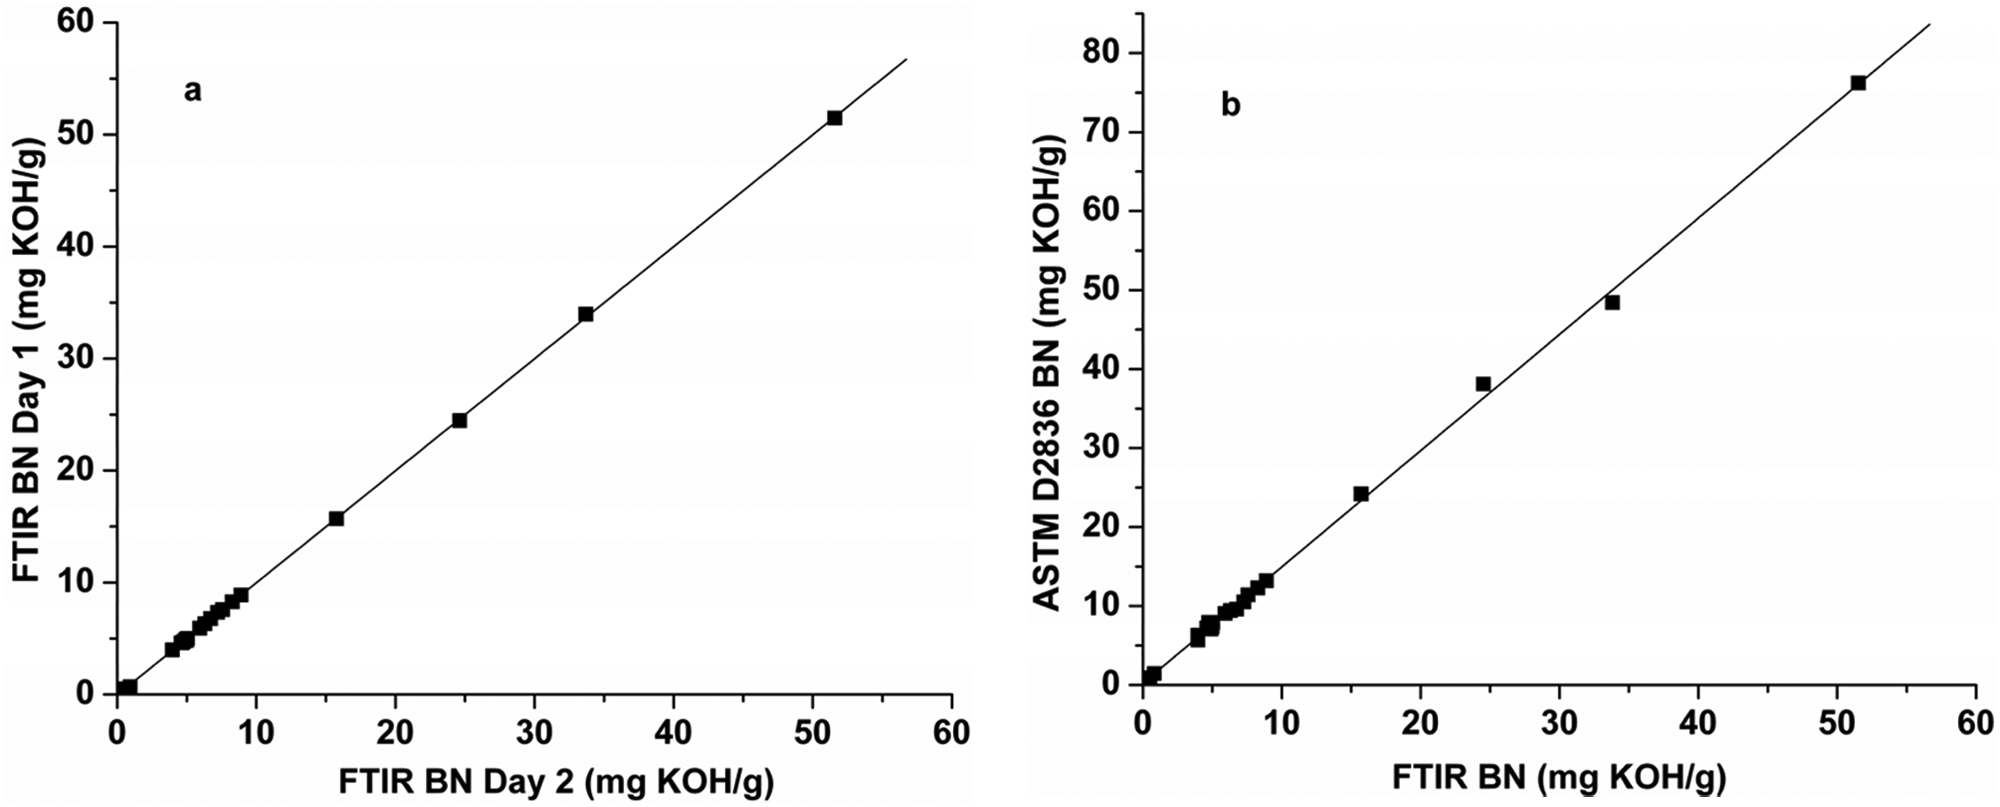
(a) Replicate Fourier transform infrared (FTIR) base content (BN) values obtained for new and in-service oils and additives on different days; (b) direct comparison of the American Society for Testing and Materials (ASTM) D2896 BN values determined for the same samples relative to the corresponding FTIR BN values.
These results indicate that the reproducibility of the FTIR method is excellent, being on the order of ±0.10 mg KOH/g oil, taking into consideration sample preparation, handling, and analysis on separate days. A direct comparison of these FTIR pseudo-BN data with BN data obtained for the same samples by the Hewitt Fluid Analysis Laboratory using ASTM D2896 shows that there is a highly linear relationship between the results of the two methods ( Fig. 4b ). The corresponding regression equations for the full range of BN data (n = 24) and for BN values below 15 mg KOH/g (n = 20) are presented below:

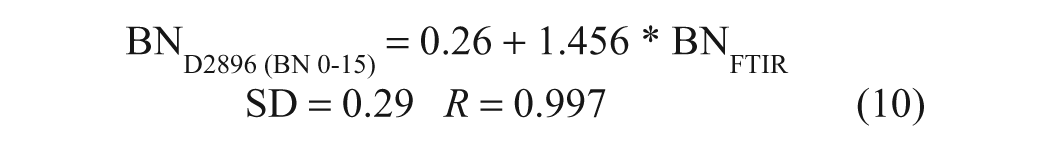
It may be noted from these equations that the pseudo-BN values returned by the FTIR method were ~33% lower than those obtained by ASTM D2896. On the other hand, in the case of a single-base test set consisting of samples prepared by gravimetric addition of 1-MeIm to P-100 base oil, both the FTIR and titrimetric analyses returned the correct BN values to within the experimental error (~±0.10 mg KOH/g oil). Thus, the discrepancies between the FTIR and titrimetric BN values obtained for commercial oil samples may be attributed to the different responses of the two methods to weak bases (e.g., dispersants), given that TFA is a much weaker acid than perchloric acid, whereas the highly linear correlation indicated by equations (9) and (10) implies that the weaker bases not measured by the FTIR method are a relatively consistent component of the oils. To confirm this, a second set of validation samples, consisting of five new brand-name oils and two base additives in P-100, was analyzed by ASTM D974, 4 a colorimetric BN method that uses HCl as the titrant, as well as by ASTM D2896 and the FTIR procedure. As can be seen in Figure 5 , HCl titration yielded results that were intermediate between those obtained by the TFA-based FTIR method and by perchloric acid titration. The equations of the regression lines plotted in Figure 5 , which have been forced through the origin to allow the slopes to be compared, are as follows:
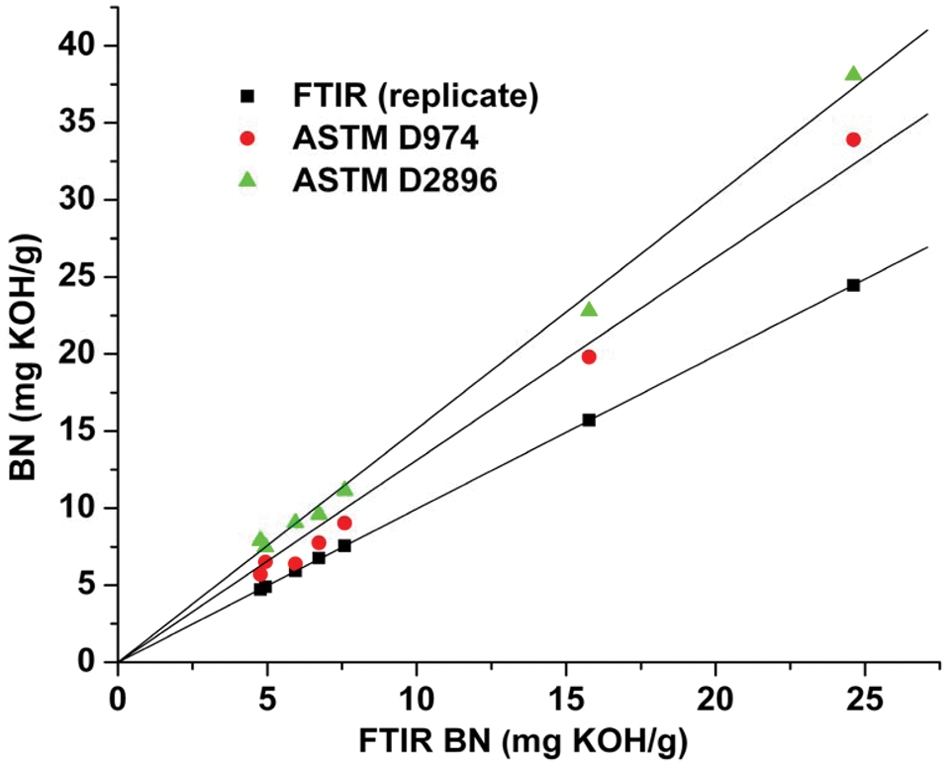
Plot of the base content (BN) values obtained by American Society for Testing and Materials (ASTM) D2896 (means of duplicate analyses) and ASTM D974 against the Fourier transform infrared (FTIR) BN results. The regression lines have been forced through the origin, and the FTIR replicates have been plotted against each other to provide a line of unit slope for illustrative purposes.


Although the FTIR results correlate well with the results of both ASTM methods, the acid strength hierarchy is apparent, with the FTIR BN values being ~66% of the D2896 results and ~76% of the D974 values, clearly indicating that these samples contain both strong and weak bases. Among the bases that may be present in oils, TFA is effectively restricted to reacting with the metal carbonates in overbased detergents, and it is thus somewhat surprising that the FTIR pseudo-BN values correlate so well with the ASTM titrimetric results.
For the purpose of comparing analytical performance, the BN results obtained by ASTM D2896 were divided by the slope of equation (11) to put them on the same scale as the FTIR BN data. Comparison of these adjusted ASTM BN results with the FTIR results in Table 1 indicates that the analytical performance of the two methods is quite similar, with a within-method mean difference (MD) and standard deviation of the differences (SDD) of 0.07 and 0.05 mg KOH/g for the FTIR method as compared to −0.10 and 0.13 mg KOH/g for ASTM D2896. Taking the means of the duplicate analyses, linear regression of the FTIR results against the corresponding D2896 results yielded the following equation:

Comparative BN Data Obtained for Samples Run in Duplicate by Both ASTM D2896 a and the FTIR Base Content Method
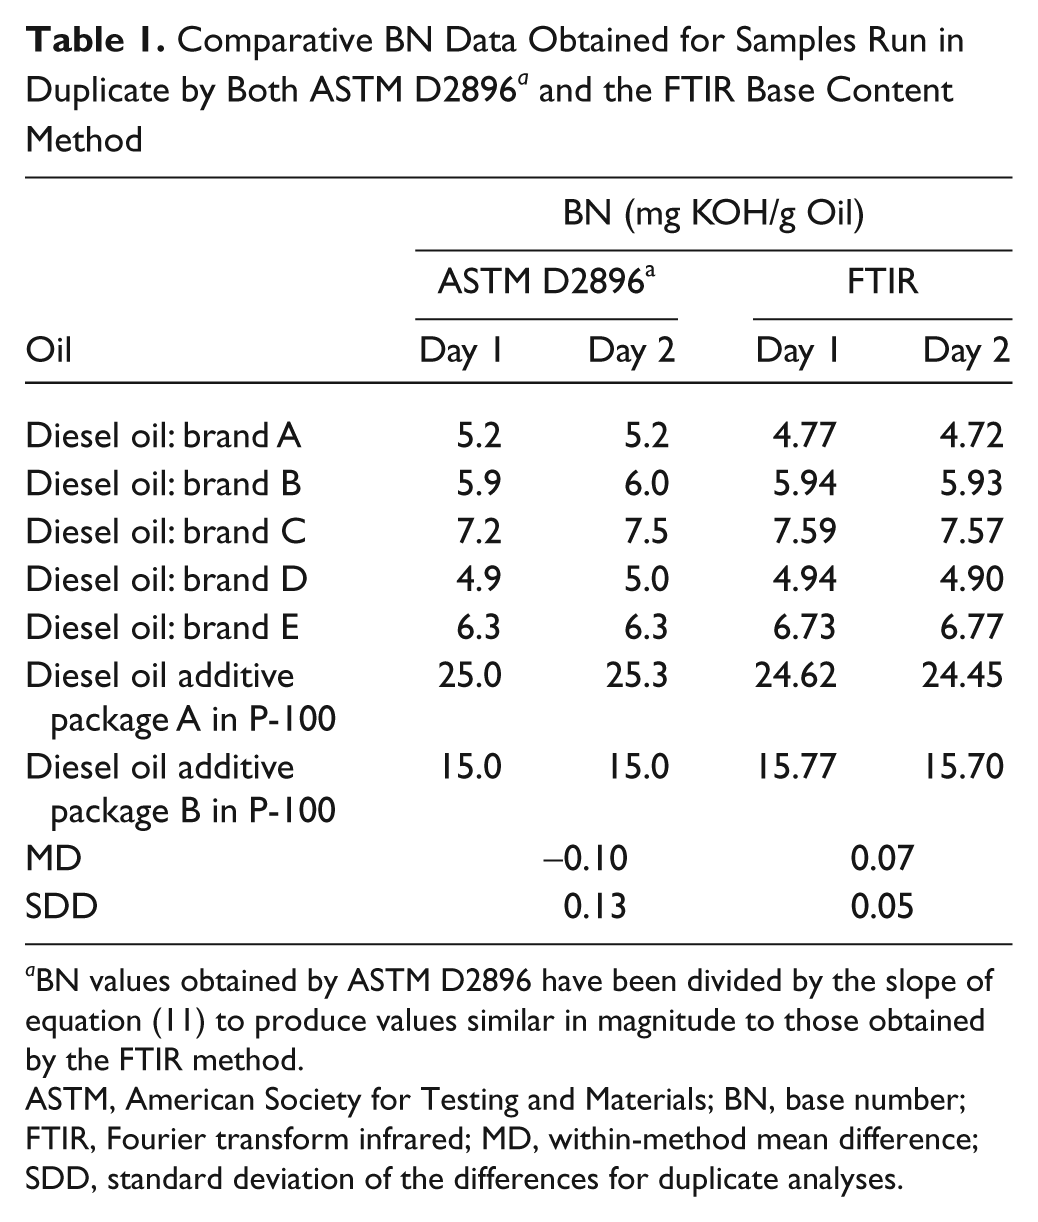
BN values obtained by ASTM D2896 have been divided by the slope of equation (11) to produce values similar in magnitude to those obtained by the FTIR method.
ASTM, American Society for Testing and Materials; BN, base number; FTIR, Fourier transform infrared; MD, within-method mean difference; SDD, standard deviation of the differences for duplicate analyses.
Based on this relationship, the SD relating these two methods is ~±0.50 mg KOH/g over a BN range of 0 to 25 mg KOH/g, corresponding to a coefficient of variation (CV) of ~5%.
Although the above results reinforce the ASTM disclaimer that BN values obtained by different methods are not directly comparable, they also demonstrate that the values obtained by the ASTM and FTIR methods for the samples analyzed in this study are highly correlated and hence become comparable when adjusted by a proportionality factor. The good correlation obtained in this study does not mean that the same proportionality factor will be applicable for all samples, but the indications from this and previous work11,14 are that relatively consistent, workable intermethod proportionality factors can be determined for a wide range of in-service oils. In the case of the single-sample FTIR AC method, 14 the results also correlated well with ASTM AN titrimetric data over a relatively wide AN range (up to 3 mg KOH/g):

The proportionality factor (slope) drifted and the correlation dropped significantly when the regression analysis was limited to AN values of <1 mg KOH/g, the range into which many low-ash lubricants tend to fall:

This effect is, however, simply due to the very narrow range of values and is not pertinent to FTIR BC analyses because BN values in high-ash, detergent-formulated oils span a much wider range (typically, 8–12 mg KOH/g). Similarly, although the reproducibility of FTIR AC or AN results is similar to that of FTIR BC or BN results, the CV of the acidity measurement is inherently higher because the magnitude of the values tends to be much smaller; one exception in this regard may be the AN of crude oils, which contain quite variable and at times high levels of naphthenic acids, 16 broadening the analytical range.
As noted above, the newer single-sample FTIR methods developed present their respective acidity and basicity measures as AC9.5 and BC0.5, expressed as mEq acid/g and mEq base/g, respectively. The rationale for opting for this nomenclature is to clearly differentiate FTIR from ASTM results and to specify the pKa of the reagent used, which effectively defines which species it can react with. NaHNCN and TFA are used in the FTIR AC and BC methodologies, respectively, because they will not react with very weak acids or bases, which are not of any significance in terms of corrosion potential or acid neutralization capability, NaHNCN being a sufficiently strong base to react with organic and stronger acids accumulating in oils and TFA being of sufficient acid strength to react with the metal carbonates that are the predominant bases associated with detergent-formulated lubricants. However, despite the merits of the AC and BC nomenclature, its use in place of AN and BN is unlikely to come about unless the FTIR AC and BC methods are used, develop a credible track record, and are ultimately accepted as ASTM methods. Until that occurs, AC and BC values will likely need to be converted to “method-defined” AN and BN values by calibrating or running them against a designated ASTM method and establishing a relationship similar to those presented in Figure 5 to determine a general empirical “conversion factor” and reexpress the FTIR results accordingly.
Conclusion
As noted earlier, the new FTIR BC method and its AC counterpart 14 are second-generation FTIR methods, building on previous split-sample methods. As these methods now only require the analysis of a single sample, sample preparation is greatly simplified and the speed of analysis is more than doubled. In its current configuration, the COAT system can analyze 120 to 180 preprepared samples/h, at least 10 times the throughput of an autotitrator operating under ideal conditions. 6 Thus, aside from its mainstay ASTM condition monitoring role, 17 FTIR spectroscopy is an efficient means to quantitatively analyze for acid and base content in lubricants as well as moisture. 12 This extended, multifunctional capability, inherent to the COAT system, provides a means of replacing three key problematic ASTM titrimetric procedures (BN, AN, and H2O) and should be of interest to commercial lubricant analysis laboratories that require high analytical throughputs.
List of Abbreviations
AC acid content (mequiv acid/g)
AN acid number (mg KOH/g)
ASTM American Society for Testing and Materials
BC base content (mequiv base/g)
BN base number (mg KOH/g)
CM condition monitoring
COAT Continuous Oil Analysis and Treatment
DCF dilution correction factor
FTIR Fourier transform infrared
1-MeIm 1-methylimidazole
RB reagent blank
TFA trifluoroacetic acid
TFA/P 5% solution of trifluoroacetic acid in 1-propanol
UB unit basicity (mEq of base/mL of reagent solution)
Footnotes
The authors declared no potential conflicts of interest with respect to the research, authorship, and/or publication of this article.
The authors disclosed receipt of the following financial support for the research and/or authorship of this article: A portion of this research was supported by the Natural Sciences and Engineering Research Council of Canada (NSERC).