
Abstract
Cell-based drug absorption assays, such as Caco-2 and MDCK-MDR1, are an essential component of lead compound ADME/Tox testing. The permeability and transport data they provide can determine whether a compound continues in the drug discovery process. Current methods typically incorporate 24-well microplates and are performed manually. Yet the need to generate absorption data earlier in the drug discovery process, on an increasing number of compounds, is driving the use of higher density plates. A simple, more efficient process that incorporates 96-well permeable supports and proper instrumentation in an automated process provides more reproducible data compared to manual methods. Here we demonstrate the ability to perform drug permeability and transport assays using Caco-2 or MDCKII-MDR1 cells. The assay procedure was automated in a 96-well format, including cell seeding, media and buffer exchanges, compound dispense, and sample removal using simple robotic instrumentation. Cell monolayer integrity was confirmed via transepithelial electrical resistance and Lucifer yellow measurements. Proper cell function was validated by analyzing apical-to-basolateral and basolateral-to-apical movement of rhodamine 123, a known P-glycoprotein substrate. Apparent permeability and efflux data demonstrate how the automated procedure provides a less variable method than manual processing, and delivers a more accurate assessment of a compound’s absorption characteristics.
Keywords
Introduction
In vitro drug absorption assays play an important early role in determining how orally administered compounds are absorbed through the intestinal lining into the bloodstream. Therefore, the performance of these assays is essential to help determine the ADME/Tox profile of a new drug entity (NDE). Cell-based assays, using cells grown in monolayers on plastic permeable supports such as polycarbonate or polyester, are generally chosen as primary absorption screening tools to determine the permeability and transport characteristics of the compound. 1 The first cells to be used were taken from human colorectal adenocarcinoma (Caco-2) cells. This model has been widely used since the 1990s 2 because they propagate indefinitely in culture and possess many structural and functional similarities to normal human enterocytes, and Caco-2 permeability has generally correlated well with Fa values for many drugs in humans, 1 with Fa defined as the drug fraction taken up by humans into the intestinal tissue by any mechanistic pathway. 3 Numerous examples of successful application of Caco-2 cell monolayers for the prediction of, or correlation with, human absorption exist.4,5 One disadvantage, however, of using Caco-2 cells for drug absorption studies is that the cultures take 21 to 28 days to reach confluency. 6 It has also been shown that it takes 17 to 27 days for P-gp to become fully functional. 7 Therefore, a second model for drug absorption studies has been developed. These cells, Madin-Darby canine kidney (MDCK) cells, have been isolated from canine renal epithelia. When grown on membranes in a monolayer format, the cells differentiate into columnar epithelium and form tight junctions in a shorter time period than Caco-2 cells (3 days vs 21 days).8,9 MDCK-MDR1 cells also display interpassage homogeneity and a high human P-glycoprotein (P-gp) expression level.10,11 Initial studies comparing MDCK-MDR1 cells to Caco-2 cells have demonstrated a high correlation in permeation of passively absorbed drugs, indicating that they may also be used as a drug absorption model in vivo. 9 Although later reports repute some of the original findings regarding comparisons with Caco-2 drug absorption values, MDCK-MDR1 cells are still widely used and accepted as models to assess drug transport by P-gp.
Typically, cell-based drug absorption assays have been performed in 12- or 24-well plates.1,12 However, because ADME/Tox testing is now moving further upstream in the drug discovery process, more lead compounds are being tested in an effort to fail NDEs with negative profiles earlier and in a more cost-effective manner. 13 To meet the demands for higher throughput and reduced processing time, higher density plates have been produced using a 96-well format. These plates are then tested to determine whether the data produced in smaller wells, using fewer cells, would compare to data previously produced using lower well density plates. The new higher throughput plate format has been shown in multiple instances to give similar results to that generated in a 12- or 24-well format using manual methods.14,15 At the same time, automated platforms have been tested to determine their ability to be used to run the Caco-2 or MDCK-MDR1 assay procedures. Soikkeli et al. 16 and Kellard and Engelstein 17 separately demonstrated the ability to automate Caco-2 and MDCK-MDR1 assays using a Tecan Genesis system, but not the cell processing steps, as these could not be performed in a sterile format because of the size of the instrument. Saunders 14 was able to perform the cell processing steps using a Biomek liquid handling system from Beckman-Coulter but stated that “the disadvantages of this method are the fairly complex process of automation and high-throughput.” The systems mentioned above were able to help improve the general procedure for this type of assay but still leave difficult issues to deal with, such as sterility, containment, and ease of use.
To alleviate these concerns, we present here a novel automated drug transport assay using either Caco-2 or MDCKII-MDR1 cells in 96-well high-throughput screening (HTS) Transwell Permeable Supports (Transwell plates; Corning Incorporated, Corning, NY). The entire assay process was automated, including cell dispensing, media and buffer exchanges, and compound addition and removal using simple yet robust robotic instrumentation to ease the “pain points” of the assay and create a more robust procedure. Each instrument can easily be placed into existing laminar flow hoods to ensure sterility during the entire assay process. A two-part permeable support system, incorporating an insert plate and receiver plate, was used so that manipulations could be performed without the need to separate the system’s parts. Metrics used to validate cell dispensing and media and buffer exchanges included transepithelial electrical resistance (TEER) and Lucifer yellow (LY) permeability. Proper cell function was validated by analyzing movement of the known P-gp substrate rhodamine 123 (Rh123) from the apical-to-basolateral (A-to-B) and basolateral-to-apical (B-to-A) compartments of each assay well. Rhodamine 123 was also run in the Caco-2 assay in the presence of cyclosporin A to illustrate the automated assay’s ability to assess inhibition of the adenosine triphosphate (ATP)–dependent drug efflux pump. The MDCKII-MDR1 automated method was performed in parallel to the manual method for comparison. Following the initial validation, the Caco-2 assay was then performed using the automated process only. The data show that the automated assay is able to deliver results that are more reproducible than manual processing, in addition to reducing operator time and the overall experiment time. Data from cyclosporin A also agree with existing literature references, illustrating the assay’s utility for inhibitor screening.
Materials and Methods
Materials
Lucifer yellow (catalog L0144), rhodamine 123 (catalog R8004), and cyclosporin A (catalog C3662) were purchased from Sigma-Aldrich Company (St. Louis, MO). Iscove’s modified Dulbecco’s medium (IMDM) (catalog 12240-046), fetal bovine serum (FBS) (catalog 10099-141), penicillin-streptomycin liquid (catalog 15140-148), Dulbecco’s phosphate-buffered saline (DPBS) (catalog 14190-136), and 0.05% trypsin-EDTA (catalog 25300-054) were purchased from Invitrogen Corporation (Carlsbad, CA). Antibiotic-antimycotic solution (catalog 30-004-CI) and Hank’s buffered salt solution (HBSS) with calcium and magnesium (catalog 21-023-CM) were purchased from Mediatech, Inc. (Manassas, VA). The 75-cm2 rectangular canted neck cell culture (T75) flasks (catalog 430641), 96-well clear round-bottom polypropylene (PP) plates (catalog 3359), and 96-well half-area black flat-bottom polystyrene plates (catalog 3694) were attained from Corning Life Sciences. Twelve-column partitioned polypropylene pyramid-bottom reservoirs (catalog S30019) were purchased from Seahorse Bioscience (North Billerica, MA). The EVOM epithelial volt-ohm meter for TEER measurements was purchased from World Precision Instruments (Sarasota, FL). Human colon adenocarcinoma (Caco-2) cells (catalog 86010202) were purchased from Sigma-Aldrich. MDCKII-MDR1 cells were attained through a generous gift from Dr. Piet Borst (Netherlands Cancer Institute, Amsterdam, the Netherlands).
Transwell Permeable Supports
HTS Transwell-96 0.4-µm pore polycarbonate membrane (catalog 3391) and HTS Transwell-96 1.0-µm pore polyester membrane (catalog 3392) permeable supports were donated by Corning Life Sciences. The 0.4- and 1.0-µm pore sizes are used in this application to inhibit cell migration into and through the pores. If the pore size is too large, the monolayer may be compromised, thus affecting data quality. The two formats used here represent pore sizes commonly used for these types of assays.
Liquid Handling
An EL406 Combination Washer Dispenser from BioTek Instruments, Inc. (Winooski, VT) was used to dispense cells, perform media and buffer exchanges and removal, and dispense reagents to the Transwell plates ( Fig. 1A ). The instrument contains a 96-tube wash manifold, a peristaltic pump, and two syringe pumps for dispensing. The peristaltic pump was used to dispense cells, media, and buffer, whereas the wash manifold was used to aspirate media and buffer from the apical and basolateral chambers of the Transwell plates. The two syringe pumps were used to dispense LY, Rh123, and cyclosporin A to the same plates.
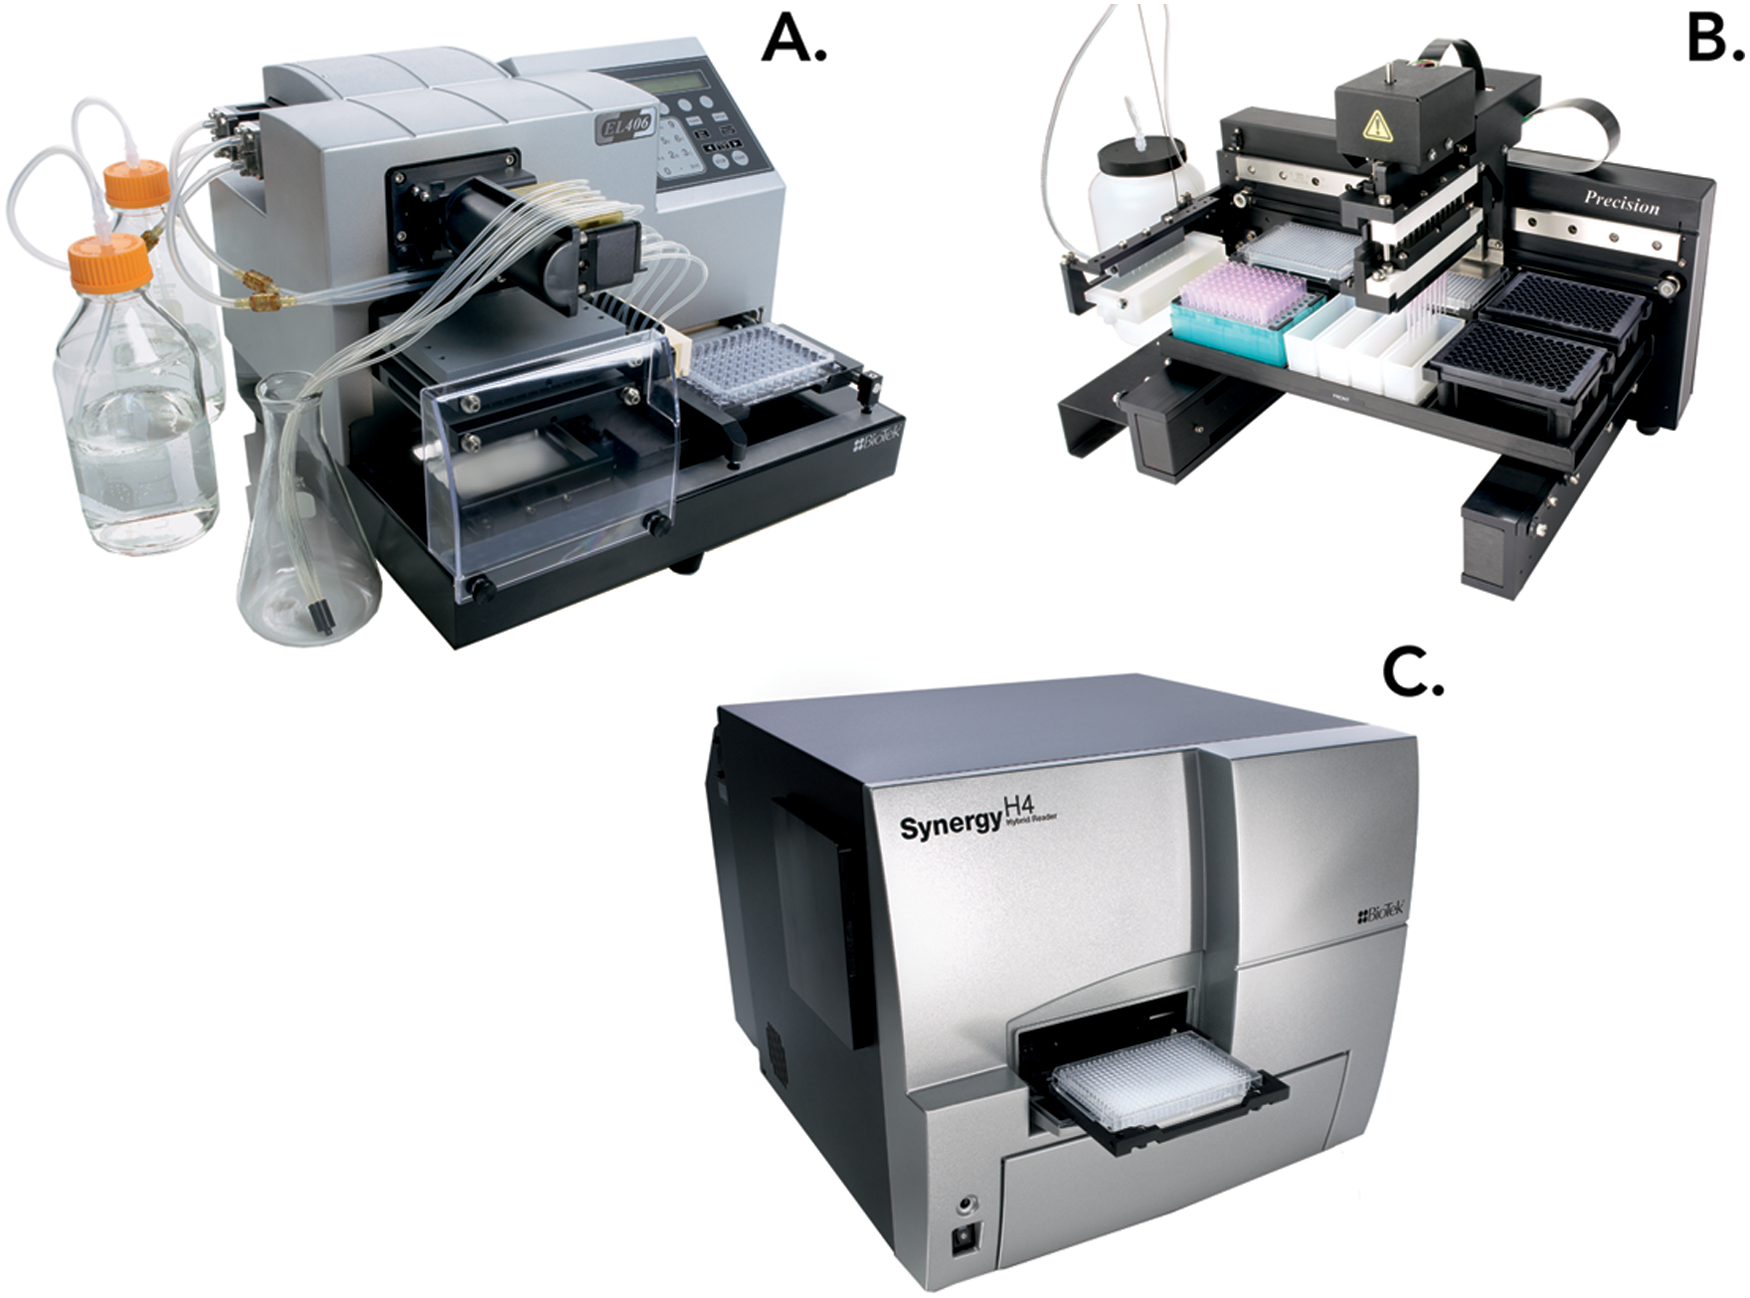
BioTek instrumentation. (A) The EL406 was used to dispense cells, perform media and buffer exchanges and removal, and dispense reagents to the Transwell plates. (B) The Precision was used for transfer and dilution of initial and final samples from the Transwell plates to the black 96-well plates used for analysis. (C) The Synergy H4 was used to quantify the fluorescent signal from each assay plate well.
The Precision Microplate Pipetting System from BioTek Instruments was used for transfer and dilution of initial and final samples from the Transwell plates to the black 96-well plates used for analysis ( Fig. 1B ).
Fluorescent Signal Detection
All assay plates were read using a Synergy H4 Hybrid Multi-Mode Microplate Reader from BioTek Instruments ( Fig. 1C ). The fluorescent mode was used to measure the LY signal using a 485/20-nm excitation filter, a 530/25-nm emission filter, and a 510-nm cutoff dichroic mirror, as well as the Rh123 signal using a 530/25-nm excitation filter, a 590/35-nm emission filter, and a 550-nm cutoff dichroic mirror.
Methods
Cell Preparation
MDCKII-MDR1 and Caco-2 cells were cultured in T75 flasks to between passage 15 to 25. Cell stocks were maintained in IMDM containing L-glutamine (4 mM), HEPES buffer (25 mM), and sodium bicarbonate (3.024 g/L). The media were supplemented with 10% FBS and 1% penicillin/streptomycin (100 U/mL penicillin G sodium/100 µg/mL streptomycin sulfate final concentration). Media were replaced two to three times per week, and monolayers were subcultured when reaching 60% to 80% confluence using trypsin-EDTA, following an initial rinse with DPBS. At the plating time, cells were removed from the flask and diluted to 1.5 × 10⁵ viable cells/mL and 5.6 × 10⁴ viable cells/mL for MDCKII-MDR1 and Caco-2 cells, respectively. A volume of 100 µL/well of cells was plated into the apical compartment of the Transwell plates ( Fig. 2 ), whereas a volume of 220 µL/well of media was plated into the basolateral compartment of the same plate. All Transwell plates were then incubated in a 37 °C/5% CO2 tissue culture incubator. After 4 days, media were removed from both Transwell plate compartments containing MDCKII-MDR1 cells, and an equal volume of fresh IMDM was then added back to each plate. The same process was followed with plates containing Caco-2 cells every 2 to 3 days for 21 days.
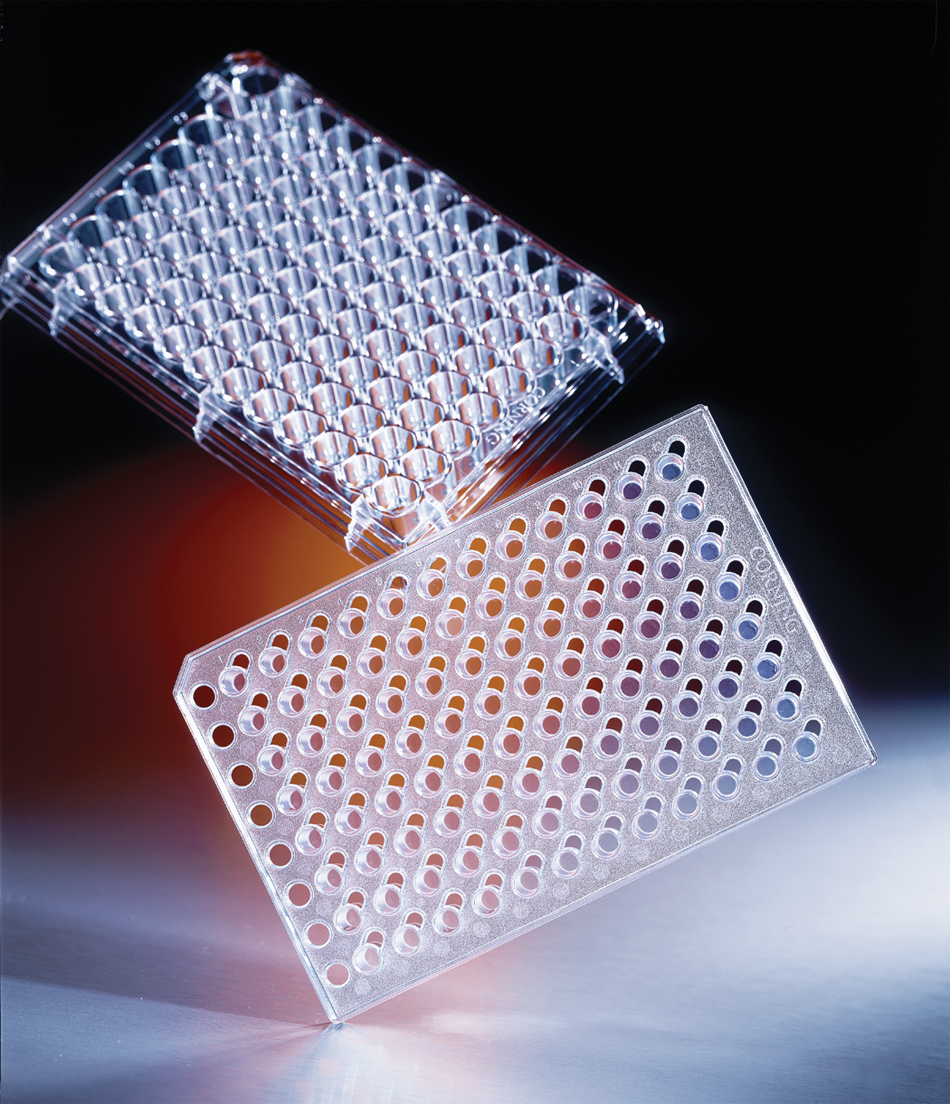
High-throughput screening Transwell Permeable Support. The 96-well insert and receiver plates are shown. A basolateral access port allows processing of the apical and basolateral chamber without separating the two plates during the assay procedure.
Compounds
All compounds were reconstituted in 100% DMSO. LY was prepared at a concentration of 6 mM, Rh123 was prepared at a concentration of 5 mM, and cyclosporin A was prepared at a concentration of 1 mM. Each compound was manually diluted 1:100 in HBSS buffer to final concentrations of 60 µM, 50 µM, and 10 µM for LY, Rh123, and cyclosporin A, respectively. The final concentration of DMSO was 1.0% for each final preparation. A portion of 60 µM LY and 50 µM Rh 123 was then titrated in HBSS buffer plus 1% DMSO to create the standard curves that would be used to assess compound permeability. A 10-point titration scheme was created for each compound, including a no-compound point, using 1:3 dilutions.
Data Analysis
Raw TEER values were determined with use of the EVOM epithelial volt-ohm meter and expressed as millivolts (mV). The average TEER value for the blank wells, containing membrane only (no cells), was then calculated. Final TEER values were computed using the following formula: TEERFinal = (Resistance – BLK) × (SA × 1000), where Resistance equals the measured resistance value, BLK equals the average TEER value of the blank wells, SA equals the membrane surface area (0.143 cm2), and 1000 equals the conversion between mV and ohms (Ω), where 1000 mV = 1 Ω. Final calculated TEER values were expressed as Ω × cm2.
The compound concentration in the initial samples (Ci) taken before the incubation period was determined with LY or Rh123 standard curves previously mentioned. A linear regression was performed on the standard curve data that were plotted to determine the slope and Y-intercept of each line. These values were then used to interpolate the compound concentration using the following formula: Ci = 125 × [(SStd × FlIS) + IStd], where Ci equals the initial sample concentration, SStd equals the slope of the standard curve, FlIS equals the initial sample fluorescence value, and IStd equals the Y-intercept of the standard curve. The value is multiplied by 125 to account for the 1:125 dilution of the compound performed during the removal of the initial samples.
The compound concentration in the final samples (Cf) taken after the incubation period (60 min) was also determined with the use of the LY or Rh123 standard curves. The formulas used for this interpolation are as follows: (1) Cf = [(SStd × FlFS) + IStd] or (2) Cf = 10 × [(SStd × FlFS) + IStd], where Cf equals the final sample concentration, and FlFS equals the final sample fluorescence value. Formula 1 is applied to final samples taken from wells containing cells, whereas formula 2 is applied to final samples taken from control wells containing no cells.
Apparent permeability (Papp) values were calculated using the Ci values taken from the apical chamber in LY and Rh123 A-to-B studies or from the basolateral chamber in Rh123 B-to-A studies; the Cf values were taken from the appropriate opposite chamber following the incubation period. The value is expressed in nm/s and is computed using the following formula: Papp(nm/s) = (10 000 000 × V × Cf)/(SA × Ci × T), where V equals the receiver chamber volume (in milliliters; 0.1 mL for the apical chamber and 0.23 mL for the basolateral chamber), Cf equals the compound concentration in the final sample, SA equals the membrane surface area (previously mentioned), Ci equals the compound concentration in the initial sample, T equals the assay incubation time in seconds, and 10 000 000 equals the conversion between cm and nm to arrive at the final unit (nm/s).
Average and standard deviation were then determined from the Papp values in each replicate set (n = 40) of the conditions tested (LY A-to-B: MDCKII-MDR1 and Caco-2; Rh123 A-to-B: MDCKII-MDR1 and Caco-2; Rh123 B-to-A: MDCKII-MDR1 and Caco-2; Rh123 B-to-A with the apical chamber containing 10 µM cyclosporin A: Caco-2 only). Rhodamine 123 efflux values were then determined using the following formula: AvgPapp(B→A)/AvgPapp(A→B).
Automated Workflow
Assay Setup
Table 1 describes the general automated protocol for the drug transport assay. A Medium Volume (5 µL) Cassette with molded plastic tips (catalog 7170011; BioTek) was used with the peristaltic pump on the EL406 Combination Washer Dispenser to dispense the cells, media, and buffer. Labcon 50-µL Robotic Tips: Sterile, low retention (catalog 98250; BioTek) were used for Ci and Cf transfer and dilution from the Transwell plates to the 96-well half-area black flat-bottom polystyrene plates. Ci intermediate dilutions were carried out in 96-well clear, round-bottom, polypropylene plates. MDCKII-MDR1 and Caco-2 cells were plated in 0.4-µm pore polycarbonate membrane or 1.0-µm pore polyester membrane Transwell plates.
Automated Cell-Based Drug Transport Assay Protocol
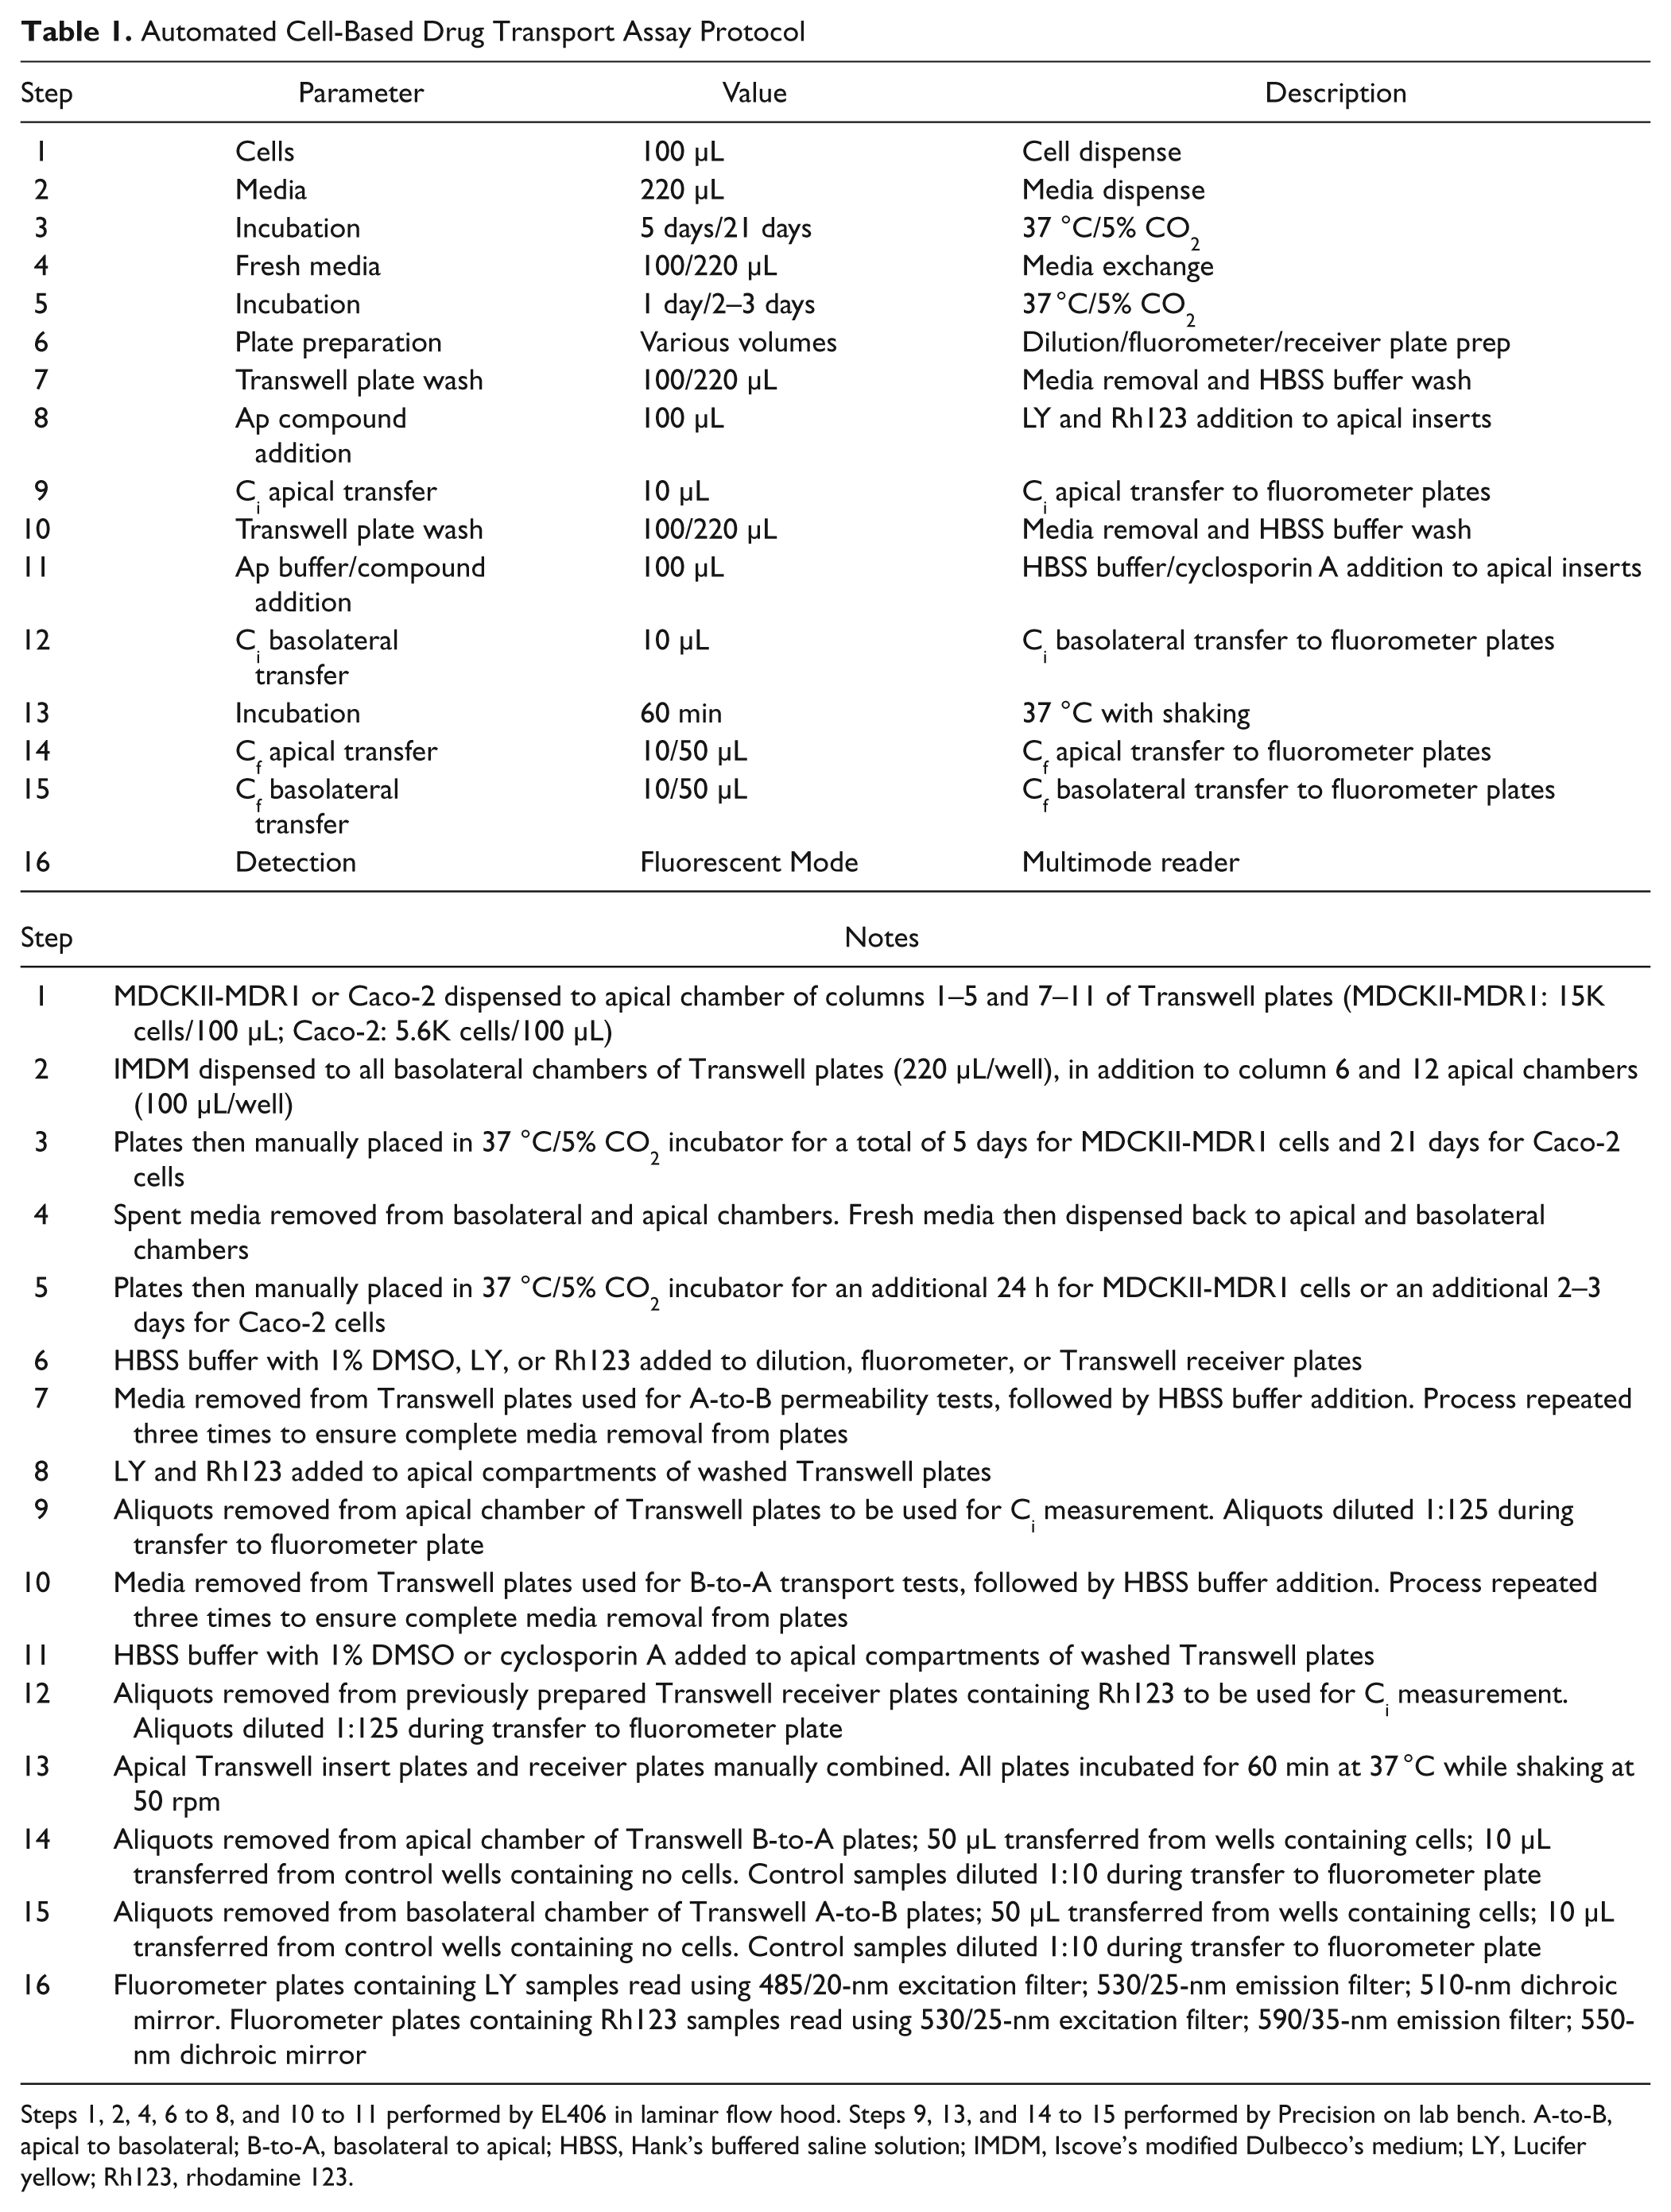
Steps 1, 2, 4, 6 to 8, and 10 to 11 performed by EL406 in laminar flow hood. Steps 9, 13, and 14 to 15 performed by Precision on lab bench. A-to-B, apical to basolateral; B-to-A, basolateral to apical; HBSS, Hank’s buffered saline solution; IMDM, Iscove’s modified Dulbecco’s medium; LY, Lucifer yellow; Rh123, rhodamine 123.
Control well cells and media were dispensed at 100 µL to apical wells, whereas 220 µL media was dispensed to all basolateral wells. HBSS buffer with 1% DMSO was dispensed at 240 µL to the 96-well polypropylene round-bottom plates used for the Ci intermediate dilution, 40 µL to the 96-well half-area black flat-bottom polystyrene plate used for the final Ci dilution and fluorescent signal quantification, and 230 µL to the basolateral receiver plate wells for all plates having LY or Rh123 added to the apical wells. Lucifer yellow and Rh123 were dispensed at 100 µL to the apical compartment of Transwell plates used to assess LY and Rh123 A-to-B permeability. Rhodamine 123 was dispensed at 230 µL to the basolateral compartment of Transwell plates used to assess Rh123 B-to-A transport. Cyclosporin A was dispensed at 100 µL into the apical compartment of Transwell plates used to assess the inhibition of Rh123 B-to-A transport. Each assay’s incubation time, used to allow compounds to permeate or be transported across the cell membrane, was 60 min. All assay plates were orbitally shaken at 50 rpm during the 60-min incubation period to ensure consistent compound availability to the cell membrane during the incubation period, thus increasing consistency among replicates.
Automated Compound Permeability/Transport Assay Validation
MDCKII-MDR1 or Caco-2 cells were dispensed into the 0.4- and 1.0-µm 96-well Transwell plates using the EL406 Combination Washer Dispenser as previously described. MDCKII-MDR1 cells were also dispensed manually into the same plate formats. Cells were dispensed to columns 1 to 5 and 7 to 11, whereas an equal media volume was dispensed to columns 6 and 12. The remainder of the automated assay was performed as previously described in Table 1 . Using this configuration, 40 replicates of each condition were tested per experiment. The assay for each cell type was repeated on separate days using independently dispensed cells.
Results
To ensure that the instrumentation is able to properly dispense cells and perform media and buffer exchanges without disturbing the cell layer, it is necessary to validate the automated assay procedure. This may be done using two methods. Transepithelial electrical resistance may be used to measure cell membrane integrity by monitoring the membrane resistance during measurement. The second method uses a compound that shows limited permeability through the cell membrane being examined. Only in the presence of nonintact monolayers will the compound move from one chamber to the other in the Transwell plate. Once the initial validation criteria have been met, it is then possible to assess compound permeability and transport.
Transepithelial Electrical Resistance Validation
Mean and standard deviation values were computed from the calculated TEER values among the 120 replicate wells tested in the MDCK assay and the 160 replicate wells tested in the Caco-2 assay. The same was also computed for the 24 control wells included in the MDCK assay and the 32 control wells included in the Caco-2 assay. Table 2 shows that 1.5 × 10⁵ MDCKII-MDR1 cells grew into a confluent cell monolayer over 5 days and exhibited TEER values >75 Ω × cm2 when grown on 0.4-µm membranes and >120 Ω × cm2 when grown on 1.0-µm membranes. This compared to average TEER values ranging from 0 to 5 Ω × cm2 from control wells containing no cells. Confluent cell layers form a barrier between the apical and basolateral chambers of each well. This barrier creates a greater resistance to the electrical current being applied across the two chambers by the volt-ohm meter. Wells containing membrane only (no cell monolayer) do not possess this barrier. Therefore, little or no resistance is generated to the applied current, leading to TEER values of approximately 0 Ω × cm2. TEER values for wells containing robotically dispensed cells were approximately the same or slightly higher (µ ≈ 82:0.4 µm and µ ≈ 177:1.0 µm) when compared to wells containing manually dispensed cells (µ ≈ 77:0.4 µm and µ ≈ 137:1.0 µm). Standard deviations were also equivalent between the two methods.
MDCKII-MDR1 Transepithelial Electrical Resistance Assessment Statistical Parameters (Ω × cm2)
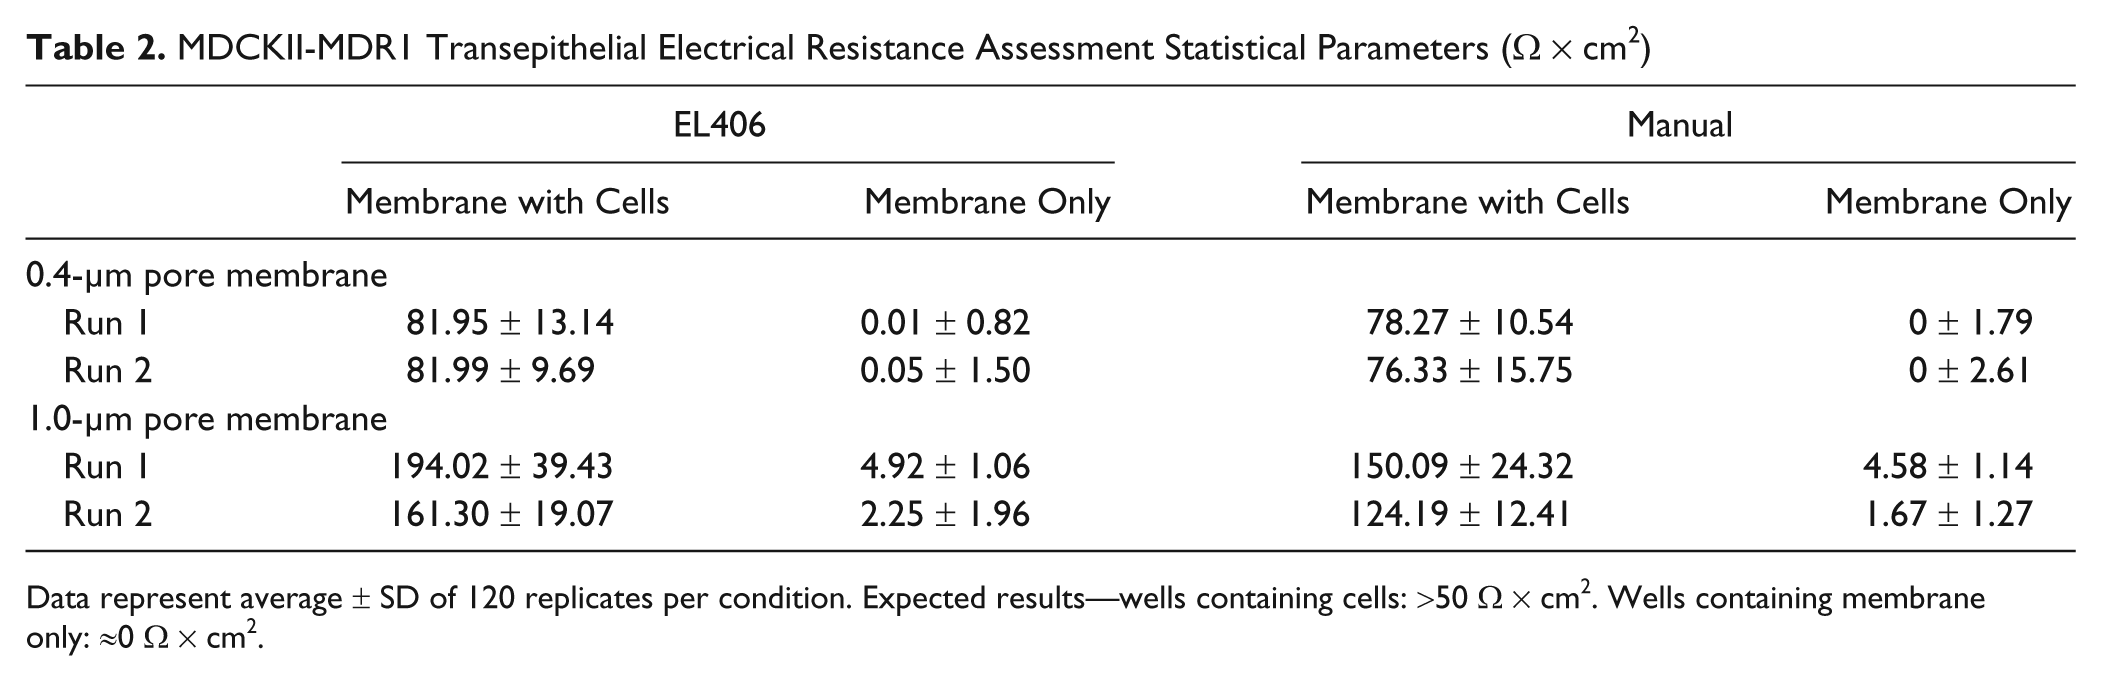
Data represent average ± SD of 120 replicates per condition. Expected results—wells containing cells: >50 Ω × cm2. Wells containing membrane only: ≈0 Ω × cm2.
Table 3 shows that 5.6 × 10⁴ Caco-2 cells grew into a confluent cell monolayer over 21 days and exhibited TEER values >1300 Ω × cm2 when grown on 0.4-µm membranes and >950 Ω × cm2 when grown on 1.0-µm membranes. This compared to average TEER values ranging from 0 to 35 Ω × cm2 from control wells containing no cells. The significant increase in TEER values, when compared to control wells, indicates that relatively tight junctions have formed within each cell monolayer. 18 How tight and intact these junctions were at the end of the assay procedure was further validated through the use of the LY compound.
Caco-2 Transepithelial Electrical Resistance Assessment Statistical Parameters (Ω × cm2)
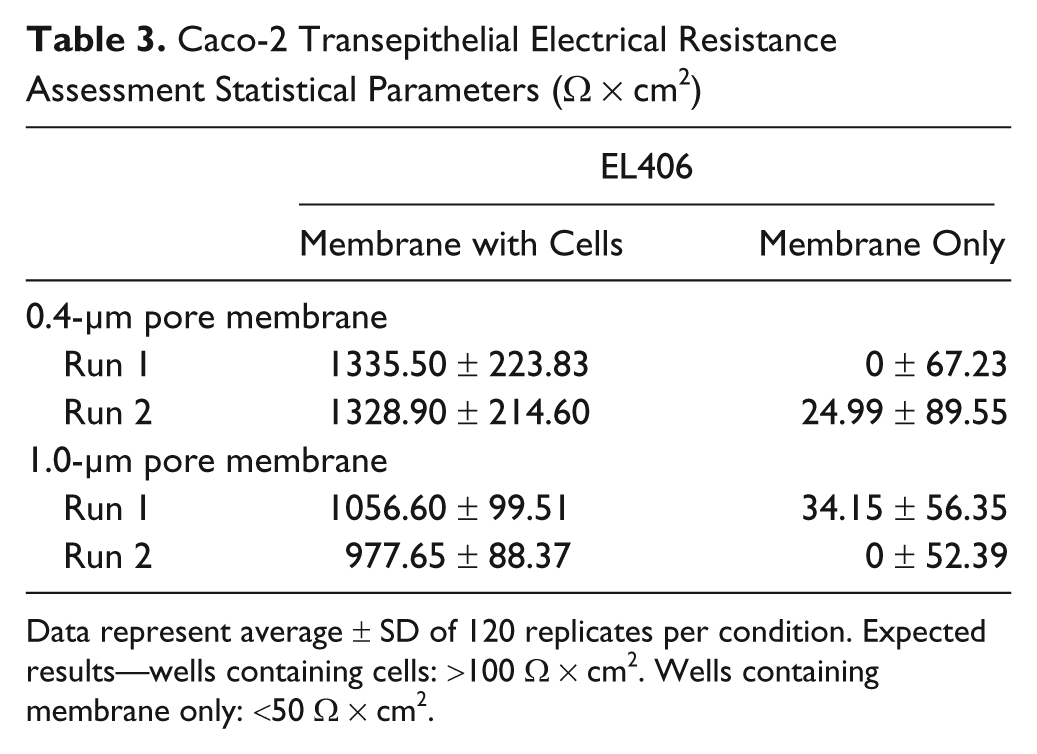
Data represent average ± SD of 120 replicates per condition. Expected results—wells containing cells: >100 Ω × cm2. Wells containing membrane only: <50 Ω × cm2.
Lucifer Yellow Validation
Lucifer yellow was used to further validate the cell monolayer integrity, as well as the cell junction solidity. Papp values were determined for LY with 0.4-µm and 1.0-µm membrane Transwell plates containing either MDCKII-MDR1 or Caco-2 cells, processed robotically. The same was done with manually processed 0.4-µm and 1.0-µm membrane Transwell plates containing MDCKII-MDR1 cells. Average and standard deviation were calculated from each Papp value set for each condition tested. Table 4 represents the results from each data set. Robotically processed plates exhibited average Papp values across both runs ranging from 1.4 to 1.6 nm/s (MDCK) and 0.8 to 0.94 nm/s (Caco-2). This contrasted to Papp values that were 5 to 13 times higher for manually processed MDCKII plates (7.7–10.3 nm/s). Standard deviations for plates processed using the automated procedure (0.7–1.0 [MDCK] and 1.3–2.1 [Caco-2]) were also lower when compared to MDCK plates processed using the manual method (3.5–6.8).
Lucifer Yellow Validation Apparent Permeability Statistical Parameters (nm/s)
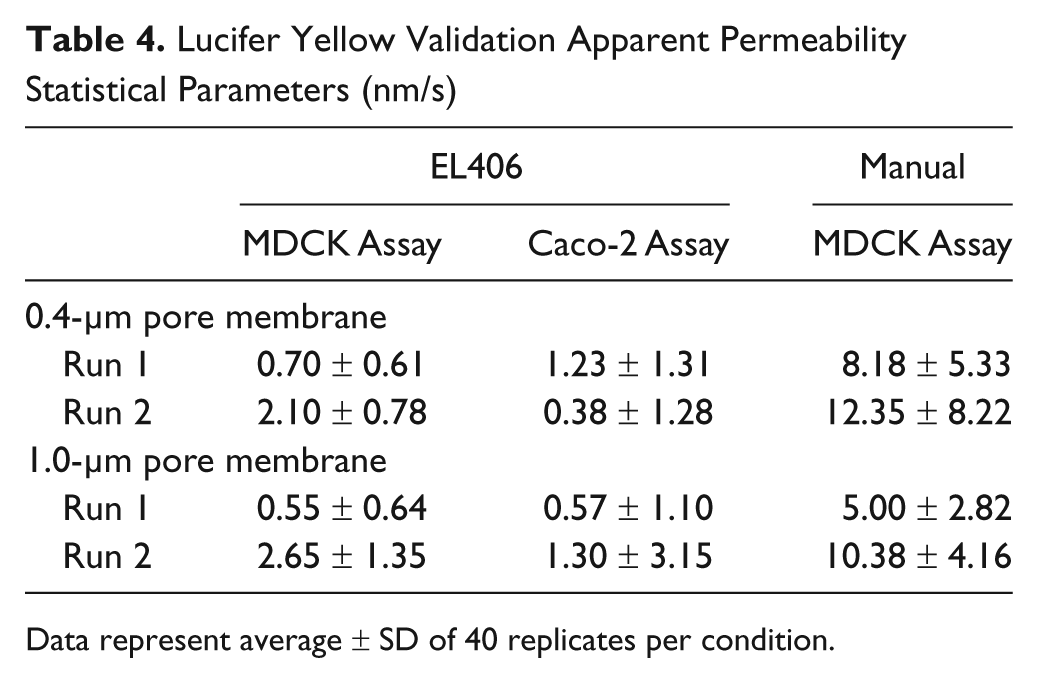
Data represent average ± SD of 40 replicates per condition.
Rhodamine 123 Permeability/Transport Assessment
Proper cell function was confirmed through the use of Rh123. Rh123 Papp was determined for both A-to-B and B-to-A movement of the compound with 0.4-µm and 1.0-µm membrane Transwell plates containing either MDCKII-MDR1 or Caco-2 cells, processed robotically. Compound movement was also assessed using the same conditions with manually processed plates containing MDCKII-MDR1 cells as a control. A final test was also completed with Caco-2 cells, looking at Rh123 transport from B-to-A in the presence of the known P-gp inhibitor cyclosporin A. 19
Apparent Permeability
Table 5 shows that average Papp values for A-to-B movement of Rh123 through the MDCKII-MDR1 cell monolayer, using robotic processing, averaged 1.6 (0.4-µm) and 0.2 (1.0-µm) nm/s, with standard deviations averaging 0.6 and 0.4, respectively. The same movement, using manual processing, proved to be 5 to 20 times higher, with average Papp values of 7.2 (0.4-µm) and 3.9 (1.0-µm ) nm/s. Standard deviation averages for manual processing of 2.9 (0.4-µm ) and 2.1 (1.0-µm) were 5 times greater than standard deviations for robotic processing. Papp values for B-to-A transport of Rh123 through the MDCKII-MDR1 cell monolayer were equivalent, with less than a two-fold difference seen between robotic and manual processing.
MDCK Assay—Rhodamine 123 Apparent Permeability Statistical Parameters (nm/s)
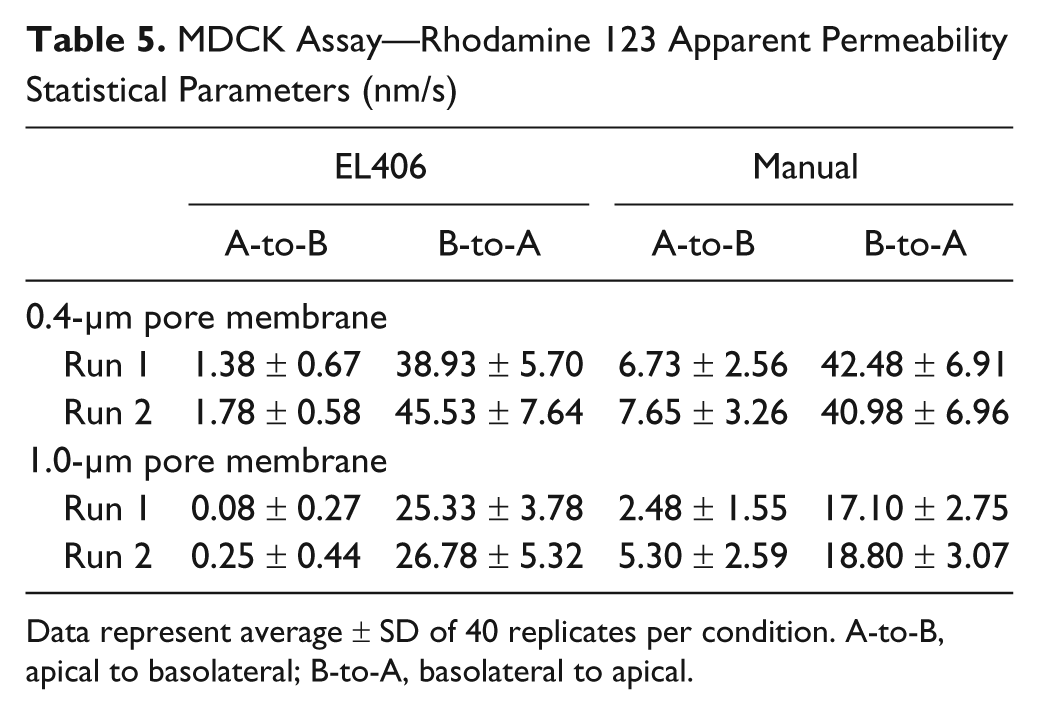
Data represent average ± SD of 40 replicates per condition. A-to-B, apical to basolateral; B-to-A, basolateral to apical.
Permeability values for A-to-B movement of Rh123 through Caco-2 cell monolayers, using robotic processing, were similar to that seen with MDCKII-MDR1 cells, with averages and standard deviations of 2.3 and 0.7 nm/s for 0.4-µm membranes and 1.9 and 1.1 nm/s for 1.0-µm membranes ( Table 6 ). Papp values for uninhibited B-to-A transport of Rh123 through the Caco-2 cell monolayer were 92.1 (0.4-µm) and 57.8 (1.0-µm) nm/s. Papp values for B-to-A transport of Rh123 into apical wells containing 10 µM cyclosporin A were 29.2 and 11.7 nm/s for 0.4-µm and 1.0-µm membranes, respectively. This represents a decrease of 68.3% and 79.8% in P-glycoprotein transport of Rh123 from the B-to-A chamber in the presence of cyclosporin A.
Caco-2 Assay—Rhodamine 123 Apparent Permeability Statistical Parameters (nm/s)
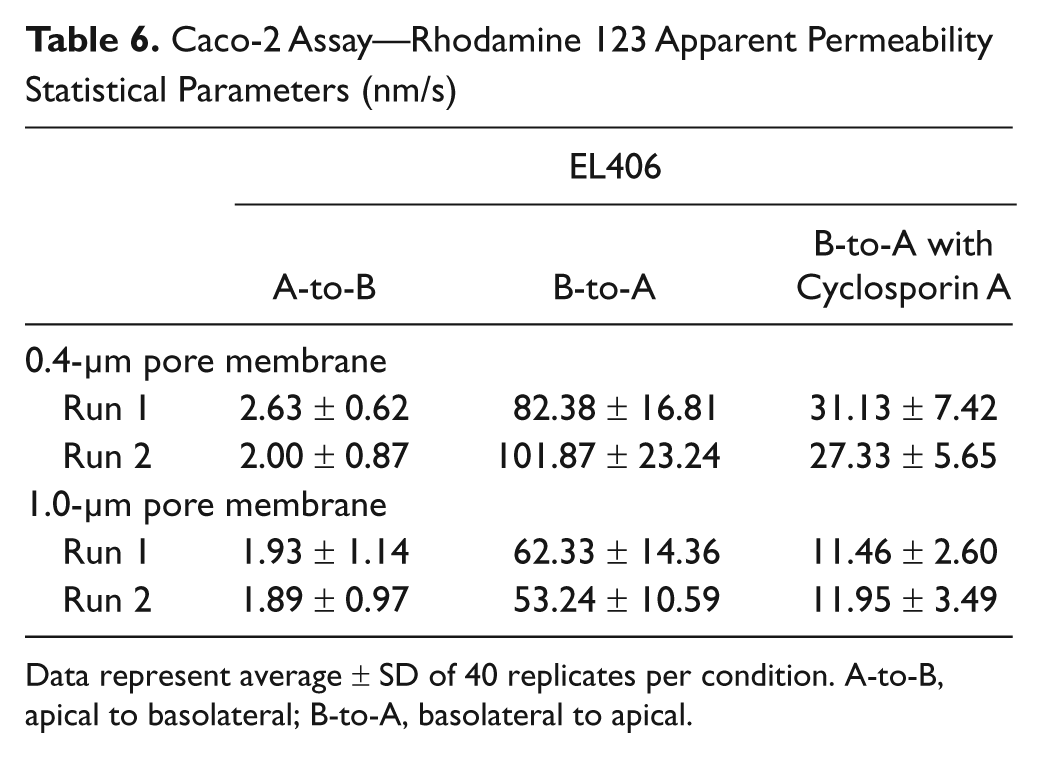
Data represent average ± SD of 40 replicates per condition. A-to-B, apical to basolateral; B-to-A, basolateral to apical.
Efflux
Average efflux values for 0.4-µm Transwell plates containing MDCKII-MDR1 cells were 27 for robotic processing and 6 for manually processed plates ( Fig. 3 ). Averages for 1.0-µm plates were 108 when processed using the automated procedure and 5 when using the manual procedure. The values for manual processing exhibited a 78% efflux decrease for 0.4-µm plates and 95% for 1.0-µm plates when compared to robotic processing.
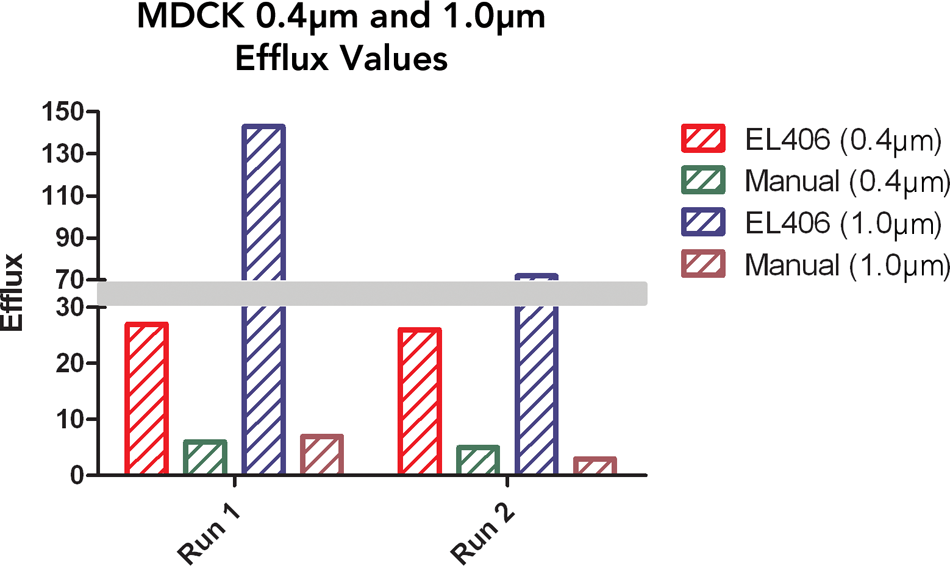
MDCKII-MDR1 efflux of rhodamine 123 (Rh123). Efflux of the Rh123 compound determined for 0.4-µm and 1.0-µm Transwell plates containing MDCKII-MDR1 cells processed manually or using the automated method. Final efflux values determined by dividing average apparent permeability (Papp) values for basolateral-to-apical (B-to-A) movement (n = 40) by average Papp values for apical-to-basolateral (A-to-B) movement (n = 40) of Rh123.
Efflux values for Transwell plates containing Caco-2 cells averaged 41 for 0.4-µm and 30 for 1.0-µm robotically processed plates ( Fig. 4 ). Averages for transport into apical chambers containing 10 µM cyclosporin A were 12 and 6 for 0.4-µm and 1.0-µm plates, respectively. These values represent a 71% and 80% inhibition, respectively, of P-glycoprotein activity when compared to uninhibited efflux of the compound.
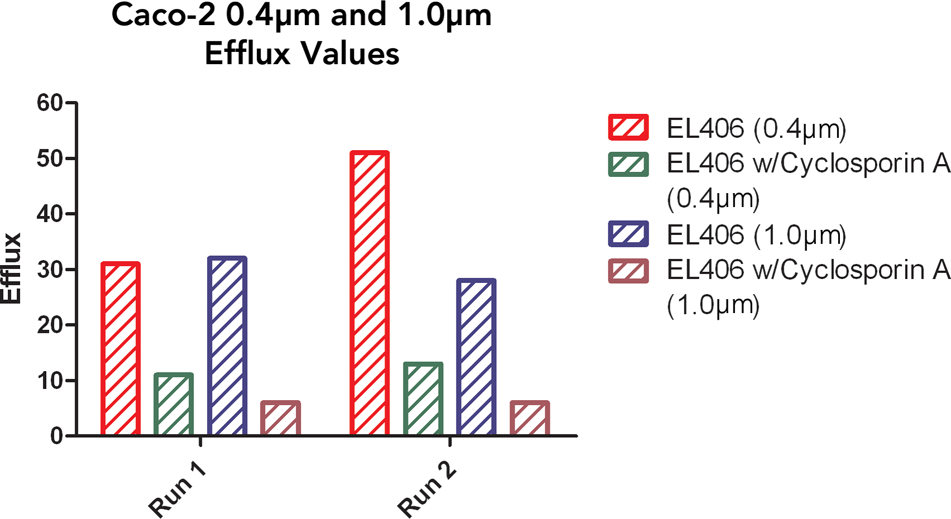
Caco-2 efflux of rhodamine 123 (Rh123). Efflux of the Rh123 compound determined for 0.4-µm and 1.0-µm Transwell plates containing Caco-2 cells processed using the automated method. Uninhibited apical wells used to measure basolateral-to-apical (B-to-A) transport of rhodamine 123 contained Hank’s buffered salt solution (HBSS) buffer with 1% DMSO. Inhibited apical wells used to measure B-to-A transport of rhodamine 123 contained 10 µM cyclosporin A in 1% DMSO. Final efflux values determined by dividing average apparent permeability (Papp) values for B-to-A movement (n = 40) by average Papp values for apical-to-basolateral (A-to-B) movement (n = 40) of the compound.
Discussion
Analysis of Transepithelial Electrical Resistance Readings
Proper cell dispensing to the Transwell plate apical chamber is essential to achieving the correct results from a cell-based drug absorption assay. The same is true for media and buffer exchanges within the chamber. Dispensing too few cells can create a situation where cells are not close enough to each other, and tight junctions are not able to form. This can then allow compound to leak through the monolayer, making the compound appear to have a higher permeability than what is true. The same can be said for the media and buffer exchange procedure. It is critical that the spent media be removed as much as possible without disturbing the cell layer or removing cells from the membrane. It is also necessary that replacement of media or buffer into the apical chamber does not cause cells to dislodge from the membrane. By validating the cell dispensing process, as well as the media and buffer exchange procedure, these concerns can be alleviated. By comparing the TEER values for automated dispensed wells containing either MDCKII-MDR1 cells ( Table 2 ) or Caco-2 cells ( Table 3 ) to wells containing no cells, it can be seen that cell layers are intact and provide resistance to the electrical current passing between each chamber of the well. This confirms that the EL406 is a viable option for dispensing cells and performing media and buffer exchanges within the apical (upper) and basolateral (lower) Transwell plate chambers. Data in Table 2 also show that TEER values for automated cell dispensing are typically higher than TEER values for cells dispensed manually. The higher values for plates processed using the automated method suggest a more intact cell layer when compared to plates processed manually.
Lucifer Yellow Validation
The automated and manually dispensed cell monolayer cohesiveness was further assessed through use of the LY compound. LY, which demonstrates limited permeability through a cell monolayer, will generally only move across the membrane in areas where the monolayer is not intact. 20 This compound is accepted as a suitable method to evaluate coherence between junctions in cell monolayers dispensed onto Transwell membranes.8,21 By examining the results in Table 4 , it can be seen that MDCKII-MDR1 and Caco-2 monolayers are intact. Average Papp values are less than 2 nm/s, demonstrating that little compound permeates between the cell junctions. Papp values for manually processed plates were several times higher both in the compound amount moving from the apical to the basolateral chamber and also in the well-to-well variability within a plate. This indicates that the EL406 can provide a more precise and highly repeatable process for cell delivery and media and buffer exchange than manual processing. Fine-tuning the pin height used for aspiration allows for a consistent height above the monolayer. This ensures that no cells are aspirated off of the membrane and that little media or buffer remains in the chamber following the procedure. The angled dispense tips also guarantee that liquid is not dispensed directly onto the cells but down each chamber side. This contrasts to manual processing, where aspiration is accomplished using multichannel pipettes or handheld vacuum devices. The difficulties of achieving a consistent aspiration height mean that cell layers can be disturbed, or excess liquid may remain in the chamber at the completion of the process. Dispensing liquid back to the wells can lead to many of the same complications. These results would also be seen if the wrong EL406 settings were used to dispense cells or perform media exchanges. An aspiration height too close to the cell monolayer would remove cells, creating gaps where LY could leak through to the basolateral chamber. Aspiration heights too far away from the cell layer would leave a high volume of old media, containing low concentrations of necessary growth nutrients. This could then cause a decrease in viability and once again affect the cell monolayer confluence. The results seen in Table 4 support these conclusions.
Evaluation of Proper Cell Function
Utility of the automated drug absorption assay procedure to deliver proper permeability and transport information was confirmed through the use of Rh123. Rh123 is a known ABC-transporter P-glycoprotein substrate. 19 Therefore, a net compound efflux should be seen when comparing Papp values for B-to-A transport to Papp values for A-to-B permeability.
Apparent permeability values for A-to-B Rh123 movement, similar to LY, were low using the automated method. Average values were less than 1.6 ± 0.5 for plates containing MDCKII-MDR1 cells. Comparable results were also observed from plates containing Caco-2 cells, with mean values less than 2.3 ± 1.1. This once again indicates that cell monolayers were intact with tight junctions between the cells. Manually processed MDCKII-MDR1 plates, however, exhibited A-to-B Papp values that were 5 times higher for 0.4-µm plates and 20 times higher for 1.0-µm plates when compared to robotically processed plates containing the same cell line. This is a similar pattern to the LY monolayer validation and is indicative of the inherent variability seen in cell monolayers prepared using manual processing.
Because Papp values were lower and more consistent for robotic processing compared to manual methods, efflux values were influenced by the results. By examining the data for B-to-A transport of Rh123 by P-glycoprotein, it can be seen that Papp values were similar between automated and manual processing, even though automated values were typically higher. This demonstrates that compound transport was taking place despite the monolayer state. However, when final efflux values are examined ( Fig. 3 ), it is evident that the higher A-to-B Papp values for manually processed plates dramatically affect the final results. This becomes especially important when unknown lead compounds are tested. These compounds, which in actuality may be P-glycoprotein substrates, may be misidentified as nonsubstrates due to mistakenly low efflux values stemming from nonintact and leaky cell monolayers.
Proper cell function was further validated by comparing P-glycoprotein’s ability to transport Rh123 from the B-to-A chamber using Caco-2 cells in an inhibited and uninhibited fashion. Figure 4 shows that 0.4-µm and 1.0-µm plate efflux values were reduced by 71% and 80%, respectively, when 10 µM cyclosporin A was added to the Transwell plate apical chambers. This is in agreement with previous findings where the 10-µM cyclosporin A addition led to a decrease in Rh123 transport of approximately 70%. 19 These findings confirm the ability of the automated method to be used for drug permeability and transport studies, as well as to screen for potential drug transport enzyme inhibitors.
Conclusion
The automated drug absorption assay offers a straightforward, easy-to-use method to assess lead compound permeability, as well as their potential as substrates for drug transport enzymes, such as P-glycoprotein. The assay may also be used to screen for possible inhibitors of these important transporters. The procedure may be easily automated using instrumentation that fits into existing laminar flow hoods, thereby ensuring sterile manipulation of cells, media, and assay components. By including instrumentation, we have seen a dramatic decrease in the time involved to process each step in the assay (data not shown). The automated procedure also provides a more robust and repeatable way to dispense cells and perform media and buffer exchanges in the Transwell plate apical and basolateral chambers. TEER measurements, in addition to LY and Rh123 permeability and transport data, illustrate the automated assay’s capability to deliver accurate and reproducible results, as well as to ensure that the correct decisions are made concerning lead compound absorption characteristics.
Footnotes
Acknowledgements
The authors acknowledge Dr Piet Borst (Netherlands Cancer Institute Amsterdam, the Netherlands) for the generous gift of the MDCKII-MDR1 cells used in this project.
Brad Larson and Peter Banks are employees of BioTek Instruments, and Hilary Sherman and Mark Rothenberg are employees of Corning Life Sciences.
The author(s) received no financial support for the research, authorship, and/or publication of this article.
References
Supplementary Material
Please find the following supplemental material available below.
For Open Access articles published under a Creative Commons License, all supplemental material carries the same license as the article it is associated with.
For non-Open Access articles published, all supplemental material carries a non-exclusive license, and permission requests for re-use of supplemental material or any part of supplemental material shall be sent directly to the copyright owner as specified in the copyright notice associated with the article.