
Abstract
The determination of inhibitory effects that lead compounds have on cytochrome P450 (CYP) ezymes is an important part of today's drug discovery process. Assays can be performed early in the discovery process to predict adverse drug—drug interactions caused by CYP inhibition and to minimize the costs associated with terminating candidates in late stage development or worse, removing a drug from the market after launch. For early discovery work, testing substantial numbers of compounds is desirable, thus automated “mix and read” assays are beneficial. Here, we demonstrate the automation of the CYP profiling process using a simple, yet robust robotic platform. Compound titration, as well as transfer of compounds and assay components was performed by the same automated pipetting system. IC50s of small molecule drugs were determined using recombinant CYP enzymes, CYP3A4, −2C9, and −2D6 and luminogenic substrates specific to each. Compounds were profiled against all three enzymes on the same 384-well assay plate.
Introduction
Most small molecule drugs are metabolized predominantly in the liver by cytochrome P450 (CYP) enzymes, particularly CYP3A4, −2C9, and −2D6. 1 It is important to assess metabolism not only for appropriate dosing but also for establishing metabolism-related drug—drug interactions where one drug may affect the metabolism of another, leading to possible adverse effects. For example, the antihistamine terfenadine (Seldane) was removed from the market due to the risk of cardiac arrhythmia caused by increased exposure to the drug. 2 The drug, predominantly metabolized by CYP3A4, increased in plasma concentrations when taken with other drugs that inhibit CYP3A4, leading to toxic effects. While the gold standard method for in vitro determination of lead compound inhibition of CYP enzymes involves monitoring the metabolism of drug substrates by LC-MS/MS, there is a growing need for a low cost, higher throughput, and easily automatable alternative that can assess inhibitory effects of compounds on CYP enzymes.
In vitro biochemical assays, combined with liquid handling instrumentation that can titrate compounds and transfer multiple assay components at a time, provide a solution for simple, low cost, automated assay screening. Here, we demonstrate the use of a luminescent assay chemistry that incorporates recombinant human CYP enzymes with luminogenic CYP substrates. The sensitivity and simple “add and read” protocol enable small concentrations of CYP enzyme to be used in a reaction, as well as making the assay amenable to profiling applications in high-density plates. The luminescent assay incorporates a stabilized firefly luciferase in a formulation that minimizes interference from compounds and provides a stable signal, allowing for batch processing of assay plates. The assay is performed in two steps. In the first step, CYP enzymes convert a luminogenic substrate to a luciferin product. In the second step, Luciferin Detection Reagent is added. This simultaneously stops the CYP reaction and initiates a luminescent signal that is directly proportional to the luciferin produced in the first step.
An automated pipetting station was used to titrate test compounds in 96-well format, along with transferring compounds and assay components into 384-well assay plates. Automated assays for three CYP enzymes were validated: CYP2C9, −2D6, and −3A4, due to the fact that these are three of the most important CYP enzymes metabolizing between 80% and 90% of currently used drugs. 3 –5 Two compounds were then tested per assay plate with each of the three CYP assays. The combination of chemistry and automated liquid handing creates a practical solution for high throughput CYP profiling of lead compounds in drug discovery campaigns.
Materials and Methods
Materials
P450-Glo CYP3A4 Screening System with Luciferin-IPA (Catalog # V9920), P450-Glo CYP2C9 Screening System (Catalog # V9790), and P450-Glo CYP2D6 Screening System (Catalog # V9890) were attained from Promega Corp. (Madison, WI). All screening systems contain Solution A-NADPH Regeneration System, Solution B-NADPH Regeneration System, 1M potassium phosphate buffer (KPO4, pH 7.4), luciferin-free water, control membranes, and Luciferin Detection Reagent. The CYP3A4 Screening System contained recombinant CYP3A4 membranes (1 pmol/μL)+reductase+cytochrome b5 and the luminogenic CYP3A4 substrate Luciferin-IPA. The CYP2C9 Screening System contained recombinant CYP2C9 membranes (1 pmol/μL)+reductase+cytochrome b5 and the luminogenic CYP2C9 substrate Luciferin-H. The CYP2D6 Screening System contained recombinant CYP2D6 membranes (1 pmol/μL)+reductase and the luminogenic CYP2D6 substrate Luciferin-ME EGE. The detection reagent for CYP3A4 and CYP2D6 assays contains esterase for processing the luciferin product of the CYP reactions, but the CYP2C9 reagent does not contain esterase because the CYP2C9 reaction product is detected without the need for processing by esterase.
ATP, 0.5 mM (Catalog#V222A) and Kinase-Glo Plus Luminescent Kinase Assay (Catalog#V3771) were purchased from Promega Corp. (Madison, WI).
Ketoconazole (Catalog#K1003), (+/−)-verapamil hydrochloride (Catalog#V4629), nifedipine (Catalog#N7634), sulfaphenazole (Catalog#S0758), (+/−)-miconazole nitrate salt (Catalog#M3512), diclofenac sodium salt (Catalog#D6899), fluvoxamine maleate (Catalog#F2802), quinidine anhydrous (Catalog#Q3625), dextromethorphan hydrobromide (Catalog#D9684), and dimethyl sulfoxide (Catalog#D2650) were purchased from Sigma-Aldrich (Saint Louis, MO).
Liquid Handling. A Precision XS Microplate Sample Processor from BioTek Instruments, Inc. (Winooski, VT) was used to perform compound titrations and dispense all assay components to the wells of the assay plates (see Fig. 1A). The instrument contains a single-channel pipetting head, an 8-channel pipetting head, and an 8-channel bulk reagent dispenser. The 8-channel pipetting head was used for this application.
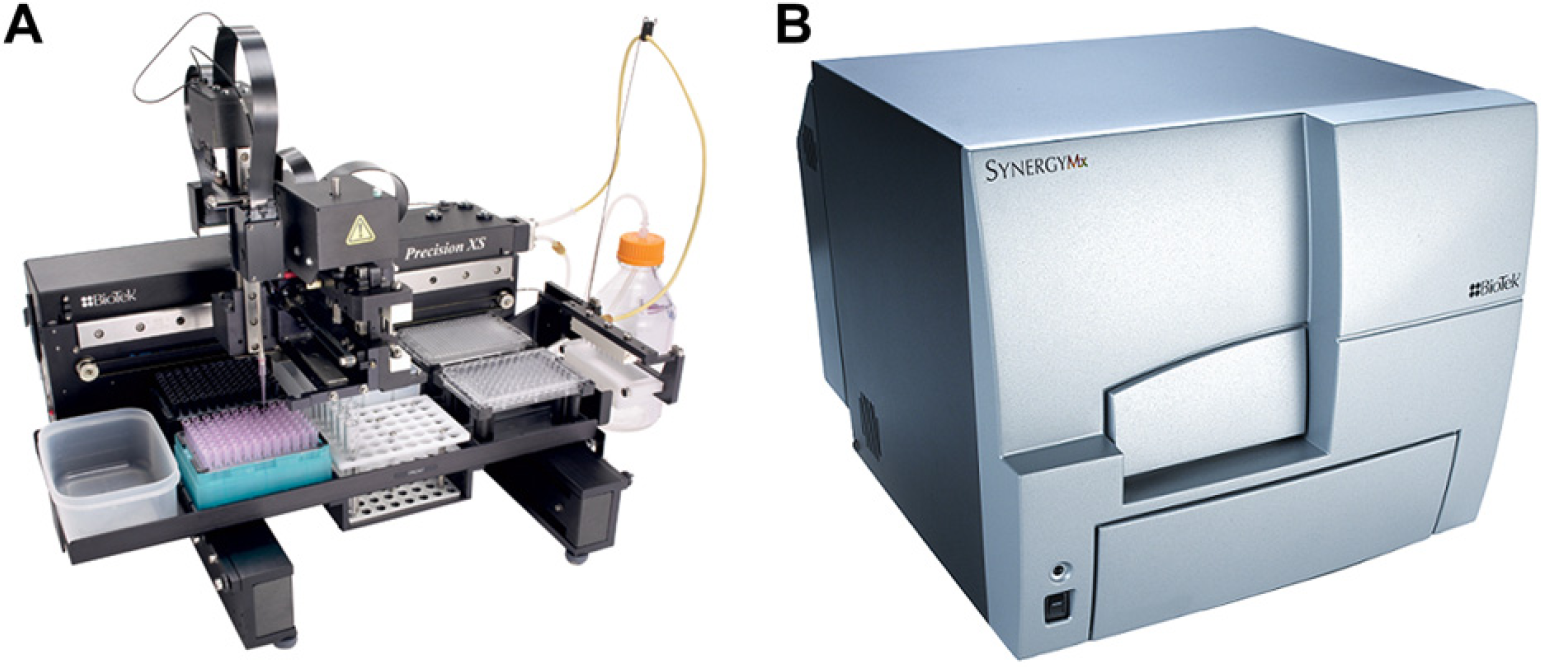
BioTek Instrumentation. (A) The Precision XS was used to titrate compounds and deliver all assay components to the assay plate. (B) The Synergy MX was used to quantify the luminescent signal from each reaction well.
Luminescent Signal Detection. All assay plates were read using a Synergy MX Monochromator-Based Multi-Mode Microplate Reader from BioTek Instruments, Inc. (Winooski, VT) (see Fig. 1B). The luminescence detection method was chosen with a 1.0-s integration time. Automatic sensitivity adjustment was used to detect the well on the plate containing the highest luminescent signal. The gain setting is automatically adjusted to the signal from that well.
Methods
Enzyme Reaction Conditions. CYP2C9 enzyme reactions were prepared using 0.25 pmol/rxn CYP2C9 membranes, 100 μM Luciferin-H, and 25 mM KPO4. CYP2D6 enzyme reactions were prepared using 0.125 pmol/rxn CYP2D6 membranes, 30 μM Luciferin-ME EGE, and 100 mM KPO4. CYP3A4 enzyme reactions were prepared using 0.05 pmol/rxn CYP3A4 membranes, 3 μM Luciferin-IPA, and 100 mM KPO4. According to the manufacturer's protocol, the concentration of each CYP enzyme was within the linear range for each reaction. The concentrations ensure the generation of a detectable amount of D-luciferin, while also being low enough that nonspecific binding of protein to a drug or inhibitor, which can lead to an overestimation of Km or Ki values, was not detected. Negative control reactions for each of the three isoforms contained the same concentrations of substrate and KPO4 buffer but with control membranes lacking CYP activity in place of the CYP membranes. Control membrane concentrations were chosen so that the same milligrams per milliliter of protein was used in the CYP and control reaction. Control membrane concentrations equaled 0.045, 0.075, and 0.0175 mg/mL for CYP2C9, −2D6, and −3A4, respectively.
The enzyme reaction incubation times were set to stay within the linear range of each enzyme reaction and maximize assay window. The incubation times were as follows: CYP2C9—75 min; CYP2D6—45 min; and CYP3A4—10 min. Incubations were carried out at room temperature (RT).
NADPH Regeneration System. The prepared NADPH regeneration system contains a 1:20 dilution of Solution A and a 1:100 dilution of Solution B. Final component concentrations are 1.3 mM NADP+, 3.3 mM glucose-6-phosphate, 3.3 mM MgCl2, and 0.4 U/mL glucose-6-phosphate dehydrogenase.
Luciferin Detection Reagent. Reconstituted Luciferin Detection Reagent for CYP2C9 reactions was prepared by adding reconstitution buffer to the lyophilized Luciferin Detection Reagent. Reconstituted Luciferin Detection Reagent for CYP2D6 and CYP3A4 reactions was prepared by adding reconstitution buffer with esterase to the lyophilized Luciferin Detection Reagent.
ATP Solution. 100 μM ATP (1 ×), containing 0.25% DMSO, was prepared for the compound titration validation.
Compounds. Sulfaphenazole, ketoconazole, and quinidine were prepared at a 4× concentration of 400 and 0 μM for the Z'-factor determination. All test compounds were serially diluted 1:4, with a starting 4x concentration of 400 μM, for the CYP450 profiling. All reactions contained a final DMSO concentration of 0.25%. According to the manufacturer's protocol, the CYP3A4, −2C9, and −1A2 assays are not inhibited by DMSO at concentrations less or equal to 0.25%.
Data Analysis. Percentage of enzyme activity was calculated by first averaging the luminescent values for the 0 μM compound point. Each raw luminescent value was then divided by this value. The results were multiplied times 100 to determine the percentage of enzyme activity for each reaction.
The percentage of enzyme activity IC50 values were computed using a nonlinear regression sigmoidal dose—response (variable slope) curve fit (Y = bottom+(top — bottom)/ 1+10((logIC50-X)•Hill slope), X = log analyte concentration, Y = response in relative light units). Z'-factor was determined from 24 replicates each of CYP reactions containing 0 μM inhibitor (positive control) and CYP reactions containing 100 μM inhibitor (negative control).
Prism, version 5.01, from GraphPad Software (La Jolla, CA), was used to calculate the linearity of the compound titration and all compound IC50 values.
Automated Workflow
Assay Setup. Labcon 200 μL Robotic Tips: nonsterile, low retention (BioTek Catalog#98254) were used for diluent addition and serial titrations and for delivery of NADPH regeneration system and Luciferin Detection Reagent to the assay plate. Labcon 50 μL Robotic Tips: nonsterile, low retention (BioTek Catalog#98250) were used to transfer the dilution series, DMSO, ATP, and enzyme/substrate mixes to the assay plate. Titrations were carried out in 96-well format using 96-well Greiner U-bottom plates (Promega Catalog#A9161). CYP enzyme/substrate mixes were also placed into this type of plate for the automated methods. NADPH regeneration system and Luciferin Detection Reagent were placed into Greiner MASTERBLOCK, 1 mL, U-Bottom, solid, natural, nonsterile 96-well plates (Greiner Bio-One Catalog#780 201) when running the automated methods. Assays were run in 384-well format using Corning 384 Well Low Flange White Flat Bottom Polystyrene Not Treated Microplates (Catalog#3572) from Corning Life Sciences (Lowell, MA). Table 1 describes the general automated protocol followed for CYP profiling. Dilutions of DMSO or inhibitors, ATP, and enzyme/substrate mixes were dispensed at 5 μL volumes each. NADPH regeneration system was dispensed at a 10 μL volume, whereas the Luciferin Detection Reagent was dispensed at a 20 μL volume. Enzyme/substrate was premixed 5x before delivery to ensure reagent consistency within the well. NADPH regeneration system and Luciferin Detection Reagent were pre-mixed 1 × to prewet the tips. All assay plates were mixed on an orbital shaker for 30 s at approximately 1000 rpm after the enzyme reaction component and Luciferin Detection Reagent additions. This was done to increase reaction consistency among replicates. According to the manufacturer's protocol, the Luciferin Detection Reagent is stable at RT for 24 h and the NADPH regeneration system for 2 h. The CYP enzyme reaction mixtures are stable for the duration of the reaction incubation time. However, CYP enzymes are unstable at RT for extended periods of time; therefore, they are held on ice until reactions are initiated.
P450-Glo automated 384-well profiling protocol

Compound Titration Validation. Eighty microliters of 100 μM ATP in 0.25% DMSO was pre-dispensed manually to column 1 of a 96-well Greiner U-bottom plate (Promega Catalog#A9161). Sixty microliters of 0.25% DMSO was then dispensed to columns 2–12. Twenty microliters of ATP was transferred from column 1 to column 2 and mixed 10 × using a volume of 60 μL. The process was repeated to create a serial 1:4 titration from column 1–11. Five microliters of the titration was then transferred in quadruplicate to the assay plate. An equal volume of Kinase-Glo Plus was then added manually to each well containing ATP. The plate was shaken as previously explained, incubated at RT for 10 min, and the luminescent signal from the plate was determined.
Z'-Factor Validation. Forty-eight 5 μL replicates of 400- or 0 μM inhibitor were added to the assay plate for each of the three CYP enzymes tested. Ninety-six 5 μL replicates of the appropriate enzyme/substrate combination were then added to each area of the plate. The wells containing 0 μM inhibitor represent the positive control, whereas the wells containing 400 μM inhibitor represent the negative control. The plate was mixed using an orbital shaker and preincubated for 10 min at RT. This allowed the compound and enzyme to interact before the reaction was initiated. Ten microliters of NADPH regeneration system was then added to each well to initiate the enzyme reaction. Incubation times are previously explained for each CYP enzyme. All other assay steps are explained in Table 1 The final 1x concentration of inhibitor was 100 μM for the negative control and 0 μM for the positive control.
CYP Profiling. The CYP profiling procedure was run as two separate methods on the Precision XS. Compound titration and transfer to the assay plate comprised the first method, whereas reagent addition comprised the second method. This was done to make batch processing of each part of the procedure easier to accomplish. Figure 2 explains how the deck of the Precision XS was setup for each method.

CYP450 Profiling Precision XS deck layouts. (A) Compound titration deck layout. (B) Reagent addition deck layout. Compounds and assay components were dispensed into the plates as described, and then placed onto the deck to run each automated method.
Figure 3 outlines the profiling procedure, which is explained in greater detail here. The same titration process used for the compound titration validation was repeated to create a serial 1:4 titration from column 1 to 11 for nine different compounds. Three separate titrations of two compounds were created per 96-well plate. The starting 4x concentration of compound was 400 μM. Five microliters of each concentration was then transferred in quadruplicate to the assay plate.
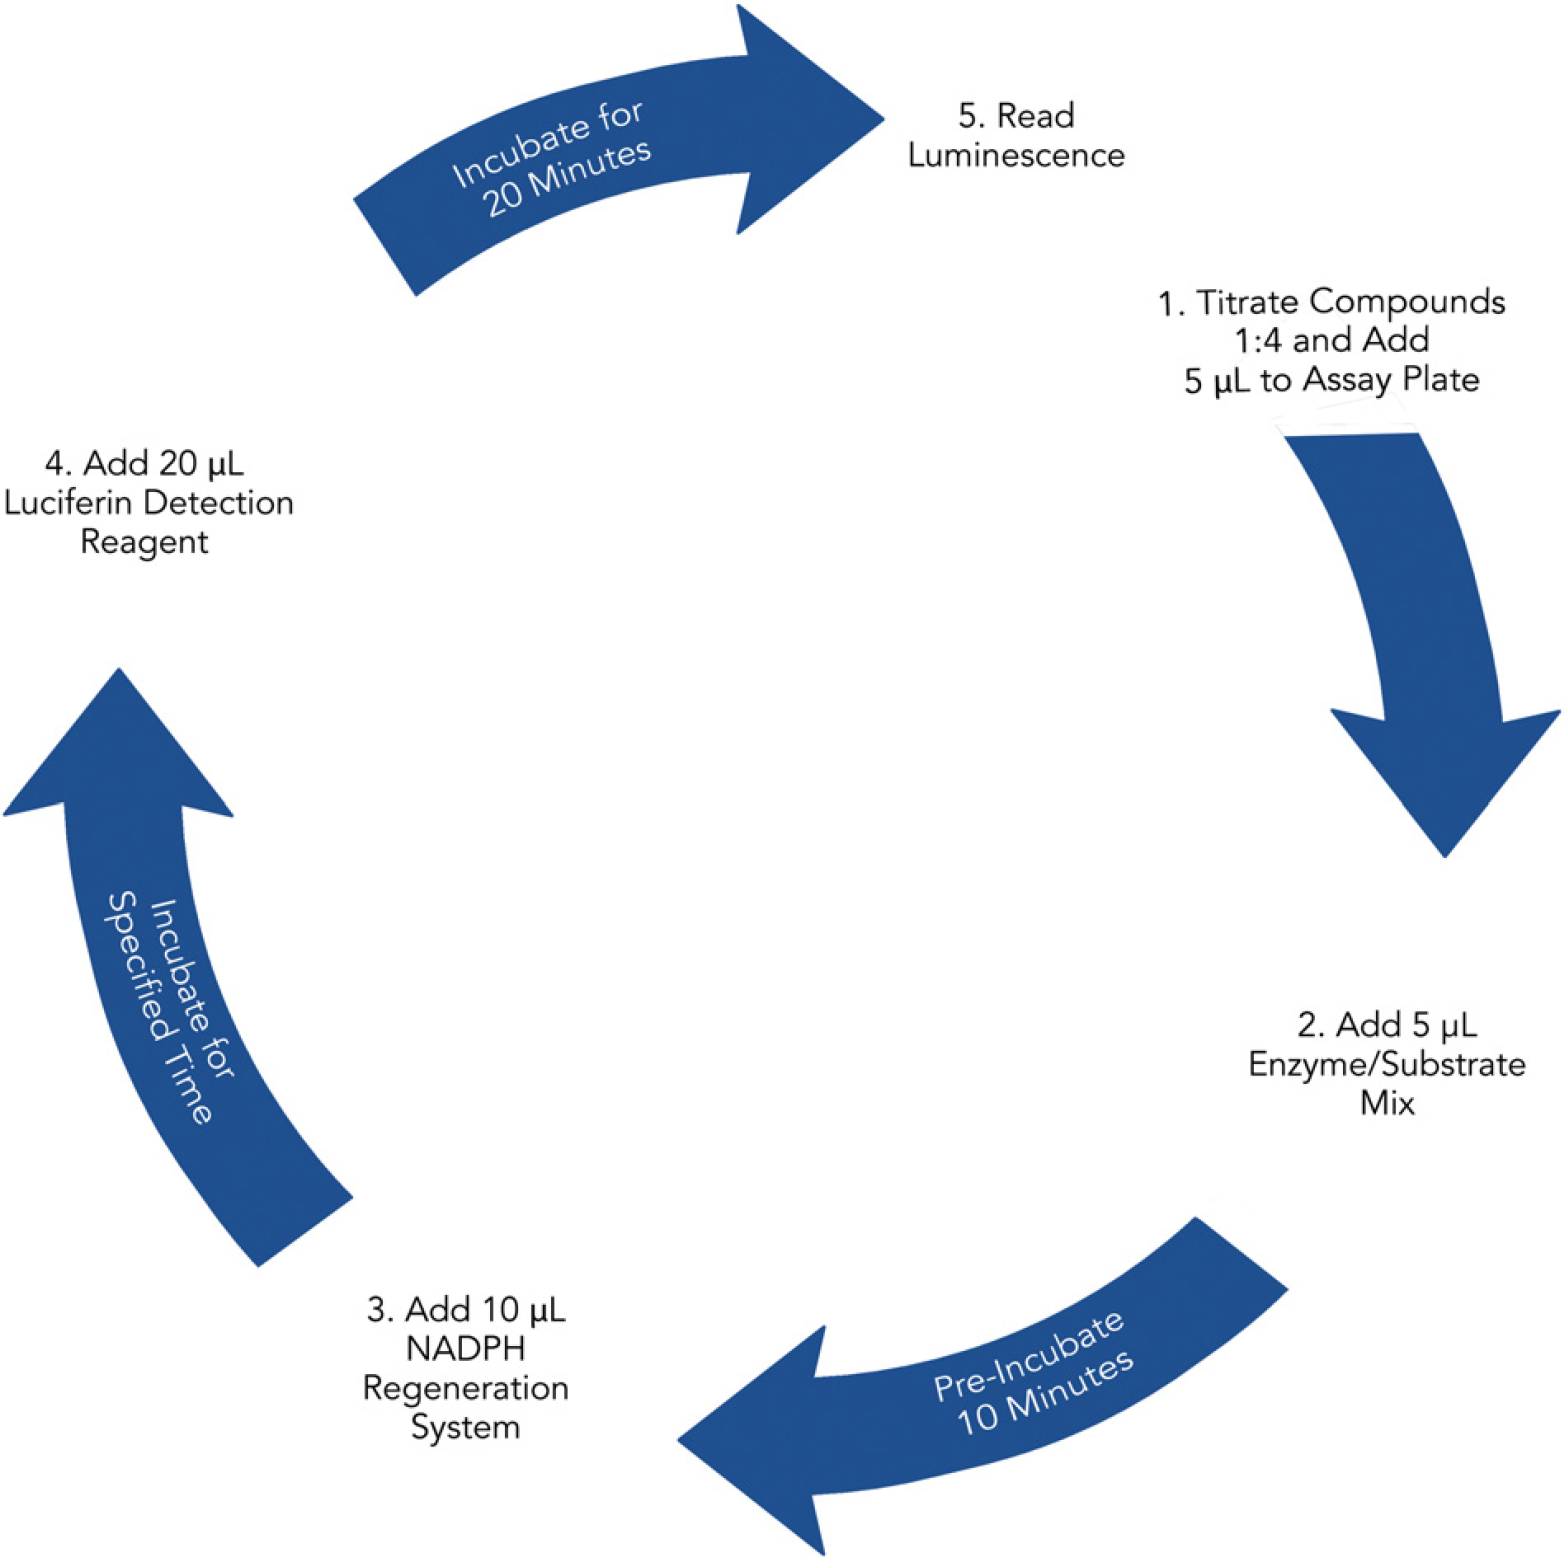
Method followed to complete automated CYP450 profiling process. Steps completed by BioTek Precision XS or Synergy MX. Incubations performed at RT.
After the titration and transfer of compounds to the assay plates, the second profiling method was run. The two sets of compound titrations on each plate were profiled against all three CYP enzymes. Five microliters of the appropriate enzyme/substrate mix was transferred to the compound-containing wells. The plate was mixed using an orbital shaker and preincubated for 10 min at RT. This once again allowed the compound and enzyme to equilibrate before the reaction was initiated. Ten microliters of NADPH regeneration system was then added to begin the reaction. The plate was mixed and incubated at RT for the appropriate period of time for each enzyme. After incubation, 20 μL of the appropriate Luciferin Detection Reagent was added to the appropriate wells. The assay plate was mixed once again, equilibrated at RT for 20 min, and read on the microplate reader. Figure 4 illustrates the final plate layout for each 96-well compound plate and 384-well assay plate included in the profiling process.
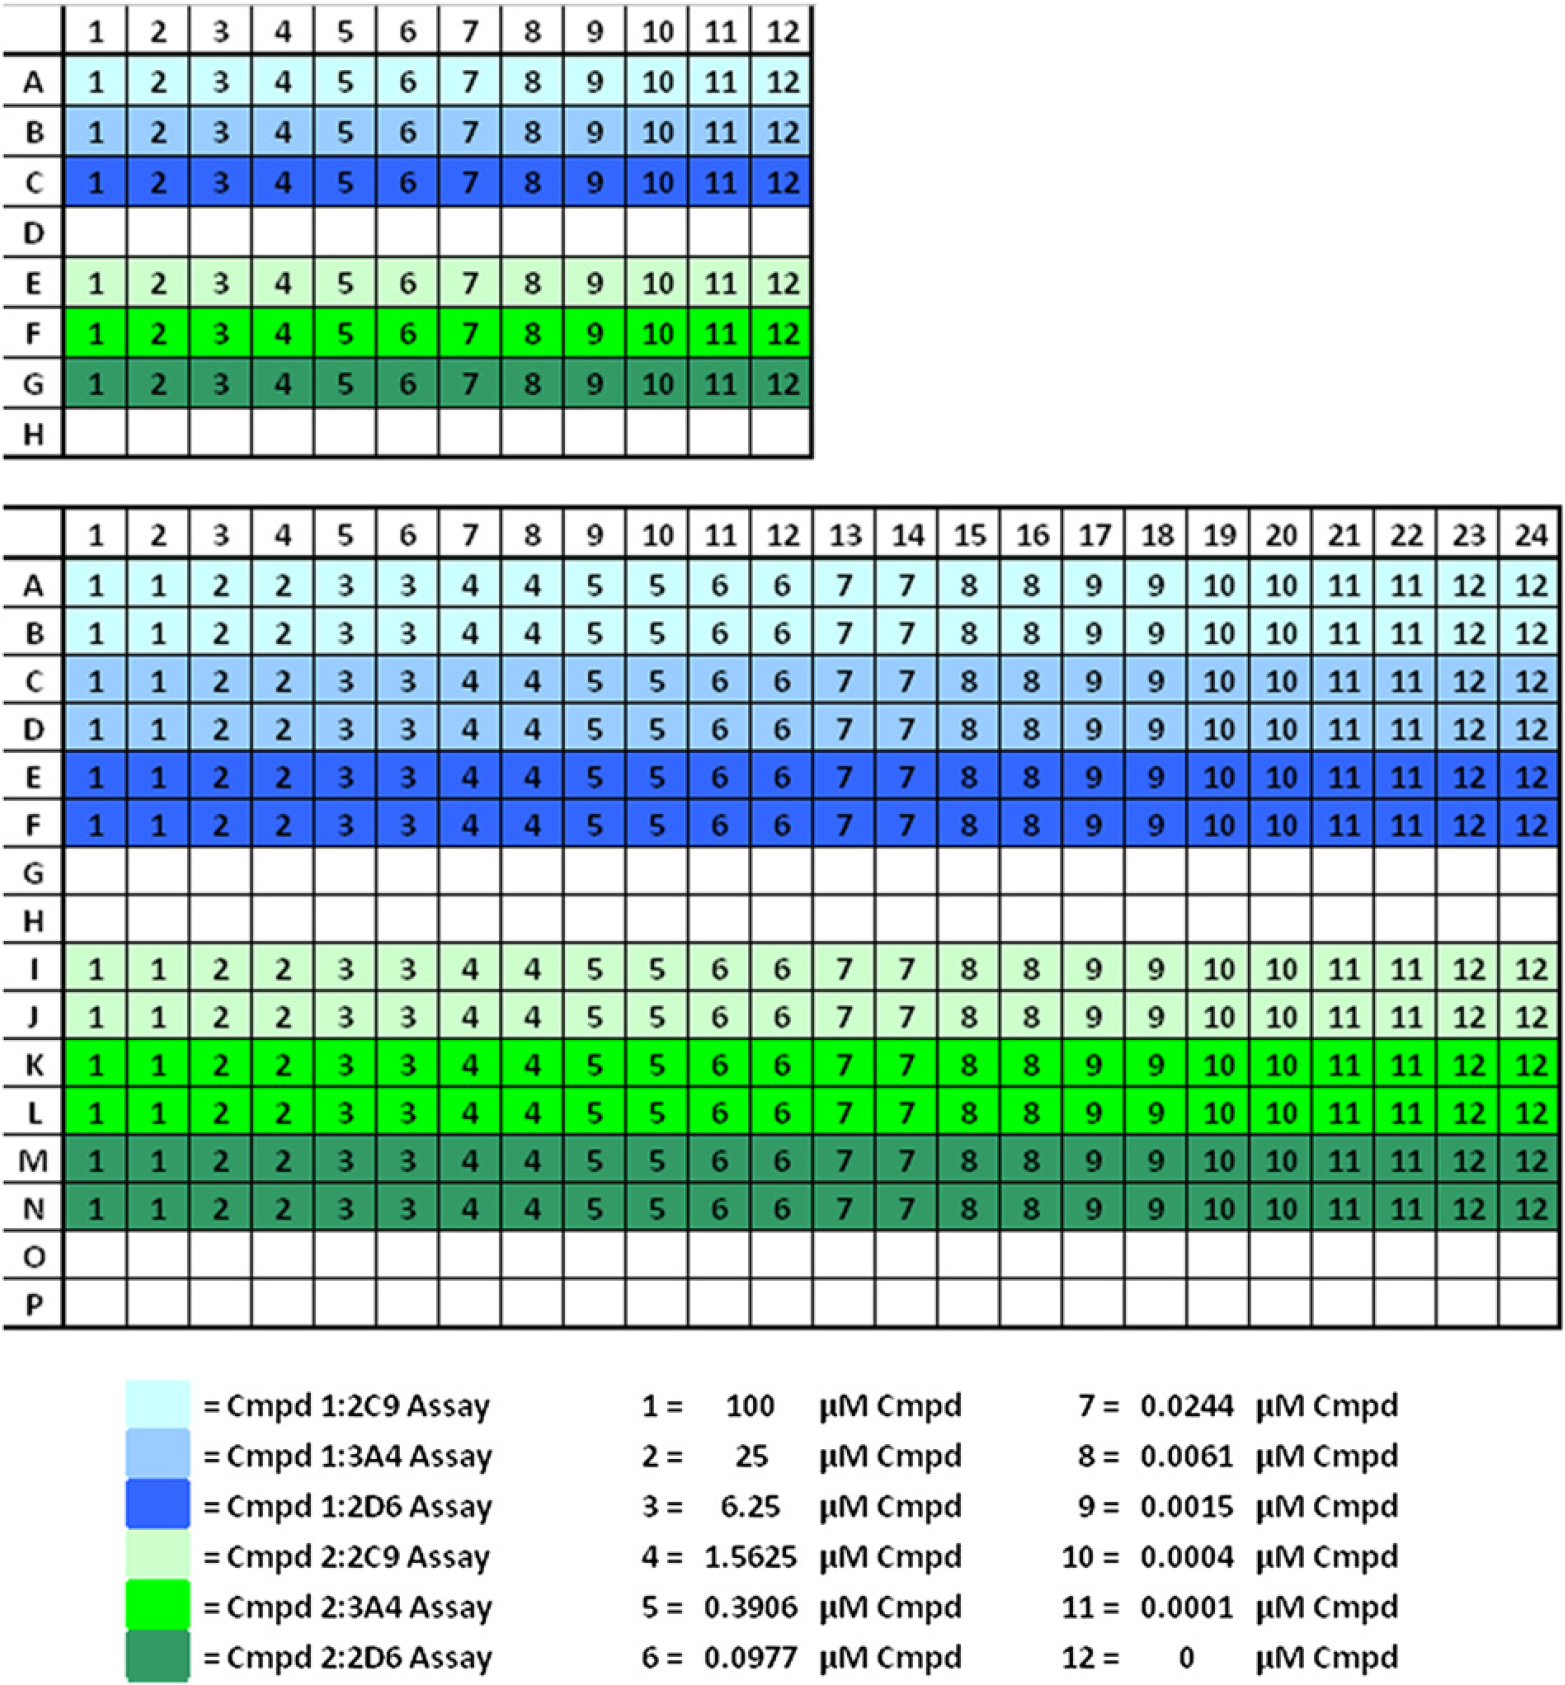
CYP450 Profiling plate layouts. Compounds are titrated in the 96-well plate, above. 1–12 represent the compound concentrations created during the dilution process. Two compounds are titrated per plate, represented by the blue and green colors. Compounds are transferred in quadruplicate to the 384-well assay plate. The three assay component additions are represented by the different shades of blue and green.
Results and Discussion
To ensure proper pharmacology when performing automated CYP profiling experiments on lead compounds, it is important that the compound titration method and assay for each CYP enzyme has been validated. The titration validation can be accomplished by serially diluting and tracking the linearity of a component whose signal can be quantified across the entire dilution scheme. ATP was chosen to meet this need. Validation of assay performance can be achieved by determining Z'-factor scores.
Compound Titration Validation
Proper compound titrations are necessary for accurate IC50 determinations. Transferring a volume of compound across a titration that is greater than what is expected can cause IC50 values to appear more potent than what is true for each of the CYP enzymes included in the panel. The inverse can be said if too little compound is transferred across the titration. By validating the compound titration method, results due to defects in this process can be eliminated. Luciferin was considered for use as the titrated test component, as it is the product of each P450-Glo CYP reaction and a dilution series can be used as a standard curve to interpolate luciferin concentration from relative luminescent units. However, the 11-fold 1:4 dilution series used here for analyte titrations exceeds the linear range of the luciferase/luciferin reaction. An ATP titration against the ATP detection reagent of the Kinase-Glo Plus Luminescent Kinase Assay was then decided on because it provides a linear response across the entire 11-fold 1:4 dilution series starting at 100 uM ATP. Figure 5 shows the results from the validation of the compound titration method with ATP. The axes for each graph are shown in log form to determine the precision and accuracy of the titration. The R2 value for the 11-point serial 1:4 titration of ATP (see Fig. 5A) is 0.9999 for 0–100 μM ATP, which is indicative of high correlation with a precise linear process. The slope of the line (1.002) indicates that a 1:4 dilution is being achieved at each point. This is similarly shown at low compound concentrations (see Fig. 5B), where the R2 value equals 0.9970 and the slope equals 1.001 for 0–2 μM ATP. Together, the data demonstrate that the Precision XS can accurately dilute compounds in the presence of 1.0% DMSO.
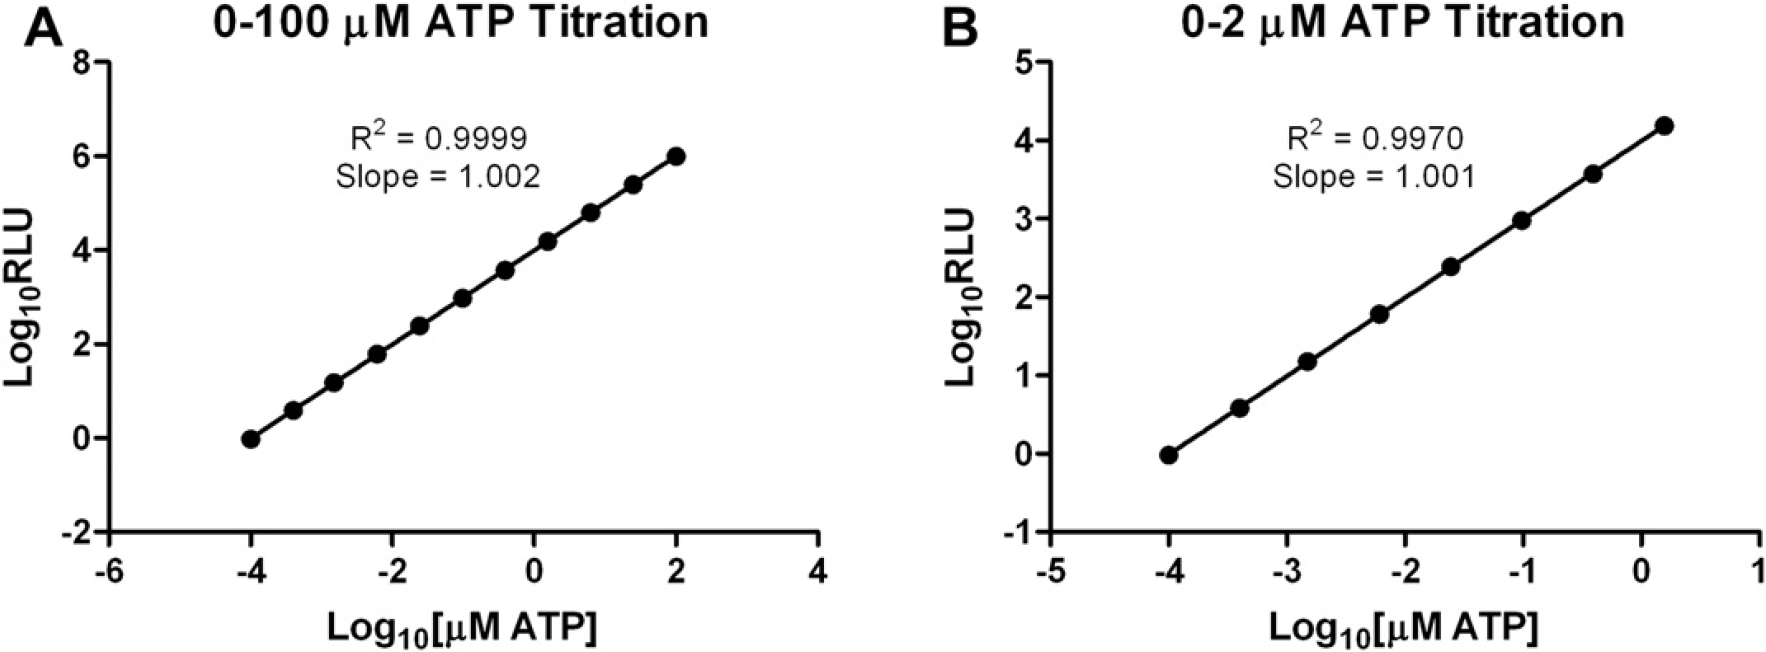
Compound titration method confirmation. ATP was serially titrated 1:4 to test the 12-point compound titration scheme. Each ATP concentration created was transferred to a 384-well assay plate in quadruplicate, followed by an equal volume of Kinase-Glo Plus reagent. Average luminescent values (Y-axis) were plotted for each ATP concentration (X-axis) included in the titration. Axes were represented in log10 format and linear regression was used to generate the R2 value and slope for the line. Error bars represent standard error of n = 4 values.
Z'-Factor Validation
Z'-factor, 6 as a statistical parameter, is commonly used for assessment of assay quality in drug discovery applications.
The measurement incorporates signal dynamic range and the variation associated with the signal measurements. 6 Therefore, it has become widely adopted as a measurement of automated assay quality, where a value ≥0.5 is considered a high-quality assay. The Z' factors generated: 0.83 for sulfaphenazole with CYP2C9 and 0.84 for ketoconazole with CYP3A4 and quinidine with CYP2D6 (see Fig. 6), confirm the robustness of each of the CYP assays, using the assay parameters described by the manufacturer. The Z'-factor values are strong indicators that the assays should yield accurate pharmacological results when used in a profiling setting.
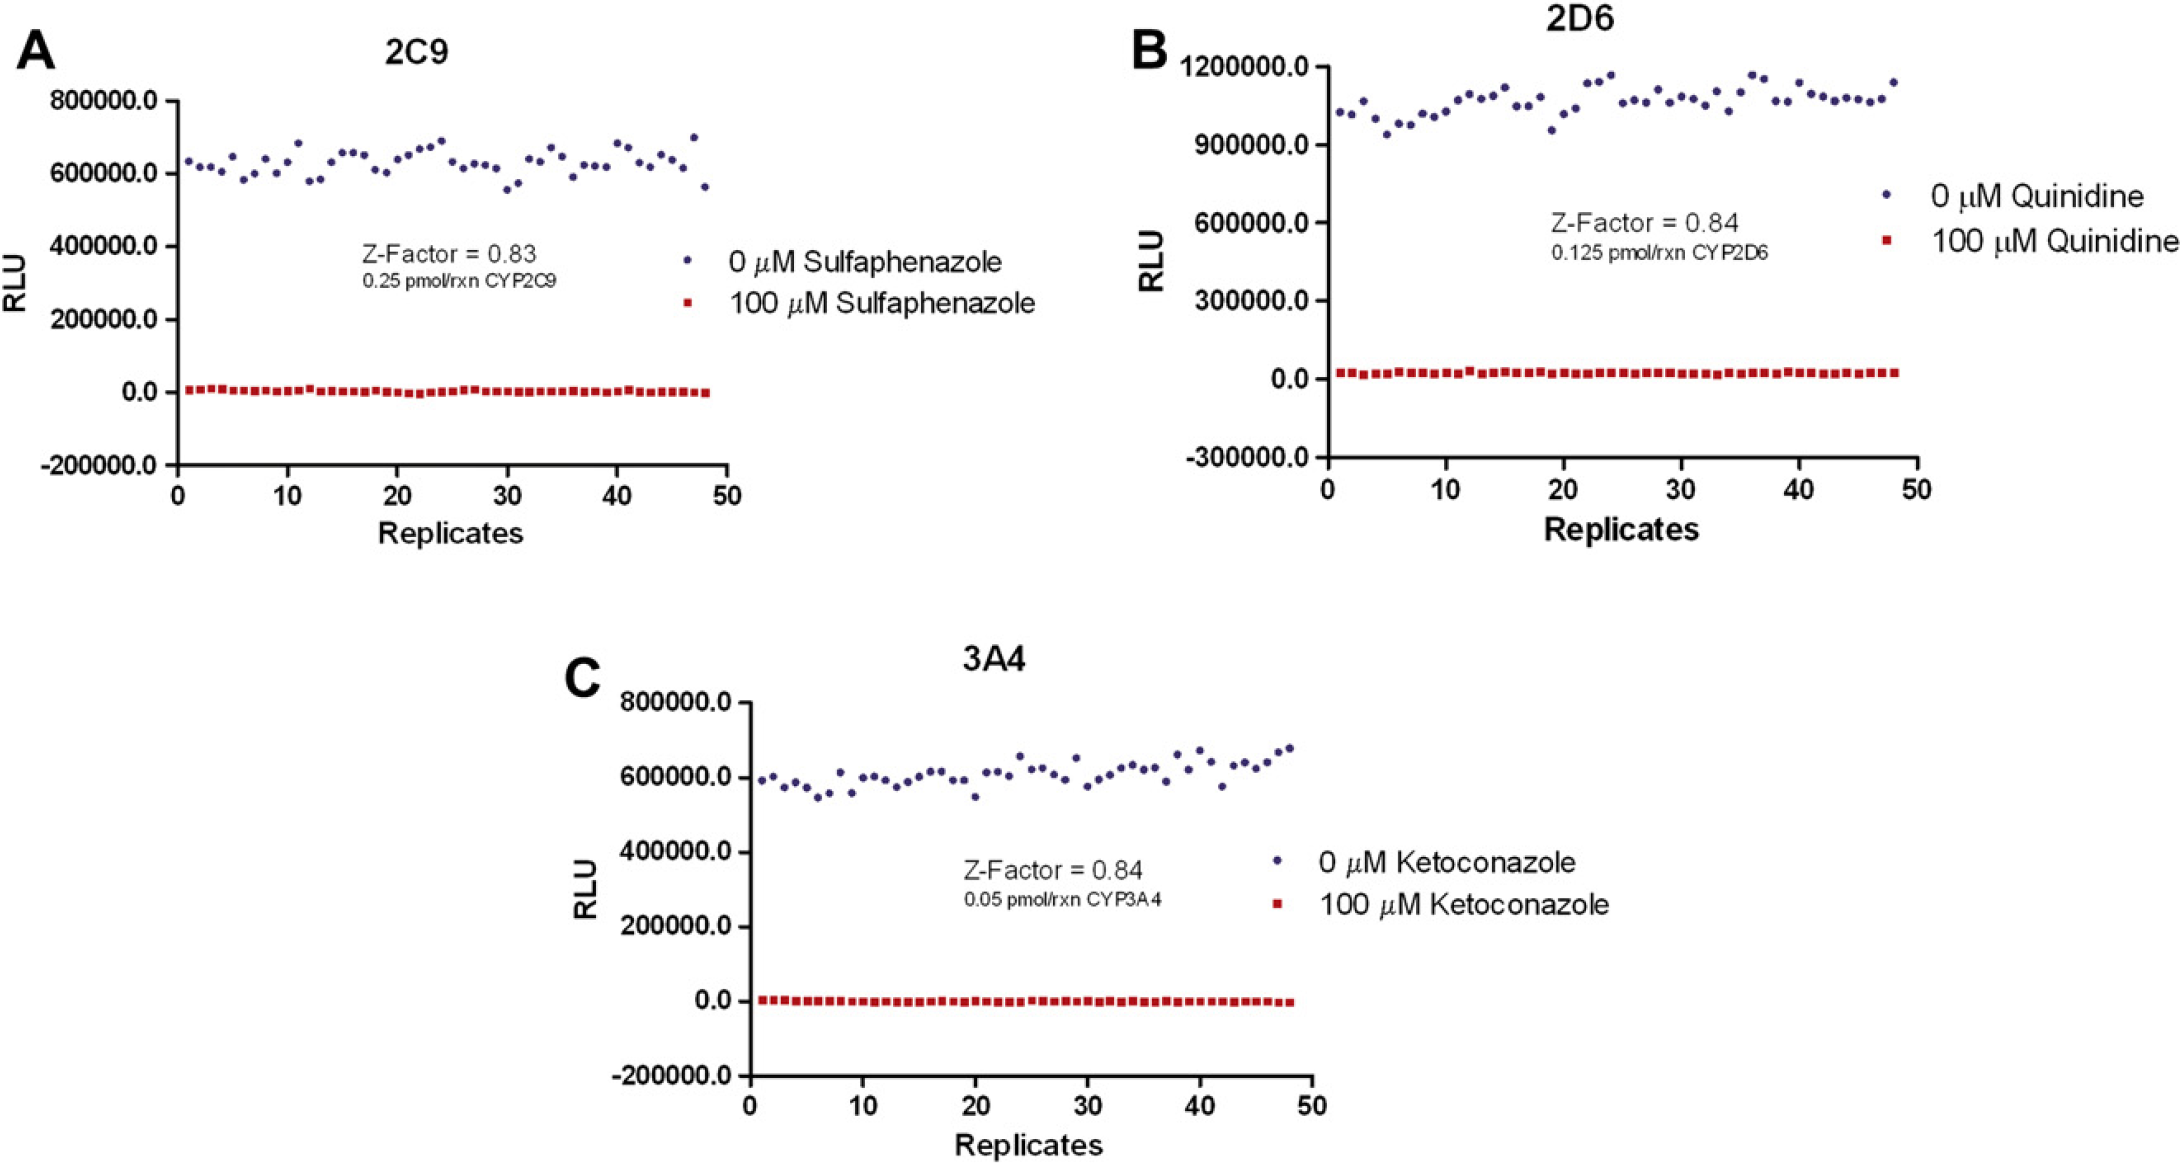
Z'-factor validation. Twenty-four replicates of positive control (0 μM control inhibitor) and negative control (100 μM control inhibitor) reactions were tested. (A) 2C9 reactions contained 0.25 pmol/rxn enzyme. (B) 2D6 reactions contained 0.125 pmol/rxn enzyme. (C) 3A4 reactions contained 0.05 pmol/rxn enzyme. Z'-factor values were based on the average and variation of background subtracted luminescent values for each control.
CYP Profiling
The three validated CYP assays were profiled using the nine compounds previously listed. Sulfaphenazole, 7 diclofenac, 8 and miconazole 9 are known CYP2C9 inhibitors; keto-conazole, 10 nifedipine, 11 and verapamil 12 are known CYP3A4 inhibitors; and quinidine, 7 dextromethorphan, 9 and fluvoxamine 13 are known CYP2D6 inhibitors. Each compound has an IC50 value in the single-digit micromolar or submicromolar range for its target CYP enzyme. Table 2 and Figure 7 help to illustrate the importance of CYP profiling. As results are brought together, the effects a compound will have on the different CYP enzymes have become apparent or how an individual enzyme will be affected by each lead compound. An example is the antifungal drug miconazole. As stated previously, this compound is a well-known inhibitor of CYP2C9. However, as Figure 8 shows, it is also a potent inhibitor of CYP3A4 and 2D6, which also agrees with the literature. 14,15 The data also show the ability of the automated CYP profiling platform to produce results that agree with previously published values.
CYP450 profiling IC50 values
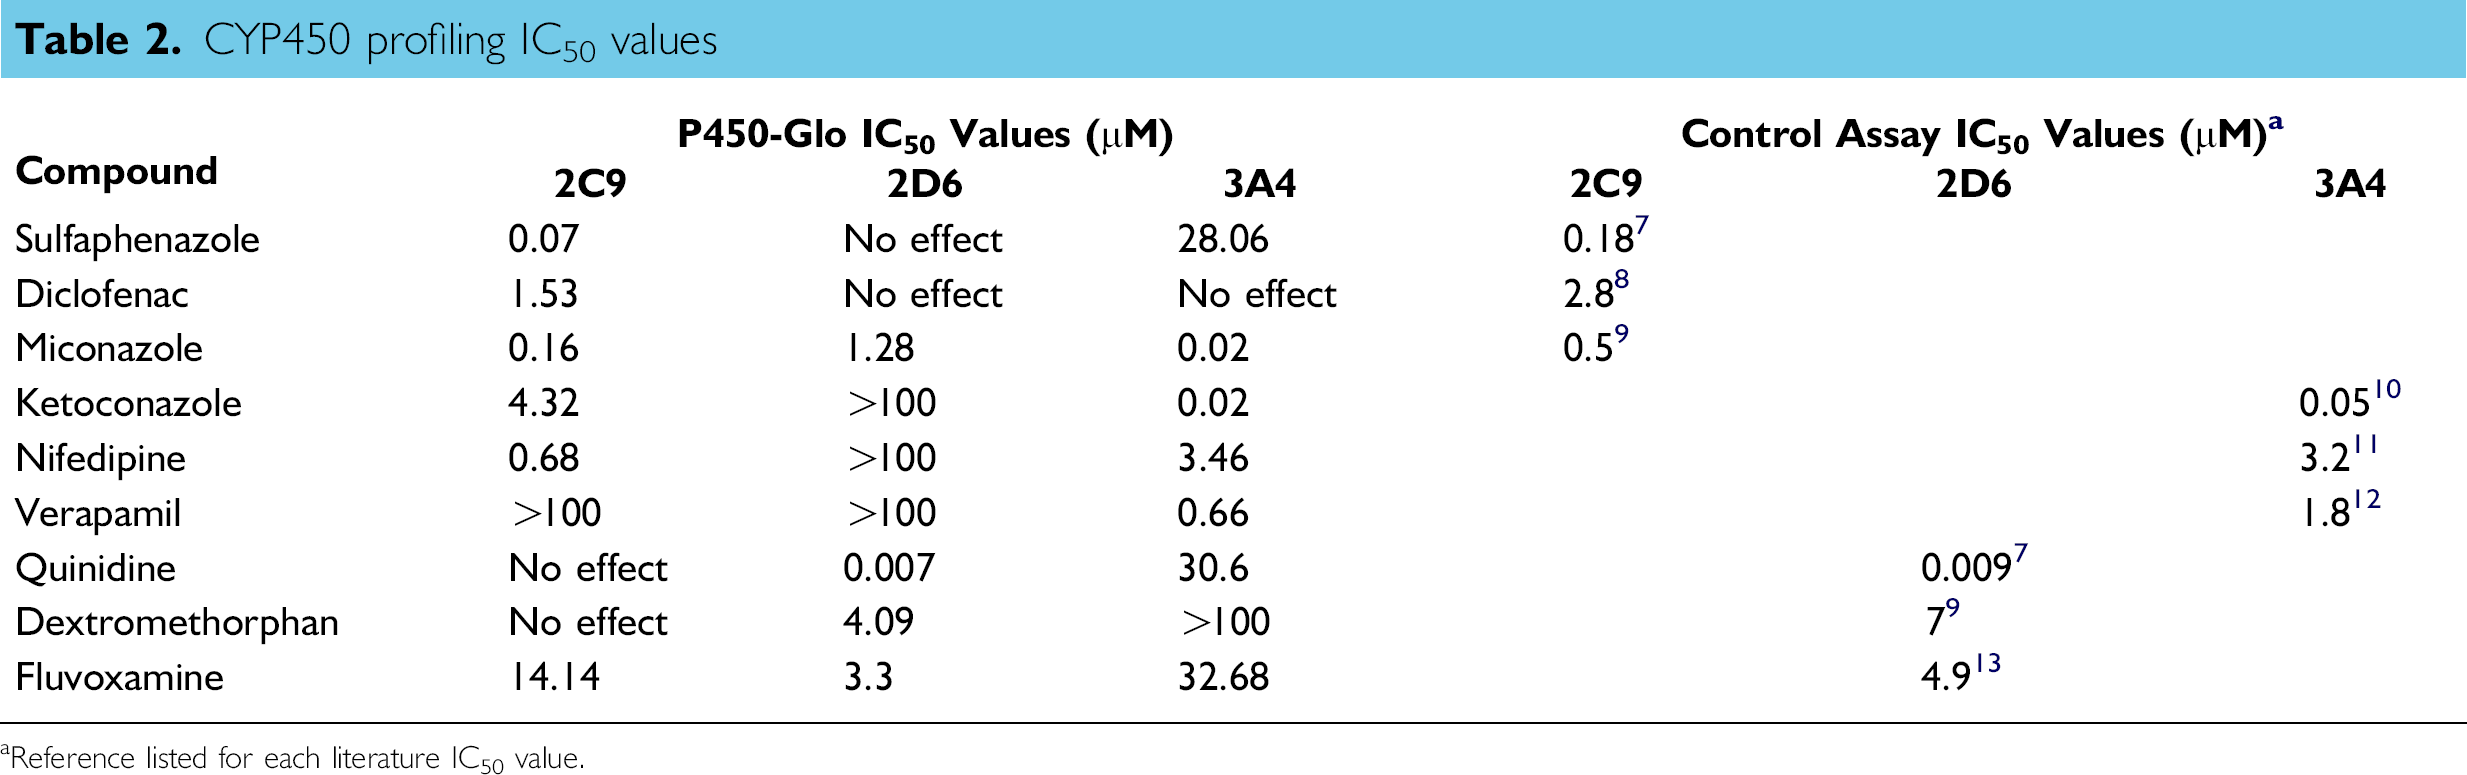
Reference listed for each literature IC50 value.
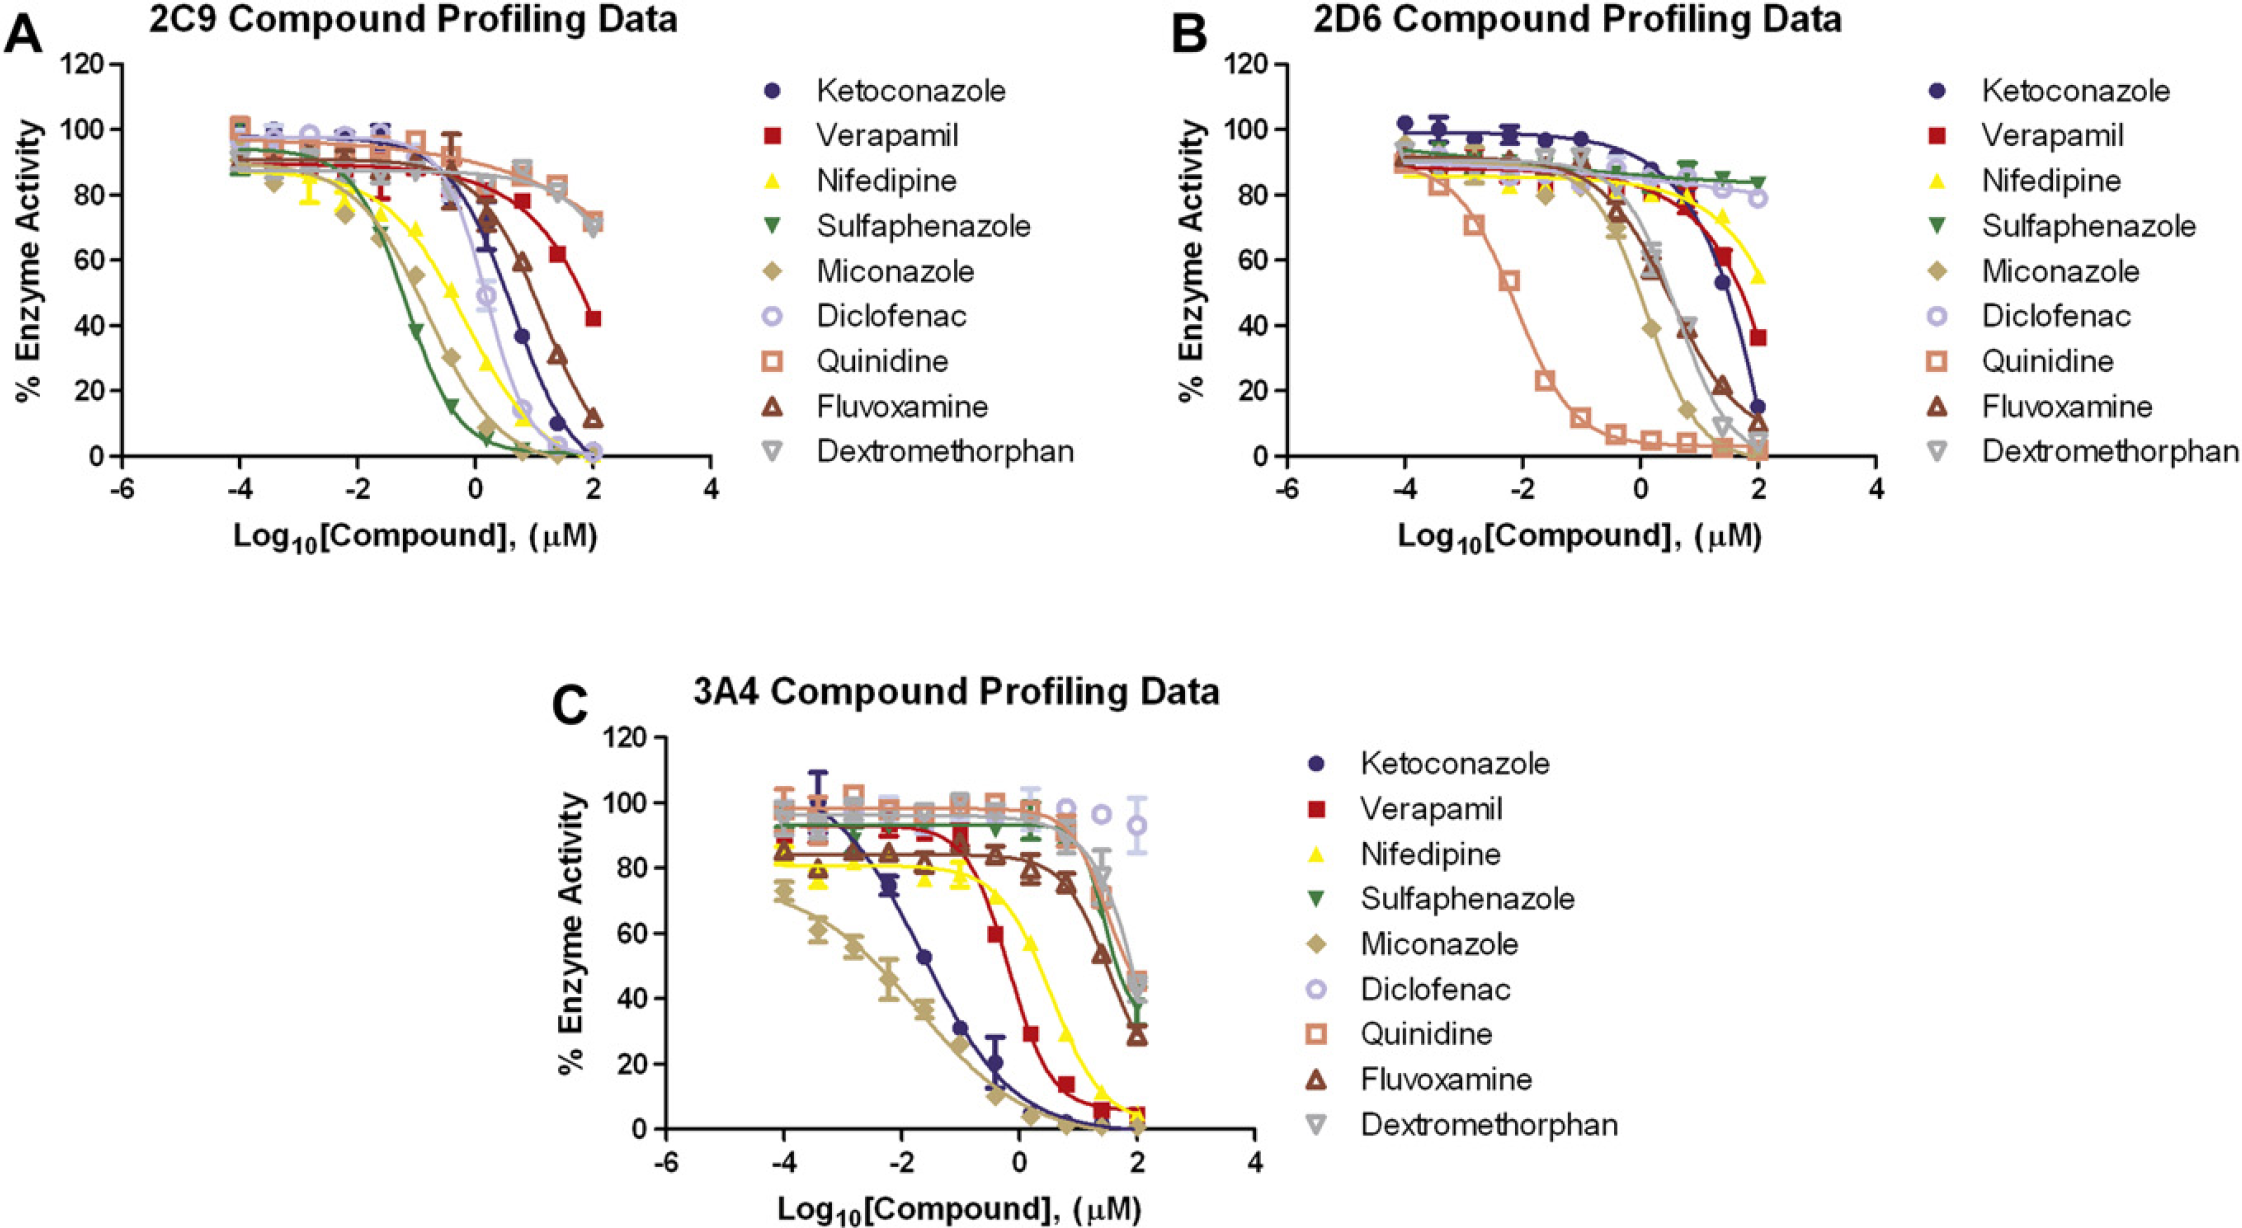
CYP450 compound inhibition curves. Twelve-point titrations of all compounds were created using a starting concentration of 100 μM. All titrations used a 1:4 dilution scheme. CYP450 reaction conditions for 2C9: 0.25 pmol/rxn, 100 μM Luciferin-H, 75 min. 2D6: 0.125 pmol/rxn, 30 μM Luciferin-ME EGE, 45 min. 3A4: 0.05 pmol/rxn, 3 μM Luciferin-IPA, 10 min. Percentage of enzyme activity was calculated as described in the Materials and Methods Data Analysis section and plotted on the Y-axis, based on the Log10[Compound] (X-axis). Error bars represent standard error of n = 4 values.
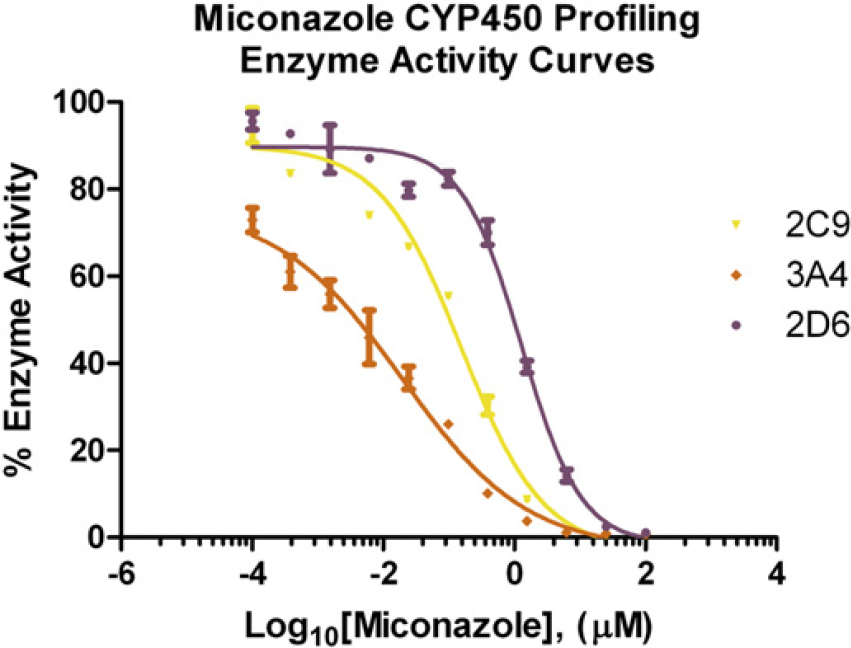
Miconazole CYP450 Profiling inhibition data. Percentage of enzyme activity data from the CYP450 profiling was plotted on the Y-axis for the 2C9, 2D6, and 3A4 isoforms, based on the Logl0[Miconazole] (X-axis). Error bars represent standard error of n = 2 values.
Conclusions
The P450-Glo Screening Systems offer a straightforward and easily automatable way to assess the potential inhibitory effects of lead compounds on CYP enzymes. The profiling process can be easily automated with a pipetting station that can adjust to variable throughput needs. The combination of assay and instrumentation provide a practical solution for automated CYP profiling.
Competing Interests Statement: Brad Larson and Peter Banks are employees of BioTek Instruments, Inc. Jim Cali, Mary Sobol, and Sarah Shultz are employees of Promega Corporation.