
Abstract
Communication data between people is a rich source for insights into societies and organizations in areas ranging from research on history to investigations on fraudulent behaviour. These data are typically heterogeneous datasets where communication networks between people and the times and geographical locations they take place are important aspects. We argue that these features make the area of temporal communications a promising application case for Linked Data (LD)-based methods combined with temporal network analyses. The key result of this paper is to present a framework, tools, and systems for creating, publishing, and analyzing historical LD from a network science perspective. The focus is on network analysis of epistolary network data (metadata about letters), based on recent advances in analysis of temporal communication networks and the behavioural patterns commonly found in them. To test, evaluate, and demonstrate the usability of the framework, this paper shows how network analysis has been applied to (1) the Dutch CKCC corpus (of ca. 20,000 letters), (2) the pan-European correspSearch corpus (of ca. 135,000 letters) with promising results. The tools presented have also been re-used successfully in other related systems, such as LetterSampo Finland (1809–1917) of 1.2 million historical letters.
Introduction
Since the revolution in network science around 20 years ago (Saramä ki & Moro, 2015; Vespignani, 2018; Watts & Strogatz, 1998), this field of research has been extremely successful in explaining various phenomena and fundamental concepts in a wide array of systems from societies to brain and cellular biology. The tools and ideas developed for network analysis allow for different levels of granularity ranging from the whole network to diagnostics computed for individual nodes in the network, such as centrality measures, node roles, and local clustering coefficients. However, these tools are often mainly used by the network scientists as they are difficult to use for the domain experts: accessing them requires programming skills or at least specialized software that relates the often heterogeneous network data and metadata to the questions that are important for the domain experts. On the other hand, there is a need to make the rich datasets created by historians in Digital Humanities (DHs) and the Linked Data (LD) community available for the network scientists.
This paper builds on the idea that Semantic Web technologies 1 (Hitzler, 2021) and LD (Heath & Bizer, 2011; Hyvönen, 2012) can be a solution to these problems. The graph-based RDF data model underlying the Semantic Web is a perfect match for representing network data, and LD publishing (Heath & Bizer, 2011) can be used for making the data available for researchers in humanities with some skills on using SPARQL 2 queries or on programming with SPARQL endpoints. Furthermore, ready-to-use portal solutions for data analysis can be implemented for DH based on such data services (Hyvönen, 2022). The idea is that by combining the flexibility of publishing and using LD with the tools of network science can help domain experts to tackle massive network data in fruitful manner with little or no expertise in programming. Furthermore, the created LD can be served back to the research community for further research and application development in a disciplined and well-defined way by using the Semantic Web methodology (Hitzler et al., 2010) with practical LD publishing principles including SPARQL endpoints.
To test and demonstrate this approach in practice, this paper focuses on communication networks that are represented as temporal networks, a rapidly developing subfield of network science (Holme & Saramäki, 2019; Saramä ki & Moro, 2015). The datasets of historical epistolary data listed in Table 1 are used for case study examples. Temporal networks are a specific type of networks that carry information on the activation times of the links in addition to the topological structure of the networks. In communication networks this means that we do not only consider who has been in contact with whom, but also the exact time instances at which the communication has taken place. This not only adds complications related to how the various methods and measures are generalized for temporal networks, but also creates possibilities of new types of network analysis. For example, in communication networks it has been found that the individuals are in contact in a bursty manner (Goh & Barabási, 2008; Karsai et al., 2011) and they distribute their communication efforts via patterns, known as social signatures, that are specific to each individual (Heydari et al., 2018; Saramaki et al., 2014). These phenomena are understood in terms of statistical laws found in anonymized data, but much less attention has been given on how such features translate to interpretations of individual relationships or people. Here we introduce a method for giving access to these state-of-the-art network analysis methods to domain experts, who work through the massive databases of communications using theoretically grounded analysis tools.
Datasets Analyzed and Discussed in This Paper.

Datasets Analyzed and Discussed in This Paper.
The paper extends our earlier papers related to publishing and analyzing historical epistolary data and LetterSampo (Hyvönen et al., 2023; Ureña-Carrion et al., 2022) by the network science perspective outlined above, and by presenting tools and systems for network analysis. The linked open data (LOD) resources regarding datasets 1 and 2 of Table 1 are available online both as data dumps on Zenodo.org and in a SPARQL endpoint, as described in more detail in Hyvönen et al. (2023). Several domain-specific examples of using a demonstrator for epistolary research are presented in Section 4 and some more can be found in Hyvönen et al. (2023) and in an online video 3 . Using the data service for comparing epistolary network with modern communication networks is discussed in Ureña-Carrion et al. (2022). It should be noted that this paper focuses on presenting a technical framework and approach for applying network analysis and LD technology to publishing and using historical epistolary data in research, not on particular domain-specific analyses of the datasets from a humanities point of view. This remains a proposed topic of further research using the approach and tooling presented.
The paper is organized as follows. First, related work in epistolary historical network studies and temporal network analysis and systems are discussed to contextualize the work of this paper. Next a new data model and datasets conforming to it are presented as well as a LD service platform for publishing them, based on extending the traditional 5-star model to a 7-star and an 8-star model. After this, examples of network analyses using the LD and SPARQL endpoint are presented. To test and demonstrate usability of the new data resource and data service even further, a semantic portal on top of the data service is presented with examples of data analyses. In conclusion, the contributions of the paper and challenges of the proposed approach are summarized and discussed.
Epistolary Historical Networks
During the Age of Enlightenment it became suddenly possible for people to send and receive letters across Europe and beyond, based on a revolution in postal services. This opportunity resulted into what the contemporaries called the Respublica litteraria, Republic of Letters (RofL), a cross-national collaborative communication network that formed a basis for modern European scientific thinking, values, and institutions in Early Modern times 1400–1800. Data sources of early stage of Early Modern learned correspondences are proliferating rapidly, including, for example, Europeana 4 (Doerr et al., 2010), Kalliope Catalogue 5 , The Catalogus Epistularum Neerlandicarum 6 , Electronic Enlightenment 7 , ePistolarium 8 (Ravenek et al., 2017), SKILLNET 9 , correspSearch 10 , the Mapping the Republic of Letters project 11 , and Early Modern Letters Online (EMLO) 12 (Hotson & Wallnig, 2019; Heuvel, 2015; Van Miert, 2016). Visualizing the correspondences has been studied in the Mapping the RofL project 13 and in Tudor Networks of Power. 14 Bruneau et al. discuss applying Semantic Web Technologies to modelling the correspondences of French scientist Henri Poincaré and publishing on an online portal 15 (Bruneau et al., 2021).
The idea of representing epistolary data as a LD service was introduced in Tuominen et al. (2018) using the EMLO data of ca. 160,000 letters, and its application to DH research is discussed in Hyvönen et al. (2023); Ureña-Carrion et al. (2022) pointing out the analogy between RofL and LOD movement with some tooling, data analyses, and visualizations as examples. In this paper, the idea of using the LD Service is developed and discussed further from a network analytic perspective, in relation to the correspondences in the two datasets listed in Table 1. We demonstrate flexibility and scientific potential of using an epistolary LD Service for research in the following ways: (1) Firstly, by transforming and downloading the data into a suitable form, network analytic tools developed originally for different purposes, in our case for contemporary communication data, can be re-used, making it possible to apply them to historical epistolary networks, too. (2) Secondly, based on the Sampo model (Hyvönen, 2022) and Sampo-UI framework (Ikkala et al., 2022), the data service can be integrated seamlessly with tooling for DH research making network analyses possible for researchers who often lack programming experience. (3) Thirdly, it is shown how the LD data service resource can be used for solving DH problems in network science with little programming experience using online programming services, such as Google Colab 16 and Jupyter. 17
The tools presented in this paper have been re-used successfully in developing the LetterSampo Finland (1809–1917) system 18 that has aggregated data about ca. 1.2 million letters sent or received in the historical Grand Duchy of Finland and over 100,000 related persons and organizations (Hyvönen et al., 2025a).
Temporal Network Analysis
In the past few decades, communication data has become a relevant resource to understand the underlying social networks (Onnela et al., 2007; Saramä ki & Moro, 2015). In such cases, auto-recorded logs of pairwise interactions are modelled to construct a communication network, thus allowing the analysis of large-scale societal interactions and behavioural patterns. Here we focus on using epistolary LD about communications to analyze historical correspondence networks of epistolary data but the methodology can equally well be used for modern communication networks, such as those from mobile phone logs, emails and social media platforms (Ureña-Carrion et al., 2022). We identify two main approaches to analyzing such communication datasets according to the handling of temporality of the data (Saramä ki & Moro, 2015; Ureña-Carrion et al., 2022). In a static approach a link is established between two people if there have been epistolary contacts between them, and in a temporal approach, the focus is on the distribution of dyadic interactions and behavioural features that characterize the way that people communicate. However, while most modern datasets attempt capture all auto-recorded communication within a communication channel (e.g., all emails or other communications within an organization (Diesner et al., 2005; Eckmann et al., 2004; Wu et al., 2010)), this may not be true for historical data, since its collection is not automated, but implies broad manual compilation efforts by researchers.
For the static approach, a network is aggregated from dyadic interactions within a certain period or region. A link is created between two people if there has been some contact, and a proxy may be assigned for the strength of a tie based on, for example, the total number of contacts (Onnela et al., 2007). From such static perspective it is possible to analyze large-scale properties of the resulting networks, including the degree distribution (i.e., the number of contacts of each node), different centrality measures (i.e., metrics to capture the relative importance of nodes within the network), or measures of the existence of communities or other types of structures.
For the temporal approach, a myriad of models have been proposed to analyzing network evolution (Saramä ki & Moro, 2015); we focus on the distribution of time sequences of dyadic interactions, along with behavioural characteristics of how individual people communicate with their neighbours. From a sociological standpoint, the Granovetter Effect relates the notion of tie strength to network topology, noting that strong ties tend to be buried in overlapping circles of friends, akin to small communities where weak ties serve more as bridges between such communities (Granovetter, 1973; Onnela et al., 2007). Since it is not possible to directly observe the strength of a tie, it is possible to use different temporal features as proxies (Ureña-Carrion et al., 2020). Regarding the relationship of particular nodes to their neighbours, previous research (Heydari et al., 2018; Saramaki et al., 2014) has shown that individuals divide their contacting behaviour across their different neighbours in a persistent manner, known as a node’s social signature, which is more stable in time than the neighbours themselves.
Using LD for Network Analysis
The idea of using LD graphs in network science is intuitive, natural, and not new. For example, in Groth and Gil (2011) LD is transformed for network analysis for the LinkedDataLens system. In Raji and Surendran (2016) RDF data is used for Social Network Analysis. Data from different sources can be aggregated into larger networks and enriched by each other and by inferring new triples, that is, connections in the network. SPARQL queries and SPARQL CONSTRUCT can be used in flexible ways for network data transformations and creating tabular formats widely used. To facilitate network analysis and visualizations of RDF data there are tools available, such as the Semantic Web Import Plugin plugin 19 available for Gephi 20 , arguably the leading visualization and exploration software for all kinds of graphs and networks. Applications of Gephi include, for example, Exploratory Data Analysis, Link Analysis, Social Network Analysis, and Biological Network Analysis. A major contribution of our paper is to apply network analysis in a novel application domain for analyzing historical epistolary communication networks, and especially by using temporal network analysis. For this purpose, a new LOD resource is presented and used.
A LD Model and Service for Epistolary Data
This paper makes use of the epistolary datasets listed in Table 1. In our work, these datasets were transformed into LD and published according to the LD publishing principles and other best practices of W3C (Heath & Bizer, 2011), including, for example, content negotiation and provision of a SPARQL endpoint. The CKCC corpus is to the best of our knowledge the first public linked open dataset on the Web on historical epistolary data; opening the publication of the correspSearch data in a similar way is done after getting a confirmation of the open license from the data owner.
Data Model for Linked Epistolary Data
By transforming the epistolary data into RDF we aimed to create knowledge graphs that include not only communication networks but also prosopographical data about the people and organizations involved. For this purpose a customized RDF-based metadata schema was created. The schema contains four different, interlinked classes: Letter, Actor, Tie, and Place as described in Table 2. Here the default namespace is the dataset-specific (lssc), rdfs refers to the RDF Schema 21 , crm to the CIDOC CRM Schema 22 , geo to WGS84 Geo Positioning vocabulary 23 , skos to SKOS Simple Knowledge Organization System namespace 24 , and xsd to the XML Schema of W3C. 25
RDF Schema for Letter, Actor, Tie, and Place.
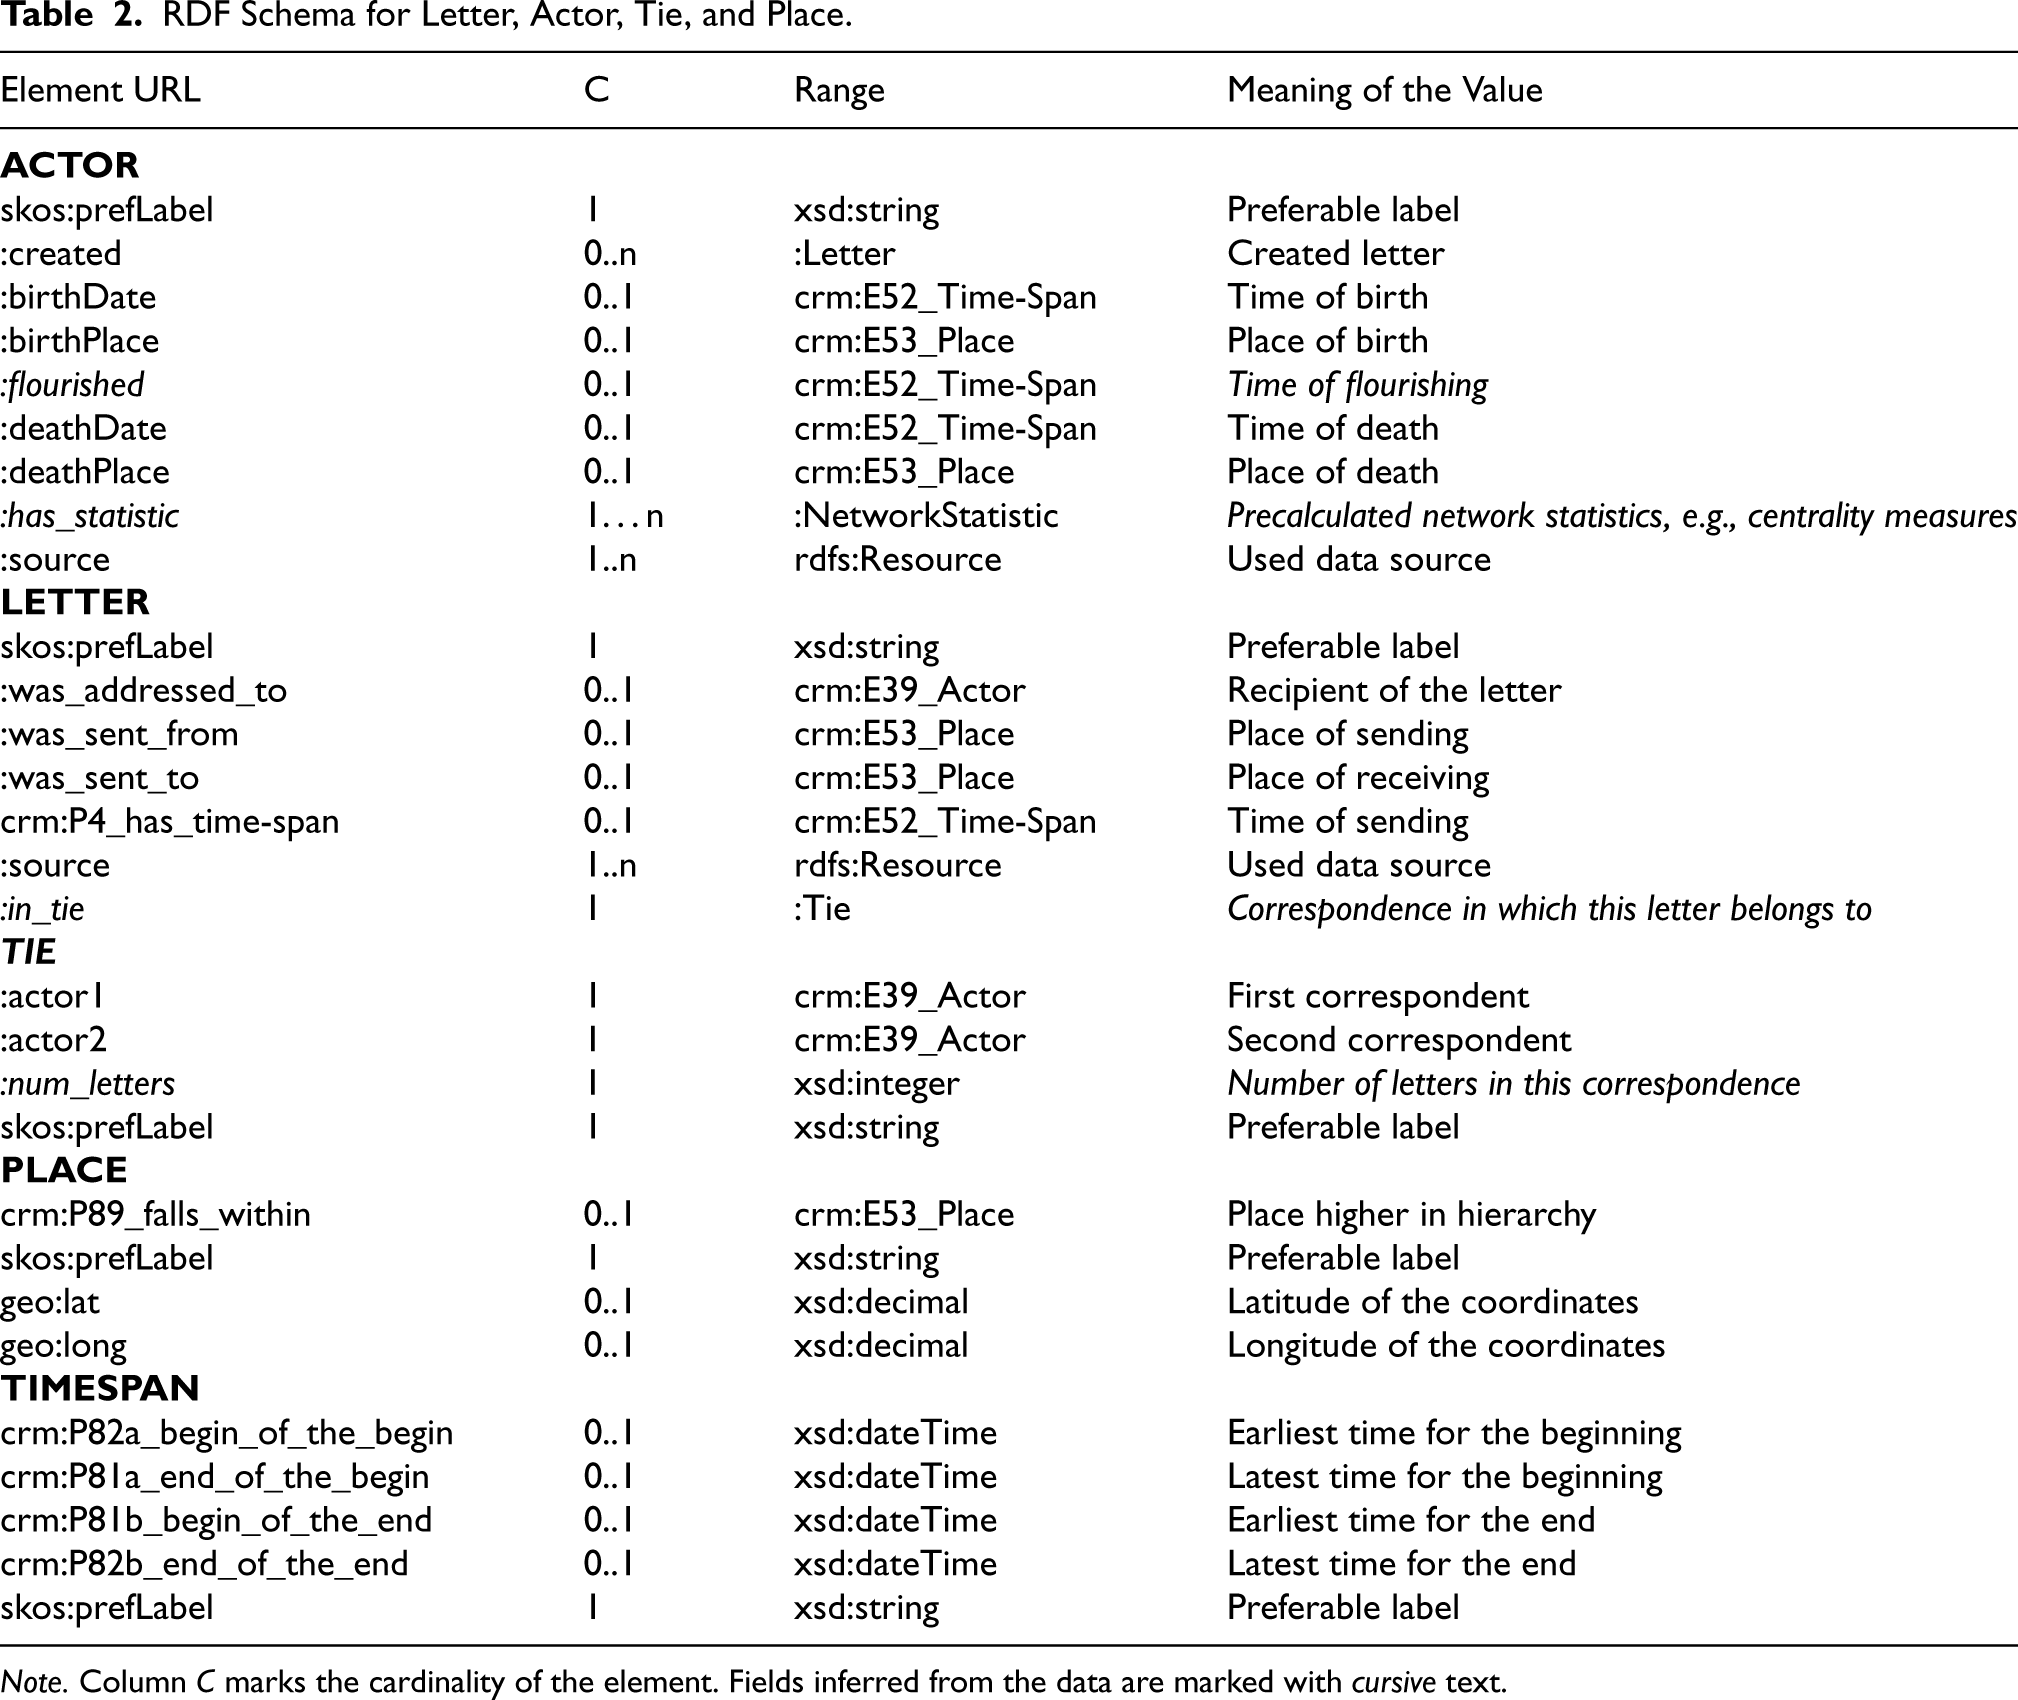
RDF Schema for Letter, Actor, Tie, and Place.
Note. Column C marks the cardinality of the element. Fields inferred from the data are marked with cursive text.
The design choices are based on the principles developed in the EMLO project (Tuominen et al., 2018). In the epistolary dataset, instances of the class Actor can be either people or groups. Each actor is connected to the sent letters using the property :created in a triple where the actor is the subject and the letter is the object. Each letter is modelled as an instance of the class Letter that has seven properties describing the letter. A letter is linked with its recipients using the property :was_addressed_to, to places of sending and receiving using the properties :was_sent_from and :was_sent_to, and to related timespan with crm:P4_has_time-span. Furthermore, a letter instance is enriched with information about the data source and a human-readable description. The correspondences between two actors are modelled as instances of the class Tie. Each of these instances is linked to the two actors and likewise each letter is linked to the corresponding tie. Using the Tie instance simplifies the database queries, for example, in cases of querying all the letters between the two actors. In addition, this model facilitates to adding precalculated network metrics such as node degrees and centrality measures to the data model. In addition, the data set also contains precalculated values for the time of flourishing for each actor, for example, the time period when the actor has been active in letter correspondences. The resources in the domain ontology of the places consist of place labels, the coordinate information, and the hierarchy built with the property crm:P89_falls_within. Finally, the timespans follow the four point model, for example, with xsd:dateTime values indicating the earliest and latest moments for the beginning and the end.
The two datasets, CKCC and correspSearch, were converted and harmonized from different source formats. CKCC is an extract from an existing RDF dataset (Tuominen et al., 2018), while the correspSearch data was converted from a source published in the CMI format (Dumont, 2016). In these datasets both the actor and place resources had linkage to external LOD cloud databases, for example, Wikidata, VIAF, EMLO project, or database of Deutsche Nationalbibliothek 26 (GND). This existing linkage was used for two main purposes. First, in the current data publication, the resources in the datasets where reconciled based on the links, for example, the actors or places refer to the same entity, if they point to the same external link. Secondly, the external databases were used to enrich our data, for example, with images of actors and coordinates of the places. In our work, the “FAIR 27 guiding principles for scientific data management and stewardship” of publishing data are used.
The data can be used for research via (1) ready-to-use tools available on a semantic portal or (2) by using the underlying SPARQL endpoint with external tools, based on a framework called LetterSampo (Hyvönen et al., 2023). The SPARQL endpoint can be used directly in DH research using, for example, Yasgui 28 (Rietveld & Hoekstra, 2017) and Python scripting in Google Colab or Jupyter notebooks. The endpoint can also be used for filtering and downloading the data in different forms, such as in tabular CSV format, for external data-analysis tools, in our case for network analyses.
This framework is used for creating data services and semantic portals 29 based on the Sampo model (Hyvönen, 2022) for sharing collaboratively enriched LOD using a shared ontology infrastructure. The portals host ready-to-use data-analytic tools for DH research, as suggested in Hyvönen (2020). The Sampo-UI framework (Ikkala et al., 2022) is used as the interface model and as the full stack JavaScript tool. Sampo portals are based – from a data perspective – on querying the SPARQL endpoint from the backend side using JavaScript. The portals in the Sampo series demonstrate the idea that versatile web applications can be implemented by separating the application logic and data services via SPARQL API, which arguably facilitates developing new applications efficiently by re-using the same data.
Querying and Rendering Networks on a Web Portal
The networks in the portal pages are constructed using a customizable back-end service Sparql2GraphServer (Leskinen et al., 2021). It was developed to meet the requirements for querying and constructing a network from any SPARQL endpoint. It builds a Sampo-UI compatible network based on SPARQL queries. It is a Python application built on Flask 30 framework using modules SPARQLWrapper 31 and NetworkX. 32 The visual appearance of the network on a portal page is configured in the front-end Sampo-UI settings. The back-end service is used in other portals in the Sampo series like AcademySampo Leskinen et al. (2022) and ParliamentSampo Hyvönen et al. (2025b). Figure 1 depicts a network extracted from Wikidata, it illustrates the teacher–student relationships starting from German polymath Gottfried Wilhelm Leibniz.

Social network of polymath Gottfried Wilhelm Leibniz in Wikidata.
The CKCC knowledge graph 33 as well as the correspSearch knowledge graph 34 have been published on the LD Finland platform LDF.fi (Hyvönen et al., 2014). Both dataset are also available at Zenodo. 35 LDF.fi uses the 7-star Hyvönen et al. (2014) and 8-star models Hyvönen and Tuominen (2024) for LD deployment that extends the 5-star model 36 coined by Tim Berners-Lee: to enhance re-usability of LD, the sixth star is given if the data is published with its schema, the seventh star if validation results of the data using the schema are provided, and the eighth star if guarantees for truthfulness of the data are provided. LDF.fi is powered by the Fuseki SPARQL server 37 and Varnish Cache web application accelerator 38 for routing URIs, content negotiation, and caching. The portal user interface was implemented by the Sampo-UI framework (Ikkala et al., 2022). The system uses Docker microservice architecture containers. 39 By using containers, the services can be migrated to another computing environment easily, and third parties can re-use and run the services on their own. The architecture also allows for horizontal scaling for high availability, by starting new container replicas on demand. The framework has also been used in the Constellations of Correspondence (CoCo) project 40 on correspondences in the Grand Duchy of Finland in the 19th century (Tuominen et al., 2022).
Network Analyses Using the LD Service
In this section we first show some general network analyses results of the epistolary datasets of Table 1. After this, it is shown how the SPARQL endpoint can be used for research using querying and by programming. For these purposes, examples using the data with custom network analytic tools, Yasgui and Google Colab are presented, respectively. Finally, analyzing the data with ready-to-use tools and the two-step analysis model of the LetterSampo portal is discussed with examples.
Exporting Data for Data Analyses
A simple way of reusing the data resources is to download and transfer them for the analysis tool of choice. For this purpose either data dumps from Zenodo or the SPARQL endpoint can be used. A benefit of using the endpoint is that the data can be filtered and even transformed during the download to fit better for the aimed purpose. An example of using the data resource in external network analytic tools is presented in Ureña-Carrion et al. (2022). In this case study, the LD of CKCC and correspSearch were analyzed in terms of network metrics and compared with four modern datasets of mobile phone networks, emails, community boards, and wall postings on a social media platform. It turned out that contemporary and historical epistolary communication networks resemble each other strikingly even if the media were quite different.
General Analyses on Epistolary Networks
The knowledge graph also includes precalculated centrality measures for each actor. First, a correspondence network was created from the RDF data and thereafter the measures where calculated using the Python library NetworkX. These measures are based on a network containing both the CKCC and correspSearch datasets.
An example of the measures for French philosopher and scientist Renè Descartes are listed in Table 3. In the table, for example, the Clique Number with a value of 4 indicates that Descartes is a part of complete subgraph where all the nodes have a degree of 4, and the rank of 14 indicates that there are 13 larger cliques in the entire network. The Weighted Out- and In-Degrees correspond to the total number of sent and received letters while the Number of Correspondences equals the unweighted node degree. Also, the Actors perspective of the LetterSampo portal has a socio-centric network visualization where the actors can be filtered, for example, by their gender, years of living, or data sources.
Precalculated Network Measures for Renè Descartes.

Precalculated Network Measures for Renè Descartes.
For the analyses presented in this article, there are basically two practices for using a SPARQL endpoint. Firstly, for showing the data results on the web portal, the tabular results of a relatively simple query are shown on the portal page. An example of such a query is shown in Figure 2. It queries all letters sent by Descartes and shows their recipients, labels, and dates sorted by the date. Secondly, analyzing or visualizing network structures may require several database queries, for example, for separated lists of actors (nodes) and letters (edges). The actual results are thereafter calculated based on the data of these simple, straight-forward queries with spreadsheet-like results.

SPARQL example for querying the letters by Renè Descartes.
Also a portal demonstrator 41 based on the aggregated CKCC and correspSearch LOD was published on the Web for public use (Hyvönen et al., 2023). The portal provides components for visualizing epistolary data using line charts, maps, and networks. Figure 3 depicts an egocentric network around Descartes. In this visualization, the widths of the edges are proportional to the number of letters between the two actors while the sizes of the nodes are based on the length of the shortest path between the nodes so that the main actor appears with the largest node and the most distant actors have the smallest nodes. In spite of Descartes being the centre actor, Constantijn Huygens has a higher node degree due to the fact that the CKCC dataset contains a larger amount of letters by him.

Network of correspondences around Renè Descartes.
Figure 4 depicts a visualization of the social signatures (Heydari et al., 2018; Saramaki et al., 2014) of Descartes. Social signatures represent how individuals communicate with their neighbours in a given time. This visualization has curves for his entire time of flourishing (blue line) and separated curves during his career, for example, the purple line for time period 1643–1650. For an interval (e.g., 1631–1637, 1637–1643), a social signature is obtained by (1) computing the fraction of outgoing contacts per alter, and (2) ranking the alters. In the chart, like for instance the highest value of the yellow line is 0.368 indicating that Descartes wrote 36.8% of his correspondences to the top ranked alter, and likewise 33.3% to the second alter. This approach allows characterizing the relative importance of different alters in an ego network. When comparing different individuals, it is found that their social signatures tend to be stable (Heydari et al., 2018; Saramaki et al., 2014; Ureña-Carrion et al., 2022).

Chart depicting the social signatures of Renè Descartes.
Due to the performance issues when attempting to render a larger network of more than, for example, 1000 nodes on a browser page, data was further visualized in Google Colab environment using Python. As an example, the largest connected component of the CKCC data is visualized in Figure 5. The network is built around three central actors: Dutch poet and composer Constantijn Huygens, philosopher Hugo de Groot, and mathematician and physicist Christiaan Huygens, who have high node degree values. On the other hand, there is a multitude of actors with low node degree. As a comparison, the correspSearch data in Figure 6 has much more of these hubs.

Network of CKCC data.

Network of correspSearch data.
Figure 7 depicts the correspondences of Descartes on a timeline. The entire timeline is shown on the lower part of the chart. On the upper part of the chart there are separately the ten most active correspondences of Descartes and the lowest line depicts the correspondences with all the other actors. The visualization also reveals biases caused by missing information in the source data. For example, when studying the correspondence with French philosopher and mathematician Marin Mersenne, it can be observed that the source collections contain 134 letters from Descartes to Mersenne, but only five by Mersenne to Descartes.

Timeline depicting top 10 letter correspondences of Renè Descartes.
Figure 8 depicts the most active scientists by the decades 1620–1690. The ranking is based on the total amount of sent and received letters and the data is visualized so that the first ranking scientist is on the top of the chart. The figure depicts that from 1620 to 1640 Descartes is on the first rank, but later replaced by Christiaan Huygens. The code is available on GitHub 42 including a link to notebook in Google Colab.
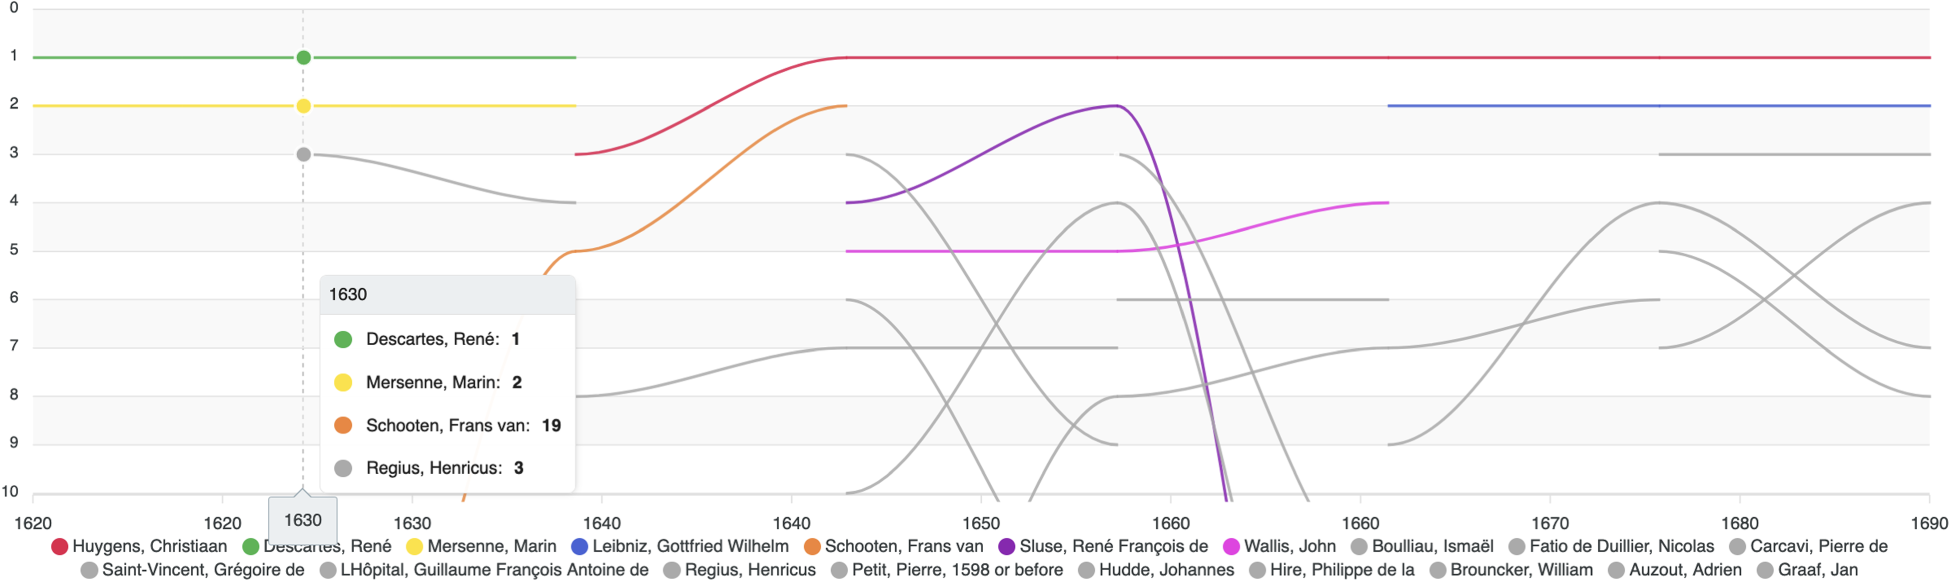
Top scientists in the CKCC data during 1620–1690.
Figure 9 depicts the temporal evolution of the hubs in CKCC. In the figure, each vertical rows on the x-axis corresponds to an actor and the years 1600–1700 are shown on the y-axis. To produce the image, the correspondence network of the 17th century was split into induced subgraphs each containing the correspondences during a time window of 2.5 years. From each subgraph twelve actors with highest total degrees are shown in the figure so that the one with the highest ranking has the brightest red colour. In the figure, the highest ranking actors Hugo de Groot, Constantijn Huygens, Christiaan Huygens, and Antoni van Leeuwenhoek stand out as the highest columns with red dots. One can notice that the highest ranking ones remain active during almost their entire time of floruit. On the other hand, 59.0% of people appear in the figure only once as a single blue dot. The code to produce this image is available on GitHub 43 including a link to notebook in Google Colab.
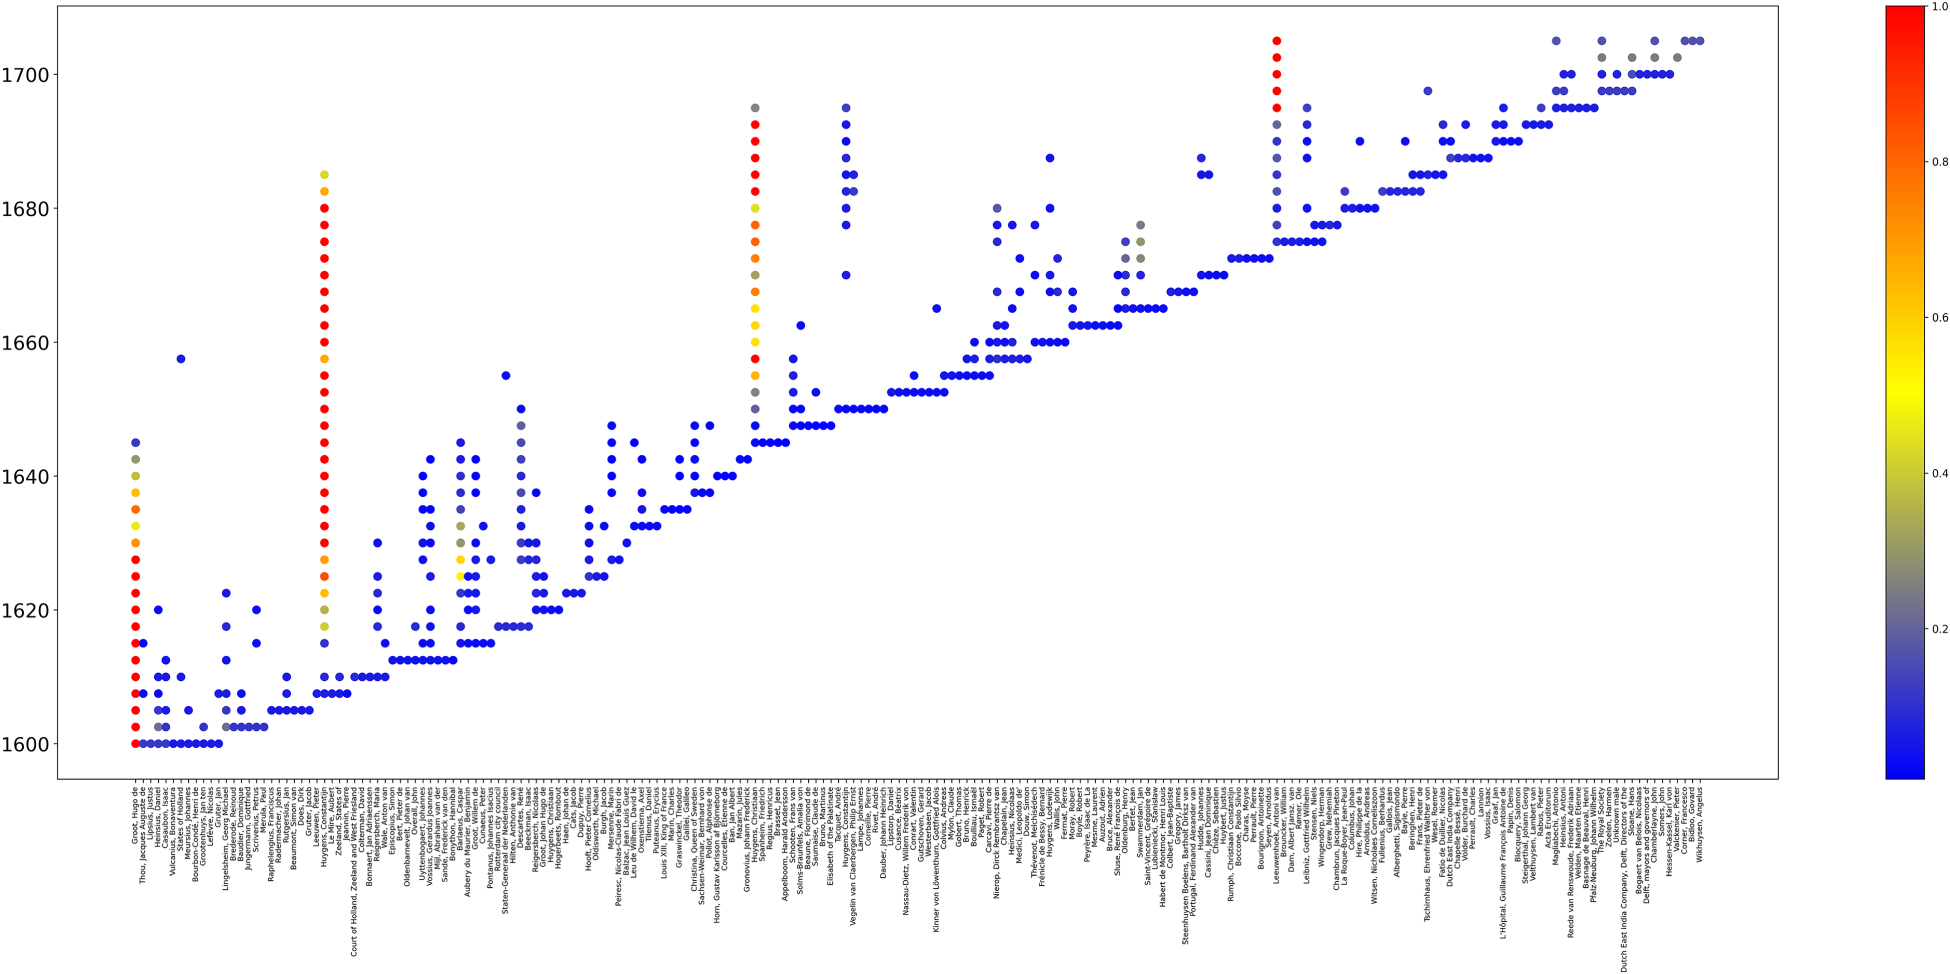
Evolution of ranking during the 17th Century in CKCC data.
As a use-case scenario, a comparative analysis of historical and contemporary communication networks was performed, with results formally introduced in Ureña-Carrion et al. (2022). In this study, the goal was to compare aspects of temporal communication networks at different granularity levels, including snapshots of static graphs, the time series of dyadic interactions, as well as ego networks. We compare these features with different contemporary communication channels, including emails, social media platforms, forums, and mobile phone calls.
In brief, the goal was to analyze to what extent different behavioural features of contemporary communication networks can be found in historical datasets. We find similarities at different degrees of success. Particularly, we find evidence for the persistence of social signatures in historical context, as well as the Granovetter effect for different proxies of tie strength, and important similarities in the distribution of dyadic timings. We found, however, difficulties in drawing conclusions from global network analyses, particularly given that some individuals are over-represented in historical datasets and the data is biased.
Regarding social signatures, the results suggest that individuals divide their communication similarly across top-ranked alters; in other words, that the social signatures of a given individual are more similar among different periods than to the signatures of different egos. These results were consistent across different filters for the constructions of ego networks. Taken together, they suggest that in practice individuals allocate time and resources systematically when communicating. Regarding the Granovetter effect, it is found that stronger ties are associated with overlapping circles of friends, a feature that persists even when considering different proxies for the strength of ties. While these results have been previously observed in contemporary datasets (Heydari et al., 2018; Onnela et al., 2007; Saramaki et al., 2014; Ureña-Carrion et al., 2020), historical datasets bring an added value on two fronts: (1) They provide evidence for human communication patterns in a distinct context – contemporary examples are usually the result of auto-recorded digital logs, and are thus representative of modern practices. (2) They provide a time frame that is unachievable in contemporary datasets, where samples of ego networks are examined across different decades and where aggregate network evolution spans centuries.
Discussion
This paper presented tools and systems for analyzing networks of epistolary LOD. Of datasets discussed, CKCC and correspSearch datasets are, to the best of our knowledge, first LOD-based epistolary datasets available on the Semantic Web. Examples of analyzing and visualizing the network data were presented and discussed using SPARQL querying and Python scripting as a proof-of-concept of the usability of the data resources and the tools presented. The aggregated data of these two datasets are openly available for the research community for related analyses. We also demonstrated the idea of developing applications, that is, semantic portals, on top of the data service that require no programming skills from the end user.
This paper focussed on presenting, discussing, and illustrating design principles for publishing and using epistolary network data as LD, not on presenting actual analysis results of particular datasets. This remains a topic of further research, but the first experiments presented show in our opinion that the framework and the published resources, the LOD and data service at LDF.fi, and the LetterSampo portal are promising in filtering our patterns of possibly interesting phenomena in Big Data using distant reading (Moretti, 2013). However, traditional close reading by a human is needed as usual in interpreting the results.
A major challenge in creating data analyses like the ones shown in this paper is related to the quality of the data produced. Historical (meta)data is typically incomplete and our knowledge about it is uncertain. Also using more or less automatic means for transforming and linking the data leads to problems of incomplete, skewed, and erroneous data (Mäkelä et al., 2020). In historical epistolary data in particular, the data is seldom complete as only part of the letters have survived or are included in the data available. The data is often also biased in different ways because historical data is often a result of a collection process performed by humans. For example, only letters of significant people have typically been collected in archives. It is therefore difficult to compare the underlying network with some modern networks, such as mobile phone networks, where the data has not been subject to human selection and is complete. This problem could be addressed by collecting data in unbiased ways or by trying analyze afterwards in what ways the data is biased.
Errors and conceptual difficulties in modelling complex real-world ontologies become sometimes embarrassingly visible when using and exposing the knowledge structures to end users. For example, labels in a certain language may be missing, duplicate records could be found, and historical geogazetteers used in facets should be different depending on the time, which is difficult to represent. On the other hand, we have learned, for example, in Ahola and Telma Peura (2025), that this can also be very useful for the data owners to clean their data. The same problems exist in traditional systems but are hidden in the non-structured presentations of the data. In general, more data literacy (Koltay, 2015) is usually needed from the end user when using data analytic tools.
The methods of network analysis can be very sensitive to even small errors in the data or biases in the sampling schemes. For example, the values of betweenness centrality can dramatically change by removal of even a single link, or long silences in communication in historical data can be explained by missing data from some historical period rather than inherently bursty communication tendencies. While computing various measures based on network data can be relatively simple with tools that are introduced here, the remaining challenge is to correctly interpret the results. This requires expert knowledge both in the domain to know how the data is biased and the methods to know how this affects the various measures. In the future, sampling schemes and missing data could be encoded in the data framework and the measures could be adopted to handle these situations. However, this work would first need to be done within the domains (e.g., encoding sampling details of historical correspondence) and the development of network methods (e.g., measures that consider missing data Kivelä & Porter, 2015).
The datasets CKCC and correspSearch contained linkage to external LOD cloud databases which facilitated enriching the data by extracting, for example, information about the lifespans of the actors or geological metadata of places. Communication networks are easily huge, consisting of millions of links, which causes performance issues when, for example, querying the database or rendering a large network on the web portal.
The LetterSampo portal is based on the Sampo model and “standard” Sampo-UI user interface (Ikkala et al., 2022; Rantala et al., 2023). A formal evaluation of this UI model has been done with the functionally similar MMM portal (Burrows et al., 2020a, 2020b) with promising results: the portal was deemed an excellent tool, and very easy to use. However, the testers also made some suggestions for further development and noted that it is not easy to differentiate the challenges between the quality of the underlying data and portal design. Using a SPARQL endpoint directly for data analyses as in LetterSampo has been deemed useful (Burrows et al., 2021). It provides the researchers with a flexible way to access their enriched data and facilitates finding interesting knowledge from the data (Engels, 2020).
In spite of the challenges inherent in historical epistolary data, application of network analysis to the data can be useful for the researchers in finding out potentially interesting patterns of knowledge for closer study in datasets that are too big or complex for traditional manual means only. The new LOD resources and applications presented in this paper can now be used for this purpose.
Footnotes
Acknowledgements
We thank Arno Bosse, Howard Hotson, and Miranda Lewis for earlier collaborations during the Cultures of Knowledge project at the University of Oxford, funded by the Mellon Foundation, Charles van den Heuvel and Dirk van Miert for discussions related to CKCC, as well as colleagues in the EU COST Action project Reassembling the Republic of Letters 44 . Stefan Dumont provided the correspSearch data for our use.
Funding
The authors received the following financial support for the research, authorship, and/or publication of this article: This work was part of the Open Science and Research Programme 45 , funded by the Ministry of Education and Culture of Finland, and the EU project InTaVia: In/Tangible European Heritage 46 , and is related to the EU COST action Nexus Linguarum 47 on linguistic data science. CSC – IT Center for Science 48 provided computational resources.
Declaration of Conflicting Interests
The authors declared no potential conflicts of interest with respect to the research, authorship, and/or publication of this article.