
Abstract
Study Design
Diagnostic accuracy study.
Objective
Prior evaluations of frontier models as radiology decision-support tools relied on 2-dimensional images or text reports; their ability to interpret volumetric data remains unclear. This study assessed Google Gemini 3 Pro for grading lumbar spinal canal stenosis on video lumbar magnetic resonance imaging (MRI) and evaluated diagnostic accuracy, agreement with neuroradiologist consensus, and the effect of localizer-assisted input.
Methods
The Radiological Society of North America (RSNA) 2024 Lumbar Spine Degenerative Classification Dataset, with American Society of Neuroradiology (ASNR) consensus labels, served as a reference benchmark; interobserver agreement among contributing readers was not reported. 100 examinations yielded 500 disc-level observations (371 normal/mild, 74 moderate, 55 severe), demonstrating marked class imbalance. Native imaging series were converted into synchronized video montages. Gemini 3 Pro generated one grade per disc level with and without localizer overlays. Primary outcome was linearly weighted kappa (κw); secondary outcomes included class-wise performance, severe-case error patterns, and overall accuracy.
Results
Without localizer, overall accuracy was 75.6% (378/500) with fair agreement (κw = 0.39). Severe stenosis sensitivity was 41.8%; 43.6% of severe cases were downgraded to normal/mild, and 58.2% to non-severe. With localizer overlays, accuracy was 73.2% (366/500) with κw = 0.32, and severe sensitivity decreased to 30.9%; severe-to-normal/mild misses increased to 52.7%. Differences were not significant.
Conclusions
Gemini 3 Pro showed fair agreement with the neuroradiologist consensus benchmark, but apparent overall accuracy was inflated by the majority normal/mild class and masked clinically unacceptable under-detection of severe stenosis. Localizer-assisted input did not improve performance.
Keywords
Introduction
The medical image interpretation performance of current multimodal vision frontier models (M-VFMs), which are state-of-the-art large language models with integrated visual processing capabilities, is heavily biased toward text rather than true image-based analysis.1–4 Khazanchi et al and Ziegeler et al demonstrated that M-VFMs are effective at simplifying language or extracting structured findings in lumbar spine images, but frequently omit or misrepresent clinically essential details.5,6 These models tend to produce clinically aligned conclusions when they report incongruent image findings.
Importantly, M-VFMs natively accept Digital Imaging and Communications in Medicine (DICOM) files, thereby losing modality-specific metadata, such as sequence parameters and slice spacing.3,7 Lee et al described a technique for converting DICOM stacks into video-like formats that allow multimodal models to treat them as images. 8 However, this conversion sacrifices radiologic fidelity, resulting in irreversible loss of quantitative radiographic features, including Hounsfield units, radiomic signatures, and intensity data.9,10
In late 2025, Gemini 3 Pro (Google DeepMind, London, UK) was released as a general-purpose M-VFM capable of interpreting medical images and achieving strong performance on public benchmarks, such as the Visual Question Answering in Radiology benchmark.11,12 On Radiology’s Last Exam (RadLE v1), a benchmark requiring free-text diagnosis of expert-curated static radiologic images, Gemini 3 Pro outperformed radiology trainees (51% vs 45%) but not board-certified radiologists (∼83%). 13 Despite its superior performance relative to other commercial models, the medical literature has not yet evaluated its radiographic image interpretation capabilities. Prior studies have demonstrated that accurate video-based radiologic data interpretation is achievable with deep learning (DL) models; however, these models differ from M-VFMs, as they require training data and validation pipelines, rendering them clinically impractical.14,15 Whether a generalist multimodal model can safely identify severe stenosis is clinically important because high-grade canal narrowing can influence specialist referral and surgical decision-making when aligned with symptoms. Gemini 3 Pro was selected a priori as the index model because it was a commercially accessible frontier M-VFM that was operationally compatible with our full-video lumbar MRI workflow. This pragmatic choice also aligned with the broader emergence of video-capable multimodal systems for radiology and 3-dimensional medical image interpretation.7,8
In our pilot workflow, we provide the first systematic evaluation of the general-purpose multimodal foundation model Gemini 3 Pro, using full-video lumbar spine magnetic resonance imaging (MRI) for stenosis grading that requires spatial orientation across many frames, compared with expert neuroradiologist consensus.
Methods
Study Design and Objective
This study evaluates the ability of Gemini 3 Pro to interpret 3-dimensional video-based MRI inputs for grading lumbar spinal stenosis and to determine whether the multimodal vision frontier model could achieve diagnostic agreement with a consensus panel of 60 volunteer neuroradiologists using an ordinal three-tier scale (normal/mild, moderate, severe) across five lumbar disc levels (L1/2-L5/S1). Model performance was assessed by comparing it with expert consensus to establish benchmarking accuracy metrics. Because case-level interobserver agreement for contributing readers was not reported, this consensus was treated as a pragmatic benchmark rather than a formal gold standard.
Data Source and Reference Standard
Reference standard labels were sourced from the 2024 Radiological Society of North America (RSNA) Lumbar Spine Degenerative Classification Dataset. Expert consensus grading was conducted under the oversight of the American Society of Neuroradiology (ASNR). It is a collection of over 2600 MRI scans of the lumbar spine annotated by approximately 60 volunteer radiologists recruited by RSNA, the American Society for Spine Radiology, and ASNR to identify the location and severity of five degenerative conditions across the five intervertebral disc levels (L1/L2, L2/L3, L3/L4, L4/L5, and L5/S1). The imaging data, including over 8500 image series (sagittal T2, axial T2, and sagittal T1), were provided by 12 institutions worldwide. Initially assembled in 2024 for the RSNA Lumbar Spine Degenerative Classification artificial intelligence challenge hosted on the Kaggle platform, 16 it represents the largest publicly available collection of its kind. Additional information about the dataset and how to use it is provided in the data resource publication listed below, as well as on the Kaggle competition website, which also offers access to models developed during the competition. Accordingly, the RSNA labels were used as a pragmatic reference benchmark for this study. However, the dataset documentation does not report interobserver agreement among contributing readers, so the benchmark reflects curated consensus labels rather than a validated gold standard.
Central spinal canal stenosis was graded using the RSNA-standardized three-level ordinal scale: normal/mild (preserved thecal sac with visible surrounding cerebrospinal fluid [CSF] and cauda equina rootlets), moderate (compressed/narrowed thecal sac with clumped rootlets but residual visible CSF signal), or severe (slit-like/barely discernible thecal sac with obliteration of the CSF space and rootlets compressed into a tight bundle). 17
Sample Size and Power Considerations
The primary endpoint was agreement between Gemini 3 Pro and the neuroradiologist consensus, quantified by linearly weighted Cohen’s kappa (κw) for a three-level ordinal spinal canal stenosis grade using linear weights (1 = exact agreement, 0.5 = adjacent disagreement, 0 = extreme disagreement). Power calculations targeted a one-sided test of H0: κw ≤ 0.40 vs H1: kw = 0.60 at α = 0.05 with 80% power. Expected category prevalences for planning were based on the anticipated study cohort. The asymptotic variance of κw was obtained using a delta-method approximation. Evaluating the variance conservatively at κw = 0.40 gave a requirement of approximately 162 independent disc-level observations. Each examination contributes five-disc levels, clustering observations. Hence, the disc-level requirement was inflated by a design effect. Assuming ρ = 0.25 (sensitivity analysis ρ = 0.10-0.30), this corresponds to approximately 324-disc levels (range 227-357)/65 examinations (range 46-72). Therefore, the protocol targeted 100 examinations (500 disc levels), providing>80% power under clustering (0.926-0.962 at κw = 0.60 with ρ = 0.25, depending on whether the variance is evaluated at κw = 0.40 or 0.60).
MRI Inputs and Series Identification
For each examination, sagittal and axial T2-weighted DICOM series were used. A metadata table with the dataset was parsed in Python to map each study identifier to the corresponding sagittal and axial T2 series identifiers based on the series description fields. Only studies with both sequences were included in video generation.
Video Generation, Model Inference, and Structured Prompting
A step-by-step outline of video generation is provided in Supplement A. All video montages were analyzed with Gemini 3 Pro through an application programming interface (API)-based multimodal inference workflow. A single orchestration script submits a standardized prompt (Supplement B) with the uploaded video. The prompt instructed the model to behave as a neuroradiologist, review the sagittal/axial montages, and assign a stenosis grade to each of the five-disc motion segments (L1/2 through L5/S1) using the RSNA-defined three-tier criteria. Outputs were constrained to a machine-readable JavaScript Object Notation (JSON) object that lists disc motion segments and grades to support automated scoring. After inference, the uploaded file was deleted from the remote file store during the pipeline cleanup routine. The pipeline recorded explicit failure states if an API request failed or if a response could not be parsed as valid JSON. An exemplary video montage without the segment localizer is provided in Video 1, while the corresponding montage with the integrated localizer overlay is shown in Video 2. Both videos were processed within the same multimodal inference pipeline described above, ensuring that the presence or absence of the localizer constituted the only difference between the analyzed inputs.
Outcomes and Statistical Analysis
The primary endpoint was inter-rater agreement between Gemini 3 Pro and the reference standard, measured using linearly weighted Cohen’s kappa (κw). Secondary endpoints emphasized error characteristics for severe stenosis, including sensitivity for severe disease and misclassification of diagnoses. Overall accuracy was computed as the proportion of correct three-class predictions for disc motion segments. Given the imbalanced class distribution, overall accuracy was interpreted alongside class-wise operating characteristics and severe-case error patterns rather than as a standalone measure of clinical utility. Class-wise operating characteristics (sensitivity, specificity, and positive predictive value) were calculated in a one-vs-rest framework. Diagnostic utility metrics, including likelihood ratios, were derived from the same binary decomposition.
Confidence intervals (95% CIs) for proportions were computed using binomial methods and are reported in the text, tables, and figure annotations where applicable. Paired comparisons between standard montage and localizer-overlay workflows were conducted at the disc motion segments using paired categorical tests appropriate for matched predictions, and two-sided P-values <0.05 were considered statistically significant.
Software and Reproducibility
All preprocessing, video generation, API model orchestration, and data parsing were performed in Python (v3.14.4). Specifically, DICOM handling and pixel extraction were performed using a DICOM library; numerical operations employed array-based computation; montage rendering relied on image-processing utilities; and video creation used a video-writing backend. Parsing tasks included mapping study identifiers from dataset metadata and structuring the model's JSON outputs. Statistical analyses and figure generation were performed in R (v4.6.0) via the RStudio integrated development environment. Processing parameters were fixed a priori and applied uniformly across examinations for reproducibility.
Results
A total of 100 lumbar stenosis cases (500 disc motion segments) were evaluated against neuroradiologist vignettes as reference standard labels (normal/mild: 371 [74.2%]; moderate: 74 [14.8%]; severe: 55 [11.0%]). This distribution was skewed toward normal/mild cases. Using the standard workflow without a localizer, the model assigned 395 normal/mild, 45 moderate, and 60 severe predictions. The overall results are summarized in Supplement C.
Agreement With Case Reference Labels
The diagnostic agreement is summarized in the confusion matrix (Figure 1), which displays reference-standard grades on the x-axis and Gemini 3 Pro predictions on the y-axis with cell-level case counts. Correct classifications were concentrated in the normal/mild category (332/371, 89.5%), whereas performance was lower for moderate (23/74, 31.1%) and severe (23/55, 41.8%). Confusion matrix of reference-standard vs Gemini 3 Pro stenosis grades (without localizer).
Misclassification patterns showed a predominance of downgrading. For moderate cases, the most common error was under-calling as normal/mild (39/74, 52.7%), with fewer over-calls to severe (12/74, 16.2%). In severe cases, 24/55 (43.6%) were classified as normal/mild and 8/55 (14.5%) as moderate, indicating that 32/55 (58.2%) were classified as non-severe.
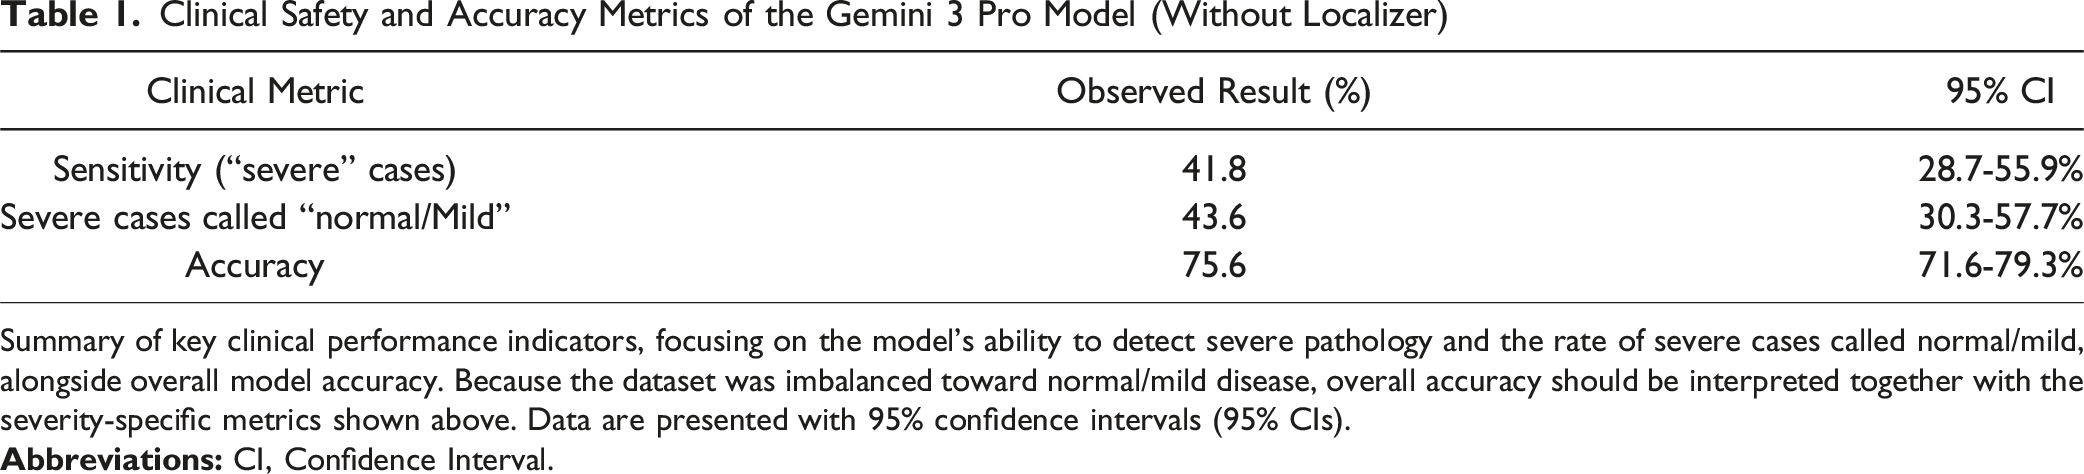
Clinical Error Characteristics and Accuracy
Key error characteristics are shown in Figure 2 and Table 1, with case counts and 95% confidence intervals annotated. Sensitivity for detecting severe stenosis was 41.8% (95% CI, 28.7-55.9%). The critical miss rate for severe cases downgraded to normal/mild was 43.6% (95% CI, 30.3-57.7%), and the overall non-severe miss rate for severe disease was 58.2% (32/55). Although overall multiclass accuracy was 75.6% (95% CI, 71.6-79.3%), this aggregate value was driven by the dominant normal/mild class and does not indicate clinically acceptable severe-case detection. Severe stenosis safety profile (n = 55 reference severe cases). Clinical Safety and Accuracy Metrics of the Gemini 3 Pro Model (Without Localizer) Summary of key clinical performance indicators, focusing on the model’s ability to detect severe pathology and the rate of severe cases called normal/mild, alongside overall model accuracy. Because the dataset was imbalanced toward normal/mild disease, overall accuracy should be interpreted together with the severity-specific metrics shown above. Data are presented with 95% confidence intervals (95% CIs).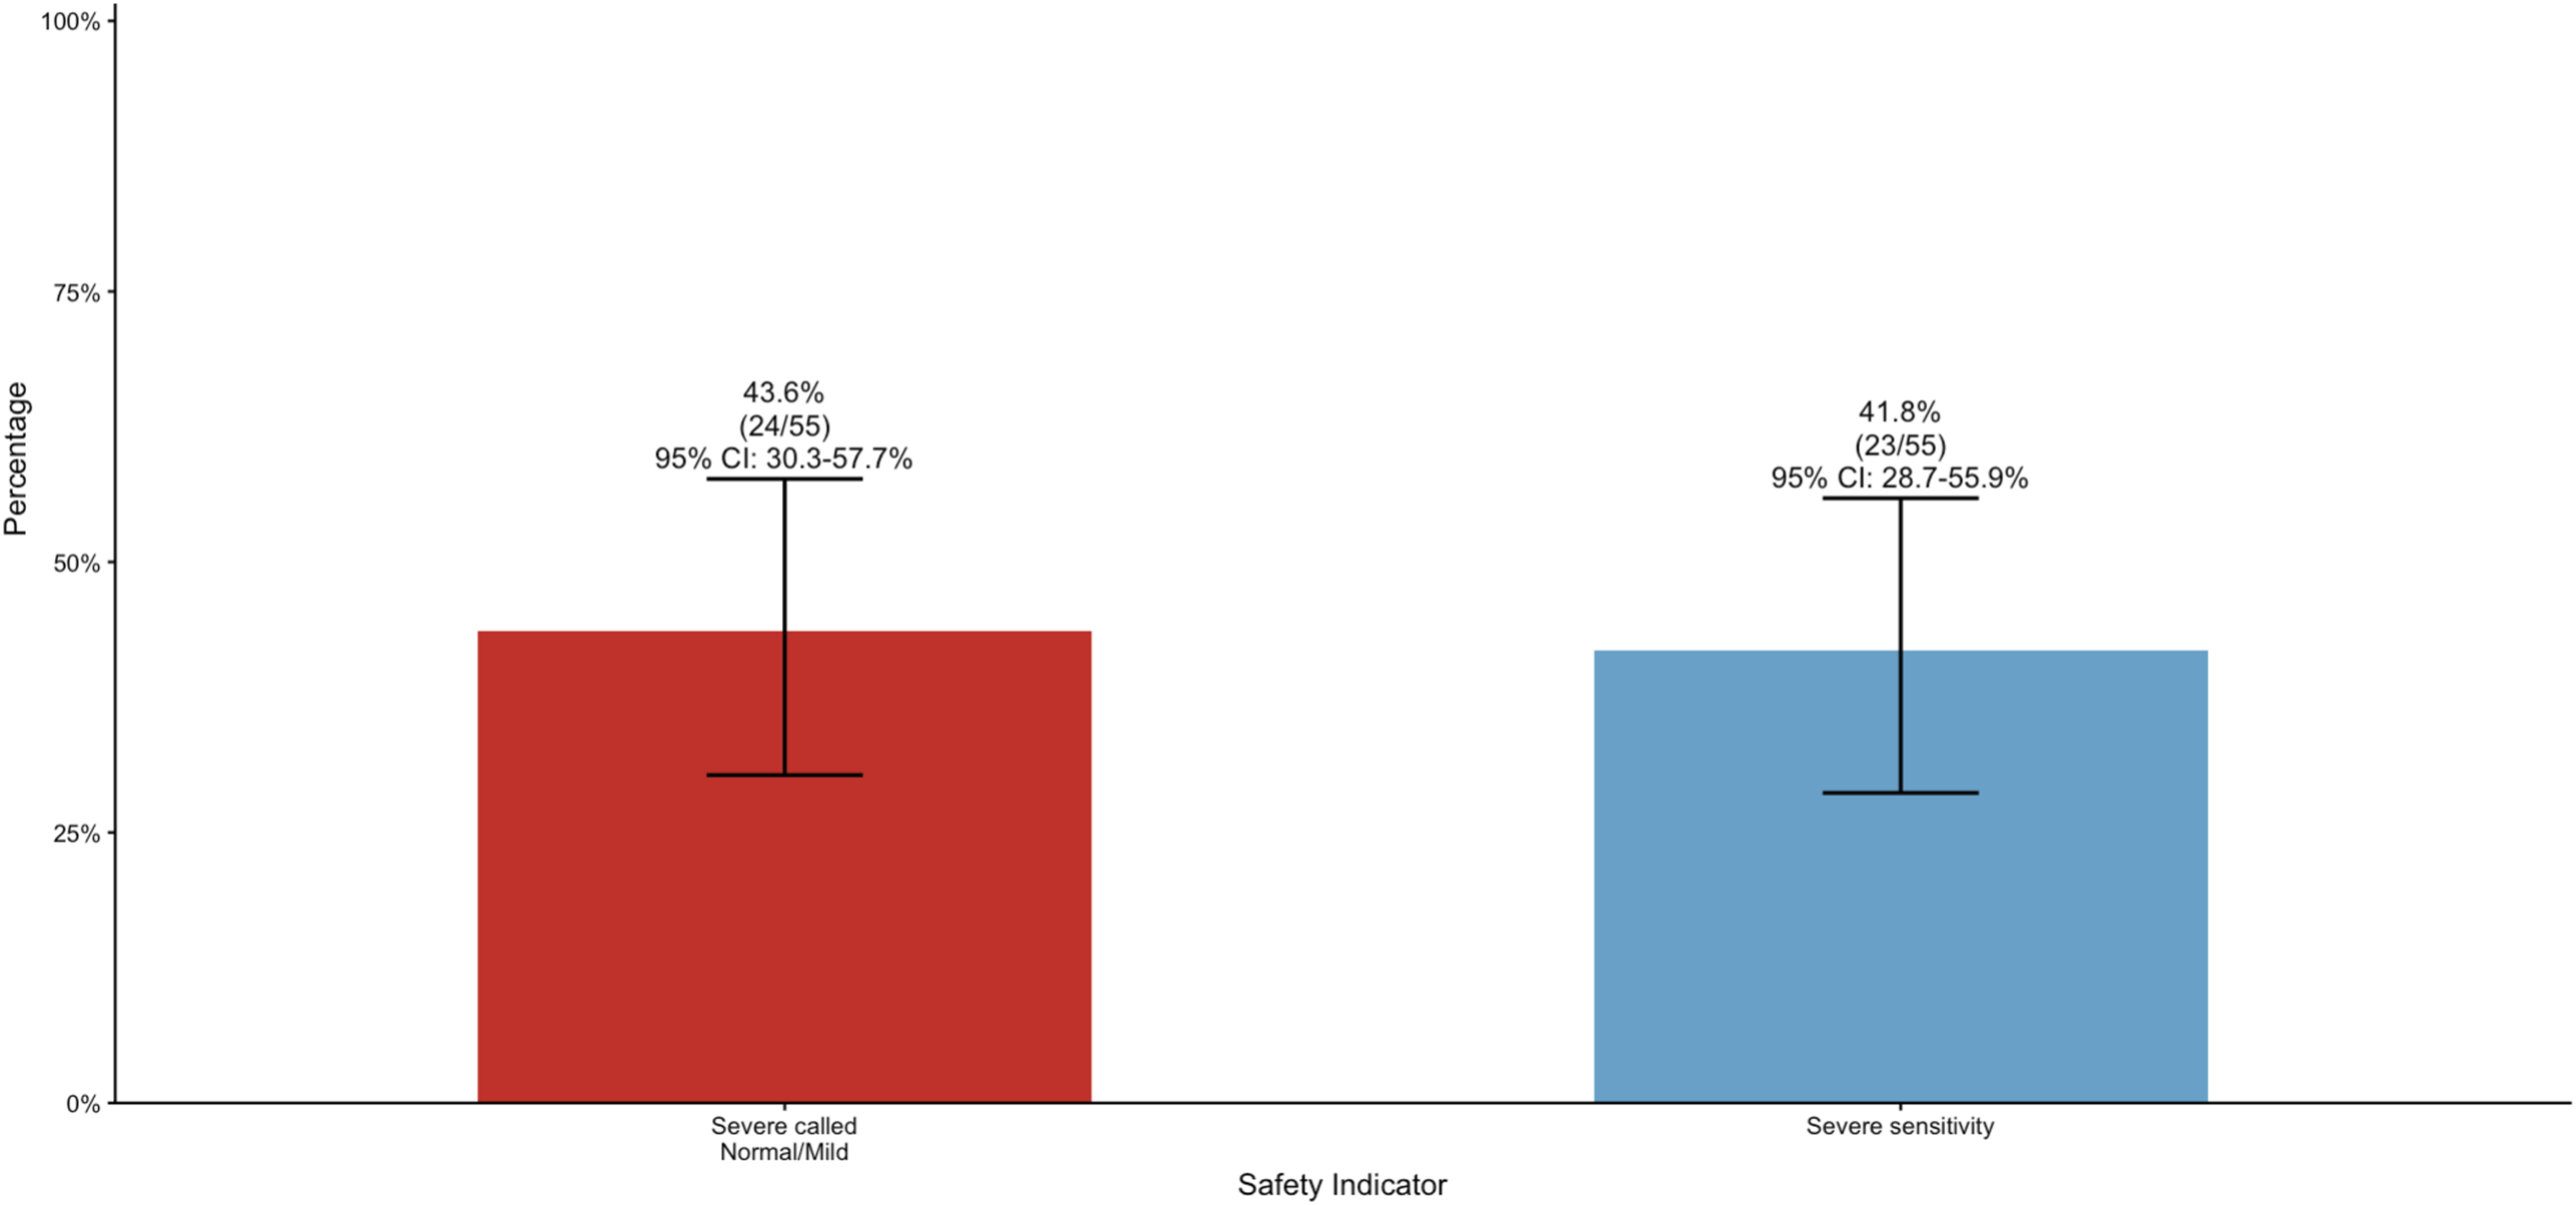
Performance Stratified by Severity Grade
Severity-stratified performance metrics are summarized in Figure 3, which annotates case counts (normal/mild n = 371, moderate n = 74, severe n = 55) and 95% confidence intervals. In one-vs-rest analyses, sensitivity was 89.5% (95% CI, 85.9-92.4%) for normal/mild, 31.1% (95% CI, 20.8-42.9%) for moderate, and 41.8% (95% CI, 28.7-55.9%) for severe stenosis. The positive predictive value for severe predictions was 38.3% (95% CI, 26.1-51.8%). One-vs-rest diagnostic performance of Gemini 3 Pro by stenosis severity grade.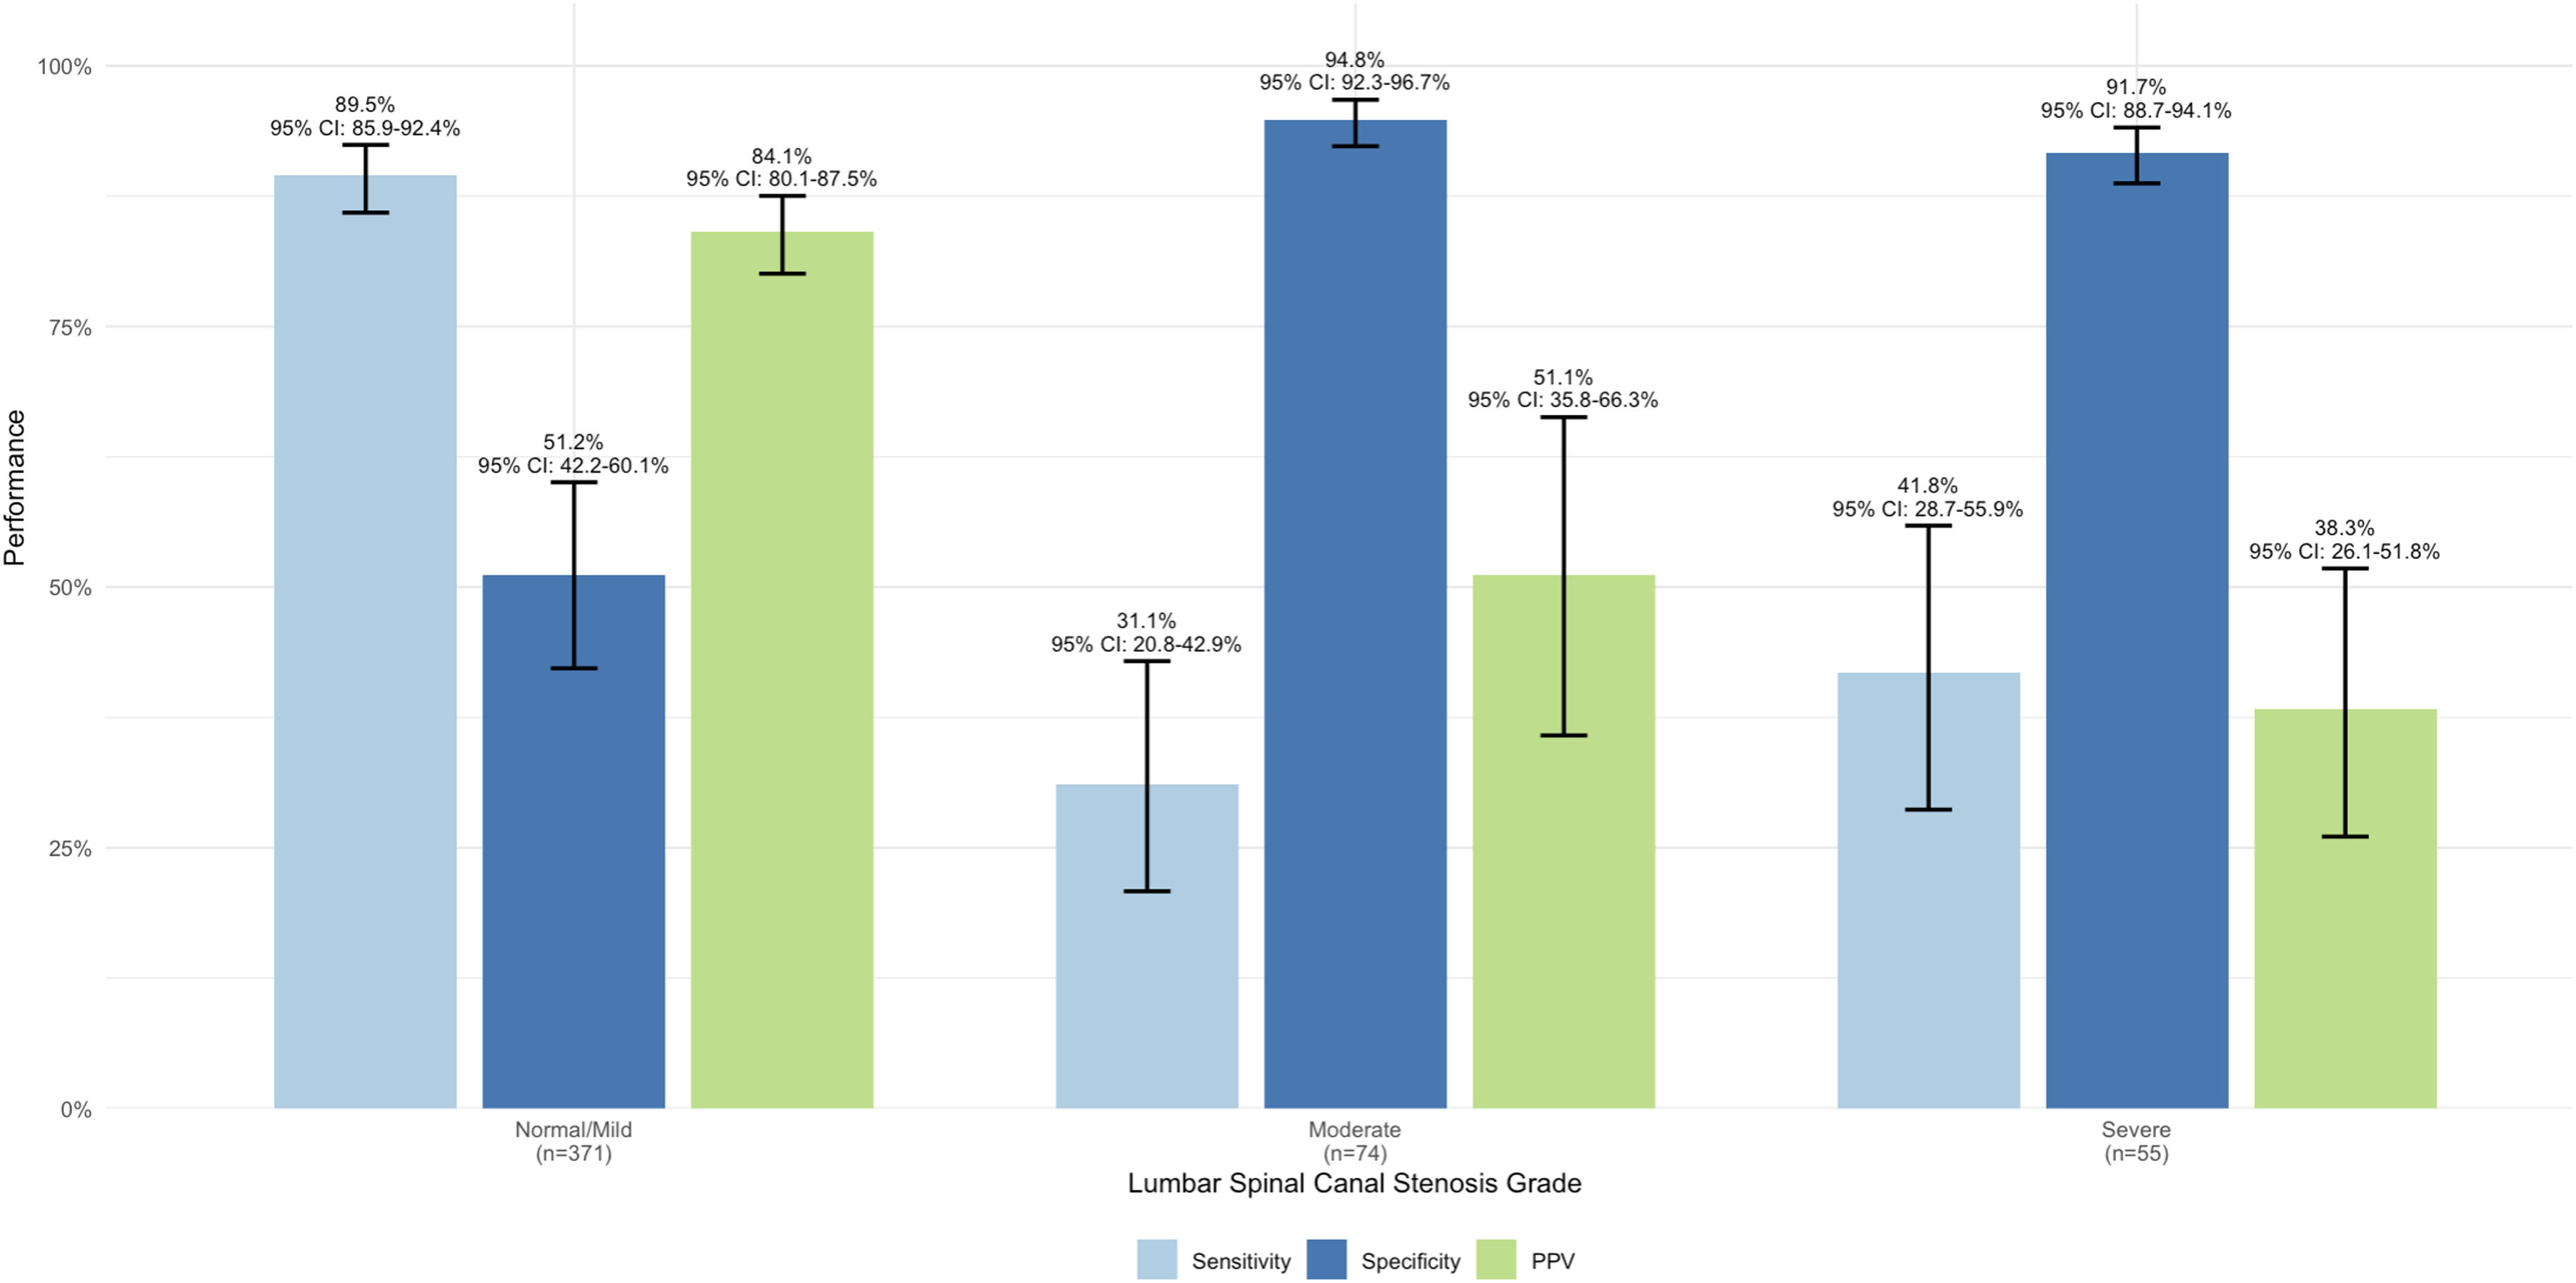
Reliability, Heterogeneity, and Direction of Errors
Statistical Reliability Metrics of the Gemini 3 Pro Model (Without Localizer)
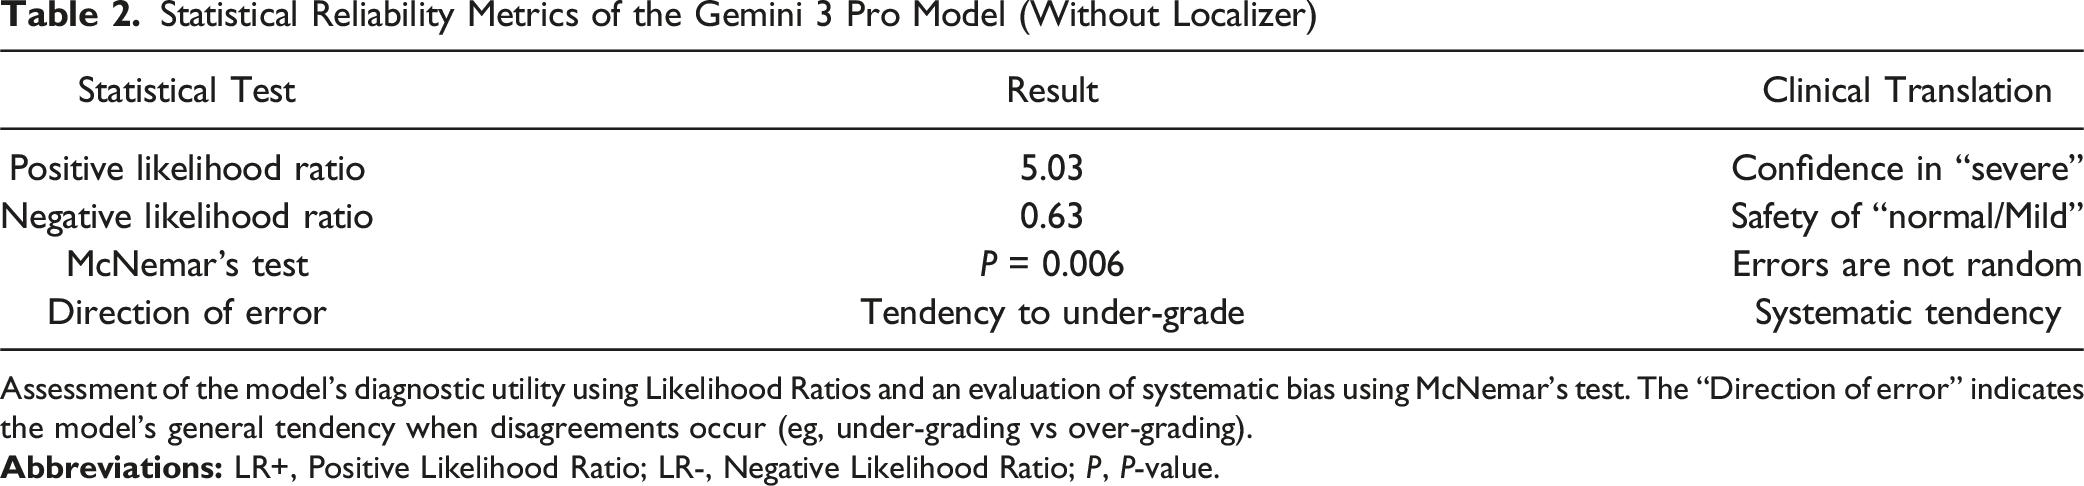
Assessment of the model’s diagnostic utility using Likelihood Ratios and an evaluation of systematic bias using McNemar’s test. The “Direction of error” indicates the model’s general tendency when disagreements occur (eg, under-grading vs over-grading).
Statistical Heterogeneity and Pairwise Diagnostic Accuracy of the Gemini 3 Pro Model (Without Localizer)
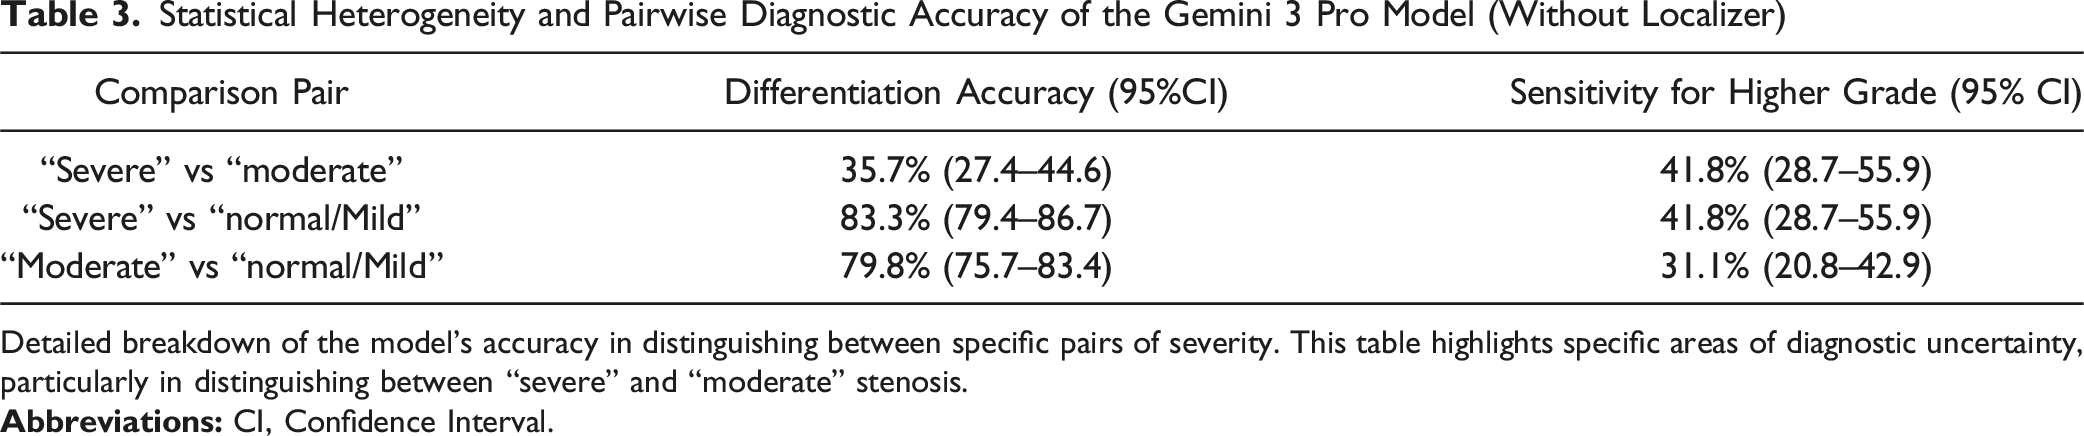
Detailed breakdown of the model’s accuracy in distinguishing between specific pairs of severity. This table highlights specific areas of diagnostic uncertainty, particularly in distinguishing between “severe” and “moderate” stenosis.
Pairwise Bias Analysis and Direction of Diagnostic Errors of the Gemini 3 Pro Model (Without Localizer)
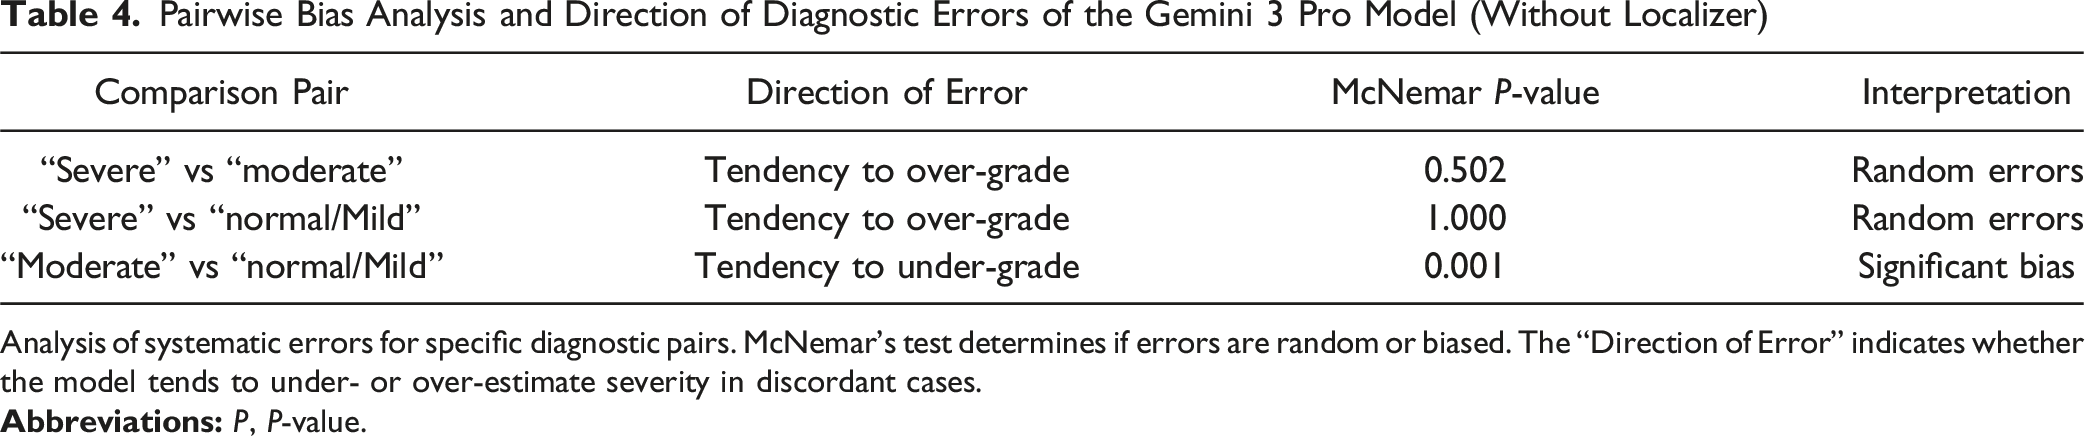
Analysis of systematic errors for specific diagnostic pairs. McNemar’s test determines if errors are random or biased. The “Direction of Error” indicates whether the model tends to under- or over-estimate severity in discordant cases.
Anatomical Performance by Lumbar Level
Diagnostic accuracy varied by spinal level (Figure 4), with 95% confidence intervals annotated for each level (n = 100 per level), ranging from 51.0% (95% CI, 40.8-61.1%) at L4/5 to 95.0% (95% CI, 88.7-98.4%) at L5/S1. Intermediate accuracies were 65.0% (95% CI, 54.8-74.3%) at L3/4, 78.0% (95% CI, 68.6-85.7%) at L2/3, and 89.0% (95% CI, 81.2-94.4%) at L1/2, indicating level-dependent performance. Level-specific diagnostic accuracy across lumbar disc motion segments.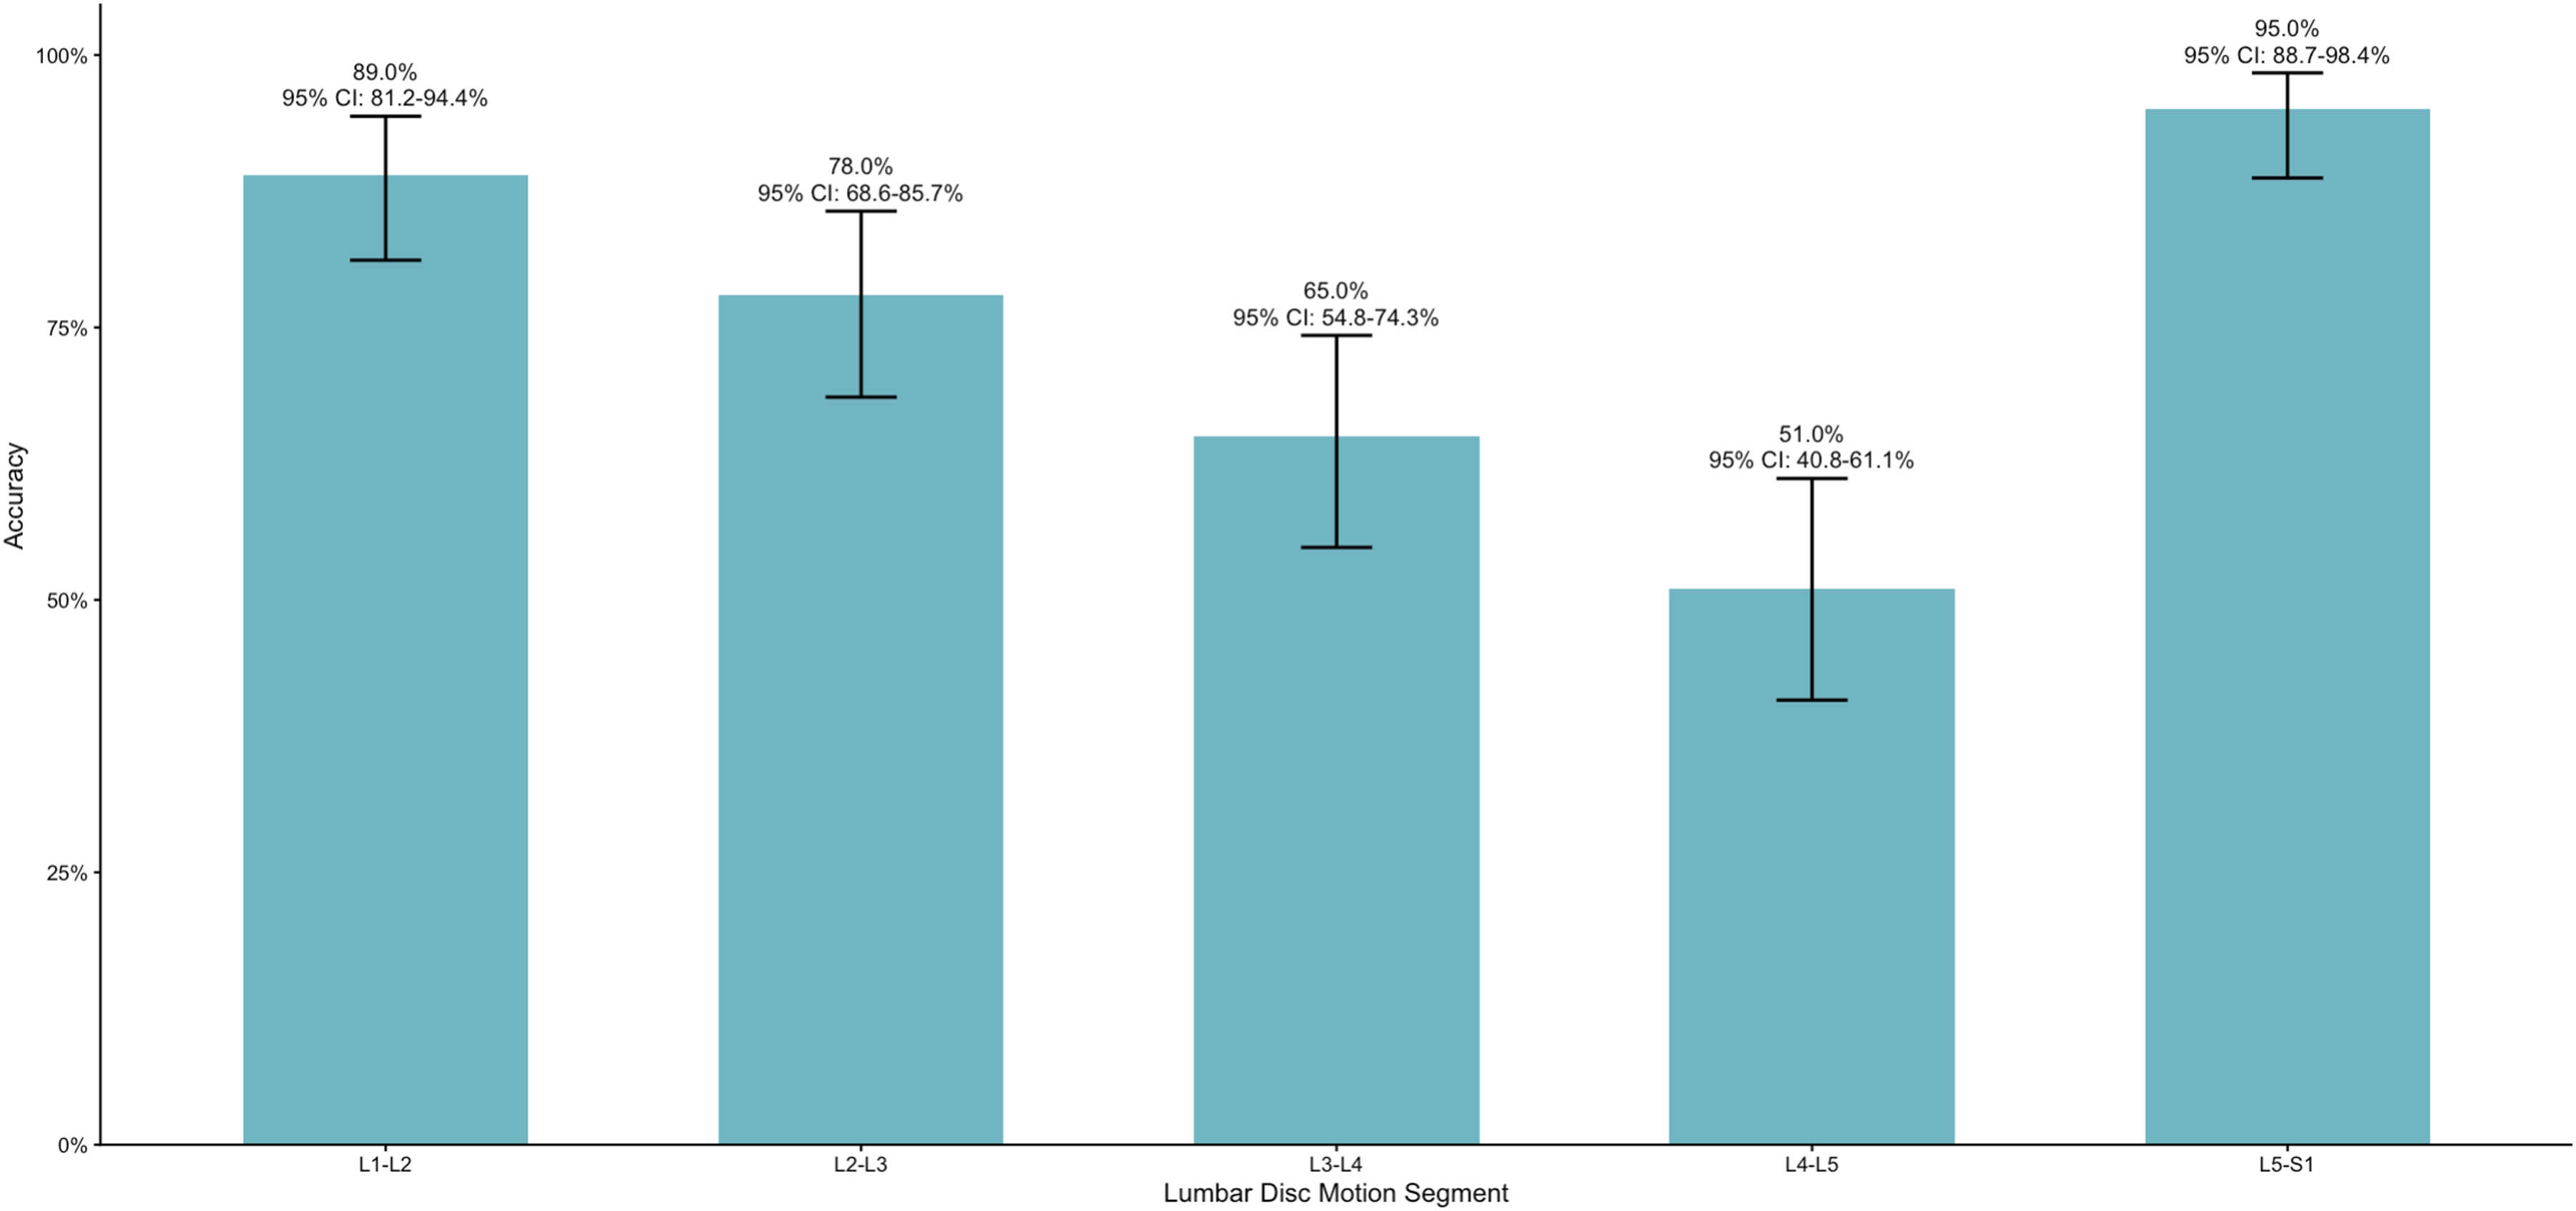
Head-To-Head Comparison: Standard Versus Localizer-assisted Workflow
Head-To-Head Comparison of Standard vs Localizer-Assisted Gemini 3 Pro Workflows
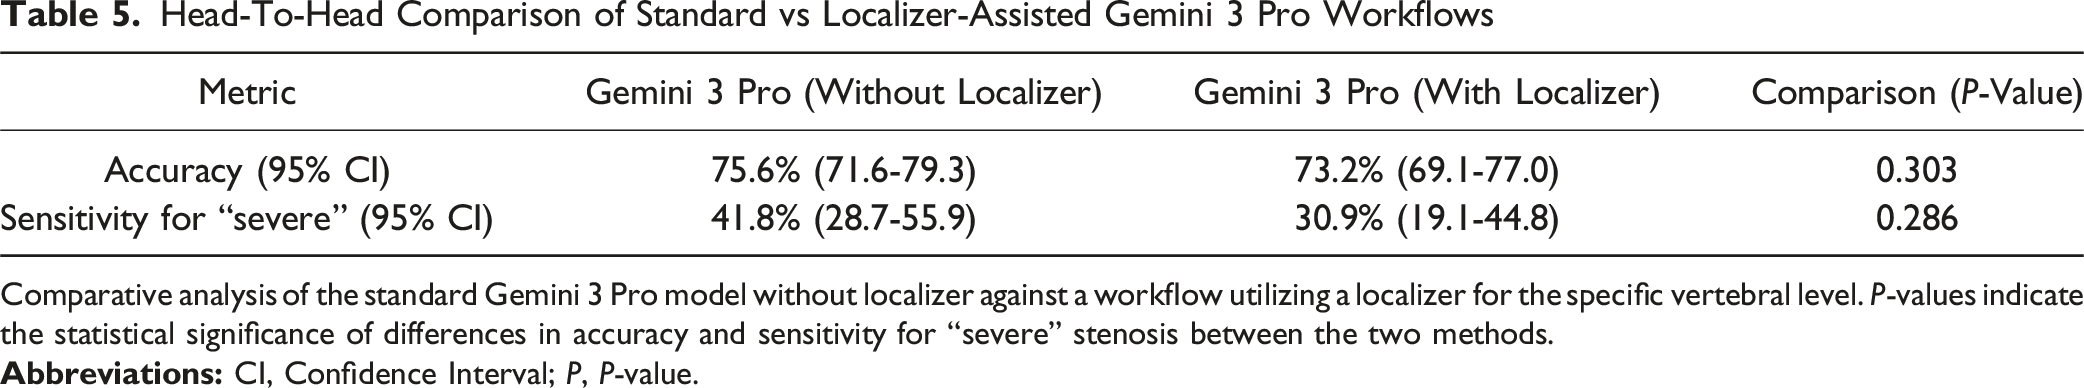
Comparative analysis of the standard Gemini 3 Pro model without localizer against a workflow utilizing a localizer for the specific vertebral level. P-values indicate the statistical significance of differences in accuracy and sensitivity for “severe” stenosis between the two methods.
Localizer-Assisted MRI Analysis
When workflow incorporated a vertebral-level localizer, overall multiclass accuracy was 73.2% (95% CI, 69.1-77.0), and sensitivity for severe stenosis decreased to 30.9% (95% CI, 19.1-44.8). Misclassification rate increased to 52.7% (95% CI, 38.8-66.3), and the overall non-severe miss rate for severe disease reached 69.1% (38/55). In the corresponding classification breakdown, correct predictions were highest for normal/mild (330/371, 88.9%), with lower performance for moderate (19/74, 25.7%) and severe (17/55, 30.9%). Most severe cases were downgraded (29/55 to normal/mild and 9/55 to moderate). Severity-stratified operating characteristics were normal/mild sensitivity 0.89, specificity 0.47, PPV 0.83; moderate sensitivity 0.26, specificity 0.95, PPV 0.45; and severe sensitivity 0.31, specificity 0.90, PPV 0.28. Reliability metrics showed LR + 3.20 and LR- 0.76, with McNemar testing indicating non-random discordance (P = 0.003). Pairwise differentiation remained poorest for severe vs moderate (27.9% [95% CI, 20.4-36.5]), while separation of severe vs normal/mild (81.5% [95% CI, 77.4-85.0]) and moderate vs normal/mild (78.4% [95% CI, 74.3-82.2]) was higher. Directional bias under-grading remained significant at the moderate vs normal/mild boundary (P = 0.001), whereas comparisons involving severe did not show significant directional bias (P = 0.230 and P = 0.894). Level-wise accuracy ranged from 56% at L3/4 to 92% at L5/S1.
Parity With the Neuroradiologist
To provide a “patient-level” measure, each lumbar MRI was treated as a single case comprising five-disc levels (L1/2 through L5/S1). Concordance was defined as the number of disc levels matching the neuroradiologist’s reference grade (range 0 to 5).
In the standard workflow, the model agreed with the neuroradiologist reference on average at 3.78/5-disc levels per examination (75.6% disc-level accuracy). Complete parity was observed in 34 of 100 cases, while 31 had agreement at four of five levels; 17 matched at three levels, 15 matched at two levels, and 3 matched at only one level. In clinical terms, this corresponds to complete parity in roughly 3-4 out of 10 patients and to agreement at four or more levels in approximately 6-7 out of 10 patients.
With localizer overlays, the mean parity was 3.66/5-disc levels per examination (73.2% disc-level accuracy). Complete parity occurred in 29 of 100 cases, while 29 matched at four of five levels; 23 matched at three levels, 17 matched at two levels, and 2 matched at one level. In other words, with localizer assistance, full agreement occurred in about 3 of 10 patients, and agreement at 4 or more levels occurred in about 6 of 10 patients.
Discussion
Model Performance Characteristics
Published Deep-Learning Studies That Grade Lumbar Spinal Stenosis on Magnetic Resonance Imaging
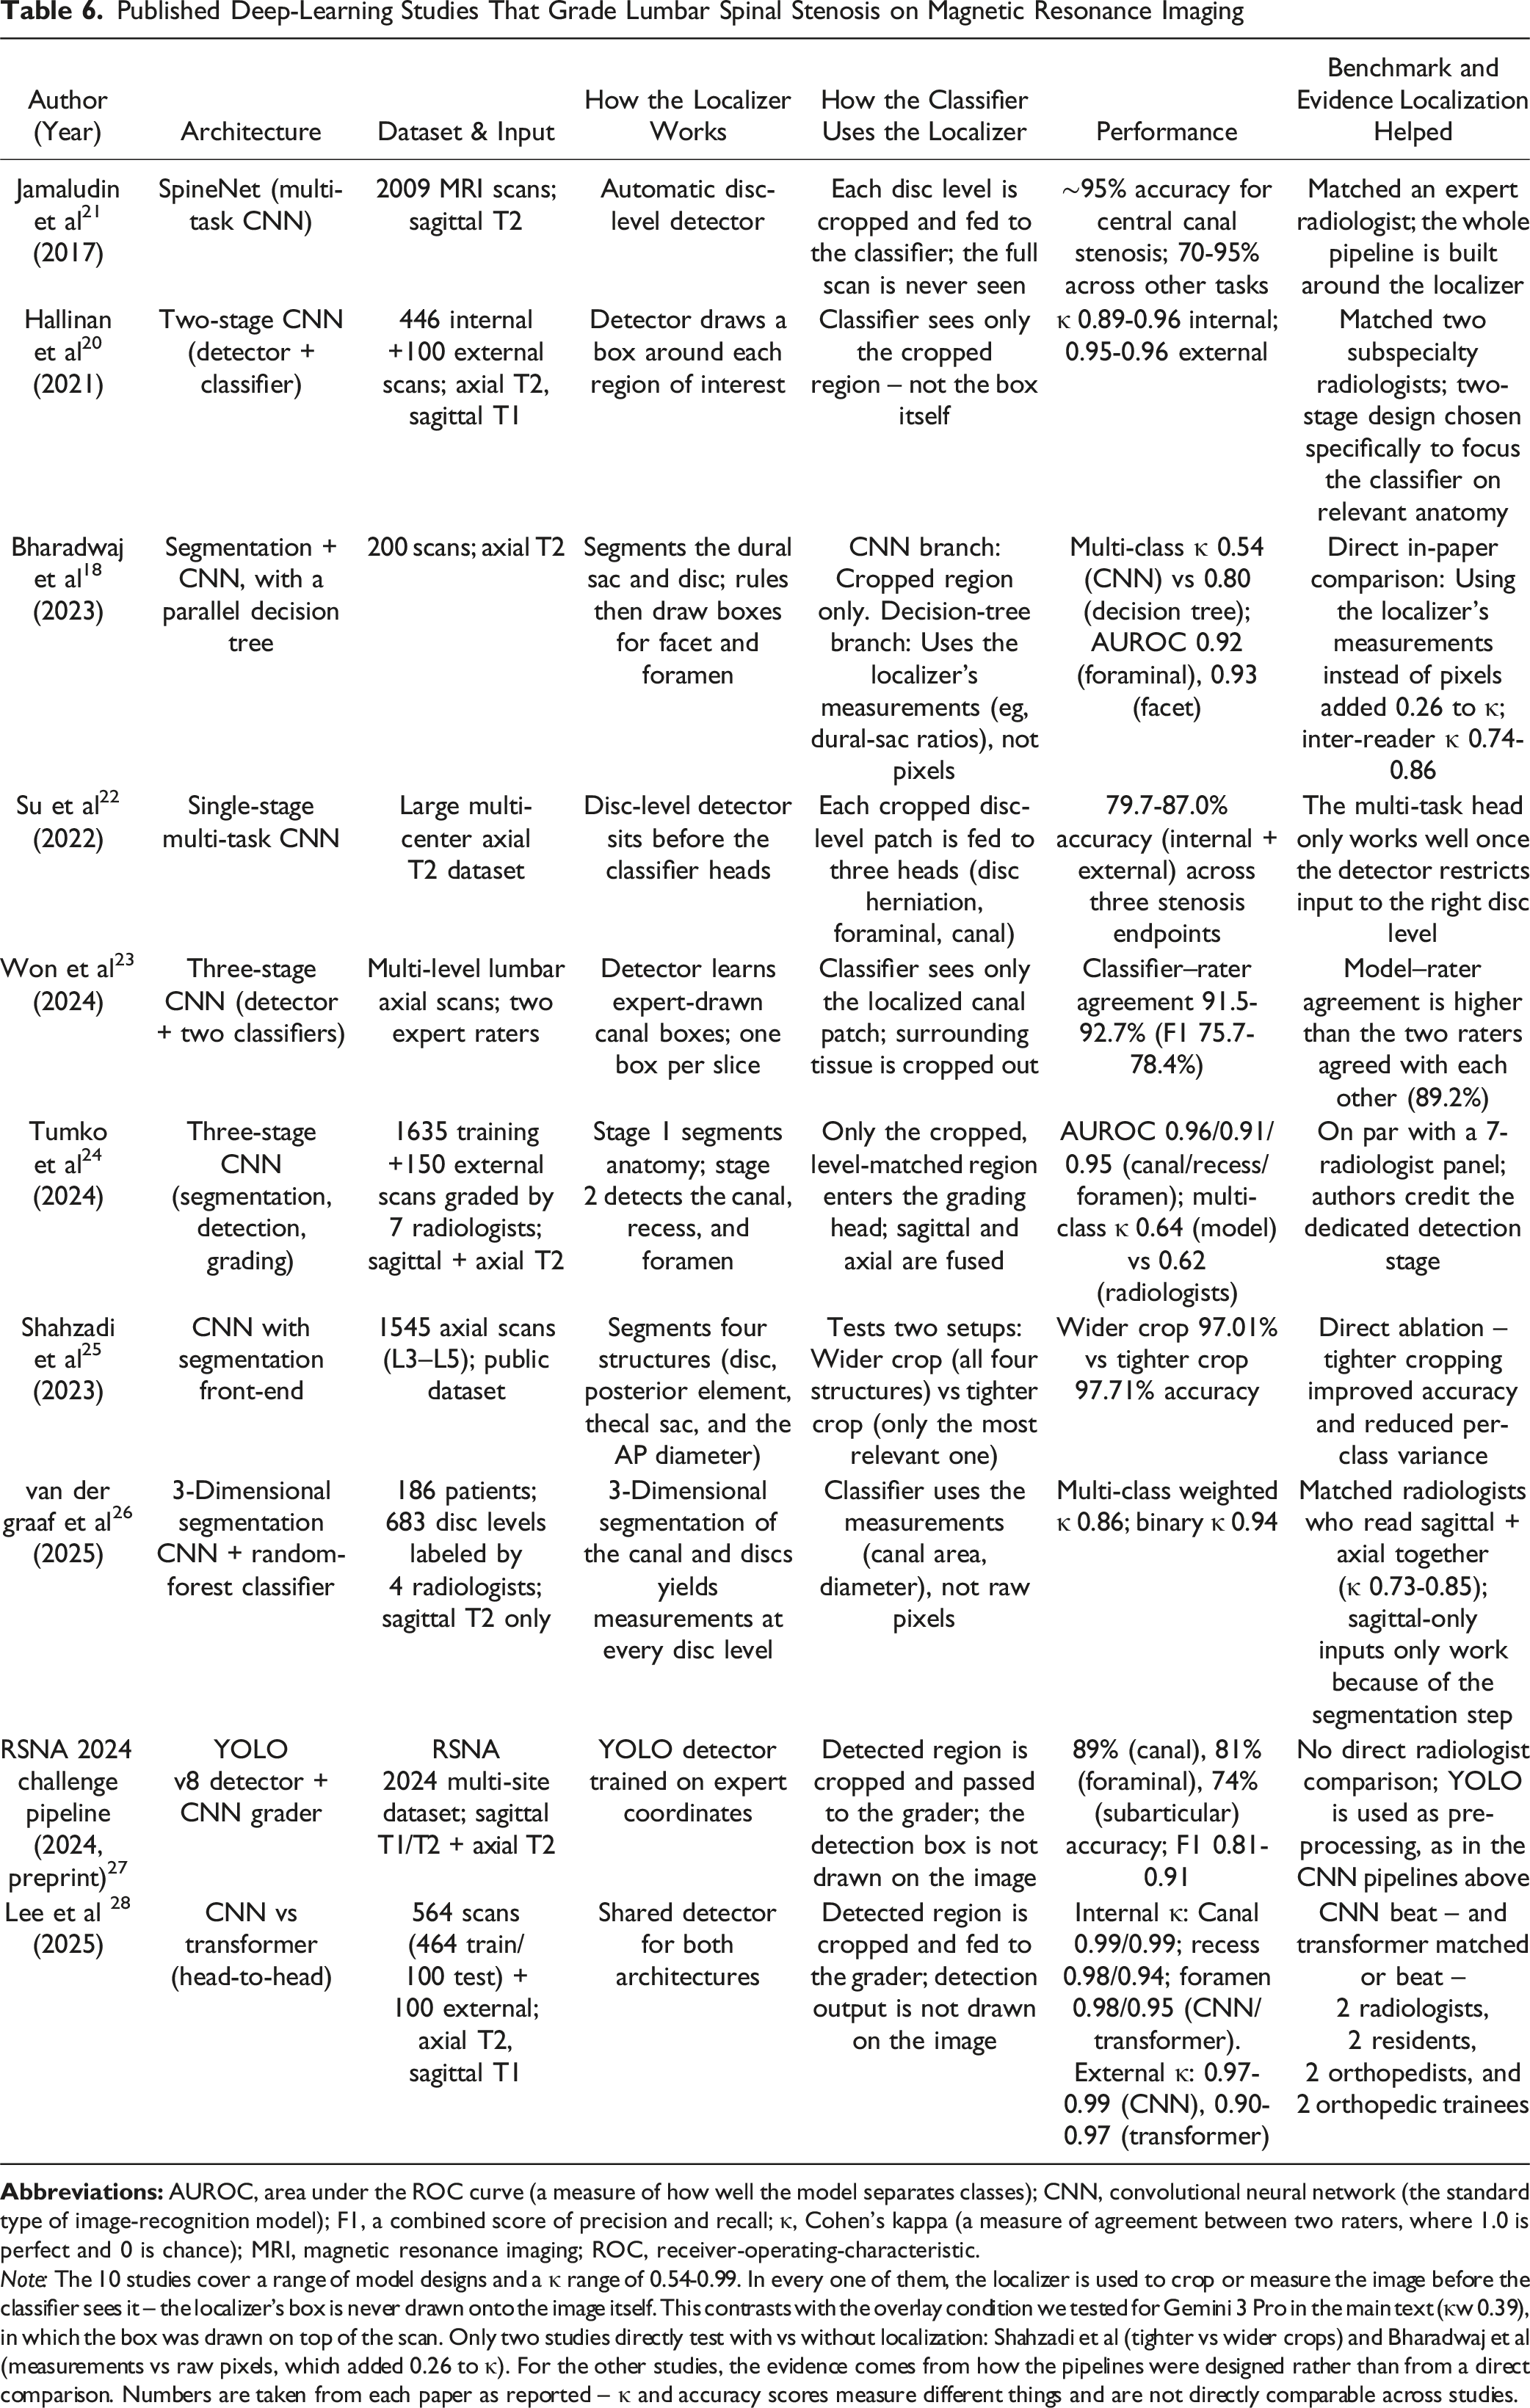
Note: The 10 studies cover a range of model designs and a κ range of 0.54-0.99. In every one of them, the localizer is used to crop or measure the image before the classifier sees it – the localizer’s box is never drawn onto the image itself. This contrasts with the overlay condition we tested for Gemini 3 Pro in the main text (κw 0.39), in which the box was drawn on top of the scan. Only two studies directly test with vs without localization: Shahzadi et al (tighter vs wider crops) and Bharadwaj et al (measurements vs raw pixels, which added 0.26 to κ). For the other studies, the evidence comes from how the pipelines were designed rather than from a direct comparison. Numbers are taken from each paper as reported – κ and accuracy scores measure different things and are not directly comparable across studies.
Importantly, this study did not “train” Gemini 3 Pro; it evaluated fixed model weights during inference (prompted prediction). In machine learning, training refers to iteratively updating a model’s parameters using data to minimize a defined loss. Inputs are paired with targets – either expert labels (supervised learning) or self-supervised signals such as next-token prediction and image–text alignment – after curation and preprocessing (eg, de-identification, quality control, normalization/harmonization, and explicit train/validation/test splits). Optimization typically uses gradient-based updates over many iterations, and model/hyperparameter choices are guided by validation performance rather than the test set.29–31 Training design also emphasizes generalization: reducing overfitting to the development set via regularization/augmentation and confirming performance with external validation to detect dataset shift. When a general model underperforms on a clinical task, transfer learning (fine-tuning) further updates pretrained weights using high-quality, task-specific labels to improve clinically salient error modes (eg, severe-case sensitivity), while explicitly monitoring subgroup bias and privacy risks in patient data. Reproducible training requires transparent reporting of data provenance, preprocessing, model versioning, and evaluation protocols.32–36
Error Patterns
Over half of severe cases (58.2%) were misclassified as non-severe, and 43.6% were downgraded to normal/mild, highlighting a clinically unacceptable failure mode in high-grade stenosis classification. In practice, severe central canal stenosis is often the imaging finding most likely to prompt closer clinical correlation, specialist referral, or surgical discussion when concordant with neurogenic claudication or neurologic deficits. A model that systematically undercalls this group could therefore generate false reassurance if used without expert oversight. Given that severe stenosis is defined as complete CSF obliteration with tightly compressed nerve root bundles across multiple contiguous slices, slice-level variation and volumetric context can be misinterpreted when MRIs are converted from three-dimensional imaging into video format. 8 Video conversion may reduce radiologic fidelity through resampling, grayscale compression, and loss of native DICOM metadata, while a general-purpose multimodal model may further rely on global visual heuristics rather than disciplined slice-by-slice morphologic comparison. Non-task-specific models, such as Gemini 3 Pro, are not trained to recognize the distinct radiographic features required for stenosis grading; their performance may therefore be limited by both input degradation and inherent model limitations in subtle morphologic interpretation. Despite a specificity of 91.7% for severe disease, a negative likelihood ratio of 0.63 indicates that normal/mild and moderate predictions provide limited reassurance in excluding severe stenosis. Positive predictive value was lowest for severe predictions (38.3%), showing that the model was unreliable in detecting severe stenosis. Pairwise analysis reveals that the model can strongly discriminate between normal/mild and severe stenosis but cannot accurately differentiate between moderate and severe stenosis. Model accuracy across lumbar levels ranged from 51.0% at L4/L5 to 95.0% at L5/S1, with intermediate performance observed across levels. The lowest accuracy at L4/L5 is notable, as this transitional segment has a high prevalence of degenerative pathology due to substantial axial load and mobility in the sagittal plane. 37 Given this level’s greater anatomic and pathologic variability, interpretation is more complex and may contribute to reduced model performance compared with other lumbar levels.
Outcomes of Localizer-Assisted Workflow
The localizer is cropped to the target level and serves as a visual guide on sagittal MRI, helping the M-VFM spatially orient the corresponding axial slice during video playback. In specialist DL pipelines, localizers can improve scan-plane isolation and level identification when they are incorporated as trained detection or preprocessing modules (Table 6) rather than displayed as inference-time overlays.38,39 We hypothesized that this approach would improve identification of the correct spinal level and the location of stenosis. However, in our inference-only workflow, it reduced accuracy, agreement, and sensitivity for severe stenosis. Several mechanisms may explain this counterintuitive result. First, the overlay introduced extra arrows, boxes, and cropped context that may have distracted the model from subtle canal morphology. Second, any mismatch between the highlighted sagittal level and the axial frame sequence may have amplified spatial confusion rather than reduced it. Third, unlike the CNN- and YOLO-based localization workflows summarized in Table 6, our model was not trained to use the localizer as a structured cue; it encountered the overlay as additional out-of-distribution visual content at inference time. This distinction is methodologically important, as it introduces a degree of non-equivalence in the comparison: CNN- and YOLO-based approaches remain fundamentally grounded in 2-dimensional image analysis rather than true volumetric or temporally integrated interpretation. Although transformer-based models may be subject to a similar limitation, this cannot be conclusively determined without direct examination of the model architecture and learned weights. In analogous contexts, even minor extraneous inputs have been shown to mislead multimodal models. 1 Thus, the discrepancy with prior DL literature likely reflects the difference between task-specific, trained localization modules and a generalist M-VFM confronted with a visually complex overlay without retraining or textual grounding.18,40
Future Research and Limitations
Despite fair agreement and strong performance for normal/mild disease, Gemini 3 Pro under-detected severe stenosis, limiting its reliability for identifying clinically significant lumbar central canal stenosis. Given the multifactorial nature of spinal pathology, future work should evaluate model performance across additional lumbar imaging features, including foraminal stenosis, facet arthropathy, and degenerative disc disease, and extend the assessment to the cervical and thoracic spine to evaluate global stenosis and myelopathy. Integrating imaging with expert radiologic interpretation and relevant electronic health record context may improve downstream applicability.
Beyond reporting the diagnostic accuracy of a single model, this study also provides a time-stamped benchmark of the current status quo for general-purpose multimodal AI in spine MRI interpretation. This is relevant not only scientifically, but also clinically and societally, because members of the public are increasingly using large language model tools for health information, while radiology workflows are simultaneously moving toward patient-facing AI communication and simplification.41–44 In that context, our findings help spine clinicians, professional societies, and patient organizations contextualize AI-generated impressions by showing that apparently acceptable aggregate accuracy can coexist with clinically important under-detection of severe disease. The present work should therefore be viewed not merely as a model-specific accuracy study, but as an early benchmark that can guide subsequent investigations into why these failure modes occur and how prompt design, multimodal workflow refinement, task-specific tuning, and prospective validation might improve future performance before unsupervised patient-facing deployment is considered.
This study has several limitations. First, only a single multimodal model was evaluated; performance may differ across other frontier multimodal models, radiology-tuned systems, future model versions, and workflows that use native DICOM or alternative prompting strategies. A formal head-to-head evaluation of Gemini against other frontier multimodal models under identical imaging, prompting, and parsing conditions remains an important next step.7,8,45 Second, the study used one public dataset with pronounced class imbalance, limiting generalizability to populations with different disease prevalence, acquisition parameters, and care pathways. Third, video-based rather than native volumetric MRI was evaluated, and the absence of native volumetric data and radiology-specific pretraining likely limits tasks that require fine 3-dimensional and radiomic context. Fourth, the cohort size was limited to 100 scans; larger samples, supported by patient-level power analyses and external validation, would improve robustness. Finally, the dataset lacked reported interobserver agreement among contributing expert readers, so the reference standard should be viewed as a curated consensus benchmark rather than a definitive gold standard.
Conclusions
Gemini 3 Pro demonstrated fair agreement with neuroradiologist consensus, but its apparently reasonable overall accuracy was driven largely by correct normal/mild classifications in an imbalanced dataset. The clinically unacceptable under-detection of severe stenosis argues against unsupervised use for lumbar canal stenosis grading. Localizer-assisted inputs did not improve performance and worsened several severe-case safety metrics. These findings highlight current performance limitations and underscore the need for targeted optimization, better-characterized reference standards, and prospective, clinically grounded validation before wider deployment. While generalist models currently underperform relative to task-specific DL systems, their strong industry backing and widespread use make them a relevant target for further training in clinical radiographic interpretation.
Supplemental Material
Supplemental Material - Benchmarking Multimodal Vision Frontier Models With Lumbar Spine MRIs for Grading Lumbar Spinal Stenosis
Supplemental Material for Benchmarking Multimodal Vision Frontier Models With Lumbar Spine MRIs for Grading Lumbar Spinal Stenosis by Harry Gebhard, Ahmet Kartal, Noel F. Manalil, Lawrance K. Chung, Sohail R. Daulat, Chiungwen D. Cheng, Ayesha Akbar Waheed, Andia Shahzadi, Ibrahim Hussain, Roger Härtl, Galal A. Elsayed in Global Spine Journal
Supplemental Material
Supplemental Material
Footnotes
Ethical Considerations
This project does not constitute human subjects research because it used only published, de-identified case information; therefore, Institutional Review Board (IRB) approval was not required.
Consent for Publication
Patient consent was not required because the study analyzed information abstracted from previously published, de-identified case reports, collected no identifiable data, and involved no contact with human subjects.
Author Contributions
Funding
The authors received no financial support for the research, authorship, and/or publication of this article.
Declaration of Conflicting Interests
The authors declared no potential conflicts of interest with respect to the research, authorship, and/or publication of this article.
Data Availability Statement
The RSNA 2024 Lumbar Spine Degenerative Classification Dataset is publicly available through RSNA/Kaggle in accordance with the dataset’s terms of use. The Python scripts used for DICOM preprocessing, MP4 montage generation (with and without localizer overlays), and inference orchestration, as well as the R scripts used for statistical analysis, are available from the authors upon reasonable request. Derived montage videos may be shared with qualified investigators, subject to the dataset’s data-use and redistribution requirements.
Disclosure of Financial Relationships/Potential Conflicts of Interest
Roger Härtl reports consulting relationships with DePuy Synthes, Brainlab, and Aclarion and serves as an advisor to RealSpine. He also has financial relationships with Realists and OnPoint outside the submitted work.
Supplemental Material
Supplemental material for this article is available online.
References
Supplementary Material
Please find the following supplemental material available below.
For Open Access articles published under a Creative Commons License, all supplemental material carries the same license as the article it is associated with.
For non-Open Access articles published, all supplemental material carries a non-exclusive license, and permission requests for re-use of supplemental material or any part of supplemental material shall be sent directly to the copyright owner as specified in the copyright notice associated with the article.