
Abstract
Study Design
Retrospective multicenter observational study.
Objectives
In kyphotic adult spinal deformity (ASD), hip extension, assessed by pelvic femoral angle (PFA), compensates for sagittal malalignment, but no radiographic measure quantifies residual “hip extension reserve.” When hip compensation fails, knee flexion, assessed by femoral inclination (FI), is recruited and forward trunk inclination, assessed by sagittal vertical axis (SVA), worsens. We aimed to identify which sagittal radiographic parameter best explains FI, SVA, and health-related quality of life (HRQOL), and to evaluate whether spinopelvic–hip harmony, defined as PFA minus spinopelvic mismatch [PFA−(PI−LL)], reflects hip extension reserve.
Methods
We included 115 kyphotic ASD patients from three spine centers. Spinopelvic parameters, PFA, and FI were measured; PI−LL and PFA−(PI−LL) were calculated. HRQOL was assessed using the Japanese Orthopaedic Association Back Pain Evaluation Questionnaire (JOABPEQ). We performed Spearman correlations and hierarchical linear regression (baseline: age, sex, and body mass index), adding each radiographic parameter individually and comparing ΔR2 and the corrected Akaike information criterion (AICc) (complexity-penalized fit).
Results
PFA−(PI−LL) correlated with FI (ρ = −0.71) and SVA (ρ = −0.73). After adjustment, PFA−(PI−LL) yielded the greatest incremental explanatory power for FI (ΔR2 = 0.43) and SVA (ΔR2 = 0.56), with ΔAICc >10 vs the others. PFA−(PI−LL) was also associated with JOABPEQ lumbar function and walking ability. ROC analyses showed PFA−(PI−LL) cutoffs for FI >10° and SVA >95 mm were around 160°.
Conclusions
In kyphotic ASD, PFA−(PI−LL) best explained both knee flexion recruitment and forward trunk inclination and may indicate hip extension reserve.
Keywords
Background
Adult spinal deformity (ASD) is characterized by forward trunk inclination due to sagittal malalignment, commonly quantified by the sagittal vertical axis (SVA), with SVA >95 mm classified as severe in the SRS–Schwab classification.1,2 Sagittal malalignment is strongly associated with spinopelvic mismatch (pelvic incidence minus lumbar lordosis, PI−LL). 2
SVA reflects not only spinal alignment but also the interaction among the spine, pelvis, and lower extremities. With increasing PI−LL, compensation is initially achieved mainly through hip extension; however, once it reaches its limit, knee flexion is recruited and SVA can no longer be maintained, resulting in malalignment.3-7 This transition from hip-dominant to knee-flexion compensation is clinically important because compensatory knee flexion has been associated with pain, functional impairment, and reduced health-related quality of life (HRQOL).5,8-13 Femoral inclination (FI; angle between the femoral axis and the vertical line, Figure 1A) on standing lateral radiographs serves as an indicator of knee-flexion compensation, and FI >10° has been associated with worse clinical symptoms.
14
Pelvic tilt (PT) is an established and clinically valuable parameter in ASD classification systems1,2; however, because it is geometrically influenced by both hip extension and knee flexion (Figure 1), it may be less suitable as a specific indicator of residual hip extension reserve.
15
Accordingly, an easily measurable radiographic indicator that reflects diminished hip compensatory capacity and helps identify the recruitment of knee flexion is needed. Definitions of pelvic femoral angle (PFA) and femoral inclination (FI) and their geometric relationship with pelvic tilt (PT). A: Standing whole-spine lateral radiograph including the proximal femur. PFA is defined as the angle between the femoral shaft axis and the line connecting the midpoint between the centers of bilateral femoral heads and the midpoint of the sacral endplate. The femoral shaft axis is defined by connecting the midpoints of the anterior and posterior cortices at the proximal and distal levels of the femoral shaft. FI is defined as the angle between the femoral shaft axis and the vertical line. B: Schematic illustration of the geometric relationship among PT, PFA, and FI. PT can be expressed as PT = PFA − 180° + FI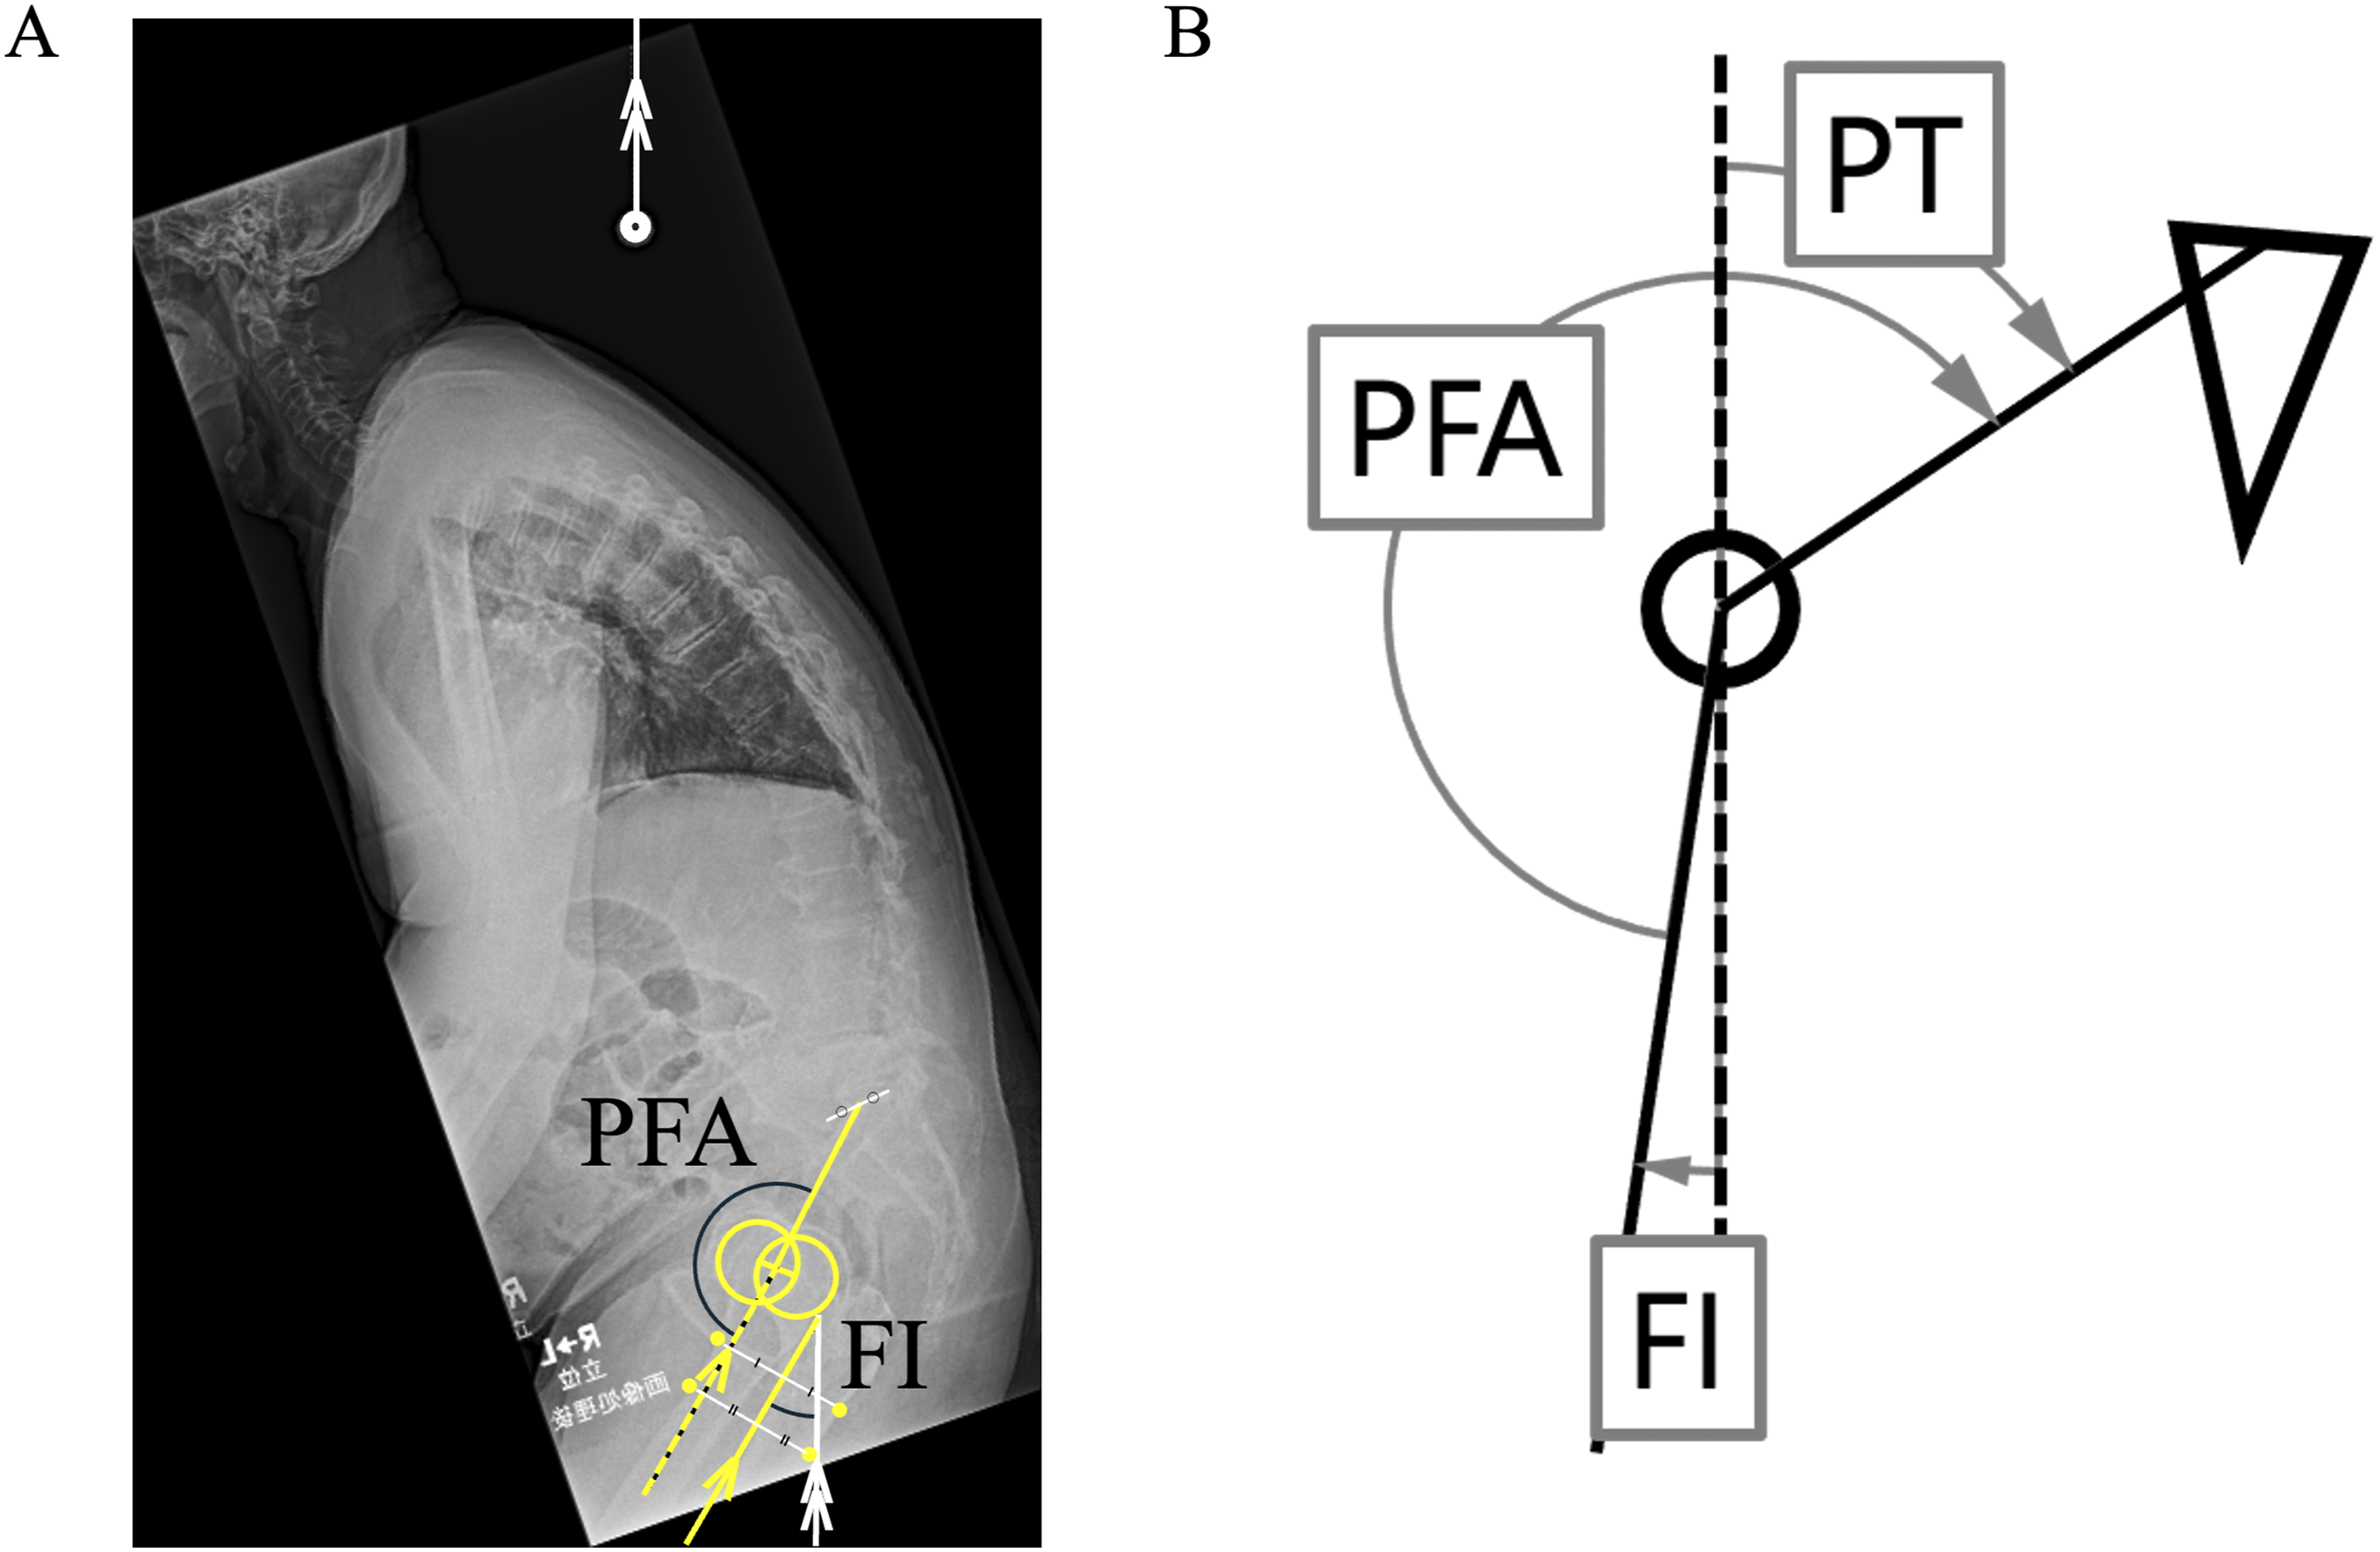
The pelvic femoral angle (PFA; the angle formed between the line connecting the midpoint between both femoral head centers and the center of the sacral endplate, and the femoral axis, Figure 1A) was originally used in EOS-based studies as an indicator of sagittal hip alignment. 8 Because EOS is not widely available,16-18 Fujita et al demonstrated that PFA can also be measured on conventional standing lateral radiographs, making it applicable in routine clinical practice. 13 They showed that PFA alone is insufficient to evaluate hip compensatory capacity and should be interpreted in relation to spinopelvic mismatch (PI−LL). Whereas PI−LL reflects the magnitude of deformity requiring compensation, PFA reflects the sagittal hip alignment actually recruited to meet that demand. On this basis, Fujita et al proposed PFA−(PI−LL) as a parameter of remaining hip extension reserve relative to that deformity burden and showed that it correlates with SVA and HRQOL. 13 However, their mixed population may limit generalizability to an ASD-only cohort. 19 To our knowledge, no study has determined which sagittal parameter on standing lateral radiographs best captures the shift from hip to knee compensation and most effectively explains forward trunk inclination after adjustment for age, sex, and body mass index (BMI).
Therefore, in an ASD-only cohort, we aimed to identify which sagittal parameter best explains (1) recruitment of knee flexion compensation, (2) forward trunk inclination, and (3) HRQOL after adjustment for age, sex, and BMI. As an exploratory analysis, we estimated practical reference cutoff values of the identified parameter for FI >10° and SVA >95 mm.
Methods
This retrospective multicenter study was approved by the institutional ethics committee. We retrospectively included 115 patients with adult spinal deformity (ASD) who were hospitalized for conservative or surgical treatment at three institutions in Japan (A, B, and C) and had kyphotic sagittal malalignment, defined as SVA >40 mm and/or PI−LL >10°. The mean age was 70 years, and the mean BMI was 23.6 kg/m2; 19 were men and 96 were women. Patients with neurodegenerative diseases, such as Parkinson’s disease and Alzheimer’s disease, were excluded.
Radiographic Evaluation
Standing whole-spine lateral radiographs were obtained using different arm positions at each institution. At institutions A and B, patients stood in a natural posture with the arms raised forward to approximately 30° of shoulder flexion. At institution C, patients were positioned with the elbows flexed at about 45° and the fingertips resting on the clavicles. All radiographic measurements in surgically treated patients were performed on preoperative radiographs. SVA, thoracic kyphosis (TK; T5-12), lumbar lordosis (LL), pelvic incidence (PI), pelvic tilt (PT), and sacral slope (SS) were measured. In this study, femoral orientation was represented by the proximal femoral shaft axis, which was defined as the line connecting the midpoints of the anterior and posterior cortices at the proximal and distal portions of the two femurs (Figure 1A). The PFA was used to represent the sagittal alignment of the hip joints and was defined as the angle between the line drawn from the midpoint of the bilateral femoral head centers to the midpoint of the sacral endplate and the proximal femoral shaft axis (Figure 1A). We then calculated PI−LL and PFA−(PI−LL). We also measured FI, defined as the angle between the proximal femoral shaft axis and the vertical line, which has been used as a radiographic parameter associated with compensatory knee flexion (Figure 1A). 13 A higher FI indicates greater knee compensation. Radiographic parameters are presented as mean ± standard deviation (SD).
All measurements were performed by Examiner 1 (a spine surgeon with 20 years of experience). For interobserver reliability, Examiner 2 (a spine surgeon with 10 years of experience) independently measured radiographic parameters in 50 randomly selected patients once. For intraobserver reliability, Examiner 1 repeated measurements in the same 50 patients. Intraobserver agreement (ICC [1,1]) and interobserver agreement (ICC [2,1]) were calculated using IBM SPSS Statistics ver. 27.0 (IBM Corp., Armonk, NY, USA).
Clinical Assessment
HRQOL was evaluated using the Japanese Orthopaedic Association Back Pain Evaluation Questionnaire (JOABPEQ), which consists of five domain scores: low back pain, lumbar function, walking ability, social life function, and mental health. 20 This is a self-administered questionnaire consisting of total 25 items, and higher scores indicate a better state with a full-mark of each domain of 100.
Statistical Analysis
Associations between radiographic parameters and JOABPEQ domain scores were assessed using Spearman’s rank correlation coefficients.
To identify which parameters obtained from standing lateral radiographs best explain the recruitment of compensatory knee flexion and forward trunk inclination, we first constructed baseline linear regression models for FI and SVA as dependent variables, including age, sex, and BMI as covariates. Each radiographic parameter was then added individually, and model performance was compared using the change in the coefficient of determination (ΔR2) and the corrected Akaike information criterion (AICc). Smaller AICc values indicate better fit, 21 and ΔAICc was calculated relative to the lowest AICc. To evaluate the associations of radiographic parameters with each JOABPEQ domain, we assessed PFA−(PI−LL) in addition to established radiographic parameters associated with HRQOL, including SVA, PT, and PI−LL. 1 Specifically, we constructed separate baseline linear regression models for each of the five JOABPEQ domain scores including age, sex, and BMI, and then added SVA, PT, PI−LL, or PFA−(PI−LL) individually to compare model performance using ΔR2 and AICc.
As an exploratory analysis, receiver operating characteristic (ROC) curves were generated for the radiographic parameter that demonstrated the greatest incremental explanatory power for FI and SVA in the confounder-adjusted hierarchical regression analyses, and optimal cutoff values were derived to discriminate FI >10° and SVA >95 mm.2,14 The area under the curve (AUC) was calculated, and the optimal cutoff was determined using the Youden index. Nonparametric bootstrap resampling (5000 iterations) was used to obtain 95% CIs for the AUC, cutoff, sensitivity, and specificity.
Correlation analyses and confounder-adjusted hierarchical regression models were performed using Prism 10 for Mac (GraphPad Software, Boston, MA). ROC and bootstrapping analyses were performed in R (pROC package). Statistical significance was set at P < 0.05.
Results
Reliability of Radiographic Measurements
The Intraclass Correlation Coefficients of Interobserver and Intraobserver Agreement
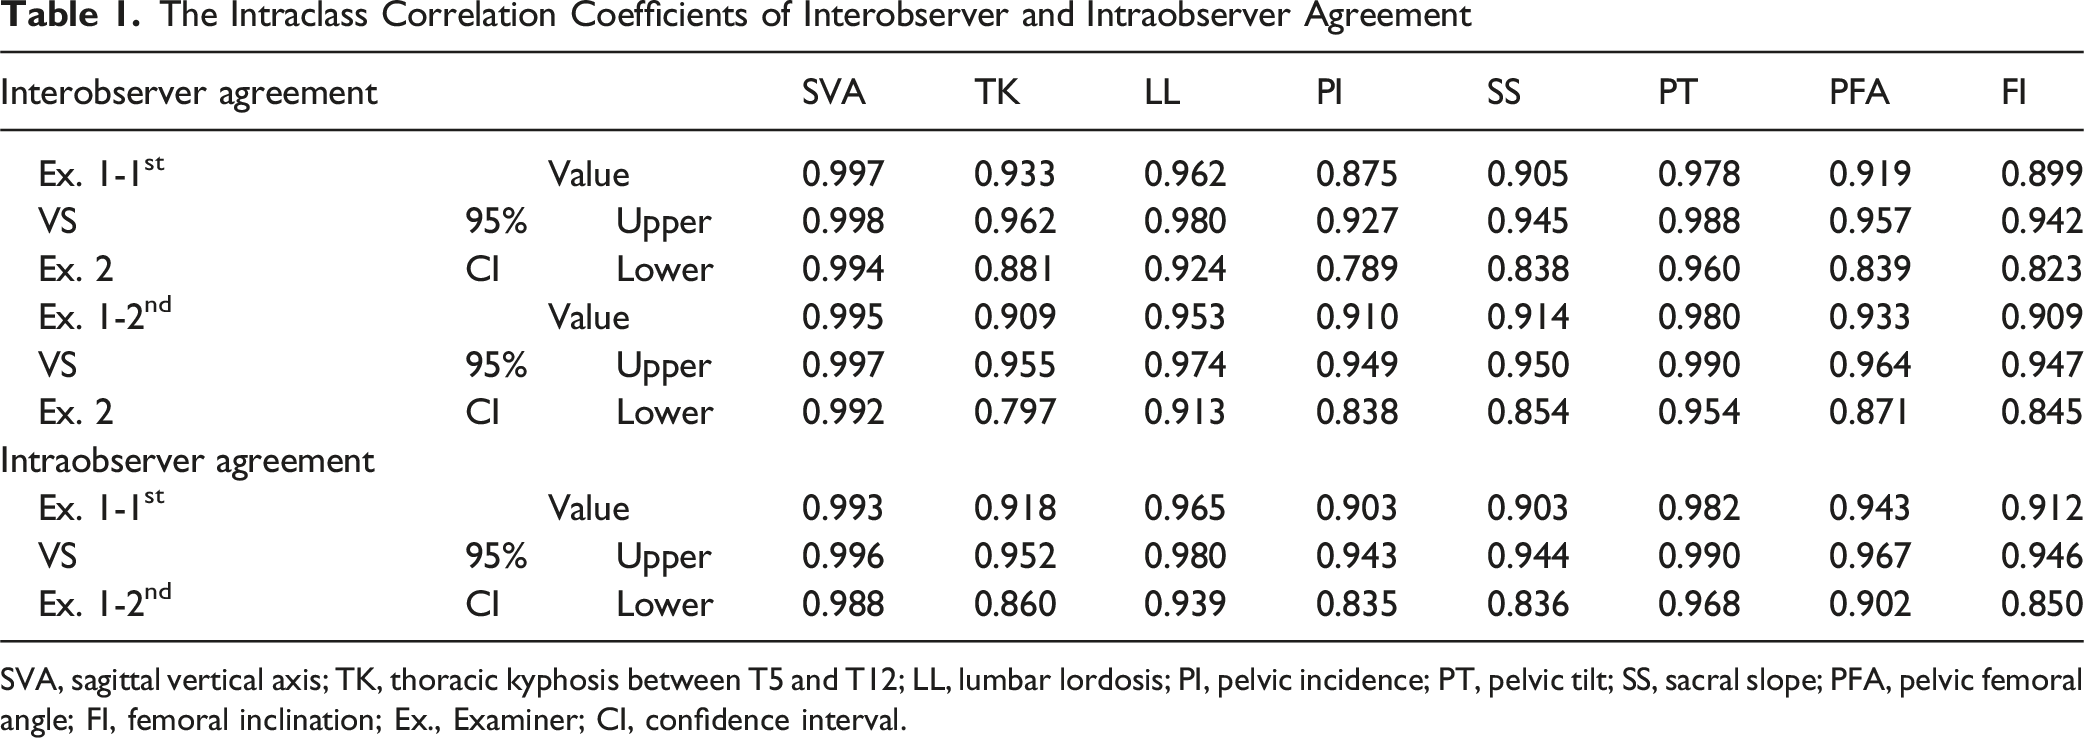
SVA, sagittal vertical axis; TK, thoracic kyphosis between T5 and T12; LL, lumbar lordosis; PI, pelvic incidence; PT, pelvic tilt; SS, sacral slope; PFA, pelvic femoral angle; FI, femoral inclination; Ex., Examiner; CI, confidence interval.
Patient Characteristics and Radiographic Parameters
Patient Characteristics and Radiographic Parameters (Mean ± Standard Deviation (SD))
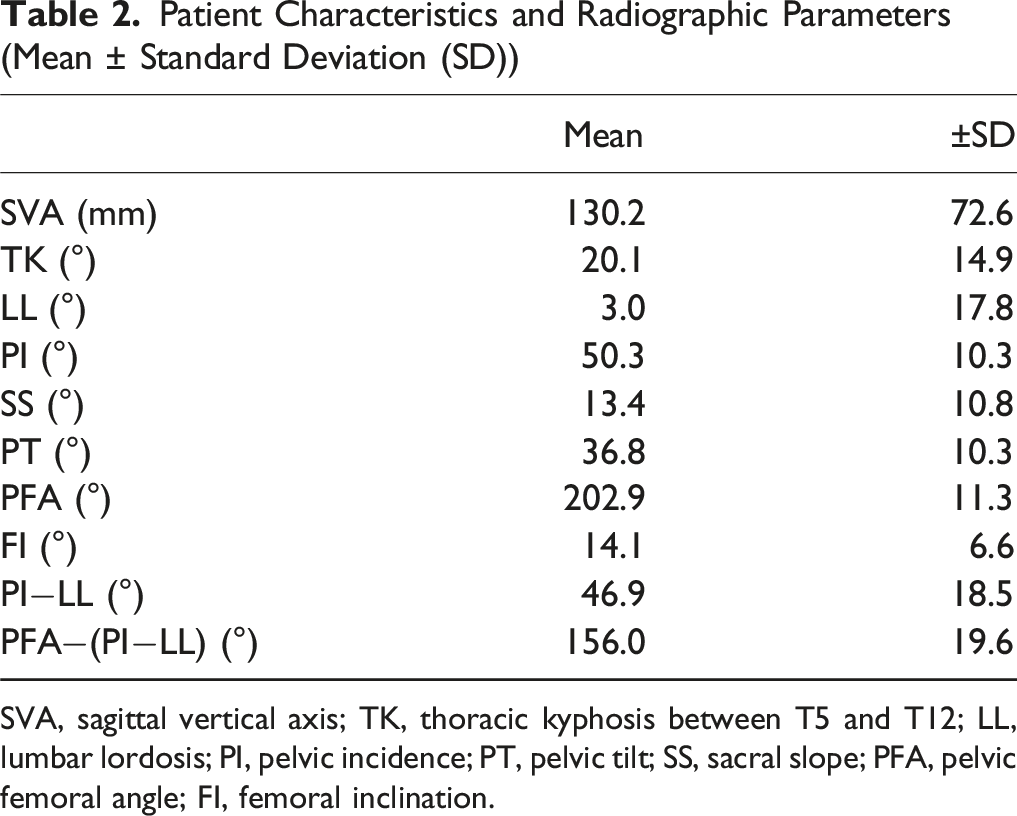
SVA, sagittal vertical axis; TK, thoracic kyphosis between T5 and T12; LL, lumbar lordosis; PI, pelvic incidence; PT, pelvic tilt; SS, sacral slope; PFA, pelvic femoral angle; FI, femoral inclination.
Correlations Among Radiographic Parameters
Correlations of Each Radiographic Parameter
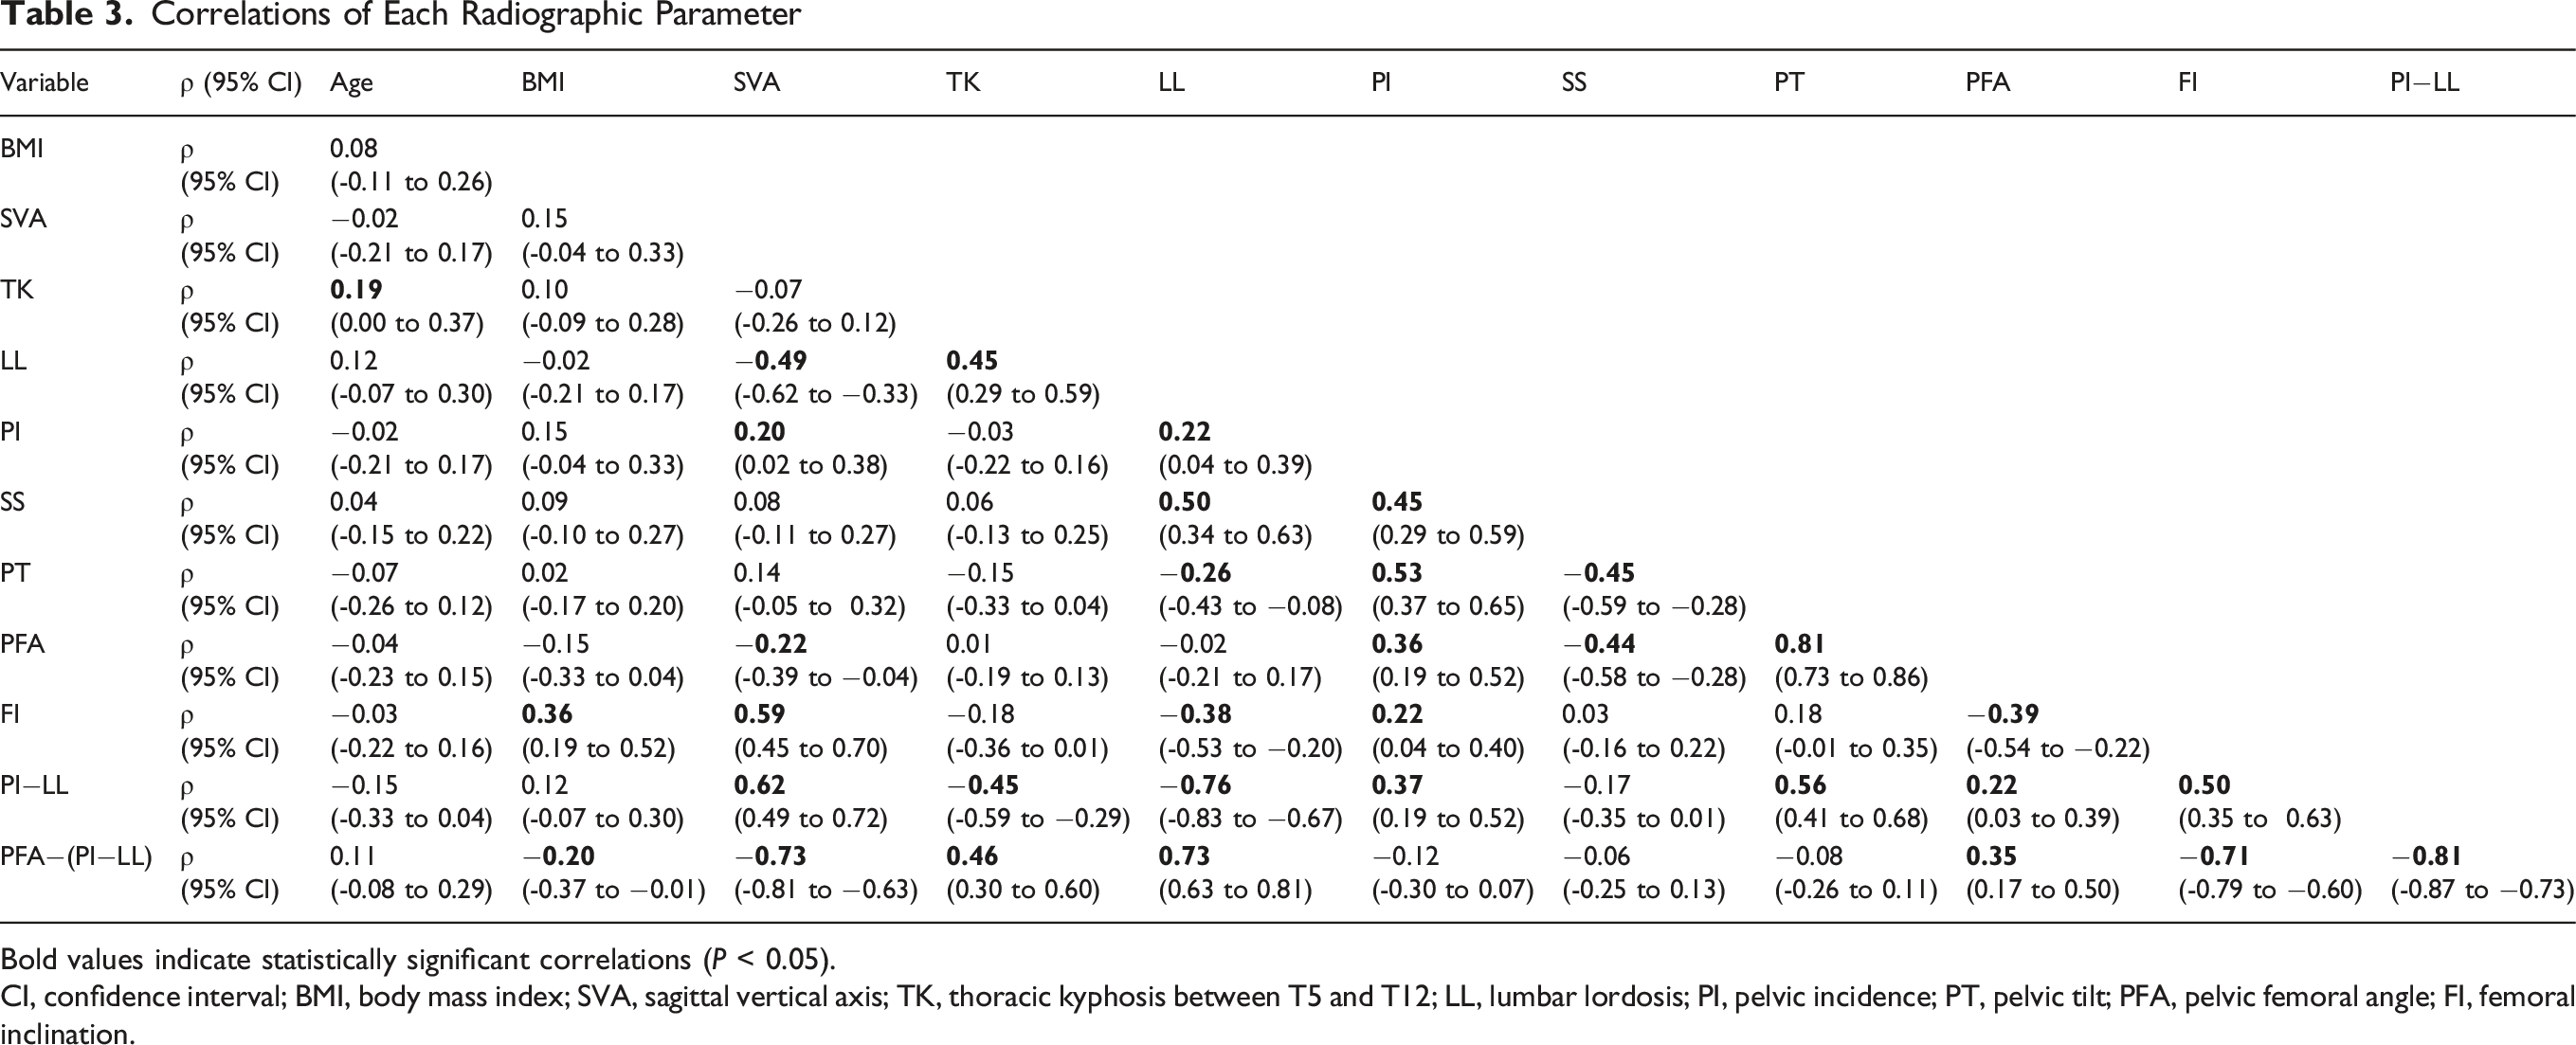
Bold values indicate statistically significant correlations (P < 0.05).
CI, confidence interval; BMI, body mass index; SVA, sagittal vertical axis; TK, thoracic kyphosis between T5 and T12; LL, lumbar lordosis; PI, pelvic incidence; PT, pelvic tilt; PFA, pelvic femoral angle; FI, femoral inclination.
Radiographic Determinants of FI
Radiographic Determinants of FI
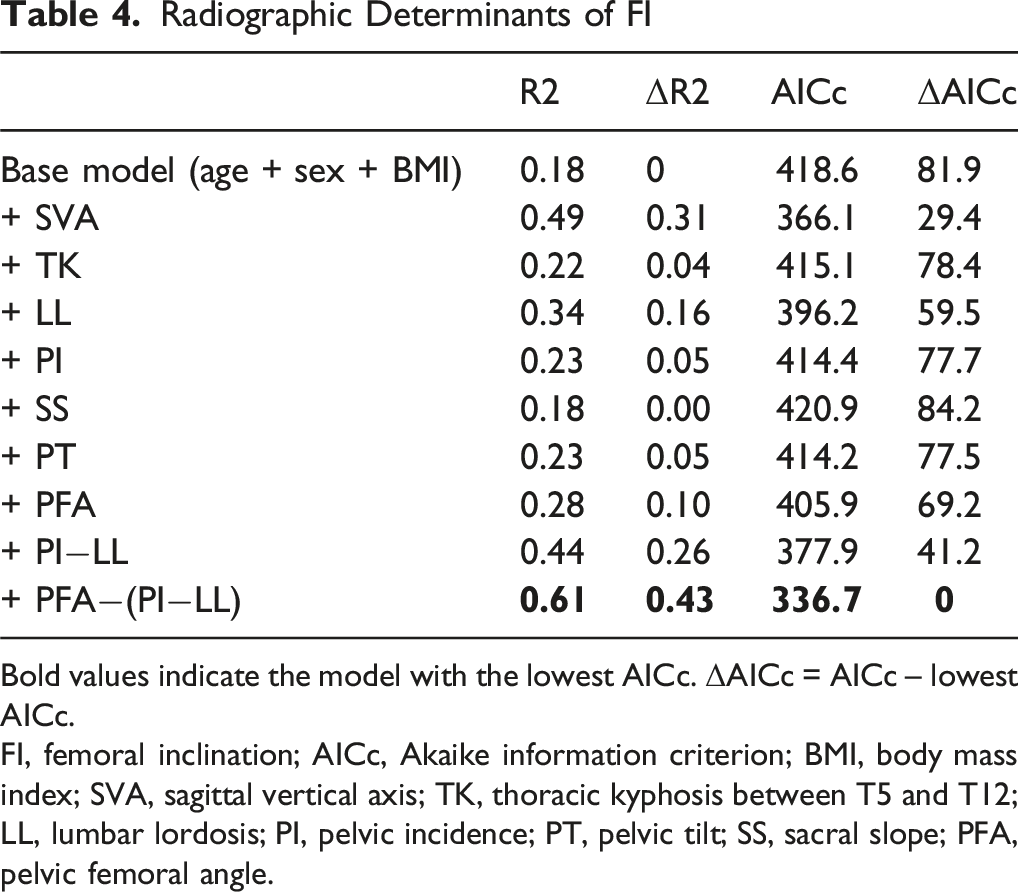
Bold values indicate the model with the lowest AICc. ΔAICc = AICc – lowest AICc.
FI, femoral inclination; AICc, Akaike information criterion; BMI, body mass index; SVA, sagittal vertical axis; TK, thoracic kyphosis between T5 and T12; LL, lumbar lordosis; PI, pelvic incidence; PT, pelvic tilt; SS, sacral slope; PFA, pelvic femoral angle.
Radiographic Determinants of SVA
Radiographic Determinants of SVA
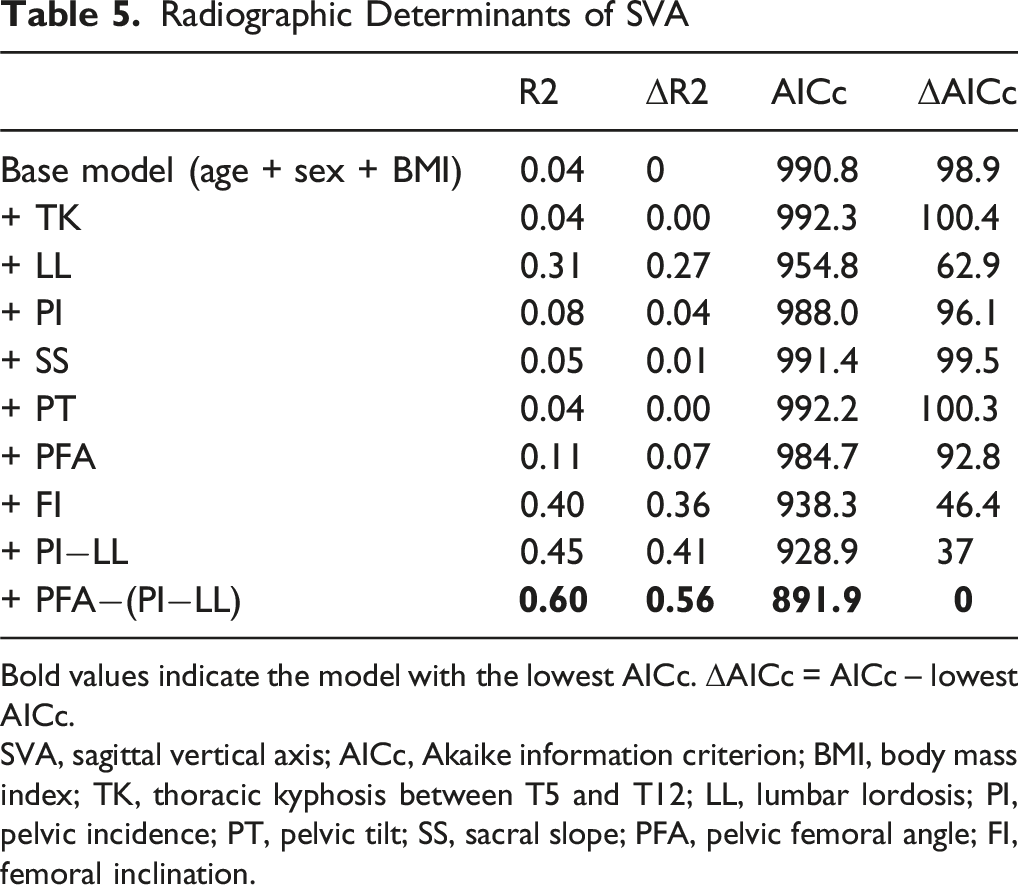
Bold values indicate the model with the lowest AICc. ΔAICc = AICc – lowest AICc.
SVA, sagittal vertical axis; AICc, Akaike information criterion; BMI, body mass index; TK, thoracic kyphosis between T5 and T12; LL, lumbar lordosis; PI, pelvic incidence; PT, pelvic tilt; SS, sacral slope; PFA, pelvic femoral angle; FI, femoral inclination.
Correlation between Radiographic Parameters and JOABPEQ Domain Scores
Correlations Between Radiographic Parameters and JOABPEQ Domains
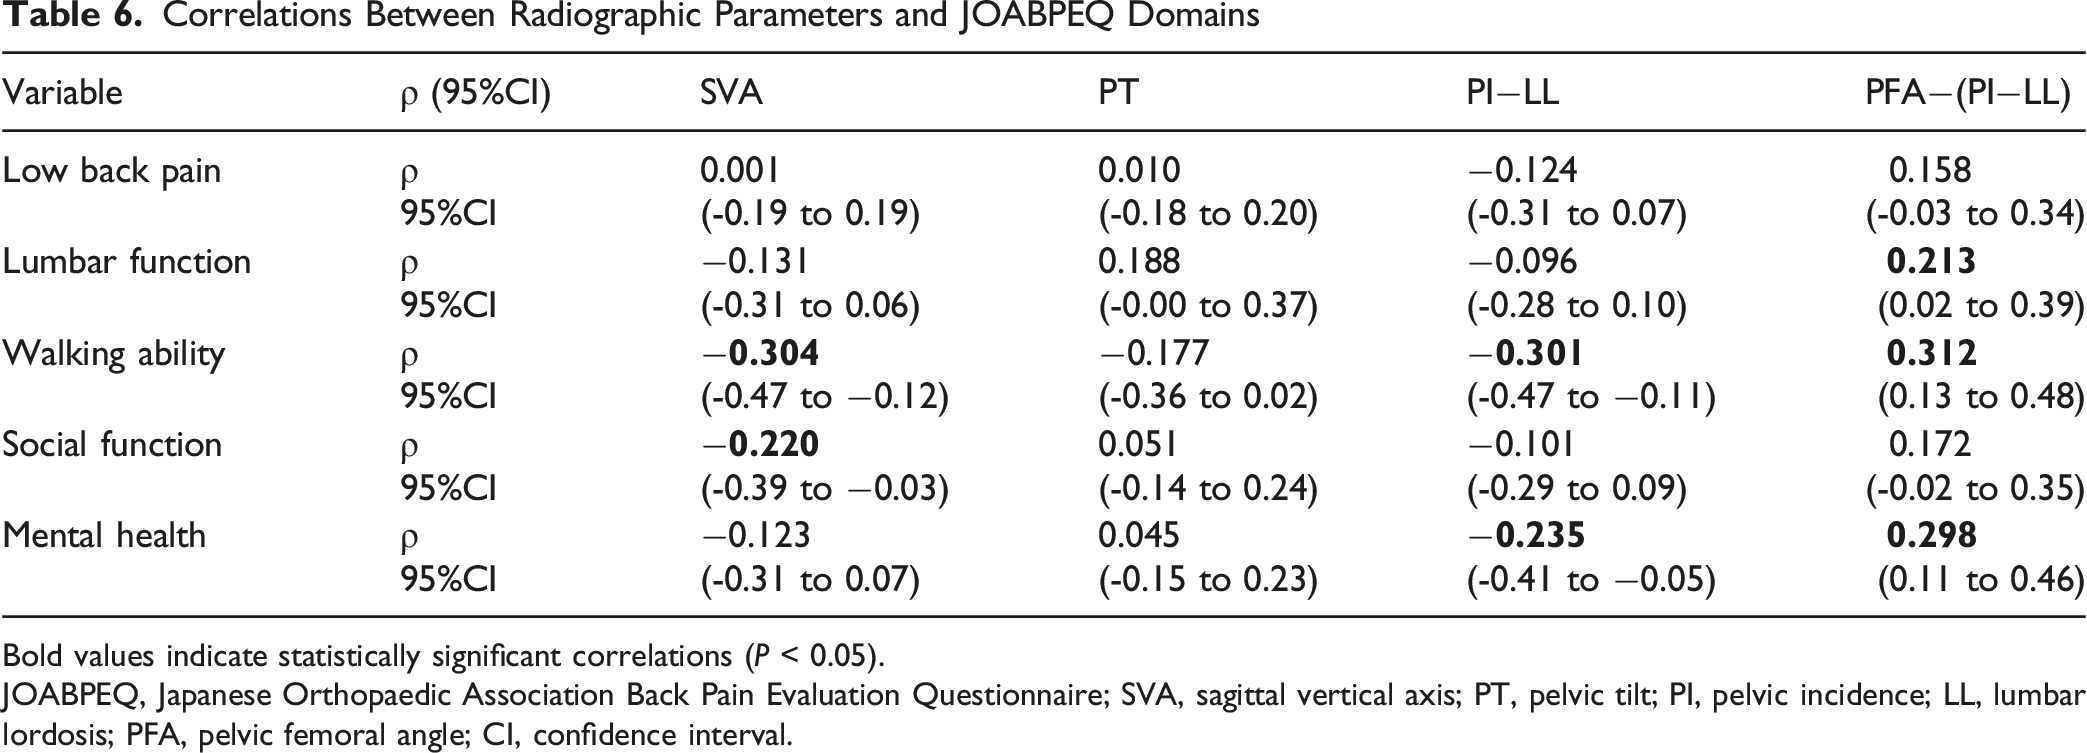
Bold values indicate statistically significant correlations (P < 0.05).
JOABPEQ, Japanese Orthopaedic Association Back Pain Evaluation Questionnaire; SVA, sagittal vertical axis; PT, pelvic tilt; PI, pelvic incidence; LL, lumbar lordosis; PFA, pelvic femoral angle; CI, confidence interval.
Radiographic Determinants of JOABPEQ Domains
Radiographic Determinants of JOABPEQ
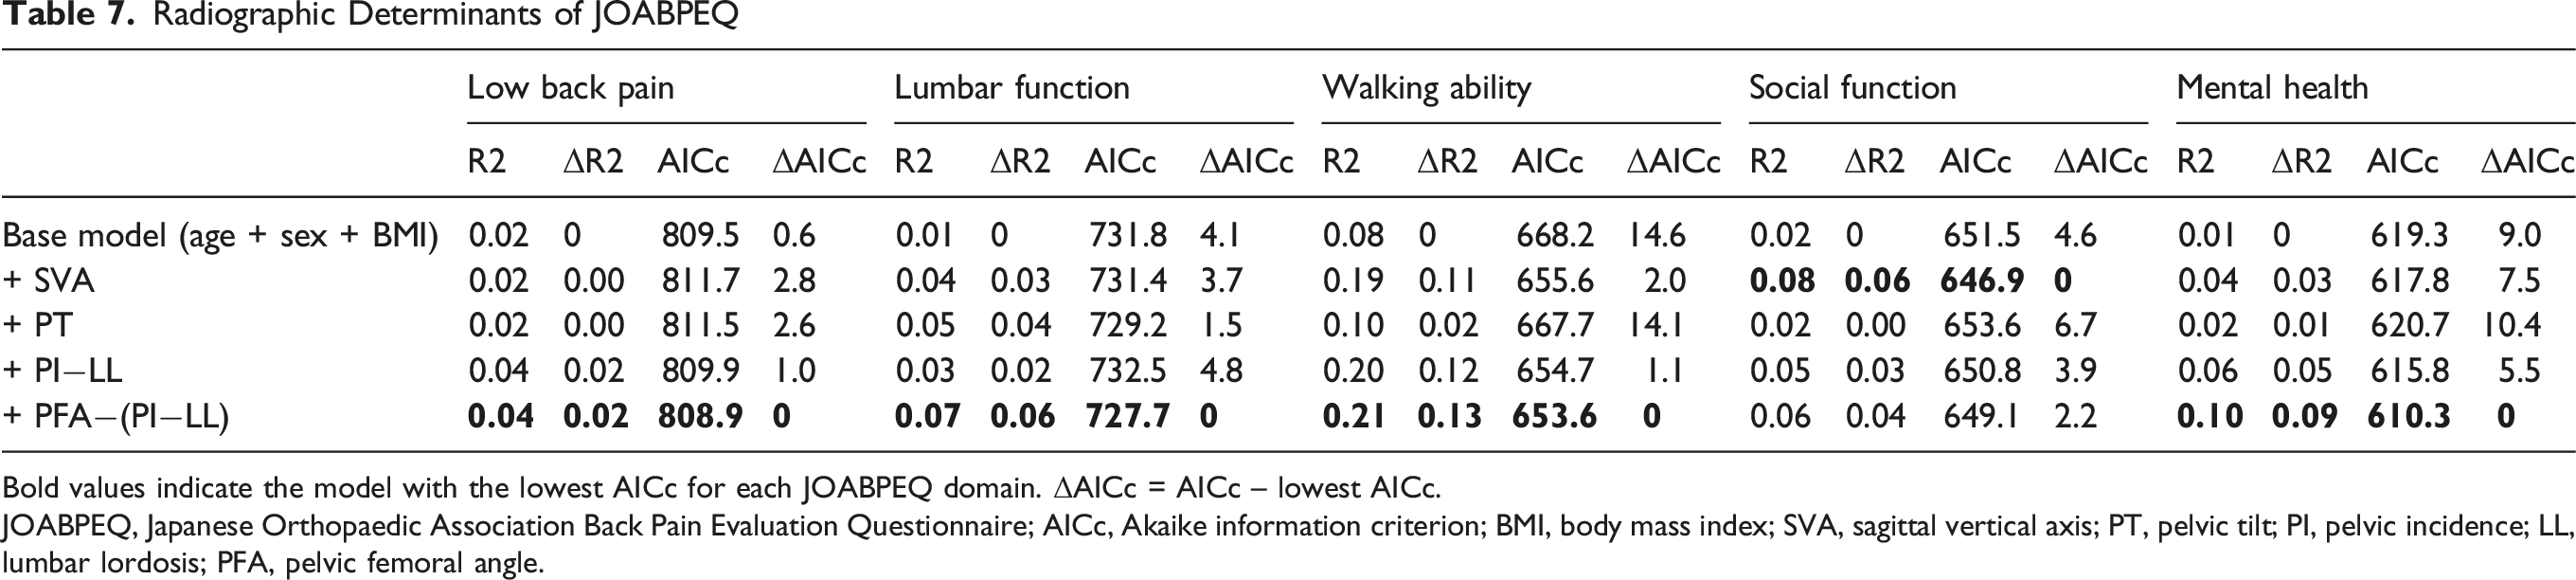
Bold values indicate the model with the lowest AICc for each JOABPEQ domain. ΔAICc = AICc – lowest AICc.
JOABPEQ, Japanese Orthopaedic Association Back Pain Evaluation Questionnaire; AICc, Akaike information criterion; BMI, body mass index; SVA, sagittal vertical axis; PT, pelvic tilt; PI, pelvic incidence; LL, lumbar lordosis; PFA, pelvic femoral angle.
ROC Curve Analyses of PFA−(PI−LL) for FI and SVA
ROC Curve Analyses of PFA−(PI−LL)
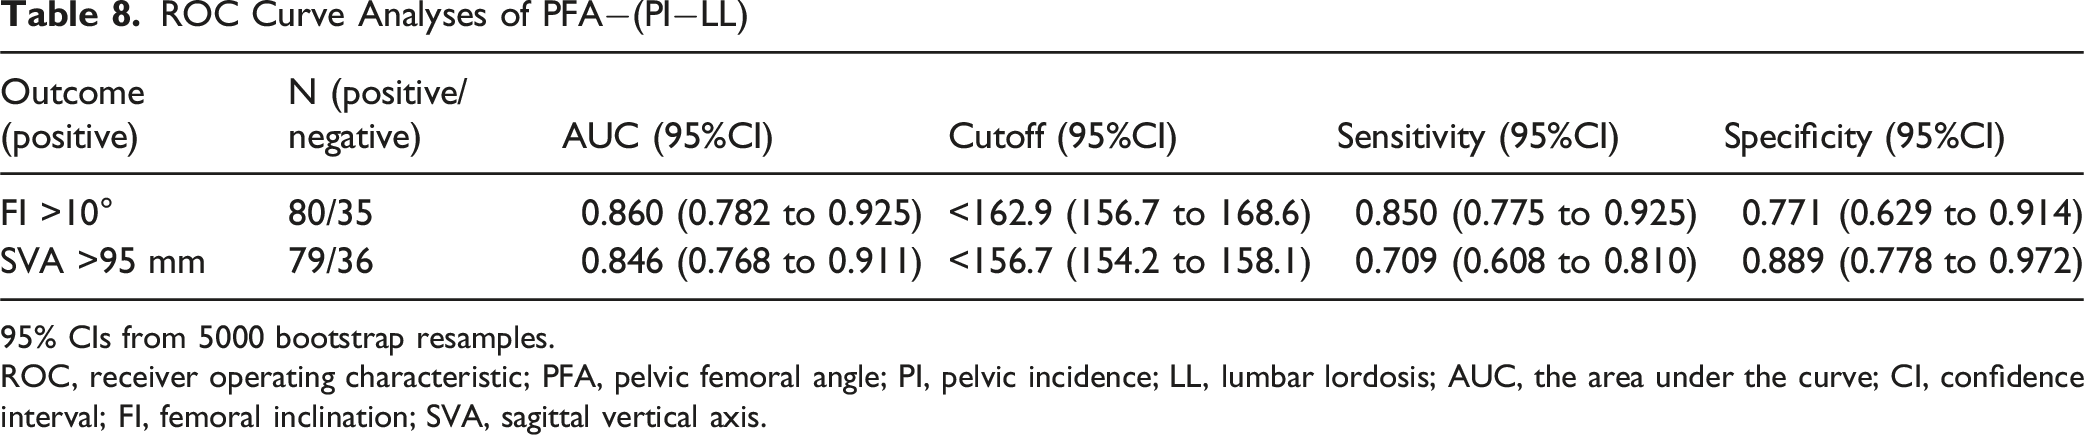
95% CIs from 5000 bootstrap resamples.
ROC, receiver operating characteristic; PFA, pelvic femoral angle; PI, pelvic incidence; LL, lumbar lordosis; AUC, the area under the curve; CI, confidence interval; FI, femoral inclination; SVA, sagittal vertical axis.
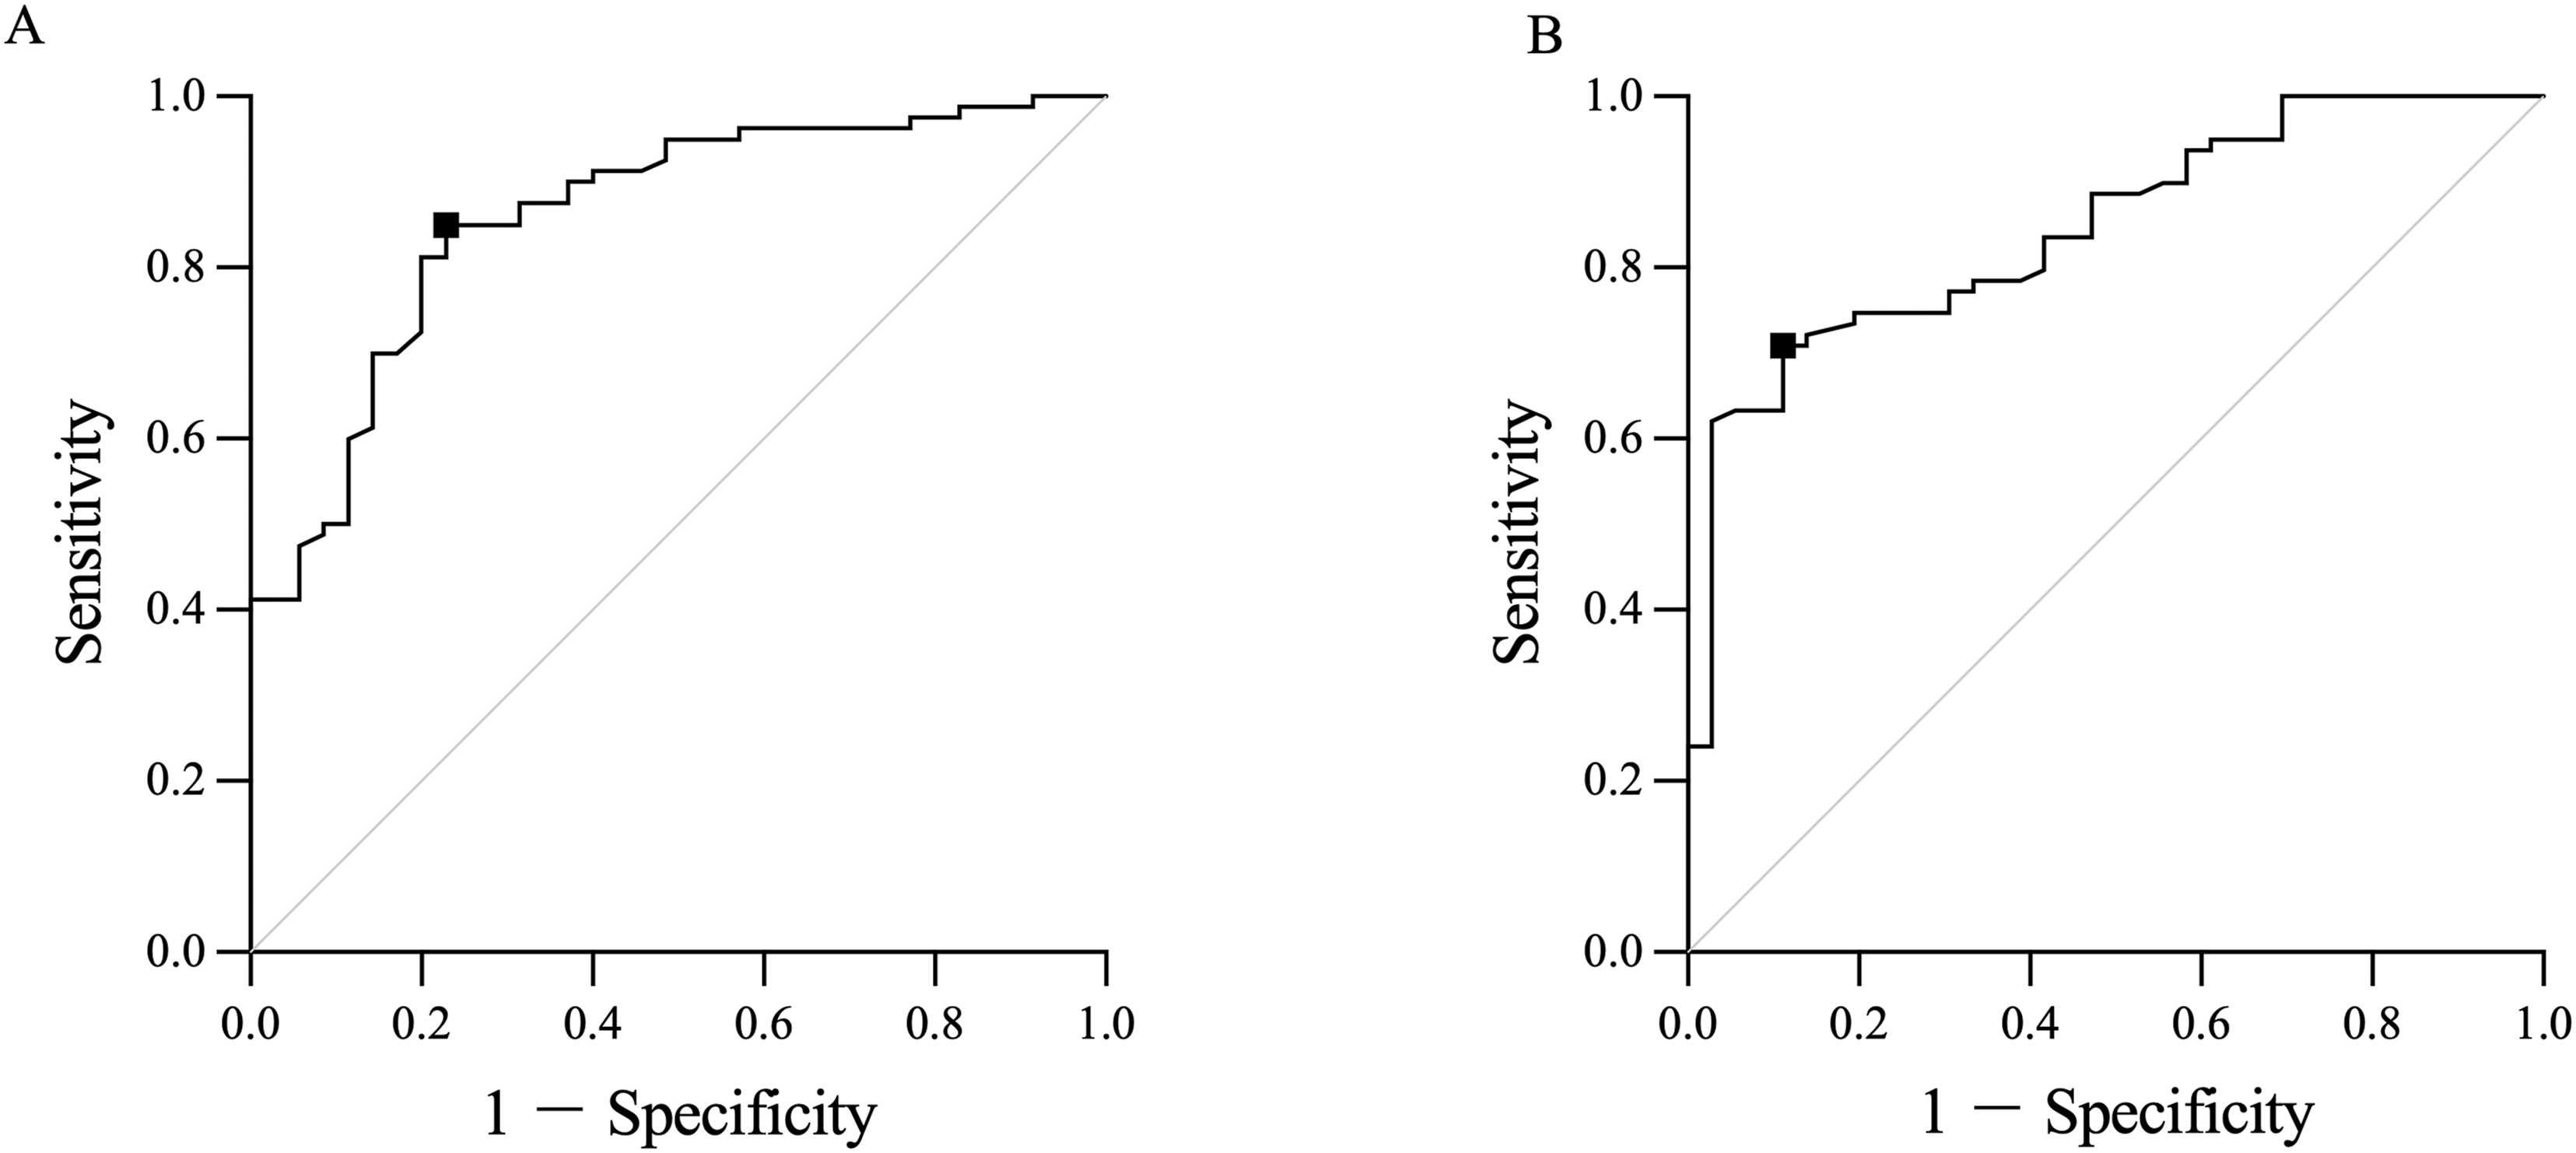
Receiver operating characteristic (ROC) curve analysis of PFA−(PI−LL) for predicting femoral inclination (FI) and sagittal vertical axis (SVA). A: ROC curve for FI > 10°. B: ROC curve for SVA > 95 mm. The black squares (■) indicate the optimal cutoff points identified by the Youden index. The diagonal line indicates no discrimination (the area under the curve (AUC) = 0.5). Table 8 summarizes AUC, cutoff, sensitivity, and specificity with 95% CIs from 5,000 bootstrap resamples.
Presentation of Representative Cases
Figure 3 shows representative cases illustrating compensation patterns according to differences in PFA−(PI−LL) values. Case A showed the highest PFA−(PI−LL) value (173.1°) among the three, despite the largest PI−LL of 47.0°, together with low FI (2.0°) and low SVA (41.8 mm), indicating relatively preserved hip compensatory reserve. Case B showed a PFA−(PI−LL) value of 160.4°, with a PI−LL of 44.1°, FI of 11.1°, and SVA of 95.3 mm, representing a case near the ROC-derived reference range. Case C showed a lower PFA−(PI−LL) value (136.4°), with a PI−LL of 37.7°, marked knee-flexion compensation (FI, 28.6°), and severe sagittal malalignment (SVA, 160.2 mm). Representative cases illustrating the continuum of compensation patterns according to PFA−(PI−LL). (A) Case A with PI−LL of 47.0°, PFA−(PI−LL) of 173.1°, femoral inclination (FI) of 2.0°, and sagittal vertical axis (SVA) of 41.8 mm. (B) Case B with PI−LL of 44.1°, PFA−(PI−LL) of 160.4°, FI of 11.1°, and SVA of 95.3 mm. (C) Case C with PI−LL of 37.7°, PFA−(PI−LL) of 136.4°, FI of 28.6°, and SVA of 160.2 mm. Lower PFA−(PI−LL) values were associated with greater knee-flexion compensation and more severe sagittal malalignment across the three cases.
Discussion
This study yielded 3 main findings. First, although PT is an established and clinically valuable parameter in ASD classification systems, it was not significantly associated with SVA or JOABPEQ in this cohort. This suggests that, while PT reflects pelvic retroversion, it may be less suitable as a specific indicator of clinically relevant trunk anterior inclination or reduced HRQOL in severe kyphotic ASD. Second, PFA−(PI−LL) was the radiographic parameter that best explained both the knee flexion compensation and forward trunk inclination, as reflected by FI and SVA, respectively. Third, PFA−(PI−LL) provided clinically interpretable reference values, supported by ROC-based discrimination of FI >10° and SVA >95 mm. Collectively, these findings highlight the limitations of relying on PT to assess hip compensation and suggest that PFA−(PI−LL) may capture the transition in compensatory strategy— that is, a PFA−(PI−LL) value of approximately 160° may serve as a practical reference point at which reduced hip compensatory reserve is accompanied by clinically prominent knee-flexion compensation and marked sagittal decompensation (FI >10° and/or SVA >95 mm).
When standing upright, humans must keep the line of gravity within the base of support.25,26 To maintain sagittal balance, compensatory mechanisms are recruited not only in the spine but also in the lower extremities.3,27 As spinopelvic mismatch increases, compensation primarily involving hip extension is recruited.4,13 This corrects the forward shift in the line of gravity by posteriorly rotating the pelvis and trunk, while also efficiently improving forward trunk inclination.4-7 However, when hip extension compensation reaches its limit, additional compensation primarily involving knee joint flexion is added.4,13 Although knee flexion compensation is useful for returning the line of gravity within the base of support, it is accompanied by posterior pelvic shift.
8
Regardless of the degree of posterior pelvic shift, the position of T9 is generally maintained near the line of gravity.
3
The greater the posterior pelvic shift, the more likely it is to be accompanied by anterior trunk rotation with T9 as the fulcrum.
3
Therefore, while knee flexion compensation may correct the line of gravity, it offers little improvement in trunk inclination. Consequently, it is thought to be associated with pain, functional impairment, and reduced HRQOL.5,8-13 Therefore, while both hip extension compensation and knee flexion compensation may help realign the center of mass, they differ in their clinical implications, particularly with respect to how much they improve forward trunk inclination. Moreover, from a biomechanical standpoint, hip and knee compensations represent contrasting strategies in terms of lower-limb energy efficiency. In energy-efficient standing, the line of gravity is thought to pass slightly posterior to the hip and anterior to the knee, allowing passive tension of capsuloligamentous structures and minimal muscular activity within the “cone of economy”.8-10 Hip extension with pelvic retroversion may maintain the gravity line within this efficient range while simultaneously improving forward trunk inclination.8-10 In contrast, once knee flexion compensation is introduced, posterior pelvic shift combined with knee flexion tends to shift the gravity line anterior to the hip and posterior to the knee, increasing dependence on active quadriceps and lower-extremity extensor activity and leading to a less energy-efficient posture (Figure 4).8-10 Therefore, to understand sagittal postural compensation, it is necessary to distinguish the extent to which hip compensation remains effective from the extent to which compensatory knee flexion is recruited, rather than treating posterior pelvic tilt as a single, unified phenomenon. Conceptual comparison of conventional and proposed compensation phase frameworks. The solid boxes indicate the conventional pelvic tilt-centered phase classification (pelvic compensation phase and lower-limb compensation phase). The double-lined boxes indicate our proposed classification, consisting of a hip compensation phase followed by a knee compensation phase as hip extension compensatory reserve becomes insufficient, represented by pelvic femoral angle − (pelvic incidence − lumbar lordosis). The vertical lines denote the line of gravity, and horizontal arrows denote posterior pelvic shift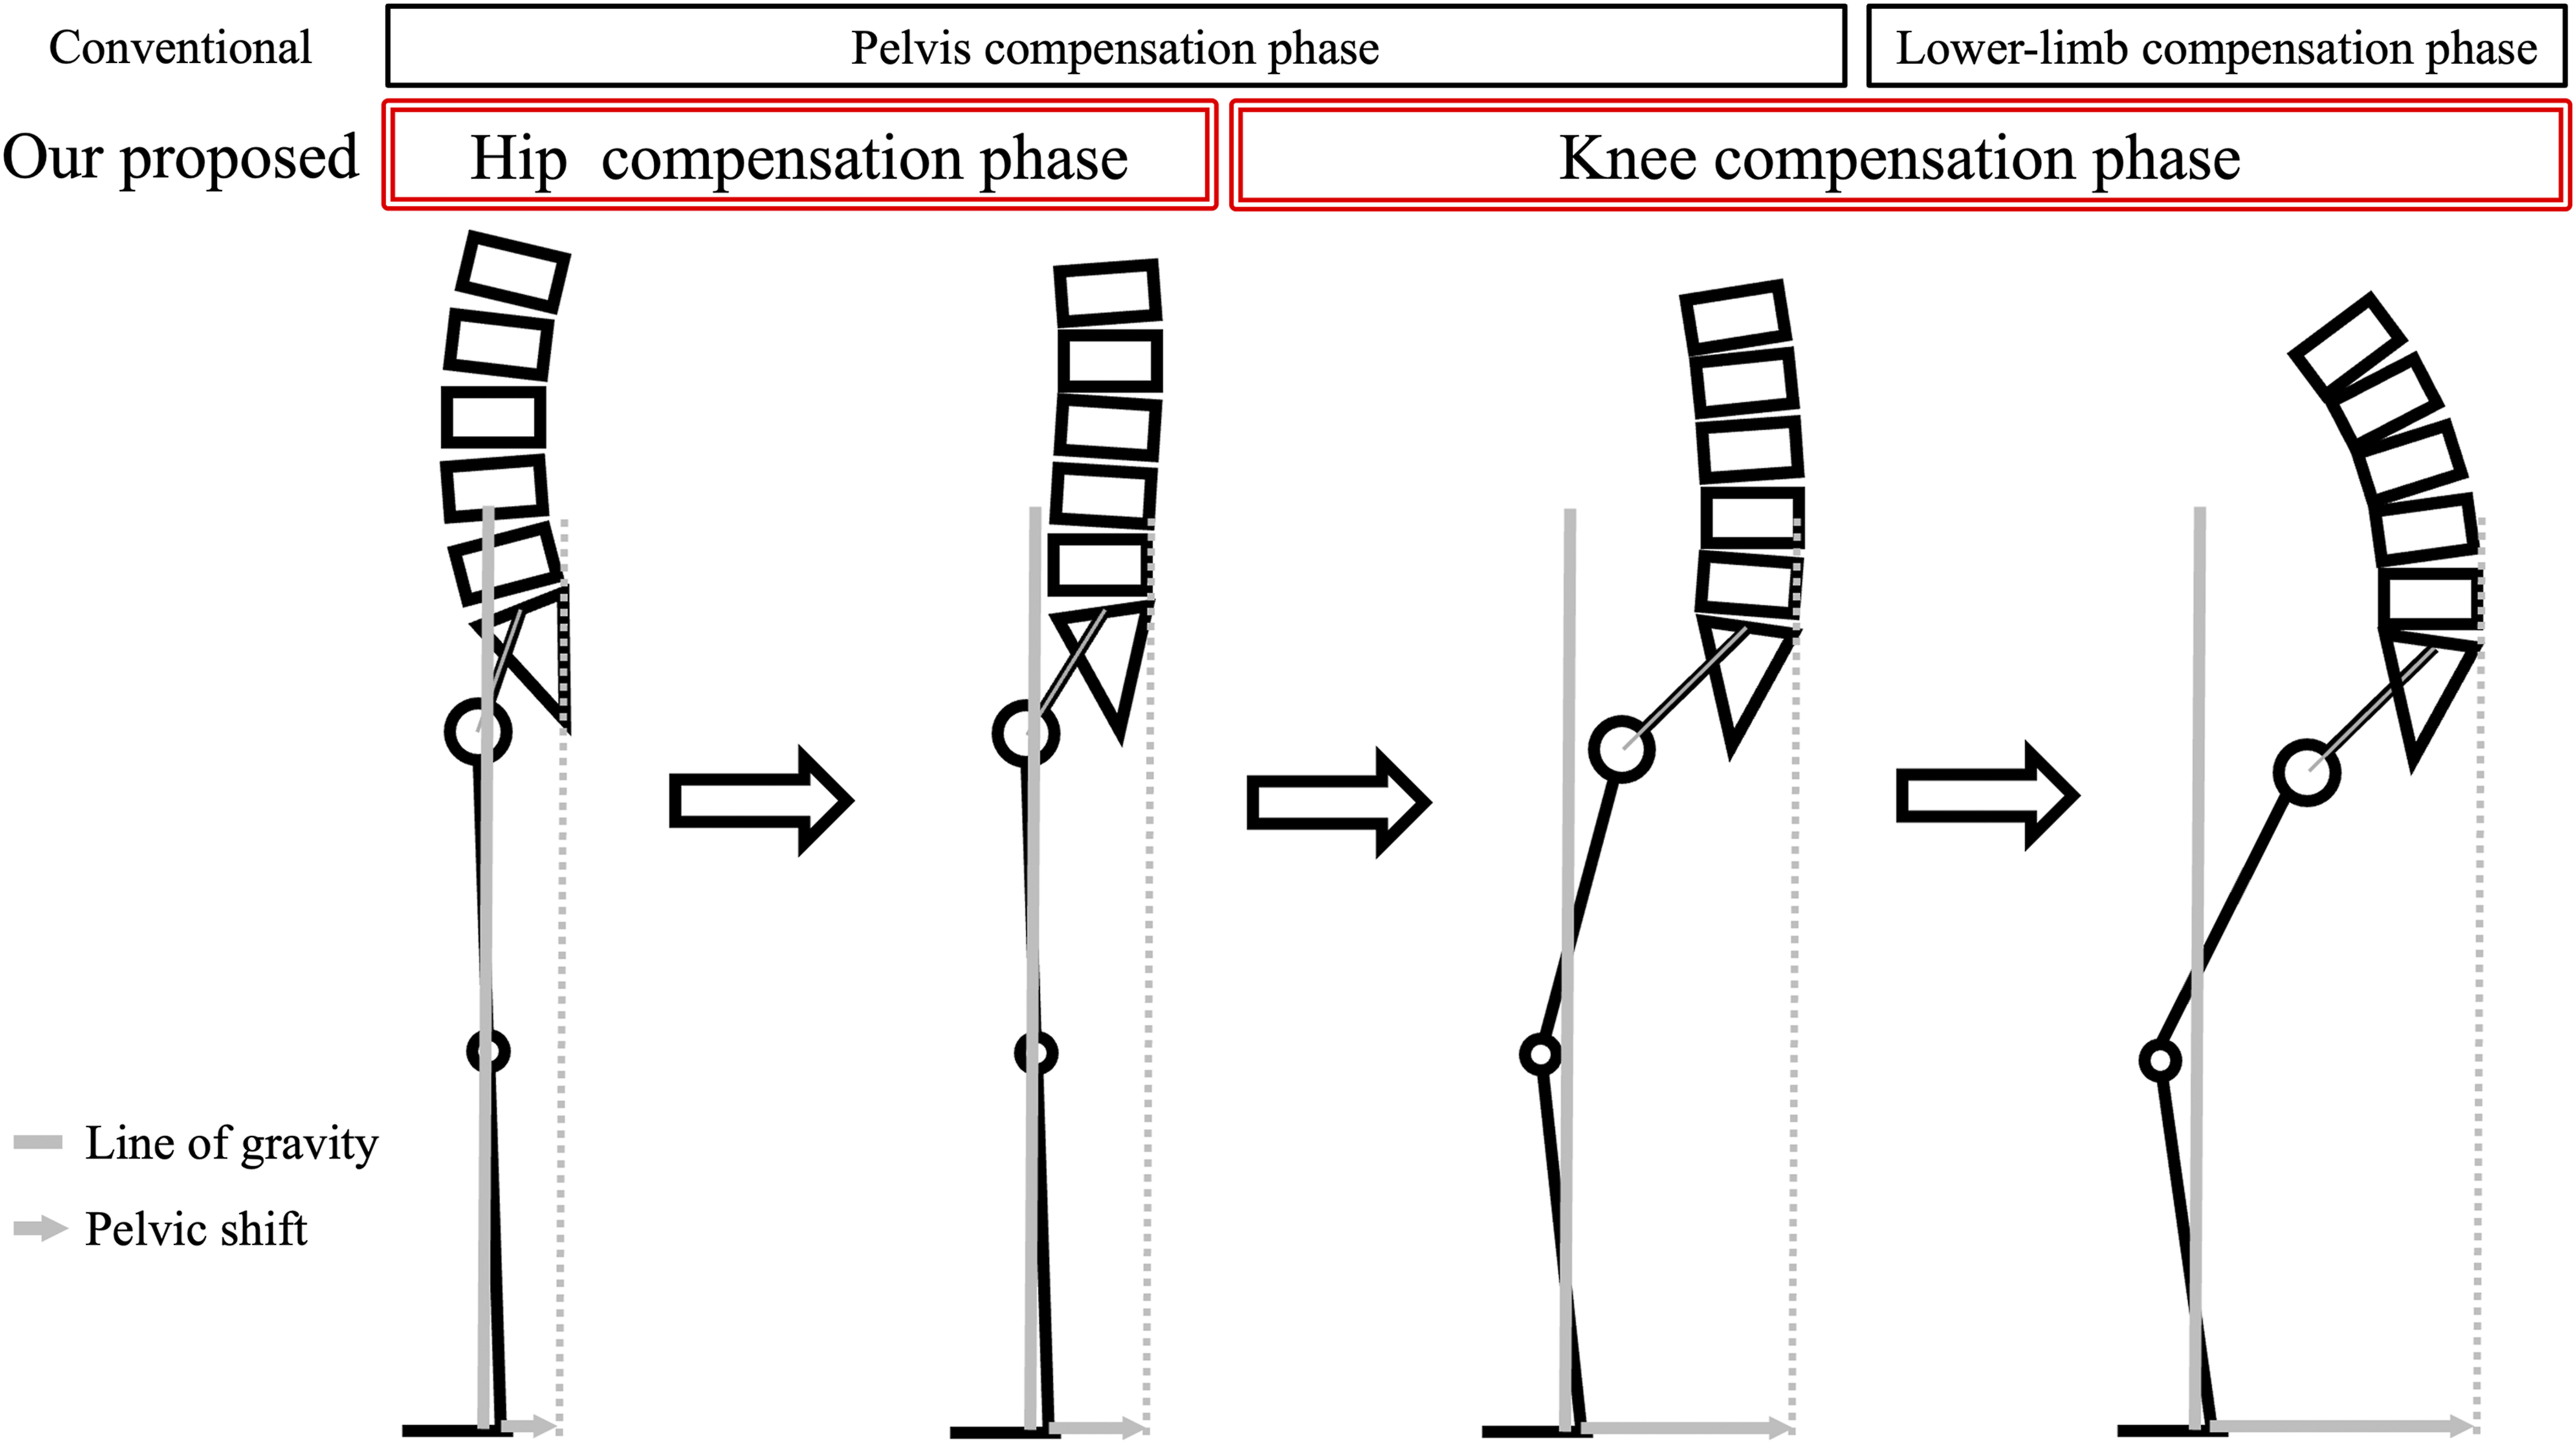
A hierarchical compensation model has been widely accepted in ASD, in which spinopelvic mismatch is regarded as the primary structural problem, PT is recruited to compensate for the mismatch, and once pelvic compensation is exhausted, SVA increases—reflecting a breakdown of global sagittal alignment—with lower extremity compensations becoming prominent.1,3,8,28 Within this framework, PT has been used as a key marker of hip extension compensation.3,8 Prior reports have suggested that after the limits of pelvic compensation are reached, compensations at the knee and ankle joints predominate. 3 However, geometrically, PT can be expressed as PT = PFA −180° + FI,15,25 indicating that PT is inherently a composite parameter of the entire lower extremity, influenced by both sagittal hip and knee alignments (Figure 1B). When hip extension is the main compensatory mechanism and knee flexion is minimal, FI is small and PT can approximate PFA. Once knee compensation is recruited and FI increases, the same PT value may reflect different combinations of PFA and FI (e.g., large PFA with small FI vs small PFA with large FI). In this study, PT correlated strongly with PFA; however, given that PT is geometrically influenced not only by hip extension but also by knee flexion (as reflected by FI), its utility as a pure indicator of hip extension compensation in ASD is limited. Taken together, because “pelvic retroversion” is a composite manifestation that can involve both hip- and knee-related compensations, a pelvic compensation framework alone may not disentangle the transition between fundamentally different strategies—hip extension compensation vs knee flexion compensation. In contrast, our hip compensation model provides a continuous framework that distinguishes the phase in which hip extension compensation keeps pace with increasing PI−LL from the phase in which this capacity is exceeded and compensatory knee flexion is recruited (Figure 4). Hip compensatory capacity varies among individuals,13,25,30 and so does the extent to which PFA can increase in response to increasing PI−LL. Therefore, PFA−(PI−LL) may serve as a useful parameter for characterizing the state in which hip compensation has reached its limit and knee-dominant compensation becomes prominent.
Previous studies have reported interindividual variability in the capacity for hip extension compensation, 9 and even with a similar PI−LL, posture can differ substantially depending on hip alignment.4,13 Accordingly, there is a need for an indicator that more directly reflects hip compensatory capacity. As shown in the present study, PT and PFA showed only weak associations with FI and SVA, indicating that these single measures alone are insufficient to determine whether hip extension compensation has reached its limit.29,30 The degree of compensation required at the hip joint is determined by spinopelvic mismatch (PI−LL), 30 necessitating an evaluation perspective that considers hip joint alignment in relation to PI−LL.13,30 Building on the concept of spinopelvic–hip harmony proposed, 13 we investigated the relationship between spinopelvic–hip harmony [PFA−(PI−LL)], knee flexion compensation (FI), and forward trunk inclination (SVA) in ASD, and examined its usefulness as an indicator of hip joint compensation failure. Consequently, PFA−(PI−LL) provided the best model fit for both FI and SVA in hierarchical regression, as measured by both ΔR2 and AICc among single-parameter models, and outperformed conventional indicators in explaining recruitment of knee compensation and worsening posture associated with failure of hip extension compensation. These findings support a compensation framework in which sagittal hip alignment (PFA) should be interpreted relative to PI−LL (i.e., PFA−[PI−LL]) to understand knee-flexion recruitment. While hip extension compensation is sufficient, PFA increases in parallel with PI−LL, and PFA−(PI−LL) remains relatively constant. However, once hip extension reaches its limit, PFA plateaus and PFA−(PI−LL) shifts in the negative direction.13,30 At this stage, worsening SVA occurs alongside recruitment of knee flexion, as reflected by increased FI. 13 Therefore, PFA−(PI−LL) can be considered a useful parameter because it may capture the progression from a state in which hip extension compensation tracks an increasing PI−LL to a state of hip compensatory failure with recruitment of compensatory knee flexion.
ROC analysis showed that a PFA−(PI−LL) value of approximately 160° may serve as a practical reference value for stratifying patients with prominent knee-flexion compensation (FI >10°) and severe sagittal malalignment (SVA >95 mm).2,14 Representative cases in Figure 3 help illustrate this clinical continuum. Although PI–LL did not correspond consistently to the degree of decompensation across the three representative cases, lower PFA−(PI−LL) values were associated with greater knee-flexion compensation and more severe sagittal malalignment. In particular, Case B showed a PFA−(PI−LL) value near the ROC-derived reference range, together with FI around 10° and SVA around 95 mm, whereas Case A and Case C represented relatively preserved and markedly decompensated states, respectively. PFA−(PI−LL), knee-flexion compensation, and forward trunk inclination all change along a continuum; therefore, this value should be interpreted not as a strict threshold, but as a practical reference for clinically meaningful sagittal decompensation.
In this study, correlations between radiographic parameters and JOABPEQ domains were generally weak, and no parameter showed a significant correlation with the low back pain domain. In contrast, Fujita et al reported that PFA−(PI−LL) was significantly correlated with all JOABPEQ domains in a mixed cohort of osteoporosis outpatients and ASD patients. 13 This discrepancy is likely attributable to differences in the study populations: in the present cohort, all patients were hospitalized for severe back pain and postural abnormality, and JOABPEQ scores were clustered within a relatively narrow range, which may have reduced the detectability of correlations. Moreover, low back pain in ASD is multifactorial—encompassing discogenic, facet-mediated, and radicular components, as well as coronal malalignment—and may not be explained by sagittal alignment alone. 31 Even within this restricted clinical spectrum, however, the lumbar function score was significantly correlated only with PFA−(PI−LL), and the walking ability score was correlated with SVA, PI−LL, and PFA−(PI−LL). In the present cohort, PT was not significantly associated with any JOABPEQ domain. Consistently, in the hierarchical regression analyses, the +PFA−(PI−LL) model showed better fit than the +PT model for the walking ability domain (ΔAICc >10). Taken together, PFA−(PI−LL) was associated with lumbar function and walking ability in this cohort, suggesting that it may be a clinically relevant radiographic parameter.
This study has several limitations. First, this study was biased toward patients with severe ASD requiring inpatient treatment; therefore, we could not evaluate or derive clinically meaningful cutoff values in the milder range, such as around an SVA >40 mm corresponding to the SRS–Schwab “+” category. Accordingly, it may be difficult to generalize the cutoff values obtained in this study for use in determining treatment strategies across a broader patient spectrum, including outpatient settings. However, these cutoff values may still be useful for stratifying patients within severe ASD cohorts, serving as reference points for further subclassification among severe cases. Second, the sample size was modest and radiographs were obtained with different arm positions across centers, which may influence measured sagittal parameters, particularly SVA. Third, the cohort was predominantly female. Although this may partly reflect the clinical characteristics and epidemiology of elderly kyphotic ASD reported in registry-based studies, 32 caution is warranted when generalizing these findings to male populations or other ASD subgroups. Fourth, distal lower-extremity alignment could not be assessed directly because the imaging field did not include the knee and ankle joints; FI was used as a surrogate marker of knee-flexion compensation. Prospective studies using full-length lower-limb imaging (ideally EOS or comparable techniques) in a wider clinical spectrum—from normal individuals to kyphotic deformity—are warranted to validate these findings, clarify the clinical utility of spinopelvic–hip harmony, and refine clinically meaningful thresholds.
Conclusion
In a multicenter cohort of Japanese ASD patients with sagittal malalignment, PFA−(PI−LL) was the most informative radiographic parameter for explaining both the recruitment of compensatory knee flexion and sagittal decompensation after adjustment for age, sex, and BMI. These findings suggest that PFA−(PI−LL) may provide a more specific and clinically meaningful indicator of hip compensatory capacity and its failure in this population, with values around 160° serving as a practical reference point for clinically meaningful sagittal decompensation, including prominent knee flexion (FI >10°) and severe sagittal malalignment (SVA >95 mm).
Footnotes
ORCID iDs
Ethical Considerations
All procedures were conducted in accordance with the tenets of the 1964 Helsinki Declaration and its later amendments. Ethical approval was obtained from the appropriate institutional review board at our center. Participating institutions provided de-identified data/images for analysis in accordance with their institutional policies and data-sharing procedures. This study was approved by the Ethics Committee of Tohoku University (Approval code: 2022-1-912).
Consent to Participate
Given the retrospective nature of the study, the requirement for written informed consent to participate was waived by the institutional review board, and an opt-out consent process was used where applicable.
Author Contributions
Keisuke Ishikawa: Conceptualization; Methodology; Formal analysis; Visualization; Writing – original draft. Kohei Takahashi: Conceptualization; Methodology; Investigation; Data curation; Supervision; Writing – review & editing; Project administration. Ko Hashimoto: Supervision; Writing – review & editing. Kenichiro Yahata: Investigation; Data curation; Writing – review & editing. Kazuyoshi Baba: Investigation; Data curation; Writing – review & editing. Takahiro Onoki: Investigation; Data curation; Writing – review & editing. Ryo Fujita: Investigation; Data curation; Writing – review & editing. Junya Kusakabe: Investigation; Data curation; Writing – review & editing. Tomonori Kawaharada: Data curation; Writing – review & editing. Michiyoshi Sato: Writing – review & editing. Takeshi Nakamura: Writing – review & editing. Ryo Sugawara: Writing – review & editing. Kyoichi Handa: Writing – review & editing. Haruo Kanno: Writing – review & editing. Hiroshi Ozawa: Writing – review & editing. Yasuhisa Tanaka: Writing – review & editing. Toshimi Aizawa: Supervision; Writing – review & editing. All authors read and approved the final manuscript.
Funding
The authors received no financial support for the research, authorship, and/or publication of this article.
Declaration of Conflicting Interests
The authors declared no potential conflicts of interest with respect to the research, authorship, and/or publication of this article.
Data Availability Statement
The datasets generated and analyzed during the current study are not publicly available due to patient privacy and confidentiality requirements but are available from the corresponding author on reasonable request and with appropriate ethical approval