
Abstract
Study design/setting
Retrospective longitudinal study.
Purpose
Osteoporotic vertebral fractures (OVF) are common in middle-aged and elderly populations. However, few studies have predicted the risk of OVF from the perspective of the bone heterogeneity. This study conducted a longitudinal study to predict the risk of OVF in individuals over 50 years old based on habitat radiomics which can quantify heterogeneity of vertebral trabecular bone.
Methods
Individuals aged over 50 years who had not experienced OVF and underwent CT scans between 2016 and 2023 were enrolled and followed up until 2024. During the follow-up period, 107 cases developed new OVF, and 270 individuals without fractures were selected as the control group. Radiomic features of each pixel within the vertebra were extracted, and the optimal segmentation of vertebral sub-regions was determined using the K-means unsupervised clustering method.
Results
The habitat radiomics model significantly outperformed the CT value model (AUC = 0.702, DeLong test P-value = 0.001) and also surpassed the traditional radiomics model. The Cox proportional hazards analysis showed that the habitat radiomics risk score could serve as an independent predictor of vertebral fractures (hazards ratio = 1.092, 95% confidence interval (CI): 1.074 - 1.111, P < 0.001). The C-index of the habitat radiomics nomogram model was 0.803 in the training set (95% CI: 0.752 - 0.854) and 0.748 in the validation set (95% CI: 0.667 - 0.829).
Conclusion
The habitat radiomics model can predict vertebral fractures based on vertebral heterogeneity, with better performance than traditional bone density prediction methods.
Keywords
Introduction
Osteoporotic fractures have become one of the increasingly severe public health issues worldwide, 1 among which vertebral fractures are the most common and easily neglected type of fracture. In China, the prevalence of vertebral fractures in individuals aged 40 and above has significantly increased over the past five years, with a rate of 10.5% in men and 9.7% in women. 2 Vertebral fractures not only significantly reduce the quality of life of patients but also bring substantial economic burdens. 1 Medical costs for these fractures increased from $92.74 million in 2013 to $505.3 million in 2017, 3 and they significantly increase the mortality risk of patients 5 - 10 years after the fracture. 4 Therefore, early identification of high-risk populations for vertebral fractures and the development of individualized intervention strategies are of great clinical significance for improving patient outcomes.
Currently, FRAX, a widely used fracture risk assessment tool internationally, 5 may underestimate the fracture risk in some populations due to its two-dimensional imaging characteristics, which cannot reflect changes in bone microstructure. 6 Meanwhile, the diagnosis of osteoporosis is focused on the assessment of bone mineral density (BMD), 7 with dual-energy X-ray absorptiometry (DXA) serving as the gold standard for BMD measurement. 8 However, its two-dimensional imaging nature 9 limits the evaluation of the three-dimensional microstructural features and spatial heterogeneity of bone tissue. 10 A single, average BMD value cannot fully reflect the structural integrity and mechanical properties of bone tissue, neglecting the important impact of internal bone tissue heterogeneity on fracture occurrence. Therefore, there is still room for optimization in existing prediction models based on BMD.
The spatial distribution of trabecular bone and local degeneration have shown obvious heterogeneity. 11 Research has found that the larger low-density areas (such as bone cavities, BMD <40 mg/cm3), which were associated with fracture risk, were heterogeneously distributed in the vertebrae. 12 Therefore, exploring the relationship between the internal structural heterogeneity of bone tissue and vertebral fractures has potential value for fracture risk assessment. In recent years, habitat imaging, originating from oncology research, has provided a new means for analyzing tissue heterogeneity. 13 This method, by segmenting functionally or structurally heterogeneous sub-regions on imaging, can more precisely characterize local tissue features and pathological states. We hypothesize that habitat imaging may also reflect the compositional heterogeneity of bone tissue. Based on this, in this longitudinal study, we first applied habitat imaging to the analysis of vertebral bone heterogeneity. We aim to explore the potential associations between internal compositional and structural differences in the vertebrae and fracture risk using high-resolution computed tomography (CT) images and to develop a nomogram model for fracture prediction.
Materials and Methods
Study Population
The study retrospectively included individuals aged 50 and above who underwent low-dose CT scans for lung cancer screening at our institution from July 1, 2016, to December 31, 2022, and continued follow-up until October 31, 2024. The study was approved by the Ethics Committee of our institution, and informed consent requirements were waived due to the retrospective nature of the study. Inclusion criteria for the study were as follows: (1) Patients who had undergone at least two CT scans at our hospital and had no vertebral fractures at baseline; (2) Good image quality with a scan range covering at least the L1 vertebral body. Exclusion criteria included history of malignant tumor, rheumatic disease, non-primary causes of vertebral fractures, such as traumatic fractures, metastatic vertebral lesions or bone tumors, infectious fractures, and vertebral fractures caused by metabolic bone diseases. The scan images were reviewed by two professional radiologists to determine whether new vertebral fractures occurred at follow-up based on the Genant semi-quantitative scoring system.
14
Disagreements were resolved by consensus. Ultimately, 107 individuals who underwent yearly CT examinations and developed any vertebral fractures during the follow-up period were included in the fracture group, and 270 individuals who also underwent yearly CT examinations and did not experience vertebral fractures during follow-up were matched using propensity scores as the control group. The fracture evaluation was done when they received CT examinations. Propensity scores were calculated based on age, sex, body mass index and flow-up time. Nearest-neighbor matching was used with a case-to-control ratio of 1:3 and a caliper of 0.2 standard deviations of the propensity-score distribution. The study population was randomly divided into training and testing sets in a 7:3 ratio. No subject contributed images to both training and test sets. The follow-up duration ranged from 1 to 5 years, with a median follow-up time of 34 months. The enrollment process of the study population is shown in Figure 1. The reporting of this study adhered to the TRIPOD and CLAIM guidelines. Flowchart of study population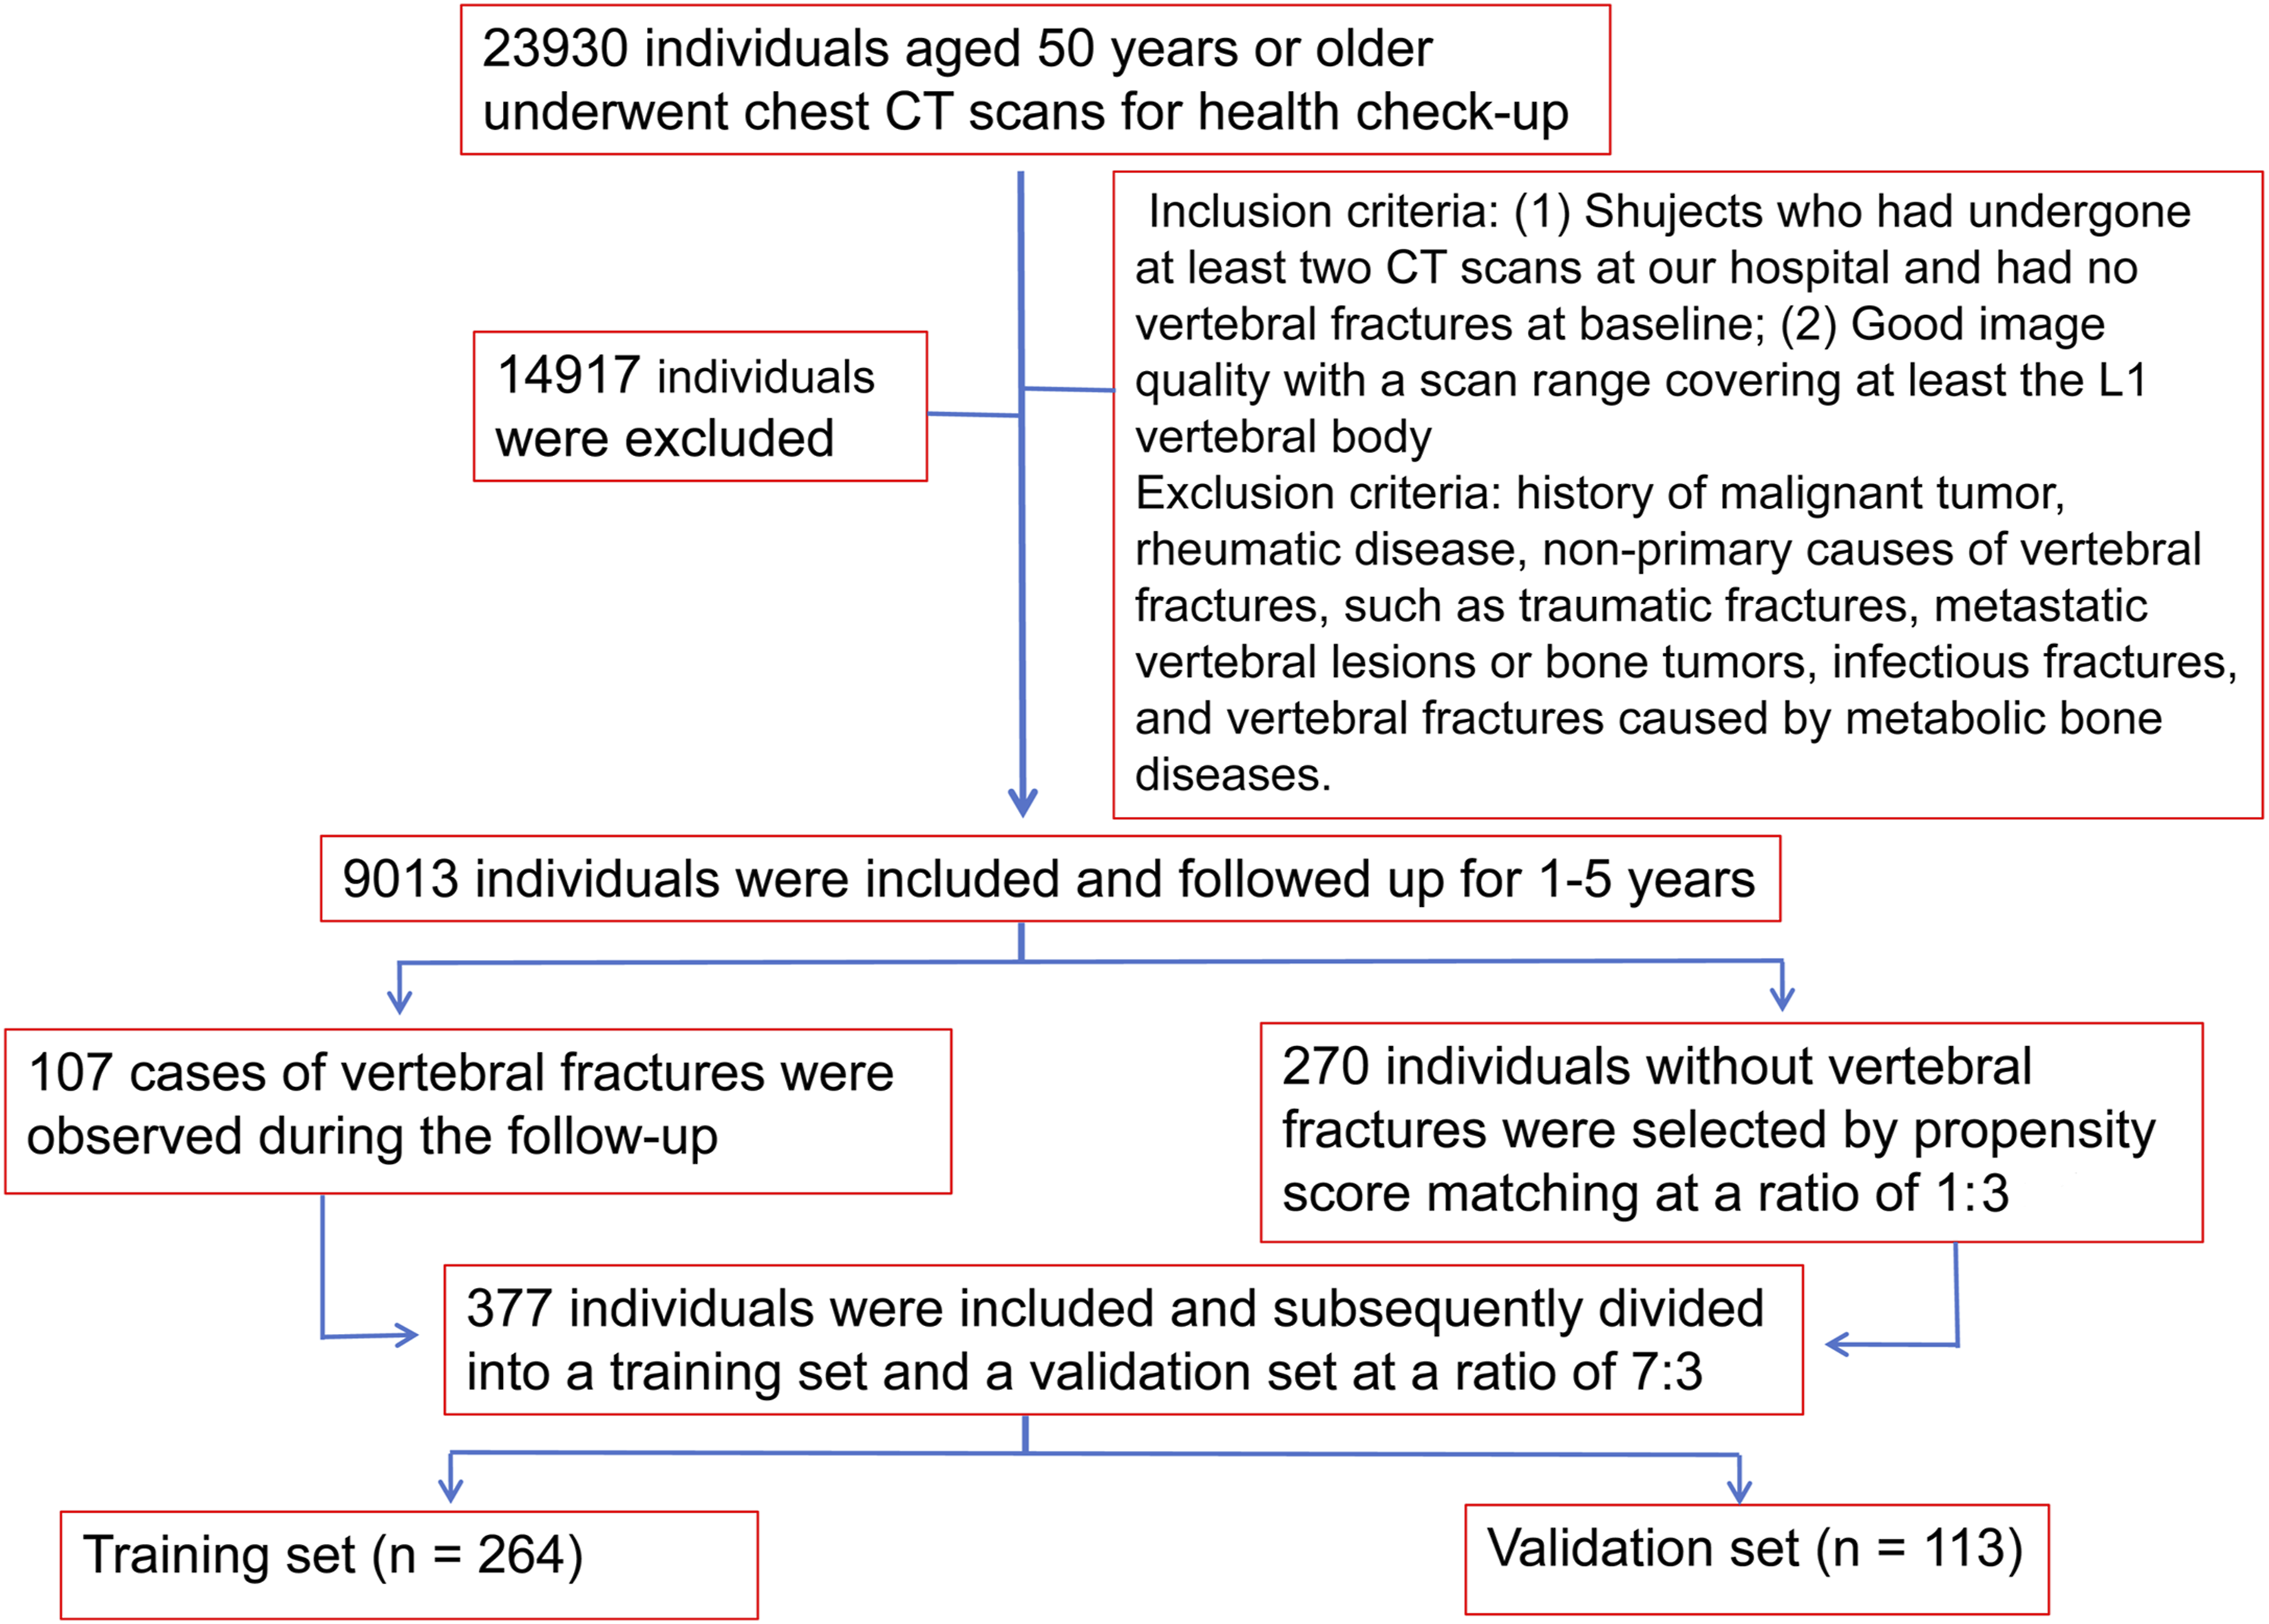
Clinical information such as age, gender, and body mass index, as well as CT images obtained at baseline for lung cancer screening were collected. The study population was divided into osteoporosis (CT value <110 HU) and non-osteoporosis (CT value ≥110 HU) groups based on the CT value of the T11 vertebral body.
CT Acquisition and Preprocessing
The scans were performed in two CT (GE Optima CT680, USA; Philips Brilliance 64, Netherlands). The ASiR-V 2.0 with “standard” and “lung” and “sharp” and “standard” kernels were used, respectively. The scanning parameters were as follows: tube voltage of 120 kV, tube current of 100 - 120 mA, slice thickness of 0.625 mm, interval of 1.0 mm, reconstruction thickness of 0.625 mm, and reconstruction increment of 0.5 mm. All images were reconstructed on a workstation.
The overall workflow of habitat radiomics is shown in Figure 2. The baseline CT images of patients were downloaded from the PACS system in DICOM format. To reduce the impact of different devices and reconstruction algorithms on radiomic feature extraction, image preprocessing was first performed using Python, including resampling (1 mm × 1 mm × 1 mm) and normalization. Two radiologists manually segmented and labeled the T11, T12, and L1 vertebrae as regions of interest (ROIs) using ITK-SNAP software (v3.6.0, www.itk-snap.org), and these were designated as ROI1, ROI2, and ROI3, respectively (cortical bone and areas with abnormal density, such as vertebral venous zones or bone islands, were avoided). To comprehensively quantify vertebral heterogeneity, the features of all vertebral ROIs were combined into a single dataset, ROIAll, which served as the main body for subsequent habitat radiomic analysis. Additionally, the original ROI source information for each feature was retained to assess the contribution of different vertebrae to the overall features. All ROIs were independently reviewed by another researcher to ensure the accuracy of the annotations. All feature extractions were performed in accordance with the IBSI standard. Workflow of radiomics feature extraction
Generation of Intravertebral Habitat Subregions
The vertebral voxel extraction workflow is shown in Supplemental Figure 1. Using PyRadiomics (version, 3.0.1), 19 local vector features were extracted from each voxel within ROI1, ROI2, and ROI3 (see details in Supplemental Figure 2) using the 5 × 5 × 5 neighborhood window. The unsupervised K-means algorithm was applied to cluster voxels with similar features within each ROI, thereby segmenting the vertebrae into different habitat subregions. The optimal number of clustered subregions was determined using the Calinski-Harabasz (CH) score. The CH score was calculated for each ROI corresponding to different clustering numbers, and the results showed that the CH index reached its peak at n = 3 for all three ROIs (ROI1, ROI2, and ROI3). Therefore, n = 3 was determined to be the optimal clustering number (specific score values are detailed in Supplemental Table 1). Each of ROI1, ROI2, and ROI3 was divided into three subregions, resulting in a total of 5502 features (1834 × 3) for each ROI. Consequently, the ROIAll heterogeneity score included features from nine (3 × 3) subregions, and the total number of features in the Habitat Signature was 16 506 (5502 × 3). The nine habitat subregions of ROIAll were designated as roi1_h1, roi1_h2, roi1_h3, roi2_h1, roi2_h2, roi2_h3, roi3_h1, roi3_h2, and roi3_h3. Given the unsupervised nature of the clustering algorithm used, ICC analysis was omitted for the subregion feature extraction in this study. An example of the subregion visualization segmentation workflow for the T11 vertebra (ROI1) is provided in Supplemental Figure 3.
Extraction of Habitat Radiomic and Traditional Radiomic Features
The extraction of radiomic features from the clustered subregions and traditional radiomic features was performed on ROI1, ROI2, and ROI3. The extracted features were mainly divided into three categories: morphological, intensity, and texture features. Morphological features quantify the three-dimensional geometric properties of the vertebrae (e.g., sphericity, volume, surface area). Intensity features describe the voxel intensity distribution within the ROI based on histogram analysis (e.g., mean, skewness, kurtosis). Texture features characterize the spatial heterogeneity of intensity through second-order and higher-order statistics such as the gray-level co-occurrence matrix (GLCM) and gray-level run-length matrix (GLRLM). For a complete list and explanation of the extracted radiomic features, please refer to Supplemental Table 2. To ensure the reliability of the traditional radiomic features, only features with an ICC greater than 0.8, as assessed by the two radiologists, were retained for subsequent analysis. Features with high consistency were selected for further analysis.
To ensure data balance, minimize differences in feature distribution, prevent overfitting, and enhance the generalizability of the model, the feature selection process was as follows: (1) Standardization: Features were standardized using the Z-Score method based on the mean and standard deviation of the training set to achieve a mean of 0 and variance of 1. The normalization (Z-score) of all imaging features was strictly derived from the mean and standard deviation of the training set. The resulting standardization parameters were then applied directly to the test set without any refitting or adaptation. (2) Univariate T-test: Features with a P-value less than 0.05 were further selected. (3) Correlation Analysis: For features with a Pearson correlation coefficient exceeding 0.9, only one of the two features was retained. (4) mRMR and least absolute shrinkage and selection operator (LASSO) regression: The maximum relevance and minimum redundancy features were extracted, and the Lambda (λ) value was determined using ten-fold cross-validation as the basis for model training. Features with coefficients greater than 0 were filtered out, and the corresponding formulas were output. Any parameter tuning (including λ in LASSO and model selection among algorithms) used only training data with proper cross-validation. PyRadiomics was used to extract radiomic features from each subregion based on the optimal clustering number. The extraction of habitat radiomic and traditional radiomic features from ROI1, ROI2, and ROI3 is shown in Supplemental Figures 3-6. The coefficients for the radiomic features to claculate habitat score were shown in Supplemental Figure 3C, 4C, 5C and 6C.
Development of the Radiomics Nomogram
To enhance the performance and stability of the model, in addition to traditional logistic regression, this study employed five machine learning algorithms (including SVM, RandomForest, ExtraTrees, XGBoost, and Light GBM) to construct the optimal predictive habitat radiomics model for analyzing intravertebral heterogeneity. We also developed predictive models based on vertebral CT values, habitat models from different ROI sources, traditional radiomics models, and a combined model integrating vertebral CT values and habitat models for comparison. Subsequently, we used Cox proportional hazards regression to demonstrate the associations between age, gender, vertebral CT values, radiomics scores, and habitat radiomics scores, and to evaluate the risk contributions of these variables. Furthermore, we developed a clinical prediction model based on habitat radiomics. To quantify the performance of the nomogram, decision curve analysis (DCA) and calibration curves were plotted. The discriminatory performance was assessed using the area under the receiver operating characteristic curve (AUC).
Model Evaluation and Statistical Analysis
Data analysis was conducted using SPSS (v27.0), R (v4.4.2), and Python (v3.7.12; https://www.python.org). Continuous variables were analyzed using independent samples t-tests or Mann-Whitney U tests and are presented as mean ± SD or median with interquartile ranges. Categorical variables were compared between groups using chi-square tests or Fisher’s exact tests and are expressed as numbers and percentages. The Cox proportional hazards model was applied to demonstrate the associations between traditional radiomics, habitat radiomics, clinical information, baseline osteoporosis, and vertebral fractures. Hazard ratios (HR) with 95% confidence intervals (CI) were obtained for each indicator, and relevant cumulative risk curves were displayed. The performance of the nomogram model was assessed using receiver operating characteristic curve (ROC) curves and the C-index. Nomograms, calibration curves, and Decision Curve Analysis (DCA) were plotted using R software, which also calculated the C-index values. All statistical tests were two-sided, with P-values less than 0.05 indicating statistical significance.
Results
Participants’ Characteristics at Baseline
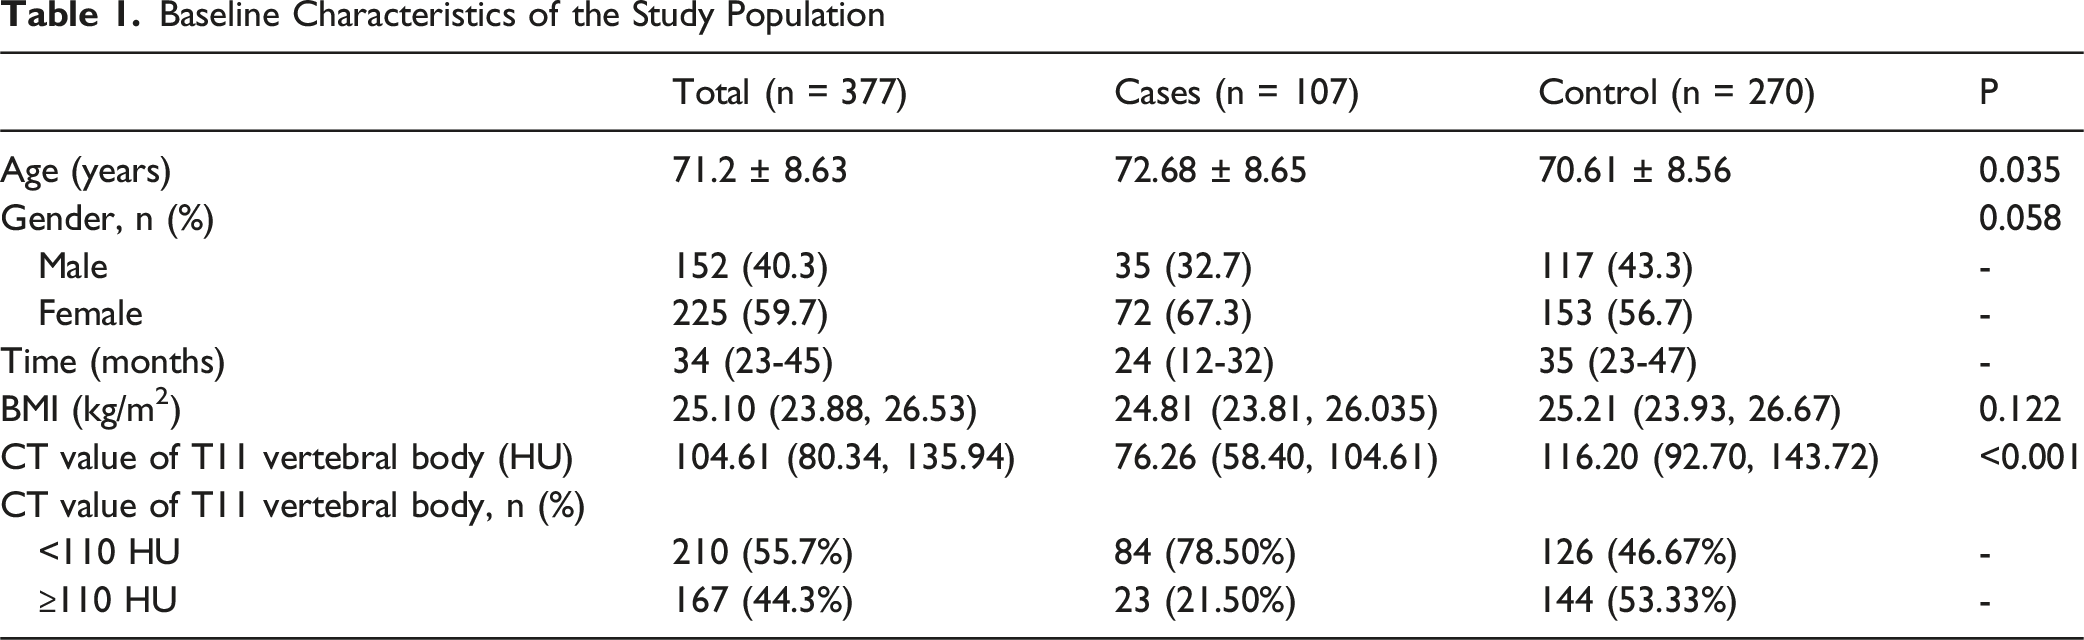
Baseline Characteristics of the Study Population
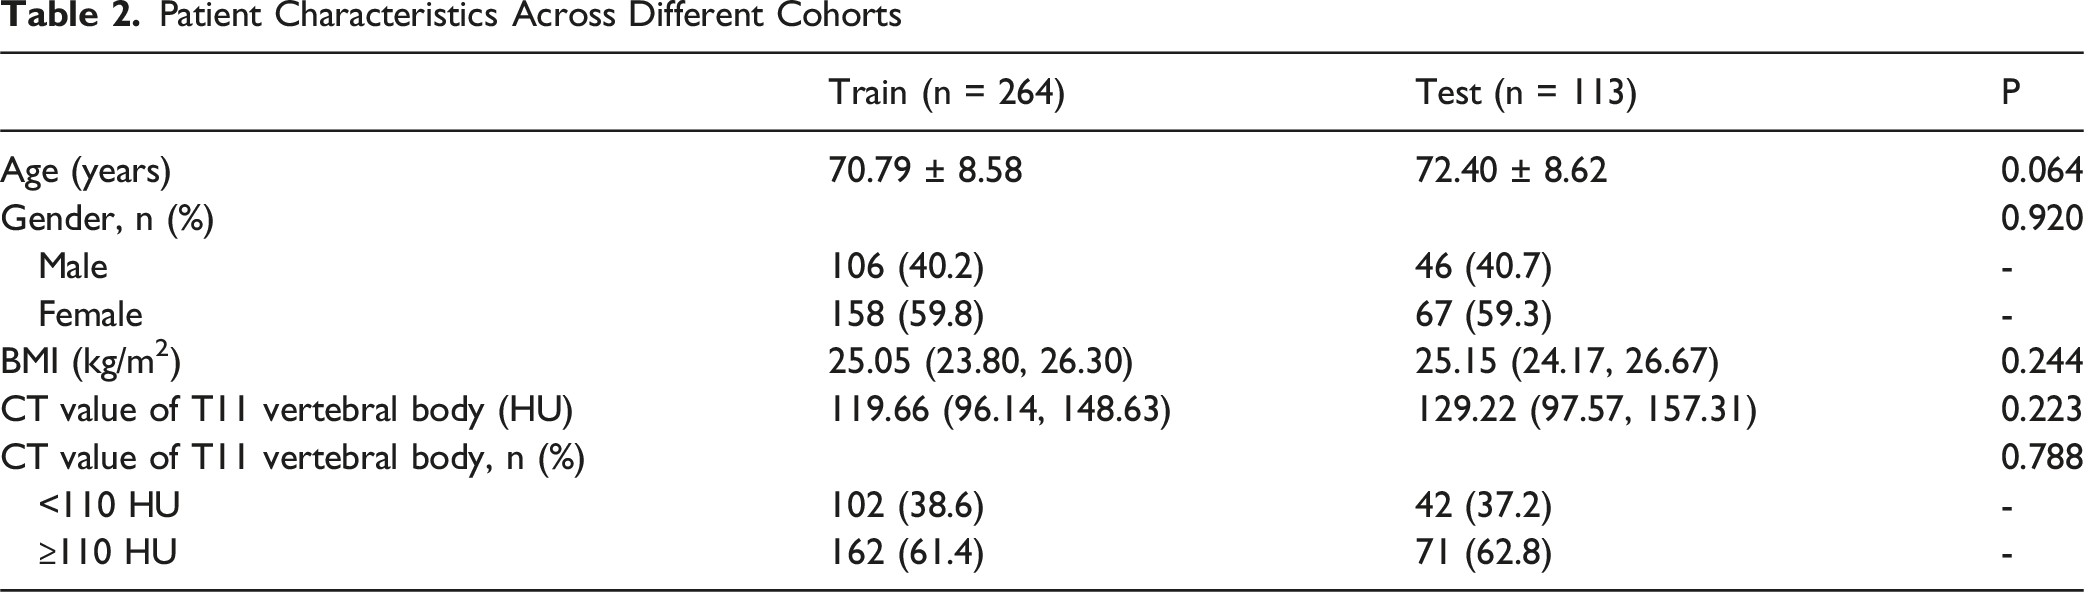
Patient Characteristics Across Different Cohorts
Feature Selection for the Habitat Radiomics Model
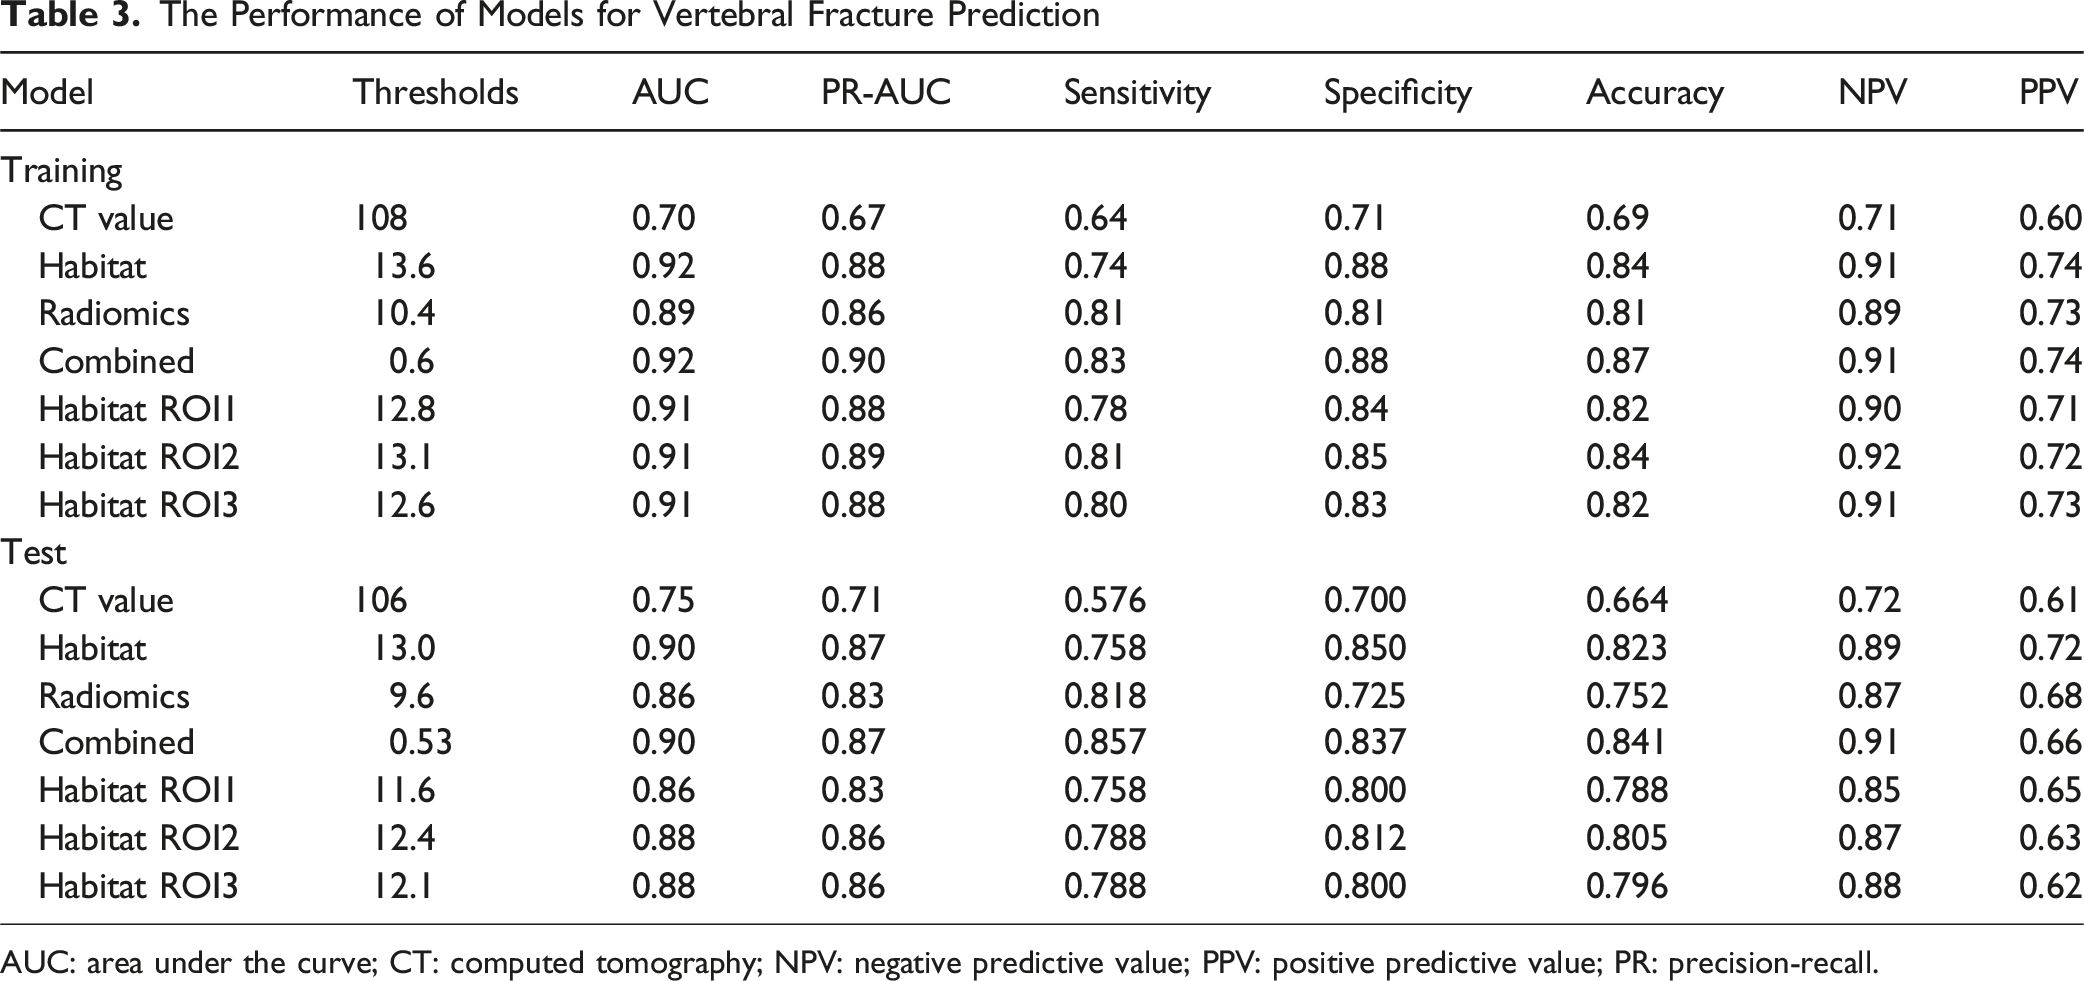
A total of 1834 radiomic features were extracted from each of the 9 habitat subregions of ROIAll, resulting in a total of 16 506 (1834 × 9) radiomic features. Using the t-test, 5043 features that showed statistically significant differences between the fracture and control groups were selected. Subsequently, Pearson correlation coefficient analysis was performed on these features, and 32 features were selected for further analysis. Finally, LASSO regression with 10-fold cross-validation was used for dimensionality reduction, and 20 key habitat radiomic features with non-zero coefficients were ultimately selected (Figure 3). The coefficients for habitat radiomic features were shown in Figure 3C. Six heterogeneity habitat radiomic feature models for vertebral bodies were established (Supplemental Figure 7). The results showed that the predictive values of all models were above 0.850, with the AUC values of five machine learning models being more stable and efficient compared to traditional logistic regression (LR). Among them, the ExtraTrees model achieved an AUC of 0.918 (95% CI: 0.884 - 0.952) in the training set and 0.898 (95% CI: 0.839 - 0.957) in the validation set. In the training set, the vertebral heterogeneity habitat model achieved the following performance metrics: accuracy of 0.840, sensitivity of 0.743, and specificity of 0.878 (Table 3). In the validation set, the model achieved an accuracy of 0.823, sensitivity of 0.758, and specificity of 0.850 (Table 3). Precision-recall AUC showed similar trends (Table 3). The ExtraTrees model demonstrated the best stability and was selected for subsequent analyses. Radiomic feature extraction within habitat subregions. A shows the least absolute shrinkage and selection operator (LASSO) regularization path; B shows the MSE cross-validation error plot, and C shows the bar chart of feature coefficients The Performance of Models for Vertebral Fracture Prediction AUC: area under the curve; CT: computed tomography; NPV: negative predictive value; PPV: positive predictive value; PR: precision-recall.
Feature Selection for the Traditional Radiomics Model
In this study, the PyRadiomics software package was used to extract 1834 features from each of ROI1, ROI2, and ROI3 for every patient, resulting in a total of 5502 features for ROIAll (1834 × 3). Using the t-test, 1107 features that showed statistically significant differences between the fracture and control groups were selected. Subsequently, Pearson correlation coefficient analysis was performed to examine the pairwise correlation between these features. After retaining only those with a correlation coefficient greater than 0.9, 32 features were selected for further analysis. LASSO regression was then applied to select 20 features with non-zero coefficients to establish the Rad score for the traditional radiomics model (Supplemental Figure 6). The ExtraTrees model achieved an AUC of 0.891 (95% CI: 0.849 - 0.932) in the training set and 0.862 (95% CI: 0.792 - 0.933) in the test set.
Comparison of Radiomics Feature Models and Habitat Radiomics Models
The performance of CT values, habitat models, traditional radiomics models, habitat models from different ROIs, and combined CT values and habitat models in the training and test sets is summarized in Table 3. The net reclassification index for the combined model was 0.33 in test group and was 0.24 in validation group compared to model of combined CT values. Figure 4 shows the ROC curves for the seven predictive models, with radiomics and habitat models achieving higher AUC values compared to the bone CT value model (AUC = 0.891, 0.907 - 0.918 vs 0.702). Receiver operating characteristic (ROC) curves show the performance of different model for fracture prediction in training (A) and test (B) cohort. Habitat models (habitatROI1, habitatROI2, habitatROI3 and habitatROIALL) have better performance than radiomics model and bone mass model (boneCTvalue)
Association of Risk Factors with Vertebral Osteoporotic Fractures
The Association Between Radiomics, Habitat Radiomics and Vertebral Fracture
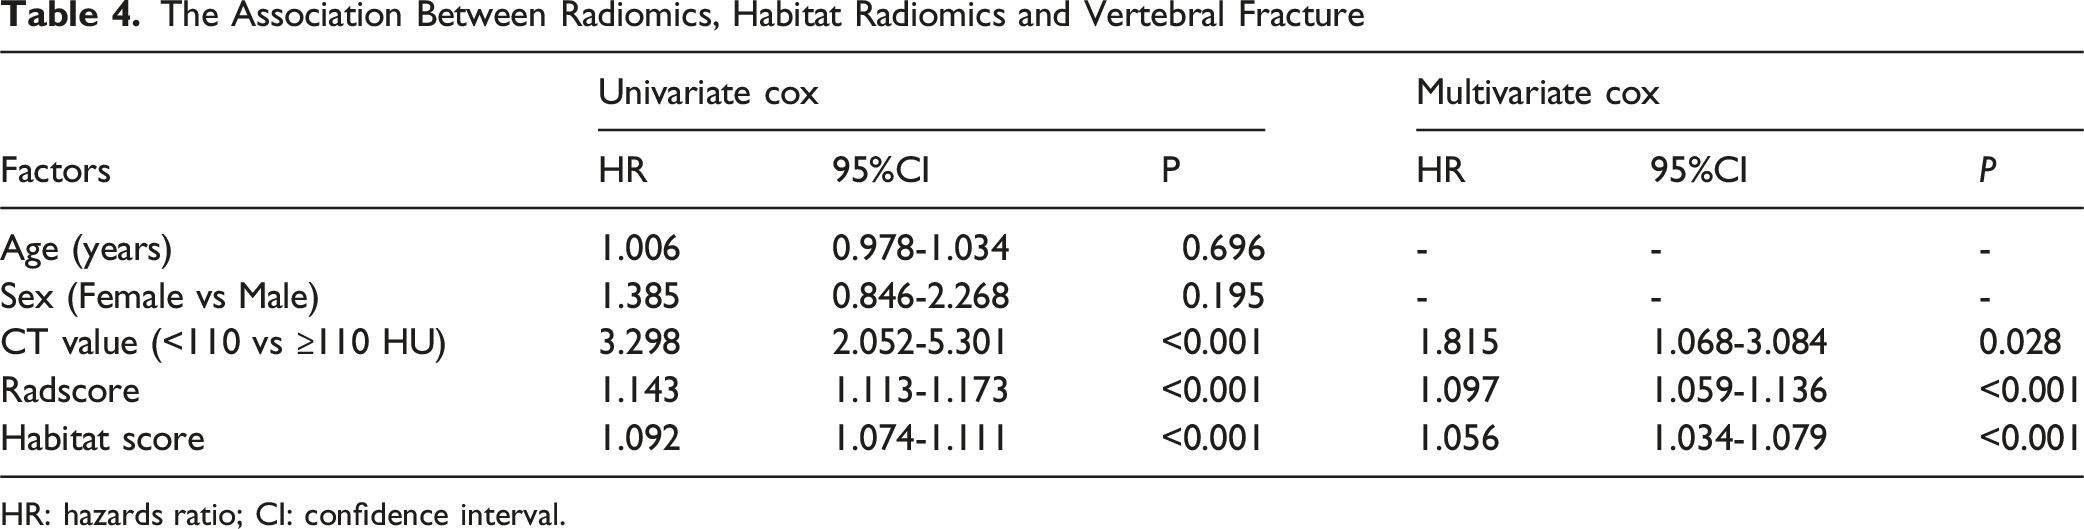
HR: hazards ratio; CI: confidence interval.

Kaplan-Meier Curves and Log-Rank Tests for vertebral Fractures. Panels A and D show the risk based on the median score of habitat radiomics; Panels B and E show risk based on the median score of traditional radiomics; Panels C and F show risk based on vertebral CT values (110 HU)
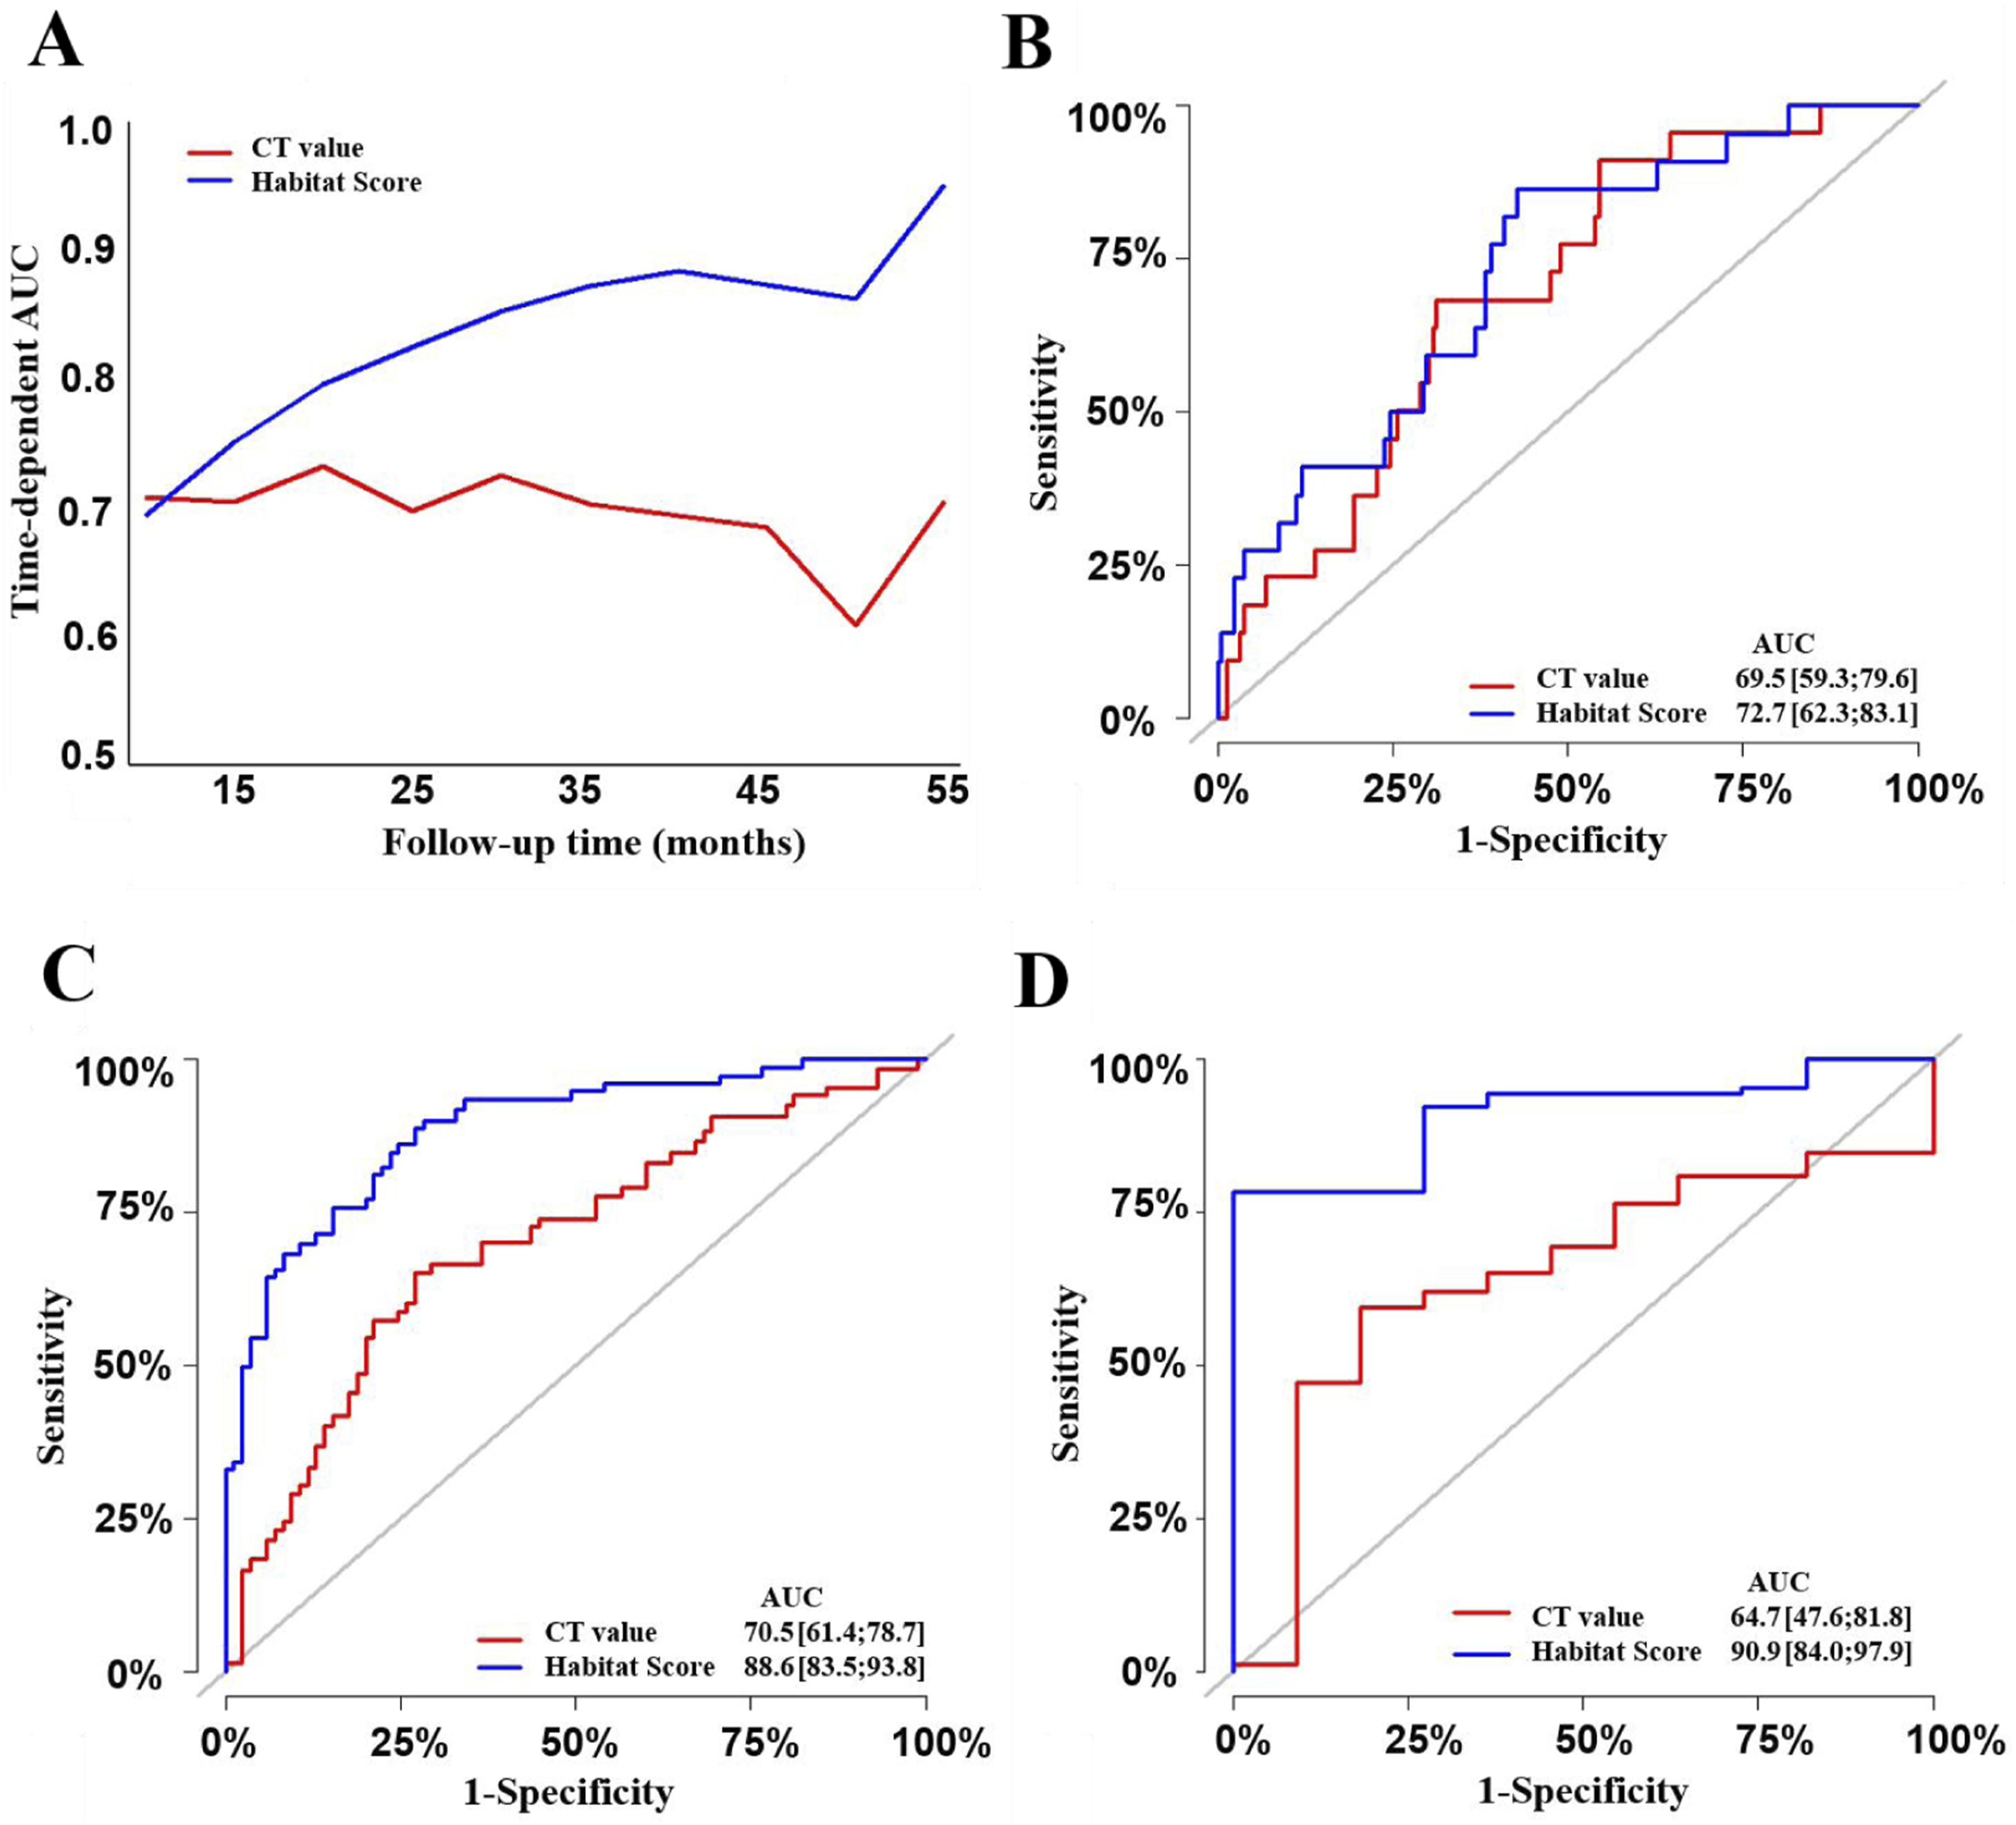
Subsequently, we created a nomogram for predicting OVF based on the habitat risk score (Figure 6). Higher total scores on the nomogram, corresponding to the points assigned for each variable, were associated with a higher risk of fracture. The coefficients for the habitat score in nomogram was 1.67. The nomogram’s concordance index (C-index) was 0.803 (95% CI: 0.752 - 0.854) in the training set and 0.748 (95% CI: 0.667 - 0.829) in the validation set, indicating good discriminatory ability of the model. The nomogram model achieved AUC values of 0.727, 0.886, and 0.909 for predicting vertebral fractures at 1, 3, and 4 years (Figure 7), respectively, which were superior to osteoporosis-based predictions. Time-dependent AUC curves also demonstrated that habitat radiomics outperformed osteoporosis-based models in predicting vertebral compression fractures (VCF) (Figure 7). Similar results were shown in the test set (Supplemental Figure 8). Nomogram based on habitat radiomics scores in predicting1-, 3- and 4-year risk of vertebral fracture Receiver operating characteristic (ROC) curves for predicting osteoporotic vertebral fractures based on habitat radiomics scores and vertebral computed tomography (CT) values in training cohort. A shows the time-dependent ROC curves for both predictors. B to D show the ROC curves for predicting fractures at 1 year, 3 years, and 4 years, respectively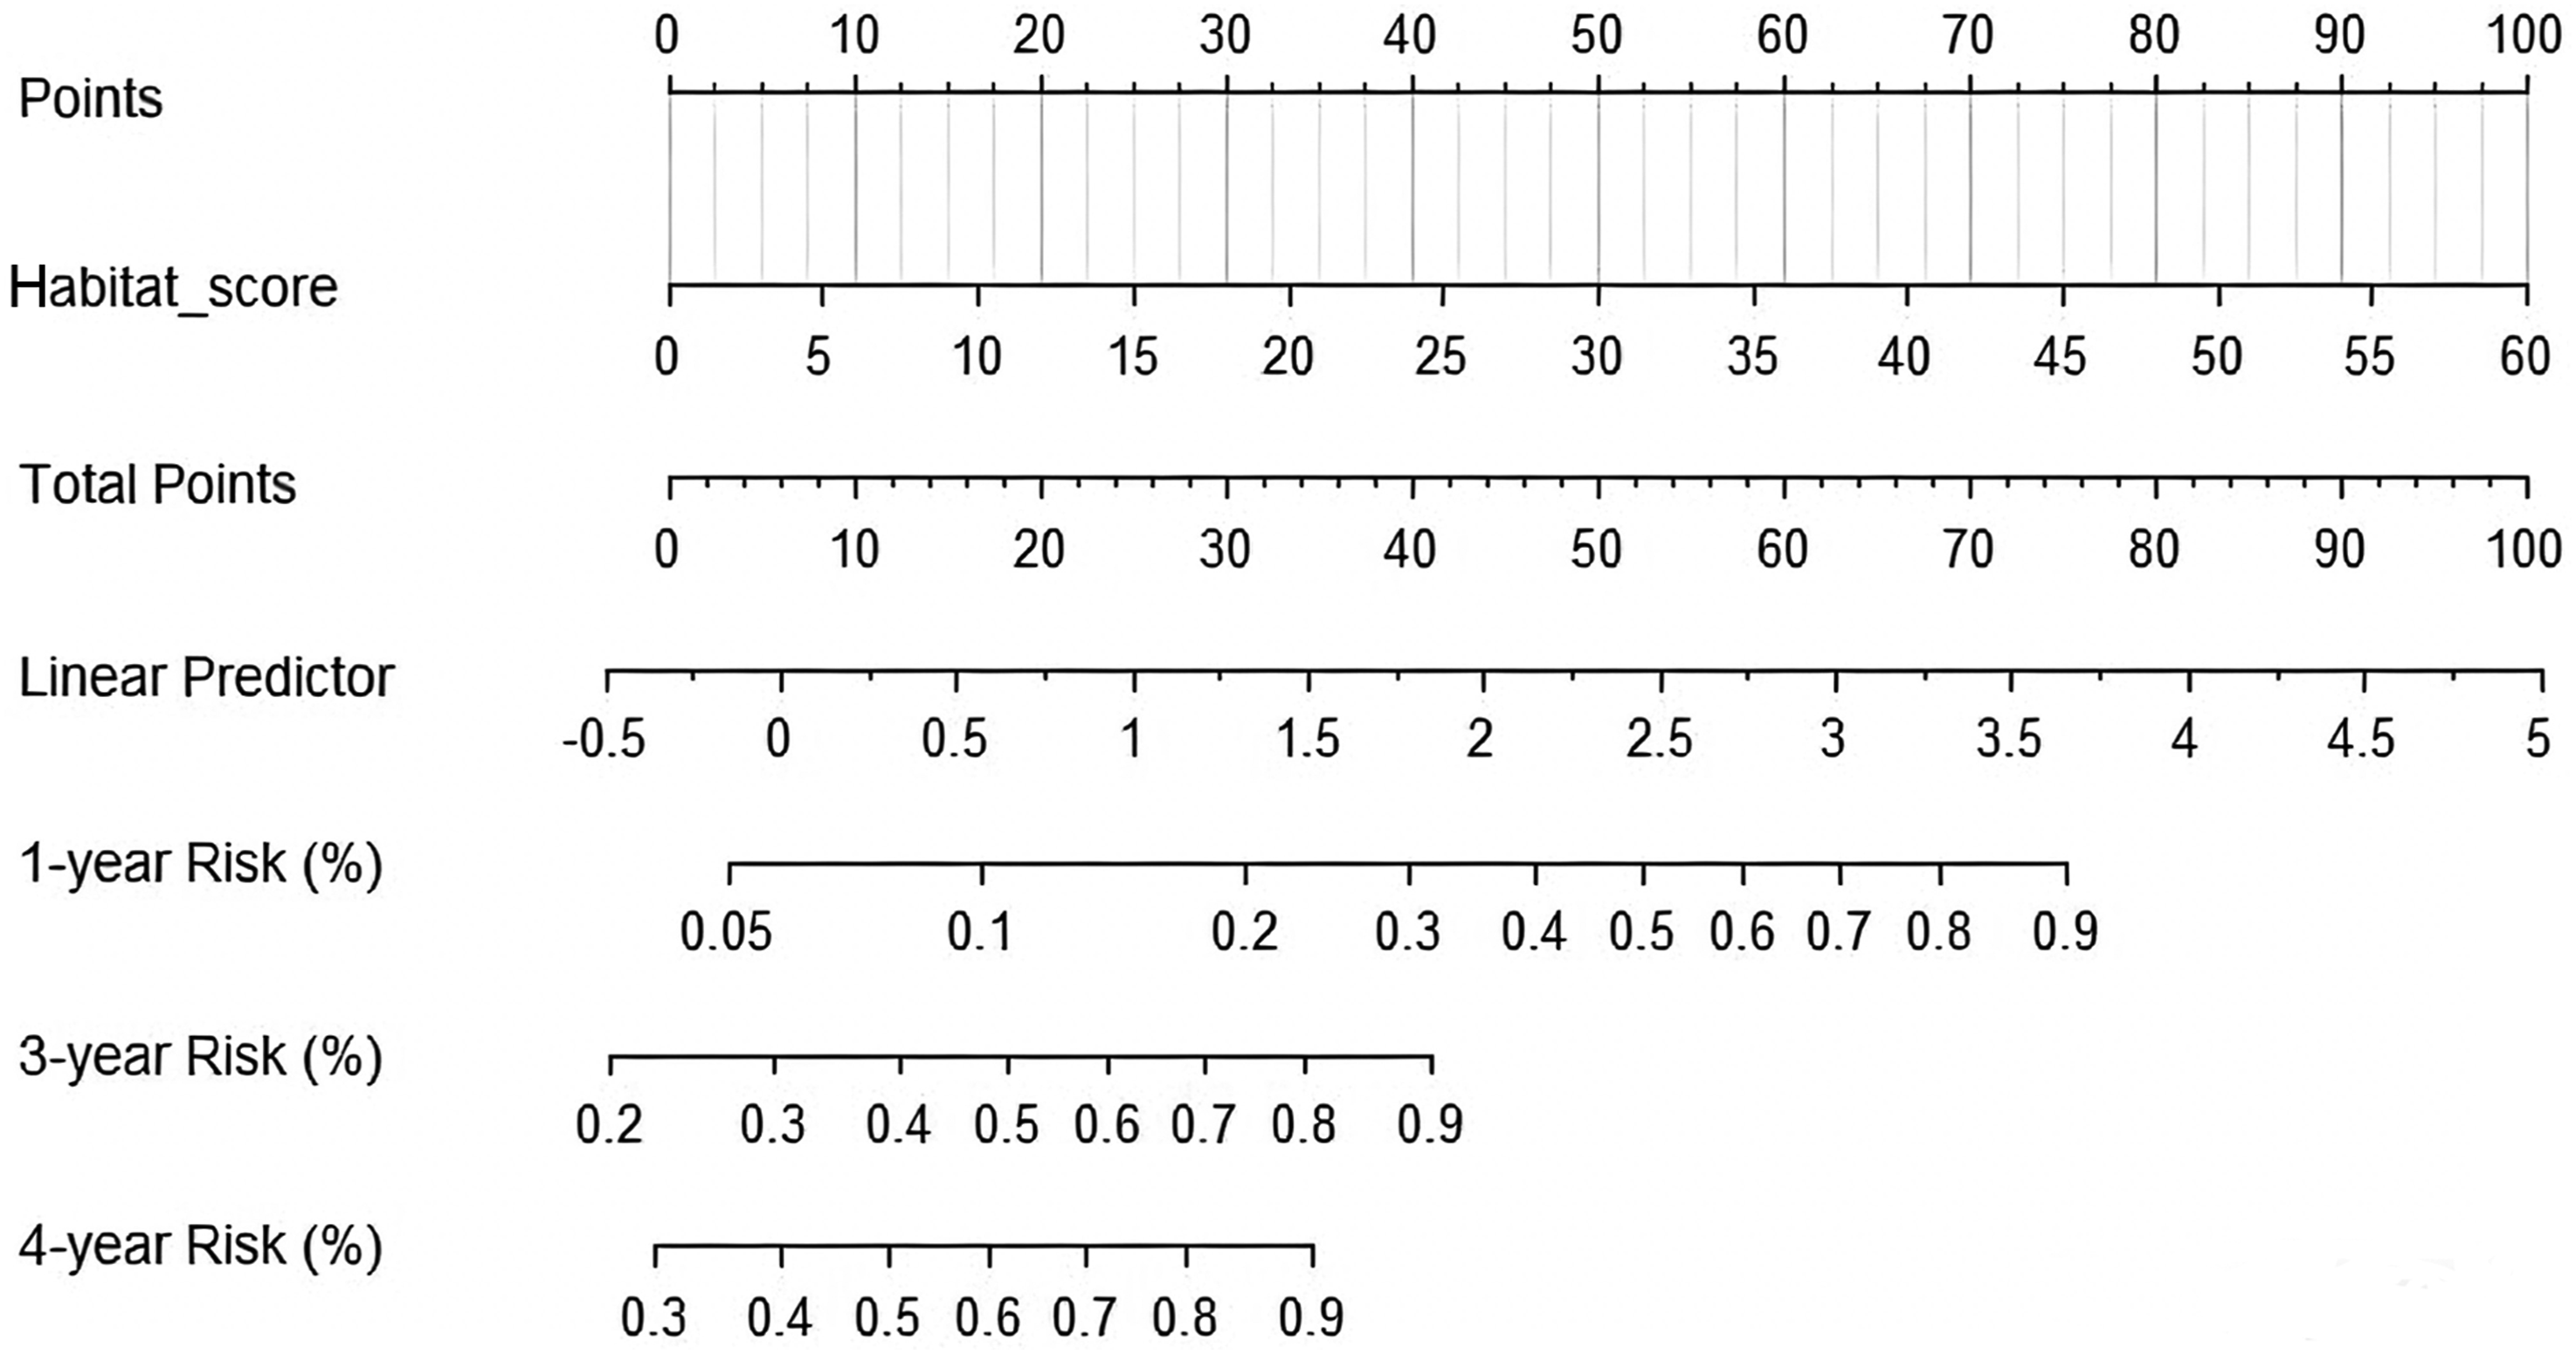
Calibration curves for the nomogram in the training set at 1, 3, and 4 years showed good agreement between the observed actual probabilities and the probabilities predicted by the nomogram (Supplemental Figure 9 A to C). Additionally, decision curve analysis (DCA) indicated that the nomogram was clinically useful and had good discriminatory ability (Supplemental Figure 9 D to F). Overall, the nomogram based on habitat radiomic features demonstrated considerable discriminatory and calibration abilities. The threshold probability range of 8%-50% (1-year), 22%-60% (3-year) and 30%-60% (4-year) demonstrated superior net benefit compared to both the ‘treat-all’ and ‘treat-none’ strategies. Calibration curves (Supplemental Figure 10 A to C) and DCA (Supplemental Figure 10 D to F) in the validation set further illustrated that the habitat nomogram’s predicted values fit well with the actual observed values and provided certain clinical net benefits.
Application of the Nomogram
The application of the nomogram is illustrated in Supplemental Figure 11. For an 84-year-old female with a Habitat score of 11.49, the corresponding linear predictor is 0.693. The predicted fracture risks are as follows: 11.24% for the first year, 51.61% for the third year, and 63.79% for the fourth year. This patient developed a vertebral fracture during the 2-year follow-up period (from June 2020 to May 2022).
Another 79-year-old female had a Habitat score of 2.99, corresponding to an LP of 0.055. Her predicted fracture risks were 5.49% for the first year, 29.08% for the third year, and 38.18% for the fourth year. She did not experience any new vertebral fractures during the 3-year follow-up period (from February 2021 to January 2024).
Discussion
Vertebral fractures are common skeletal-related diseases in middle-aged and elderly populations, which significantly reduce patients’ quality of life and increase the medical burden. 1 Therefore, early identification of high-risk individuals is of great clinical value for the prevention of vertebral fractures. Currently, dual-energy X-ray absorptiometry (DXA)-based BMD is used to assess fracture risk. However, although BMD can reflect changes in bone mineral density, it cannot comprehensively evaluate the structural integrity and biomechanical properties of bone tissue. In fact, trabecular bone in cancellous bone is not uniformly distributed, and the arrangement of trabeculae and collagen distribution within it have complex heterogeneity. These microstructural changes may have an important impact on the risk of vertebral fractures. 11 In this study, by comprehensively evaluating the intravertebral heterogeneity features in CT scans before vertebral fractures and using the habitat subregion features of pre-fracture CT imaging, a habitat model was constructed to predict the early occurrence of OVF in middle-aged and elderly people. The results show that the habitat model constructed by quantitative analysis of intravertebral heterogeneity has an AUC value of 0.918 in the training set, which is better than bone mass or osteoporosis-based models and traditional radiomics models. Moreover, in the validation set, the AUC value of the intravertebral habitat radiomics model is 0.898, which exceeds that of the traditional radiomics model (AUC of 0.862). The habitat radiomics-based model provides an effective tool for the early prediction and intervention of vertebral fractures.
Radiomics, as an efficient predictive method, has already been used in many studies to predict vertebral fractures.15-17 However, most of those published studies were cross-sectional in design. Few longitudinal studies have been reported. In our previous longitudinal study using CT data, we demonstrated the association between traditional radiomics of the vertebrae and the risk of OVF, with results showing that the AUC value for predicting fractures using radiomics was 0.870, higher than models based on bone density or osteoporosis, thus confirming the potential application of radiomics in the field of fractures. 18 A recent study showed that regions with extremely low BMD were heterogeneously distributed within the vertebra. 12 However, the role of such heterogeneity in fracture risk remains unknown. Moreover, despite the high predictive performance of traditional radiomics and deep learning radiomics models, these models are unable to capture the spatial heterogeneity of vertebral features.
To our knowledge, few studies have currently focused on intravertebral heterogeneity from an omics perspective. The discovery of intravertebral heterogeneity may allow for more sensitive identification of bone changes, and differences in various regions of the vertebra may have distinct impacts on fracture outcomes. To deeply analyze and quantify subregions within lesions or tissues, habitat imaging, as a radiomics tool, has gradually become a research focus. 19 This method, based on multiparametric imaging data, uses clustering analysis to divide similar voxels in tissue images into multiple habitat subregions and extracts features from these different subregions to construct more precise radiomics models. Habitat imaging can not only reveal spatial variations in the tissue microenvironment but also reflect differences in the pathophysiology of different subregions. Currently, this technology has been widely applied in oncology research13,20,21 and has established close associations with clinical prognostic indicators. There are also a few reports of habitat radiomics in non-oncological fields.22,23 Recent studies have shown that habitat radiomics performs well in identifying vulnerable plaques 22 and can evaluate thrombus heterogeneity. 23 Compared with traditional radiomics methods, habitat imaging analysis can more accurately parse the spatial heterogeneity within lesions and provide richer information for individualized treatment decisions. Therefore, we applied habitat radiomics to explore its value in vertebral compression fractures.
This study demonstrates the feasibility of using habitat radiomics to quantify heterogeneity in predicting osteoporotic vertebral fractures. In our study, by clustering voxels with similar features, we identified nine habitat subregions and then selected representative features from these subregions to construct the habitat model, which effectively predicted the risk of vertebral fractures. Our study supplied a critical tool for risk prediction of spine fracture in the older population. Moreover, our results also showed that the habitat radiomics model had a slightly higher performance in predicting fractures compared to the traditional radiomics model (AUC, 0.918 vs 0.898 in the training set and 0.898 vs 0.862 in the validation set). Cross-sectional studies showed that the spatial distribution of trabecular volumetric bone mineral density (vBMD) and its heterogeneity were significantly associated with osteoporotic vertebral fractures.24,25 This finding provides anatomical validation for the results of our study, which utilizes habitat-based features to predict fracture risk.
This study has certain limitations. First, as this study is a retrospective single-center study, there may be selection bias. Although strict image preprocessing and feature selection methods have been used to reduce the impact of bias, external validation on larger-scale multicenter data is still needed to ensure the robustness and generalizability of the model. Second, this study uses trabecular bone CT values to define bone mass. If future studies can correlate these values with the gold standard DXA or rigorous QCT, the outcomes could be more rigorous. Third, the biological significance of habitat radiomics features needs further exploration: Although the habitat radiomics features extracted in this study based on opportunistic CT screening can reflect the spatial heterogeneity of bone tissue, they do not integrate multidimensional biological information of the study population, such as bone metabolism markers, genetic factors, and biomechanical parameters. Therefore, the biological significance of some features is still unclear, and future studies need to combine bone microstructure analysis and biomechanical experiments to further explore their mechanisms of action. Fourth, the impact of clustering methods on habitat partitioning: This study uses the K-means clustering method for habitat partitioning, but different clustering methods may affect the final feature extraction and partitioning stability. Future studies could explore more optimized partitioning strategies, such as those based on deep learning or adaptive clustering algorithms, to enhance the robustness of the model. Finally, we did not compare our model with FRAX due to the lack of DXA-based BMD and insufficient follow-up duration. Although a head-to-head comparison with FRAX was not feasible, to evaluate the incremental value of our model, we compared the radiomics model with the most relevant traditional indicator available in this study-the bone CT value. The results demonstrated that our habitat radiomics model significantly outperformed this traditional bone mass-based method in predicting fracture risk. This preliminarily confirms that our model can capture additional risk information beyond bone density.
In conclusion, this longitudinal study demonstrates that habitat radiomics can effectively predict the risk of vertebral fractures, with predictive value superior to traditional models based on bone mass or osteoporosis. Additionally, the nomogram model based on habitat radiomics can accurately predict the risk of vertebral fractures at 1, 3, and 4 years. Bone habitat radiomics may serve as a potential tool for fracture management beyond BMD or bone mass. However, a large, prospective multicenter study with external validation is required to confirm the clinical value of the habitat model in predicting vertebral fractures.
Supplemental Material
Supplemental Material - CT-Based Bone Habitat Radiomics for Predicting Risk of Vertebral Fracture in Older Adults: A Longitudinal Study
Supplemental Material for CT-Based Bone Habitat Radiomics for Predicting Risk of Vertebral Fracture in Older Adults: A Longitudinal Study by Dingzhe Zhang, Jiangchuan Wang, Yiping Zhang, Zicheng Wei, Yu Wang, Hongye Tang, Jirong Shen, Xiao Chen, Chao Xie in Global Spine Journal.
Footnotes
Ethical Considerations
Ethics approval was obtained from the Affiliated Hospital of Nanjing University of Chinese Medicine (2024NL-158). The study was performed in accordance with the Declaration of Helsinki.
Consent to Participate
The need for informed consent was waived by the Ethics Committee of the Affiliated Hospital of Nanjing University of Chinese Medicine because of the retrospective nature of the study.
Author Contributions
XC participated in the design of the study. DZ, JW, ZW, YZ and XC wrote the manuscript. DZ, JW, ZW, YZ, YW, HT and XC collected and analyzed the data. DZ, JW, ZW, YZ, YW, HT, JS, CX and XC contributed to the interpretation of the data and the preparation of the manuscript. All the authors have read and approved the final manuscript.
Funding
The authors disclosed receipt of the following financial support for the research, authorship, and/or publication of this article: This study was funded by the Top Academic Talent of Jiangsu Provincial Hospital of Chinese Medicine (k2026yrc25).
Declaration of Conflicting Interests
The authors declared no potential conflicts of interest with respect to the research, authorship, and/or publication of this article.
Data Availability Statement
All the data generated or analyzed during this study are available from the corresponding author upon reasonable request.
Supplemental Material
Supplemental material for this article is available online.
References
Supplementary Material
Please find the following supplemental material available below.
For Open Access articles published under a Creative Commons License, all supplemental material carries the same license as the article it is associated with.
For non-Open Access articles published, all supplemental material carries a non-exclusive license, and permission requests for re-use of supplemental material or any part of supplemental material shall be sent directly to the copyright owner as specified in the copyright notice associated with the article.