
Abstract
Study Design
A multicenter study.
Objective
To develop a machine learning algorithm to predict when magnetic resonance imaging (MRI) may change the thoracolumbar AO Spine injury severity score (TLAOSIS) treatment recommendation for thoracolumbar fractures (TLFs) without neurological deficits.
Methods
Three trauma centers recruited 619 neurologically intact TLFs (AO Spine A-fractures) who underwent computed tomography (CT) and MRI. CT findings indicating posterior ligamentous complex (PLC) injury were defined as facet malalignment, horizontal laminar fracture, spinous process fracture, and interspinous widening ≥4 mm. A single positive CT finding indicated an M1 modifier. The primary outcome was any change in the TLAOSIS treatment recommendation among conservative (≤3), grey zone (4-5), and surgical (>5) groups after MRI. The derivation and validation sets utilized 80% and 20% of the samples, respectively. A classification and regression tree (CART) was developed using the M1 modifier, AO fracture subtype (A1-A4), and spine level. Model discrimination was quantified using the area under the receiver operating curve (AUC).
Results
MRI altered TLAOSIS recommendations in 82 (13.2%) cases. The CART used the M1 modifier, A subtype, and spine level (importance = 0.914, 0.055, and 0.031, respectively). The model achieved an AUC of 0.93, sensitivity of 87.5%, specificity of 96.3%, and mean accuracy of 92.9% (±12.0%) in cross-validation in predicting TLAOSIS recommendation change.
Conclusion
The CART model accurately predicted changes in the TLAOSIS recommendation after MRI. This algorithm provides cost-effective indications for MRI in neurologically intact AO A-type fractures, ensuring accurate PLC assessment while minimizing unnecessary imaging.
Keywords
Introduction
The Thoracolumbar Injury Classification System (TLICS) and the new AO Spine classification both cite the integrity of the posterior ligamentous complex (PLC) as a major determinant of instability in thoracolumbar fractures (TLFs).1,2 Nevertheless, the assessment of PLC integrity remains elusive.3,4 Computed tomography (CT) is the most practical modality for TLF evaluation; however, it can miss up to 30% of PLC injuries.5-9 Although MRI is considered the reference standard, its routine use is limited by its high cost, inaccessibility in numerous trauma centers, and potential treatment delay. Evidence-based indications for MRI that achieve the practicality and accuracy of PLC assessments are lacking.3,5 This lack of clear guidance often leads to either overuse of MRI, incurring unnecessary costs and delays, or, conversely, missed clinically significant PLC injuries, potentially resulting in suboptimal patient outcomes. 5
Ideally, MRI should be restricted to cases with an indeterminate PLC assessment on CT. 4 The “Indeterminate PLC’’ category was allocated by TLICS and AO Spine classification (designated as M1 Modifier) based on personal uncertainty of PLC status; hence, it is a poor guide for MRI indications.1,2,10,11 A CT criterion for PLC injury was recently validated based on the following: facet malalignment, horizontal laminar fracture, spinous process fracture, and interspinous widening ≥4 mm.8,12,13 At least two positive CT findings or no positive findings could reliably confirm or rule out PLC injury, as shown by MRI. 13 Conversely, a single positive finding was insufficiently accurate to confirm or exclude PLC injury and indicated an M1 modifier. 13
A single-center study has shown that the M1 modifier, defined as a single CT finding, could predict most of the changes in classification or decision-making along with the AO fracture subtype and spinal regions. 14 Aly et al proposed that the influence of MRI on TLFs’ management is better measured by the change in thoracolumbar AO Spine injury severity scores (TLAOSIS) recommendations than by PLC status.4,15 Notably, changing the PLC injury status following MRI does not necessarily alter the treatment decision, as in the case of a highly comminuted burst fracture.14,16 While promising, this single-center approach may limit generalizability, and a more robust, multicenter, data-driven model is warranted to enhance predictive accuracy and clinical applicability.
To overcome these challenges and provide more objective guidance for MRI utilization, innovative predictive models are needed. 17 Classification and regression trees (CART) are machine learning algorithms that provide evidence-based diagnostic algorithms, particularly for binary outcomes. 18 CART is a regression method that splits data into increasingly homogeneous subgroups at each step based on its importance for the target outcome. 19 We propose to train CART using a multicenter dataset to predict when MRI would change TLAOSIS treatment recommendations in TLFs without neurological deficits.
Methods
Study Design and Setting
Three tertiary trauma hospitals participated in this ambispective multicenter study between January 2014 and April 2024; all hospitals performed MRI routinely for most TLFs, even without neurological deficits (King Saud Medical City Riyadh, Saudi Arabia [center 1]; Prince Mohammed Bin Abdulaziz Hospital, Riyadh , Saudi Arabia [center 2]; and University Hospital Puerta de Hierro Majadahonda, Madrid, Spain [center 3]). Each participating center obtained institutional review board permission, and informed consent was waived. The methods were based on the Standards for Reporting Diagnostic Accuracy. 20
Inclusion & Exclusion Criteria
All consecutive traumatic TLFs meeting the following inclusion criteria were identified through a search of the radiology information system: (1) AO Spine A-fracture based on CT (T1-L5); isolated spinous or transverse process fractures were excluded, as they are considered minor injuries 2 ; (2) fracture with intact or indeterminate PLC, 0 or 1 CT findings, respectively, based on the proposed CT criteria for PLC injury; (3) CT and MRI performed within 10 days of injury, as MRI sensitivity for PLC injury may diminish over time 21 ; (4) neurologically intact patients, because patients with neurological deficits are universally treated operatively, irrespective of the fracture classification; (5) the most severe level of multi-level fractures 2 ; ages between 18 and 65 years.
The following fractures were excluded 13 : (1) osteoporotic fractures, which are associated with low-energy trauma, such as a fall from standing; (2) AO C-type injuries, since they are universally treated operatively; (3) fractures with ≥2 CT findings suggestive of definitive PLC injury;5,13 (4) incomplete or low-quality images due to motion artifacts; (5) cervicothoracic junction fractures, as they typically require MRI; (6) pathological fractures due to tumors or infections; and (7) prior trauma or surgery to the thoracolumbar spine.
Data Collection
Baseline Demographic and Injury Characteristics of the 619 Patients Included in the Study
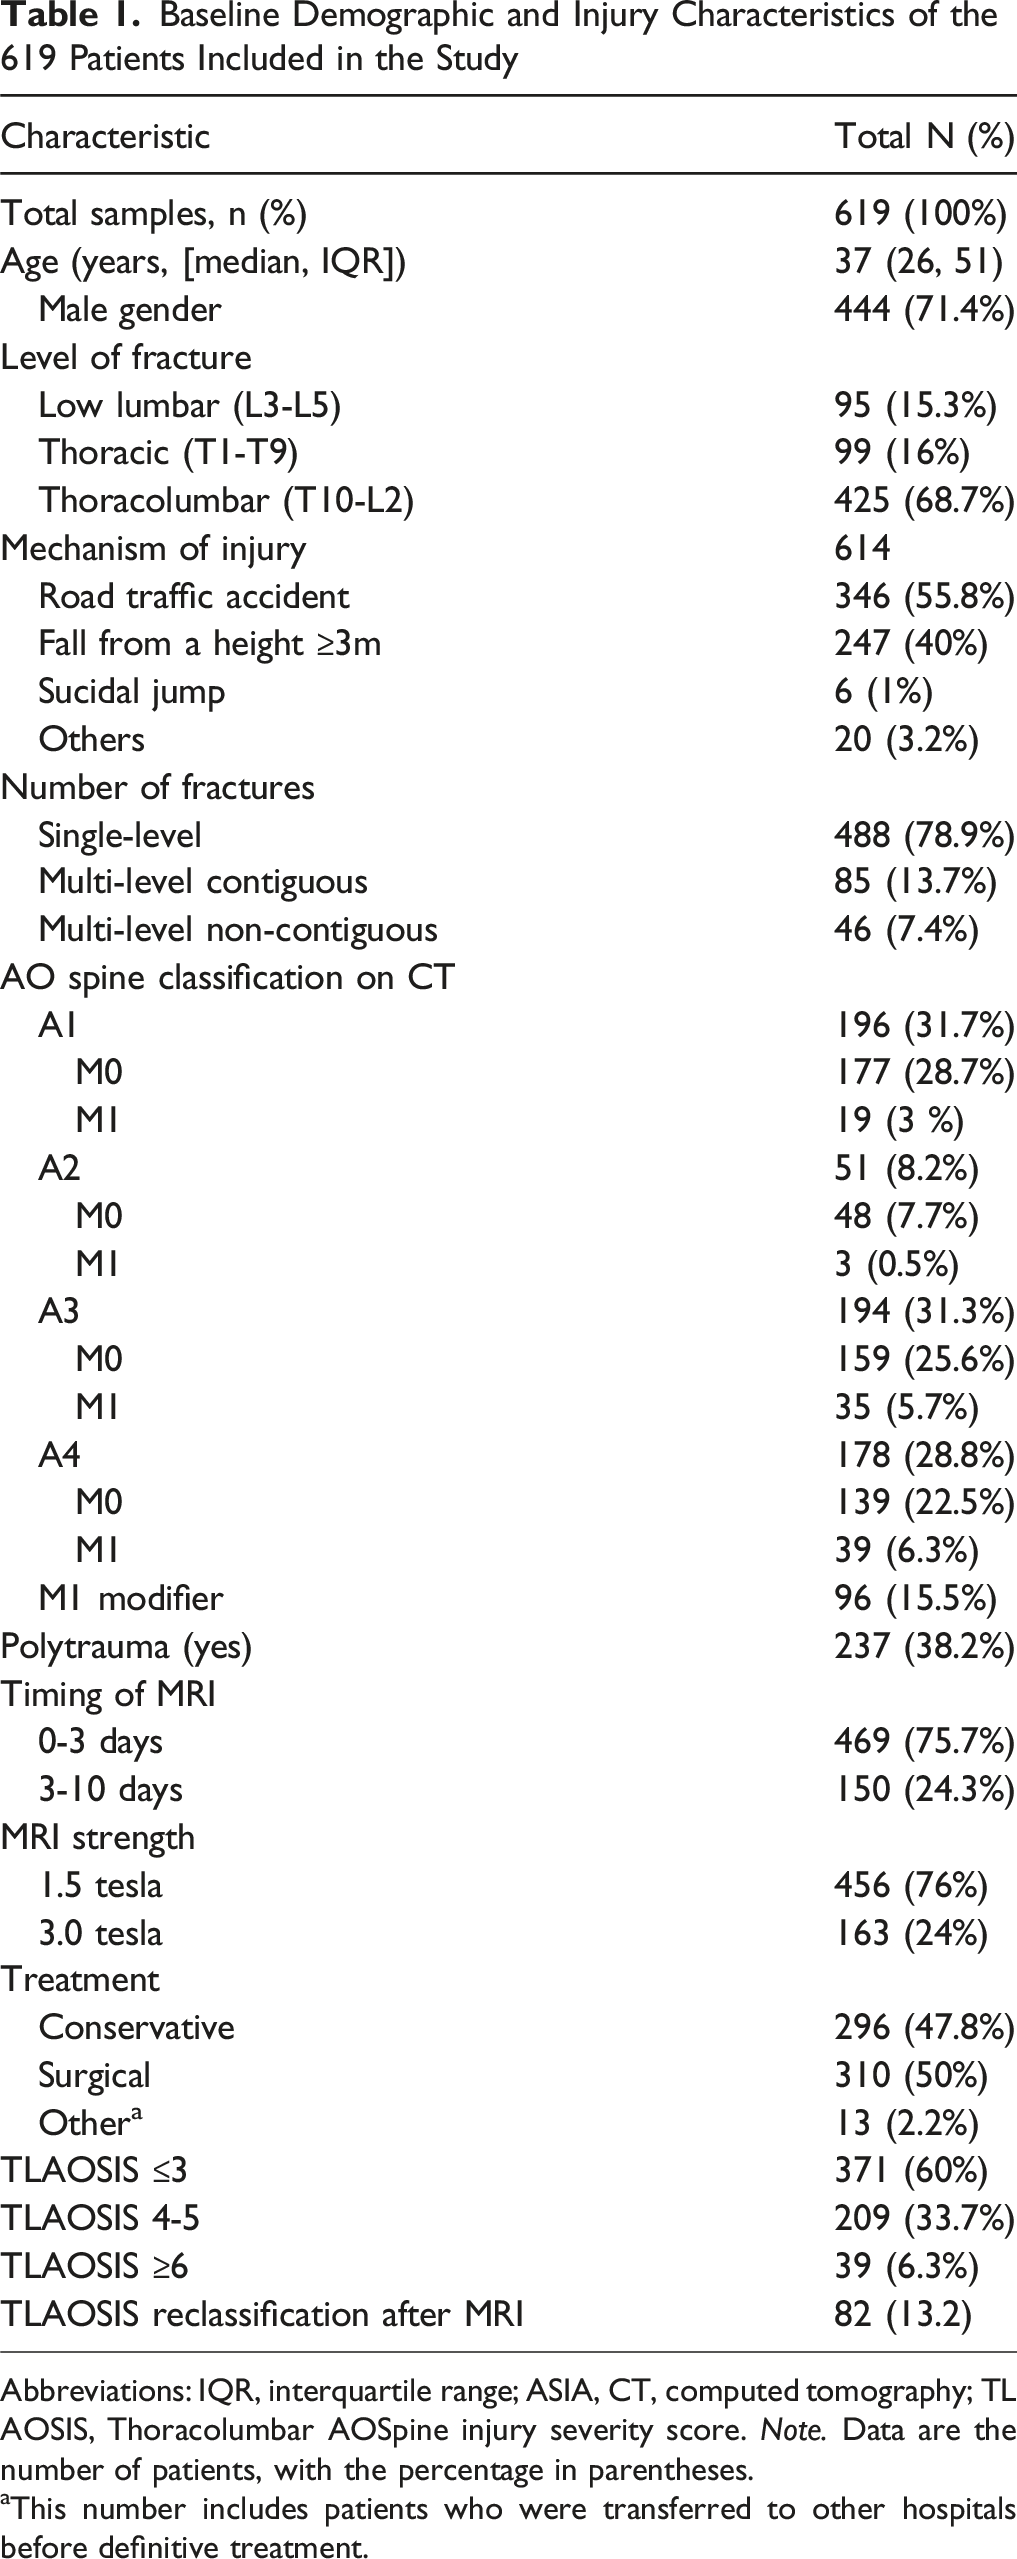
Abbreviations: IQR, interquartile range; ASIA, CT, computed tomography; TL AOSIS, Thoracolumbar AOSpine injury severity score. Note. Data are the number of patients, with the percentage in parentheses.
aThis number includes patients who were transferred to other hospitals before definitive treatment.
Image Acquisition Protocol
MRIs was performed on 1.5-tesla (T) or 3-T scanners and included axial and sagittal T1-weighted images (T1-WI), T2-weighted images (T2-WI), and sagittal short tau inversion recovery (STIR) images.22,23 CTs were performed according to a previously described protocol. 13
Standardized Interpretation Protocol
Three reviewers from each center independently analyzed the images using a picture archiving and communication system (INFINITT PACS; INFINITT Healthcare Co. Ltd., Seoul, Korea). All nine evaluators (five neurosurgeons, one orthopedic surgeon, and three fellowship-trained radiologists) had more than 5 years of experience analyzing TLF images. Reviewers were denied access to clinical data and any additional images. 24 Anonymized CT and MRI images were shown in two separate sessions, four weeks apart, to reduce the recollection bias. 24 All reviewers received consensus pre-training based on a standardized image interpretation protocol. 22
Assessment of AO Spine Classification and TLAOSIS Using CT and MRI
We classified all fractures in CT into A1-A4 according to the AOSpine Classification.
2
The fractures were classified as M1 or M0 based on the presence of a single vs no findings of the following: interspinous widening ≥4 mm25,26 spinous process fracture, horizontal laminar fracture,
27
and facet malalignment (Figure 1).
25
CT findings for detecting thoracolumbar posterior ligamentous complex injury.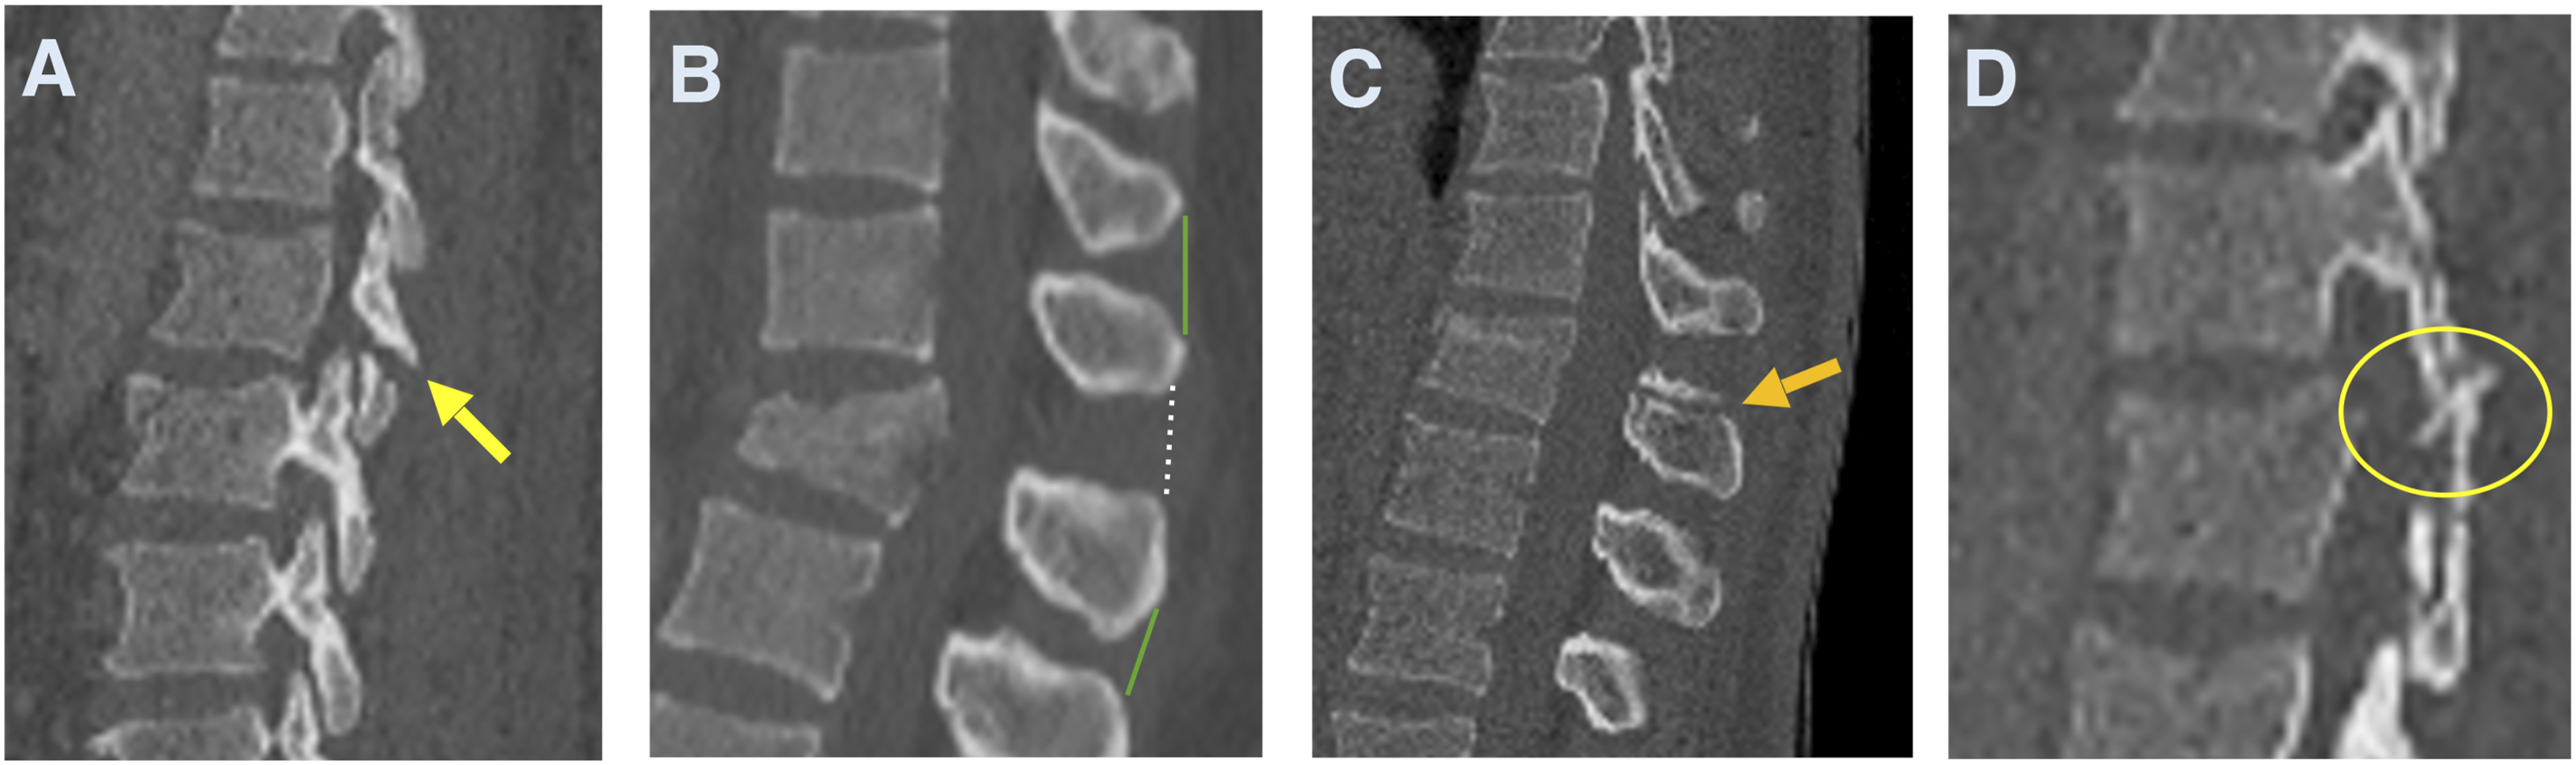
We classified fractures on MRI as B-injuries if they were associated with a black stripe discontinuity due to supraspinous ligament (SSL), ligamentum flavum (LF), or facet capsule (FC) disruption. A-injuries were classified as having high-signal intensity on T2-WI due to interspinous ligament (ISL) edema or facet joint effusion, or no high signal intensity (no M1 modifier was assigned after MRI, Figure 2).
28
MRI signs of thoracolumbar posterior ligamentous complex injury.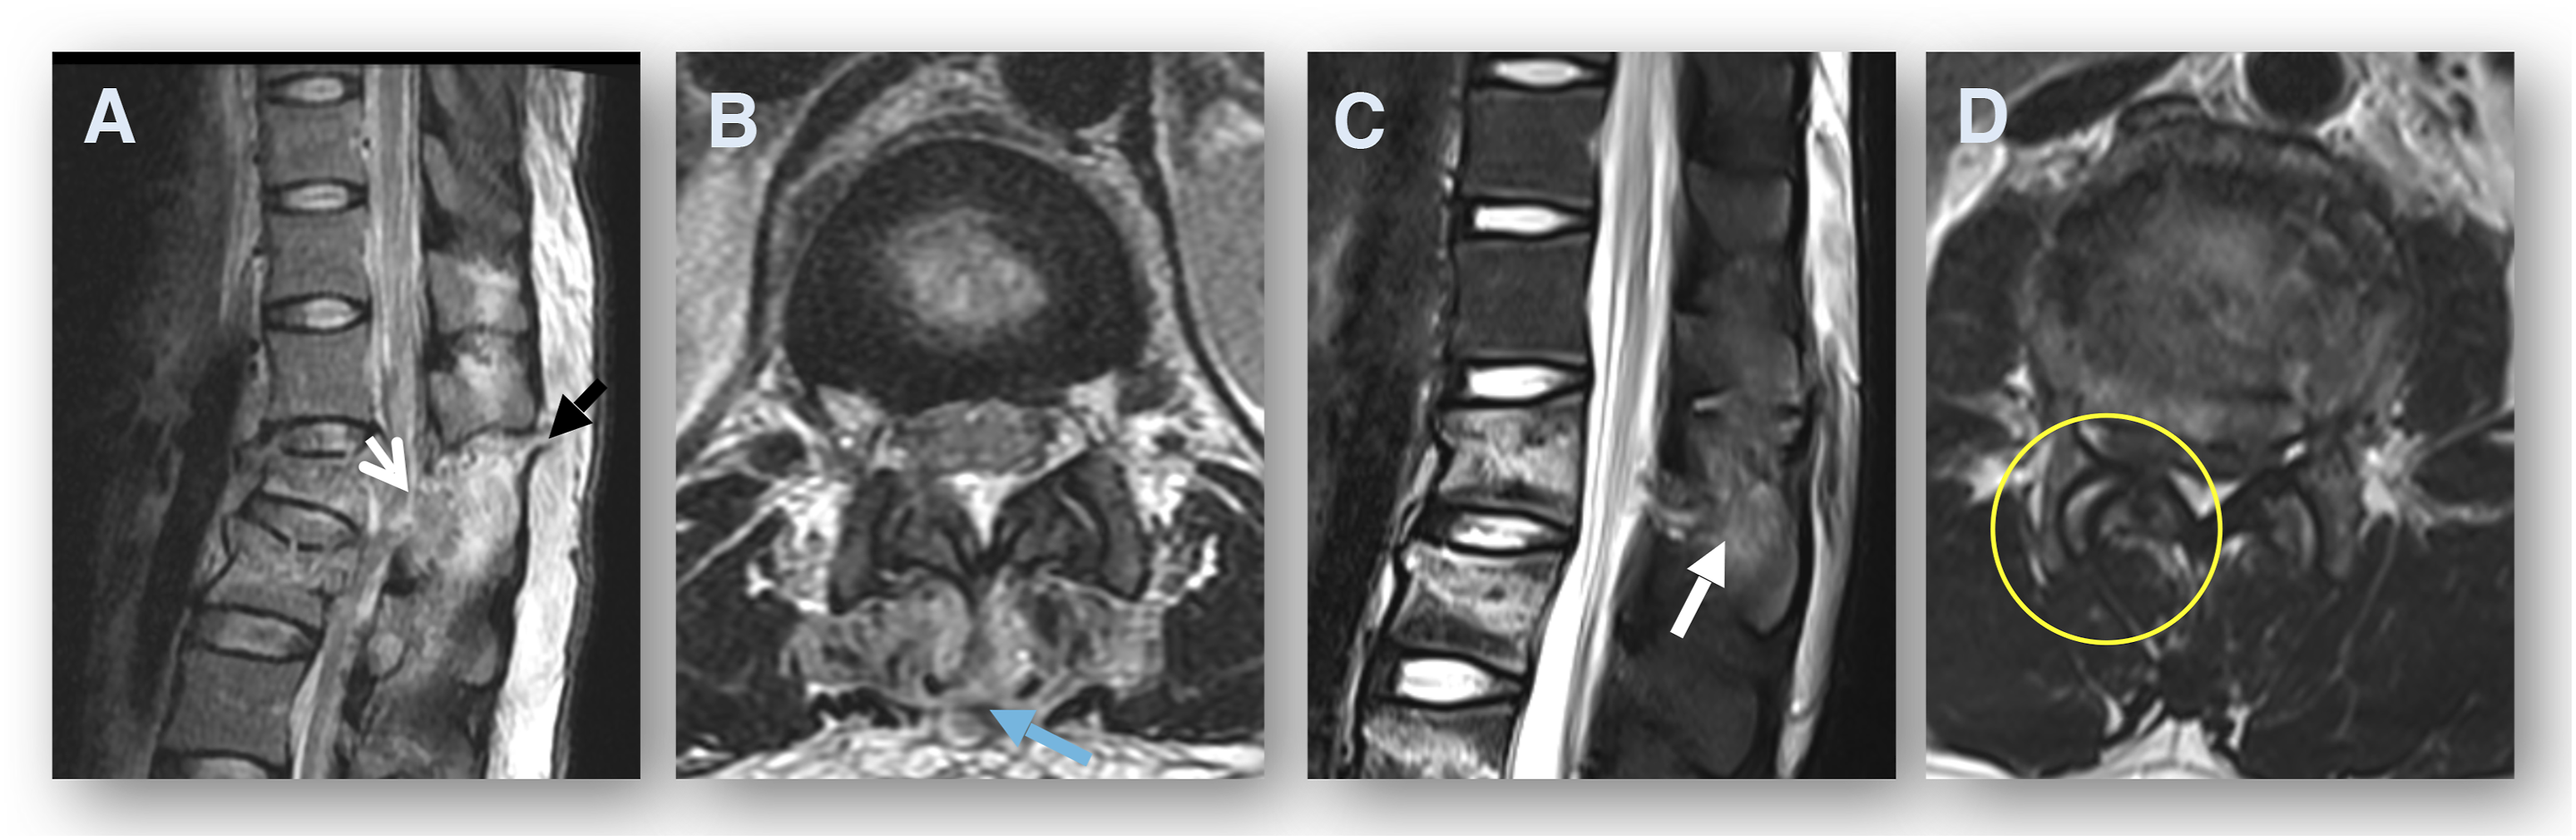
Outcome Measures and Candidate Predictor Selection
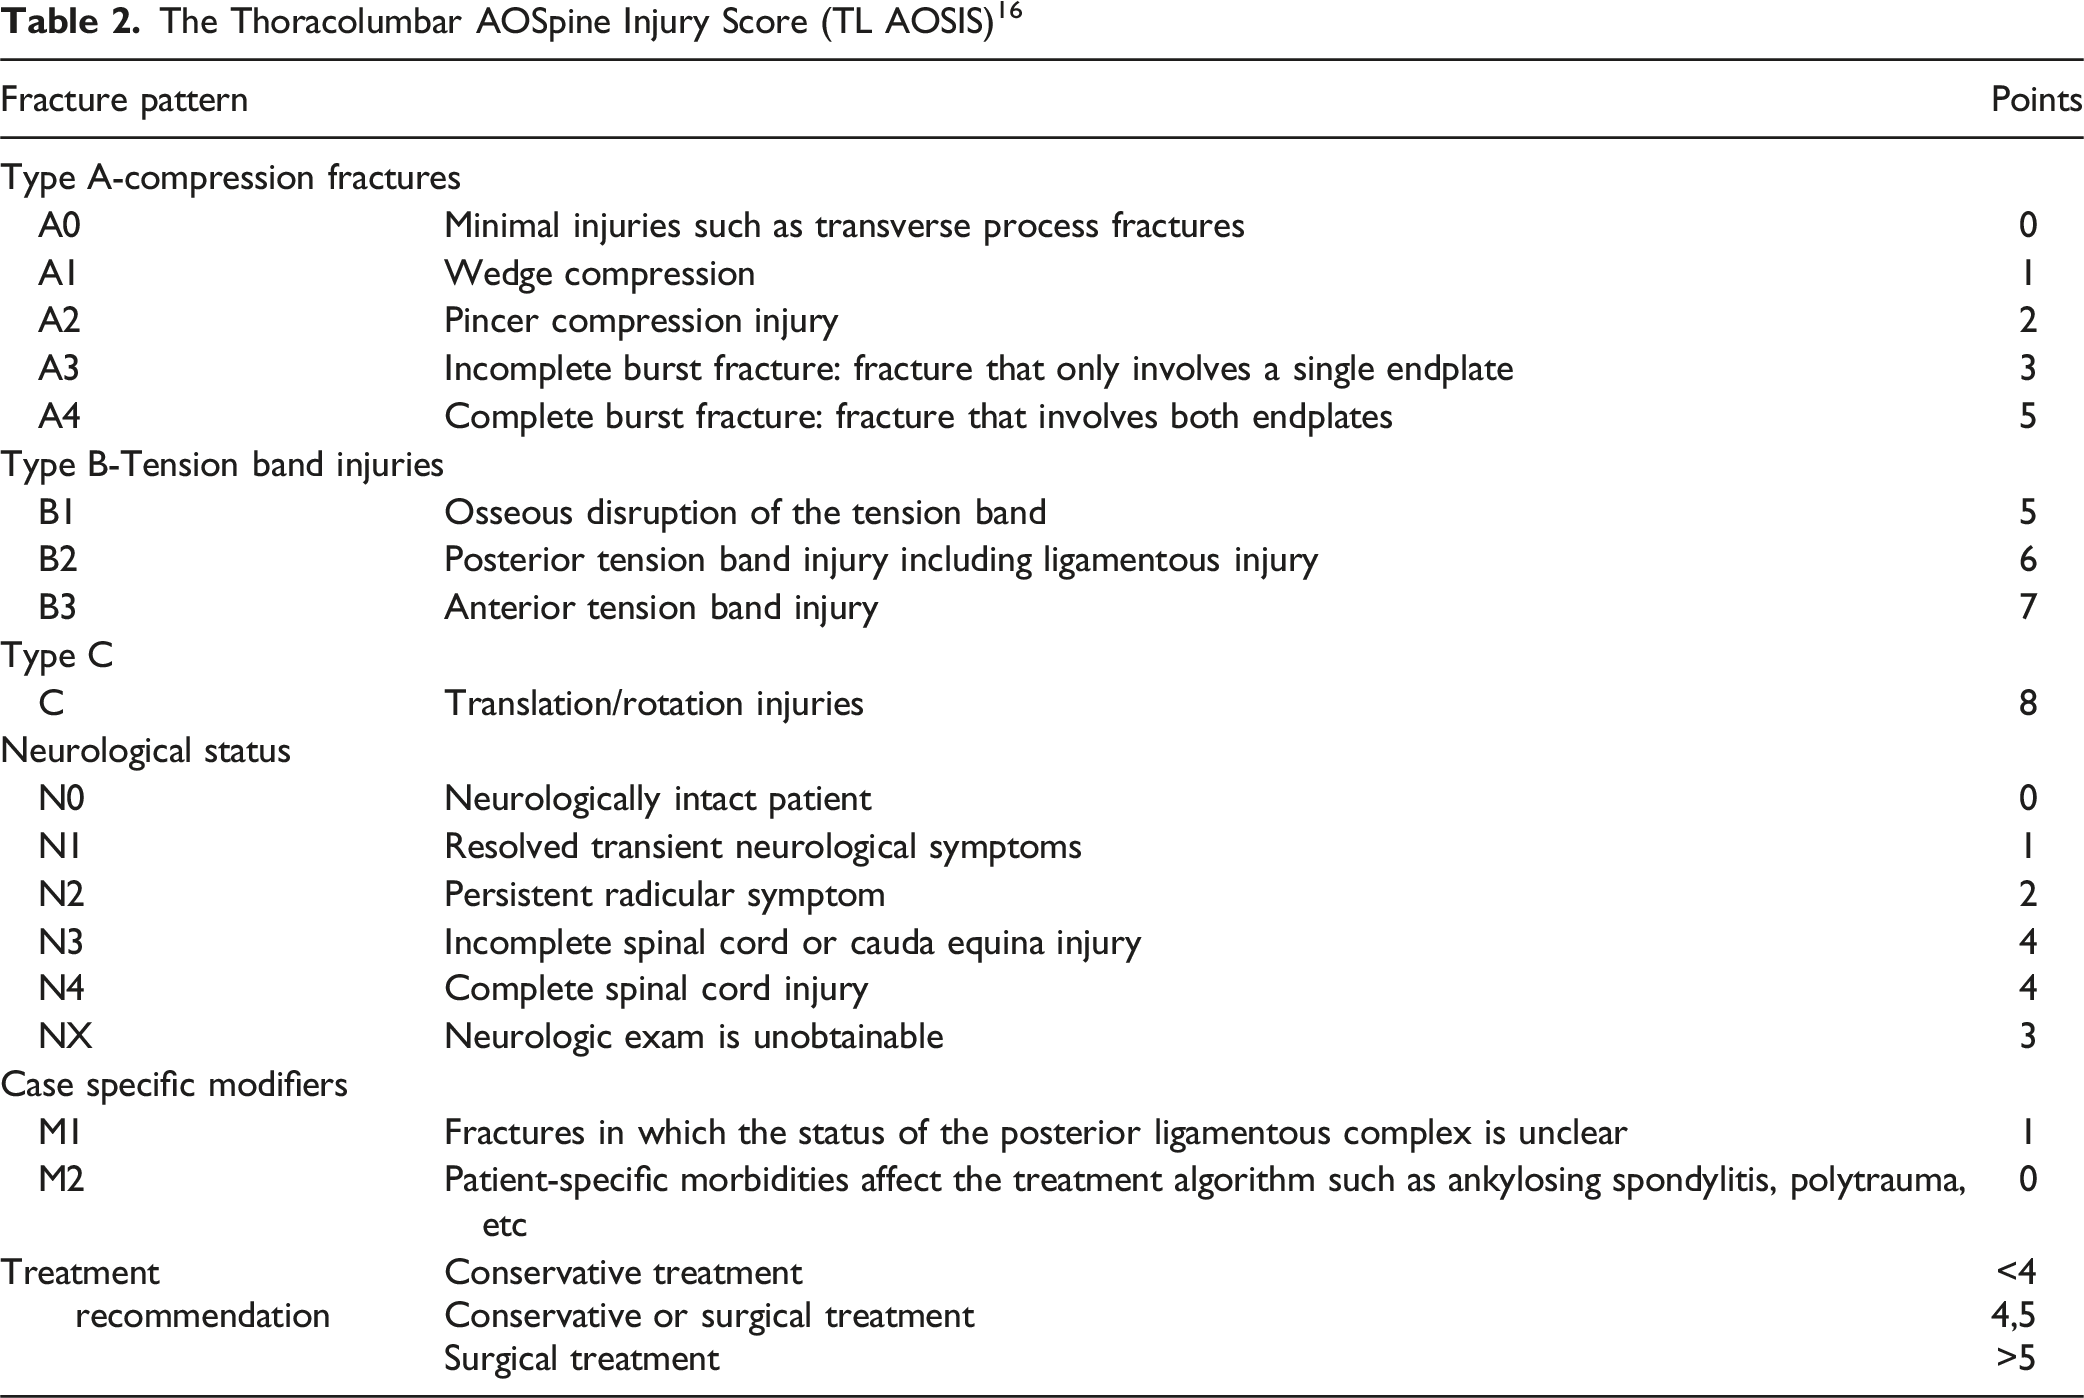
The Thoracolumbar AOSpine Injury Score (TL AOSIS) 16
We prespecified three candidate predictors for model development based on their documented influence on MRI indications in the previous literature. 14 These include the M1 modifier as defined by a single CT finding (binary),14,15 the level of the fracture (low lumbar [L3-L5],25,29,30 thoracic [T1-T9],31–33 or thoracolumbar junction [T10-L2]), and the AO Spine A-injury subtype (A1-A4).14,19
Sample Size Calculation
We calculated the total sample size based on the approach by Riley et al, as it ensures more robust statistical power and precision compared to the rule of thumb (1 variable per 10 events).33,34 The optimal sample size was 488 based on the following assumptions: (1) a margin of error <0.05; (2) a mean absolute prediction error is assumed to be 0.07; (3) a shrinkage factor <10% to avoid model overfitting; (4) the difference between the R2 and the adjusted unbiased “R2 Nagelkerke” ≤80% in the target population; and (5) the management change proportion was 22% based on a previous meta-analysis and three candidate predictors.14,33
Statistical Analysis
We used Python version 3.11 and scikit-learn 1.5 for analysis and considered P-values ≤.05 as statistically significant. The dataset was randomly partitioned and stratified by event status into a derivation set (495 patients, 80%) and a validation set (124 patients, 20%). A Gini-impurity classification tree was fitted with the following hyperparameters: maximum depth of 4, class-balanced weighting to counteract outcome imbalance (13.2% management change rate), minimum samples per leaf of 5, minimum samples for split of 5, and a random splitter with square root feature selection. 18
Model discrimination was summarized using the area under the receiver operating characteristic curve (AUC-ROC), sensitivity, specificity, positive and negative predictive values (PPV and NPV, respectively), and overall accuracy. Five-fold cross-validation was performed to assess the stability of the model. 18 We utilized Fleiss' kappa to determine the inter-reader reliability among the three reviewers from each center regarding the PLC status on MRI and CT.13,35
Results
Baseline Patient Characteristics
Among the 619 patients included, 280 were from Center 1, 234 from Center 2, and 105 from Center 3. The median age was 37 years (IQR 26-51), and 444 (71.4%) were male. Thoracolumbar junction fractures were the most common (425, 68.7%), followed by thoracic (99, 16%), and low lumbar fractures (95, 15.3%). The most frequent AO Spine fracture subtypes were A1 (31.7%) and A3 (31.3%), followed by A4 (28.8%) and A2 (8.2%). The M1 modifier was present in 96 patients (15.5%) (Table 1).
Change in the Thoracolumbar AOSpine Injury Score after MRI
Change in TLAOSIS Scores After MRI Compared to CT for 619 Cases Included
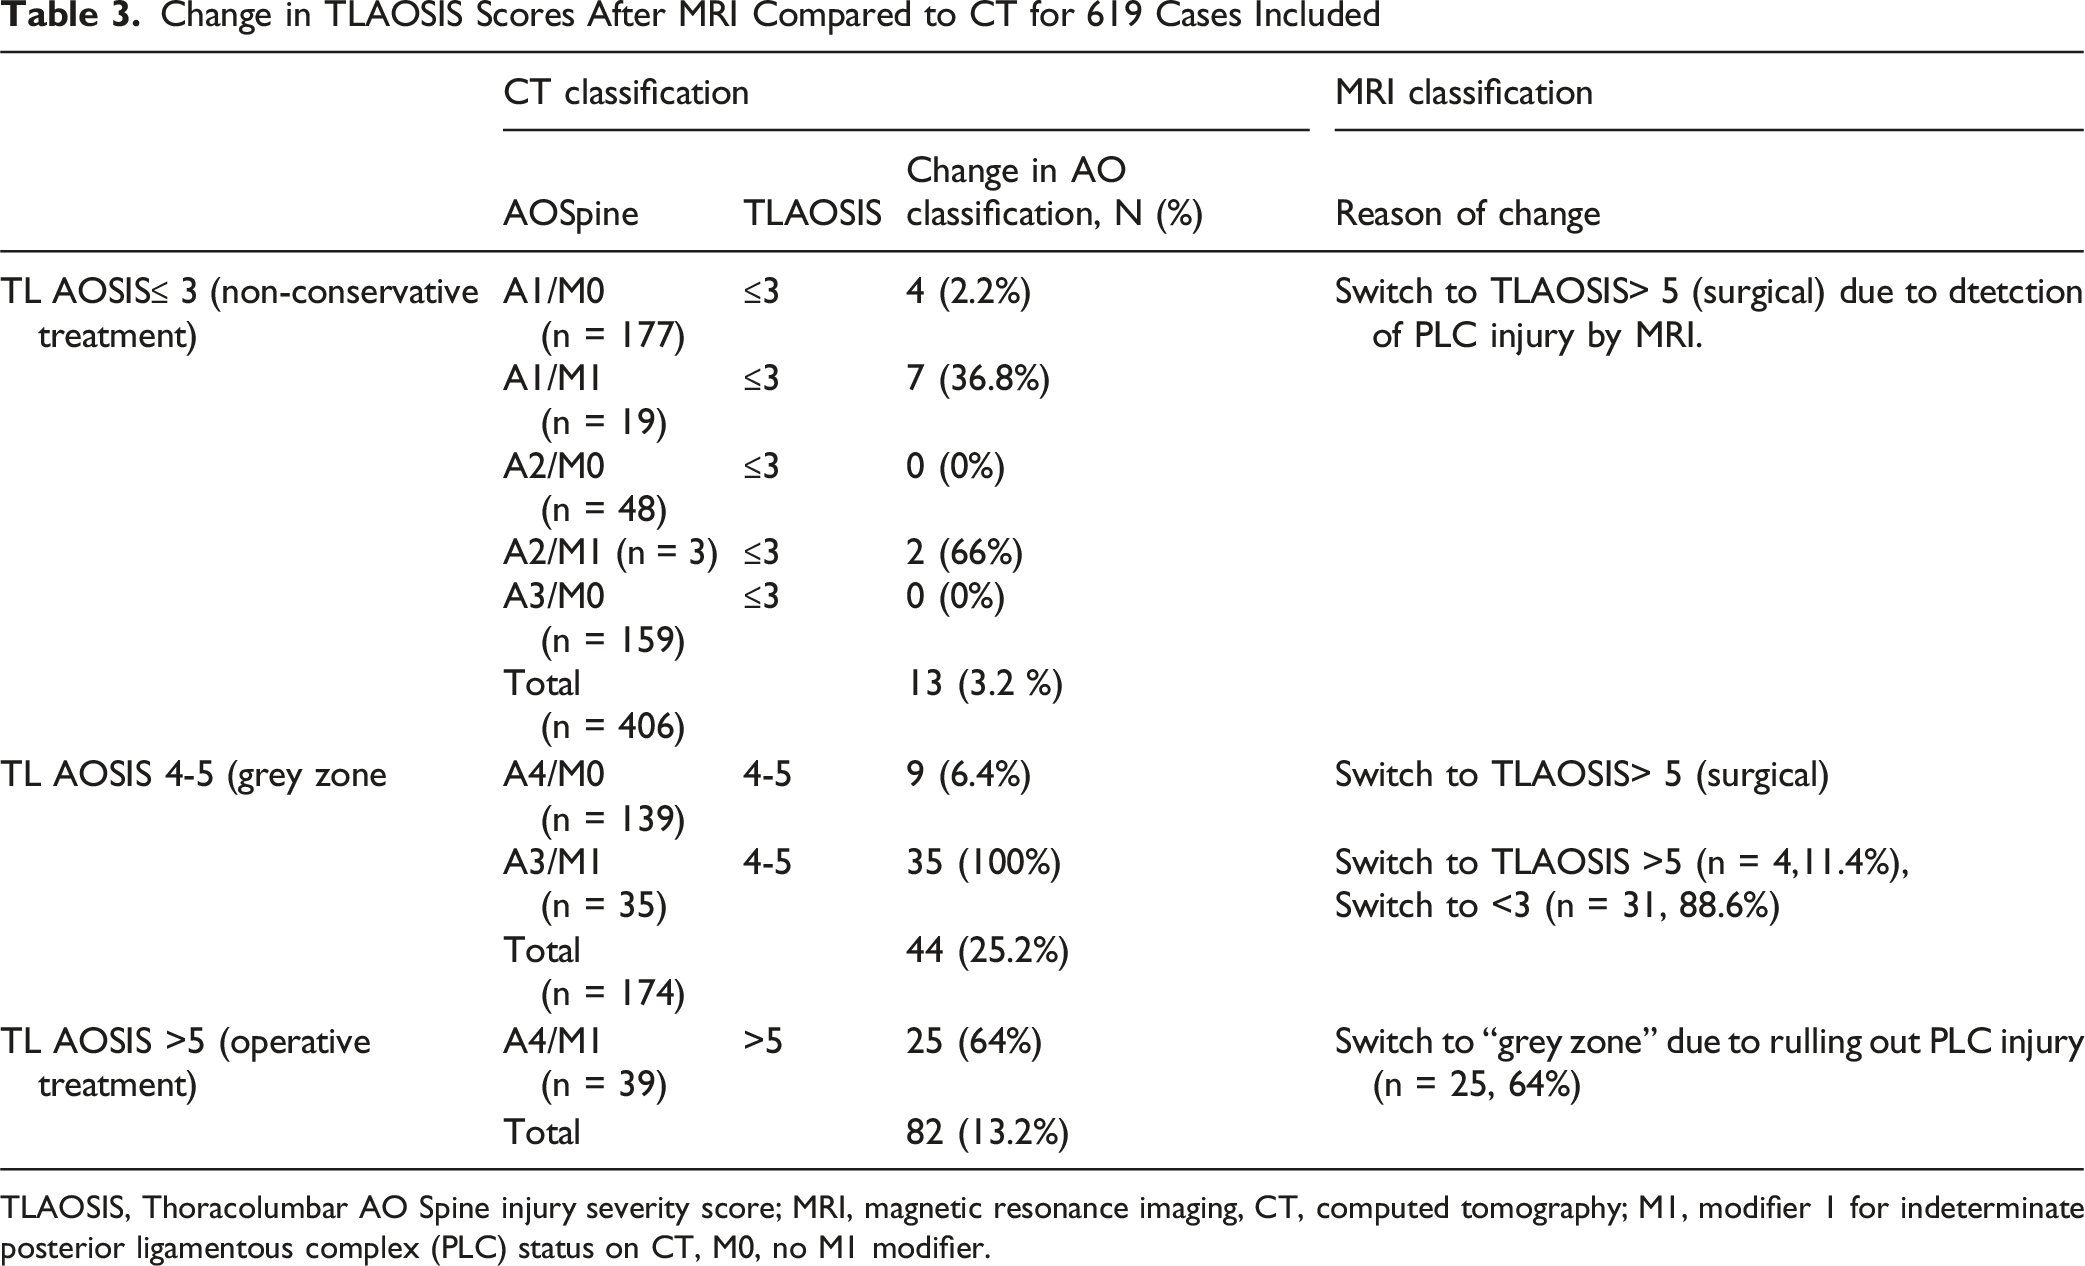
TLAOSIS, Thoracolumbar AO Spine injury severity score; MRI, magnetic resonance imaging, CT, computed tomography; M1, modifier 1 for indeterminate posterior ligamentous complex (PLC) status on CT, M0, no M1 modifier.
Model Description
The algorithm encompasses nine terminal nodes. It begins by evaluating the M1 modifier, which discriminates between a 71% vs 3.2% chance of ’management change.’ The management change probability for M1 A-fractures was further stratified by AO fracture type: A3 (100%), A4 (62%), and A1/A2 (44%). When M1 is absent (M0), the algorithm further stratifies the probability of management change by spine level and AO fracture type (Figures 3 and 4). Management change was negligible, except for thoracic A4 (21%) and thoracic A1 and thoracolumbar junction A4 (4% each). Final decision tree algorithm for predicting changes in TLOASIS recommendations after MRI. Simplified illustration showing the summarization of the decision tree algorithm for predicting changes in TLOASIS recommendations after MRI

Model Performance
CART achieved excellent discriminative performance, with an AUC of 0.931 and an area under the precision-recall curve of 0.864 (Figure 5A). At the optimal threshold, the model demonstrated 87.5% sensitivity, 96.3% specificity, 77.8% positive predictive value (PPV), 98.1% negative predictive value (NPV, and 95.2% overall accuracy. Cross-validation confirmed robust accuracy [mean 92.9% ± 12.0%, Figure 5B]. The M1 modifier was the dominant predictor (importance = 0.914), followed by the AO fracture subtype (0.055) and spine level (0.031) (Figure 5C). Figure 1. Model Performance Evaluation of Decision Tree Classification.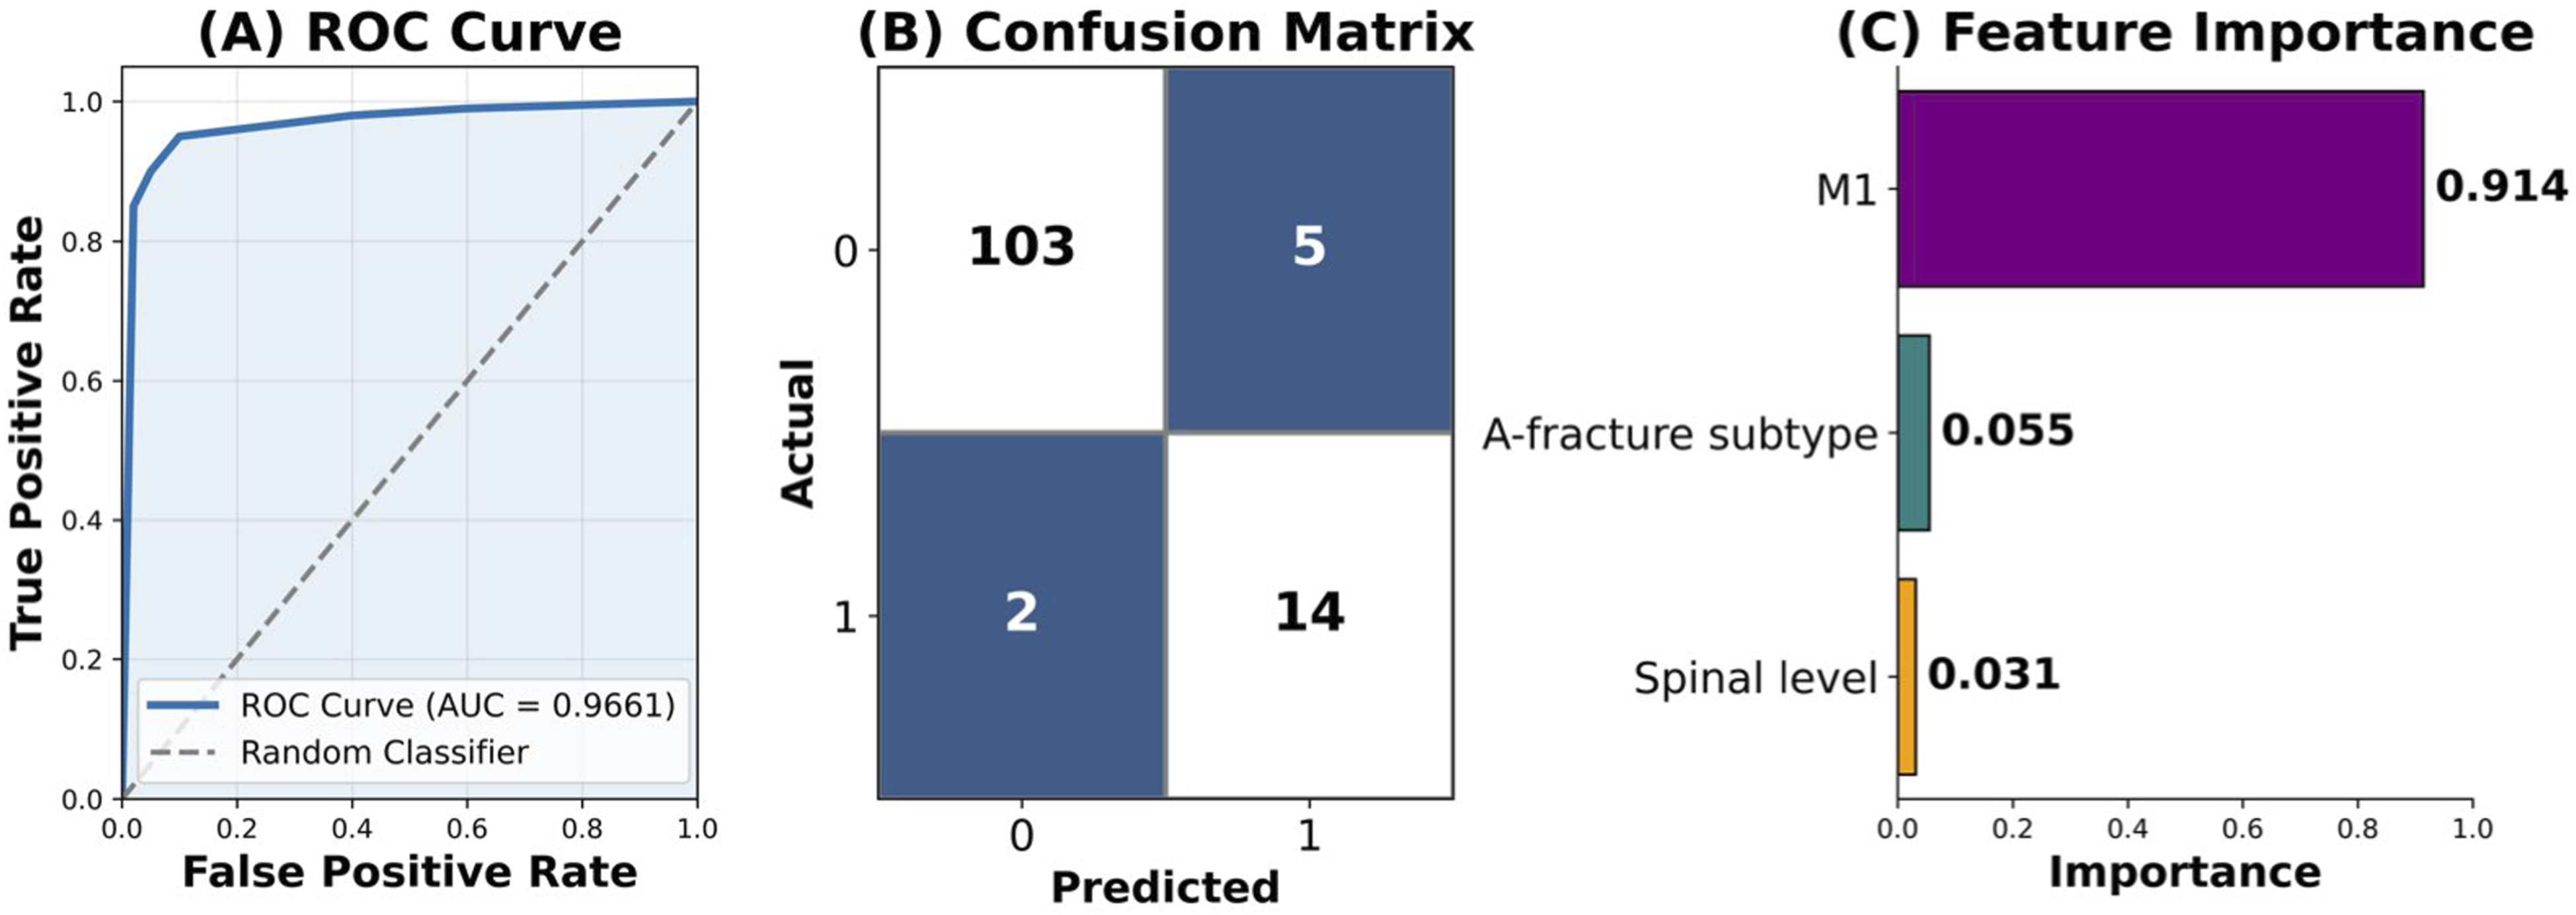
Inter-Reader Agreement on PLC Status in CT and MRI
Inter-observer agreement M1 vs M0 on CT was substantial to moderate among centers (κ = 0.418-0.682) and excellent for MRI (κ, range 95.6%-97.2%).
Discussion
Key Findings and Interpretations
To our knowledge, this multicenter study is the first to develop and validate a machine-learning algorithm for predicting the need for MRI in neurologically intact patients with TLFs. 5 MRI altered the TLASOSIS recommendation in 13.2% of patients compared to CT alone. A model that includes the M1 modifier, A-fracture subtypes, and spinal level could accurately predict changes in management after MRI. The algorithm provides cost-effective indications for MRI in neurologically intact TLFs, ensuring accurate PLC assessment while minimizing the burden of MRI. The merits of this study lie in its large sample size, robust methodology, and multicenter design, all of which contributed to its high precision. 4
Methodological Challenges in Evaluating the Impact of MRI on TLFs Management
This study addressed most of the potential biases encountered while assessing the influence of MRI on TLFs’ management. 4 We excluded patients with neurological deficits and type C fractures, as they are typically treated surgically, irrespective of MRI results. 4 Additionally, osteoporotic and low-energy fractures were excluded because of their low probability of associated PLC injuries. 4 We followed a standardized protocol for MRI acquisition, including sagittal STIR and axial T2-WI, and image interpretation, which explains the high inter-observer reliability. 22
Traditionally, the impact of MRI on TLFs management has been assessed by detecting PLC disruption and upgrading type A-type to B-type injuries. 36 However, this approach overlooks vertebral fracture severity, which plays a key role in treatment decisions. 15 For example, identifying a PLC injury in a severely comminuted A4 fracture may not alter management, as such cases already warrant surgery. In contrast, the TLAOSIS framework integrates both PLC integrity and fracture subtype (A1–A4), allowing for a more nuanced assessment.
Furthermore, measuring MRI impacts by solely relying on upgrades from A to B-injuries disregards the implications of ruling out PLC injury on decision-making. 4 Ruling out PLC injury shifted the decision from surgery to the gray zone in 64% of A4M1 and from the gray zone to conservative in 17.8% of A3M1. Conversely, the TLAOSIS is a three-tier system that considers the switch from and to the “grey zone'', thus reducing treatment bias. 15
While TLAOSIS provides a structured framework, its clinical application—particularly for A3/A4 fractures—varies due to the lack of high-quality evidence favoring surgical or non-surgical treatment. 37 The higher weighting of A4 than A3 suggests a surgical approach, yet practice patterns remain inconsistent across regions. 38 Our study predicts changes relative to an ideal TLAOSIS-guided algorithm, identifying when MRI offers critical, decision-altering information regardless of individual variability. 4
Potential Variables Included in the Algorithm
The M1 modifier was critical in distinguishing between a high and low likelihood of management change. The risk of management change for M1 was further stratified based on AO fracture types A3 (100%), A4 (75%), and A1/A2 (45%). A3/A4 fractures have a higher chance of management change than A1/A2 fractures, which aligns with the hierarchical severity and risk of PLC injury. 2 The chance of management change for AM0 fractures was negligible for low lumbar fractures, A2, and A3 fractures; the highest was for thoracic A4 (21%), followed by thoracic A1 and thoracolumbar junction A4 (4% each).
The impact of the spine region on the decision-making of thoracolumbar fractures may be attributed to their variable anatomical and biomechanical characteristics.30,31 Because of lordosis, PLC injury is uncommon in the low lumbar spine. However, when it does occur, it usually leads to a severe type B or C pattern.29,30 The kyphotic curvature of the thoracic spine results in flexion forces leading to proportional distraction of the SSL/ISL complex (the inflection point).31,32 This may lead to localized disruption of the SSL, causing isolated ISW, which can be readily missed on a supine CT. This elucidates why management alterations following MRI are more prevalent for thoracic A4M0 and A1M0 fractures than for other fractures.
Study Implications
Though MRI proved to significantly influence thoracolumbar fracture management, there is a need for objective MRI indications that reduce its burden while ensuring accurate PLC assessment.4,5 The proposed algorithm offers utility in both resource-limited and resource-rich settings. In resource-limited areas where MRI is unavailable, the algorithm can help identify cases that are manageable with CT alone vs those needing referral, minimizing treatment delays caused by transfers. Additionally, the model could predict when a standing X-ray might serve as a feasible alternative to detect occult PLC injury. 37
In settings with MRI availability, the algorithm supports selective MRI use, improving cost-effectiveness, time, and resource allocation. Notably, the M1 modifier predicted 71% of management changes while applying to only 15.5% of cases. While MRI remains the gold standard for PLC evaluation, its moderate inter-observer reliability highlights the value of using predictive tools to identify high-probability cases, prompting detailed assessment or expert radiological consultation. 39
Uncertainty about PLC status on CT places most of burst fractures in the grey zone, contributing to the inconsistent treatment. 11 To address this clinical dilemma, our approach provides two complementary solutions: first, the use of validated CT-based criteria to assess PLC integrity when findings are definitive and accurate; and second, the selective use of MRI in cases where PLC status remains uncertain. “It may reduce the number of cases ultimately classified in the gray zone, thereby minimizing treatment variability.
This algorithm can be integrated into clinical practice through a simple platform that calculates the probability of TLAOSIS classification change, offering real-time support for MRI decisions. It could also be embedded in CT systems to flag cases with high likelihood of PLC injury. 40 When combined with an image-recognition tool that detects fracture morphology and assesses PLC integrity, this AI-driven model could form a comprehensive decision-support system—enhancing diagnostic accuracy, reducing variability, and guiding selective MRI use. 17
Strengths and Limitations
Retrospective data collection may introduce recall bias; however, imaging data are less susceptible to such biases. 13 More severe fractures and those with neurological deficits are more likely to be verified by MRI (verification bias) or recruited from level 1 trauma centers (spectrum bias). However, focusing on neurologically intact patients with A fractures and including 50% treated non-surgically minimizes these biases.13,24
The retrospective design precluded the assessment of the impact of changing PLC status on clinical outcomes. However, the black stripe discontinuity is regarded as a surrogate marker of instability based on the findings that the LF and SSL are the key biomechanical contributors to PLC stability.41,42 Black stripe discontinuity showed high specificity in identifying PLC disruption during surgery and can be applied to both surgical and non-surgical cases, contrary to intraoperative findings. 28
Management change was defined as any shift among the three TLAOSIS categories. While a switch from conservative treatment to surgery is likely more clinically impactful than transitions involving the gray zone, categorizing multiple outcome groups would have reduced statistical power and model precision. However, future prospective studies are required to independently validate the proposed algorithm in independent populations by independent reviewers.
The moderate inter-observer reliability reported should be interpreted in light of the fact that we excluded the most obvious PLC injuries and focused on those with intact or undetermined PLC injuries. However, the proposed standardized imaging interpretation protocol could improve the reliability and increase generalizability in different settings. 22 This secondary analysis used multicenter data focused on PLC injury assessment. Inter-observer reliability was evaluated for major types (A vs B) and M1, while a single reviewer assessed A-fracture subtyping. 13
We excluded B injuries with ≥2 CT findings due to their low likelihood of downgrading to type A after MRI. 13 Predictors of downgrade differ from those of upgrade, and including such cases would confound the analysis.
Conclusion
The developed machine learning algorithm, based on the M1 modifier, spine level, and AO fracture subtype, demonstrated high accuracy in predicting changes in the TLAOSIS treatment recommendations after MRI in neurologically intact patients with A-type thoracolumbar fractures. By accurately identifying cases where MRI would alter clinical decision-making, this model offers a cost-effective tool to guide MRI utilization, ensuring precise assessment of posterior ligamentous complex integrity while minimizing unnecessary imaging and associated burdens. The multicenter design, large sample size, and robust methodology underpin the model’s generalizability and clinical applicability. Future prospective validation studies are warranted to confirm these findings and further refine MRI indication criteria in this patient population.
Footnotes
Acknowledgments
The authors wish to thank Dr. Ahmad Mashaly for the illustrations included in this article. We also acknowledge the research department and grant management department in King Fahd Medical City, for their help.
Ethical Considerations
Institutional board review obtained from King Fahd Medical IRB approval number KACST, KSA, H-01-R-012.
Author Contributions
A.M.M. helped with design and methodology. A.M.M., M.A., F.A.A., and X.A.S. helped with data extraction. A.M. M., A.A.M., WA, M.A., F.A. A., R.A.R., X.A.S., G.T.K., and G.R.G. helped with image interpretation. A. F. and A. M. M. did the statistical analysis. All authors helped compose the manuscript and approved the final version.
Funding
The authors disclosed receipt of the following financial support for the research, authorship, and/or publication of this article: the authors declare that this research was supported by a research grant from the research center, King Fahd Medical City, Riyadh, second cluster (#IRF 024-016).
Declaration of Conflicting Interests
The authors declared no potential conflicts of interest with respect to the research, authorship, and/or publication of this article.
AI Disclosure Statement
Figures and visual summaries (eg, infographics) in this manuscript were created with the assistance of generative AI platforms (eg, Notebook LM). These tools were used to support the visual design and layout only. All scientific content was provided, reviewed, and verified by the authors, who took full responsibility for the accuracy and integrity of the final submission. Additionally, AI tools like ChatGPT and Paperpall were used for drafting the manuscript.