
Abstract
Study Design
Case-control Study.
Objective
To evaluate the alterations in lumbar stabilizing muscles, particularly the erector spinae (ES), lumbar multifidus (LM), and gluteus maximus (Gmax), and their association with dynamic sagittal imbalance (DSI) after ambulation.
Methods
This study included patients with low back pain and anterior trunk tilt (defined as the DSI group), alongside a control group without significant anterior trunk tilt (defined as the dynamic sagittal balance, DSB group). Propensity score matching was used to align participants for comparison. The participants underwent whole-spine radiography before and after a 10-min walk. Alterations in muscle activity and fatigue were evaluated through surface electromyography (sEMG).
Results
Following a 10-min walk, the DSI group exhibited marked deterioration in sagittal parameters, particularly in LL and PT, whereas the parameters in the DSB group remained unchanged. Significant intergroup differences were identified in the changes (Δ) of LL and PT. The sEMG results revealed that after the 10-min walk, the DSI group experienced increased muscle activity and notable fatigue in the ES, LM and Gmax. While the DSB group also showed changes in the activity of ES and LM after walking, the activation and fatigue metrics of the LM didn’t demonstrate significant alterations. In contrast, the DSI group exhibited substantially greater changes in the activation of ES and LM, as well as the fatigue levels of LM.
Conclusion
This study highlighted the pivotal role of lumbar stabilizing muscles, particularly the LM, whose aberrant activation and fatigue were identified as key contributors to the progression of DSI.
Introduction
Low back pain (LBP) is the leading cause of disability burden worldwide and expected that disease-related costs will further increase in the coming decades. Sagittal spinal imbalance is a common contributor to LBP, with increased imbalance correlating negatively with health-related quality-of-life (HRQoL) scores. 1 The three subsystems involved in spinal stabilization (vertebrae, muscles, and nerves) work together through complex compensatory mechanisms to mitigate sagittal spinal imbalance. 2 Recent studies found that degeneration of lumbar stabilizing muscles significantly impacts sagittal imbalance and spinal dysfunction.3,4 It has been posited that paraspinal muscle degeneration is associated with disc degeneration and may be a significant cause of exacerbation of low back pain. 5
Traditionally, radiographic techniques have assessed lumbar stabilizing muscle condition. Chen et al. 6 demonstrated that computed tomography (CT) scans reveal reduced cross-sectional areas of paraspinal muscles in degenerative lumbar scoliosis patients. Similarly, Tahere et al. 7 reported significant fat infiltration and fibrosis in paraspinal muscles of individuals with LBP using magnetic resonance imaging (MRI). Nonetheless, these imaging methods reflect macroscopic morphology, failing to accurately represent microscopic changes during dynamic activities. Moreover, the correlation between imaging findings and actual muscle strength is non-linear, and variations in the interpretation of imaging parameters exist across studies. 8 For example, while You et al. 9 asserted that fat infiltration worsens postoperative outcomes, He et al. 10 found it had no significant effect, highlighting limitations in conventional imaging. Spinal balance is a dynamic concept, and sagittal parameters derived from a singular lateral radiograph can misrepresent spinal equilibrium due to transient compensatory mechanisms. Presently, methods for evaluating dynamic sagittal balance (DSB) or dynamic sagittal imbalance (DSI) are underdeveloped. Surface electromyography (sEMG), a non-invasive technique, allows for real-time recording of muscle activity during movement, transitioning assessments from static to dynamic evaluations. 11 In consideration of the anatomical positioning, nerve innervation, and functional disparities among muscles, this study delineated the lumbar stabilizing muscles, with a particular emphasis on the erector spinae (ES), lumbar multifidus (LM), and gluteus maximus (Gmax).
This study innovatively integrated sagittal parameters from patients with DSI with sEMG data from lumbar stabilizing muscles, enabling a thorough analysis of the dynamic variations. The objective was to elucidate the compensatory mechanisms involved in maintaining spinal balance.
Methods
Study Design and Population
Data were collected from participants who visited the First Affiliated Hospital of Nanjing Medical University between January 2023 and June 2024. The study adhered to the Declaration of Helsinki, with written informed consent obtained from all participants. Ethical approval was granted by the Ethical Committee of the First Affiliated Hospital of Nanjing Medical University (No. 2023-SR-345). Inclusion criteria for the DSI group were: (1) history of LBP with anterior trunk tilt, (2) ability to walk unsupported for over 10 min, (3) age>50 years old. The inclusion criteria for DSB group were: (1) history of LBP without anterior trunk tilt, (2) ability to walk unsupported for over 10 min, (3) age>50 years old. Exclusion criteria for both groups included: (1) congenital spinal deformity (CSD), idiopathic spinal deformity (ISD), flatback syndrome (FBS), or isthmic spondylolisthesis (IS); (2) history of spinal, pelvic or hip surgery; (3) history of thoracolumbar fracture; (4) neck, shoulder, or upper back pain in the preceding 6 months. Participants underwent two sets of whole-spine radiographs at initiation and after a 10-min walk to evaluate how sagittal balances changed after a predetermined task.
12
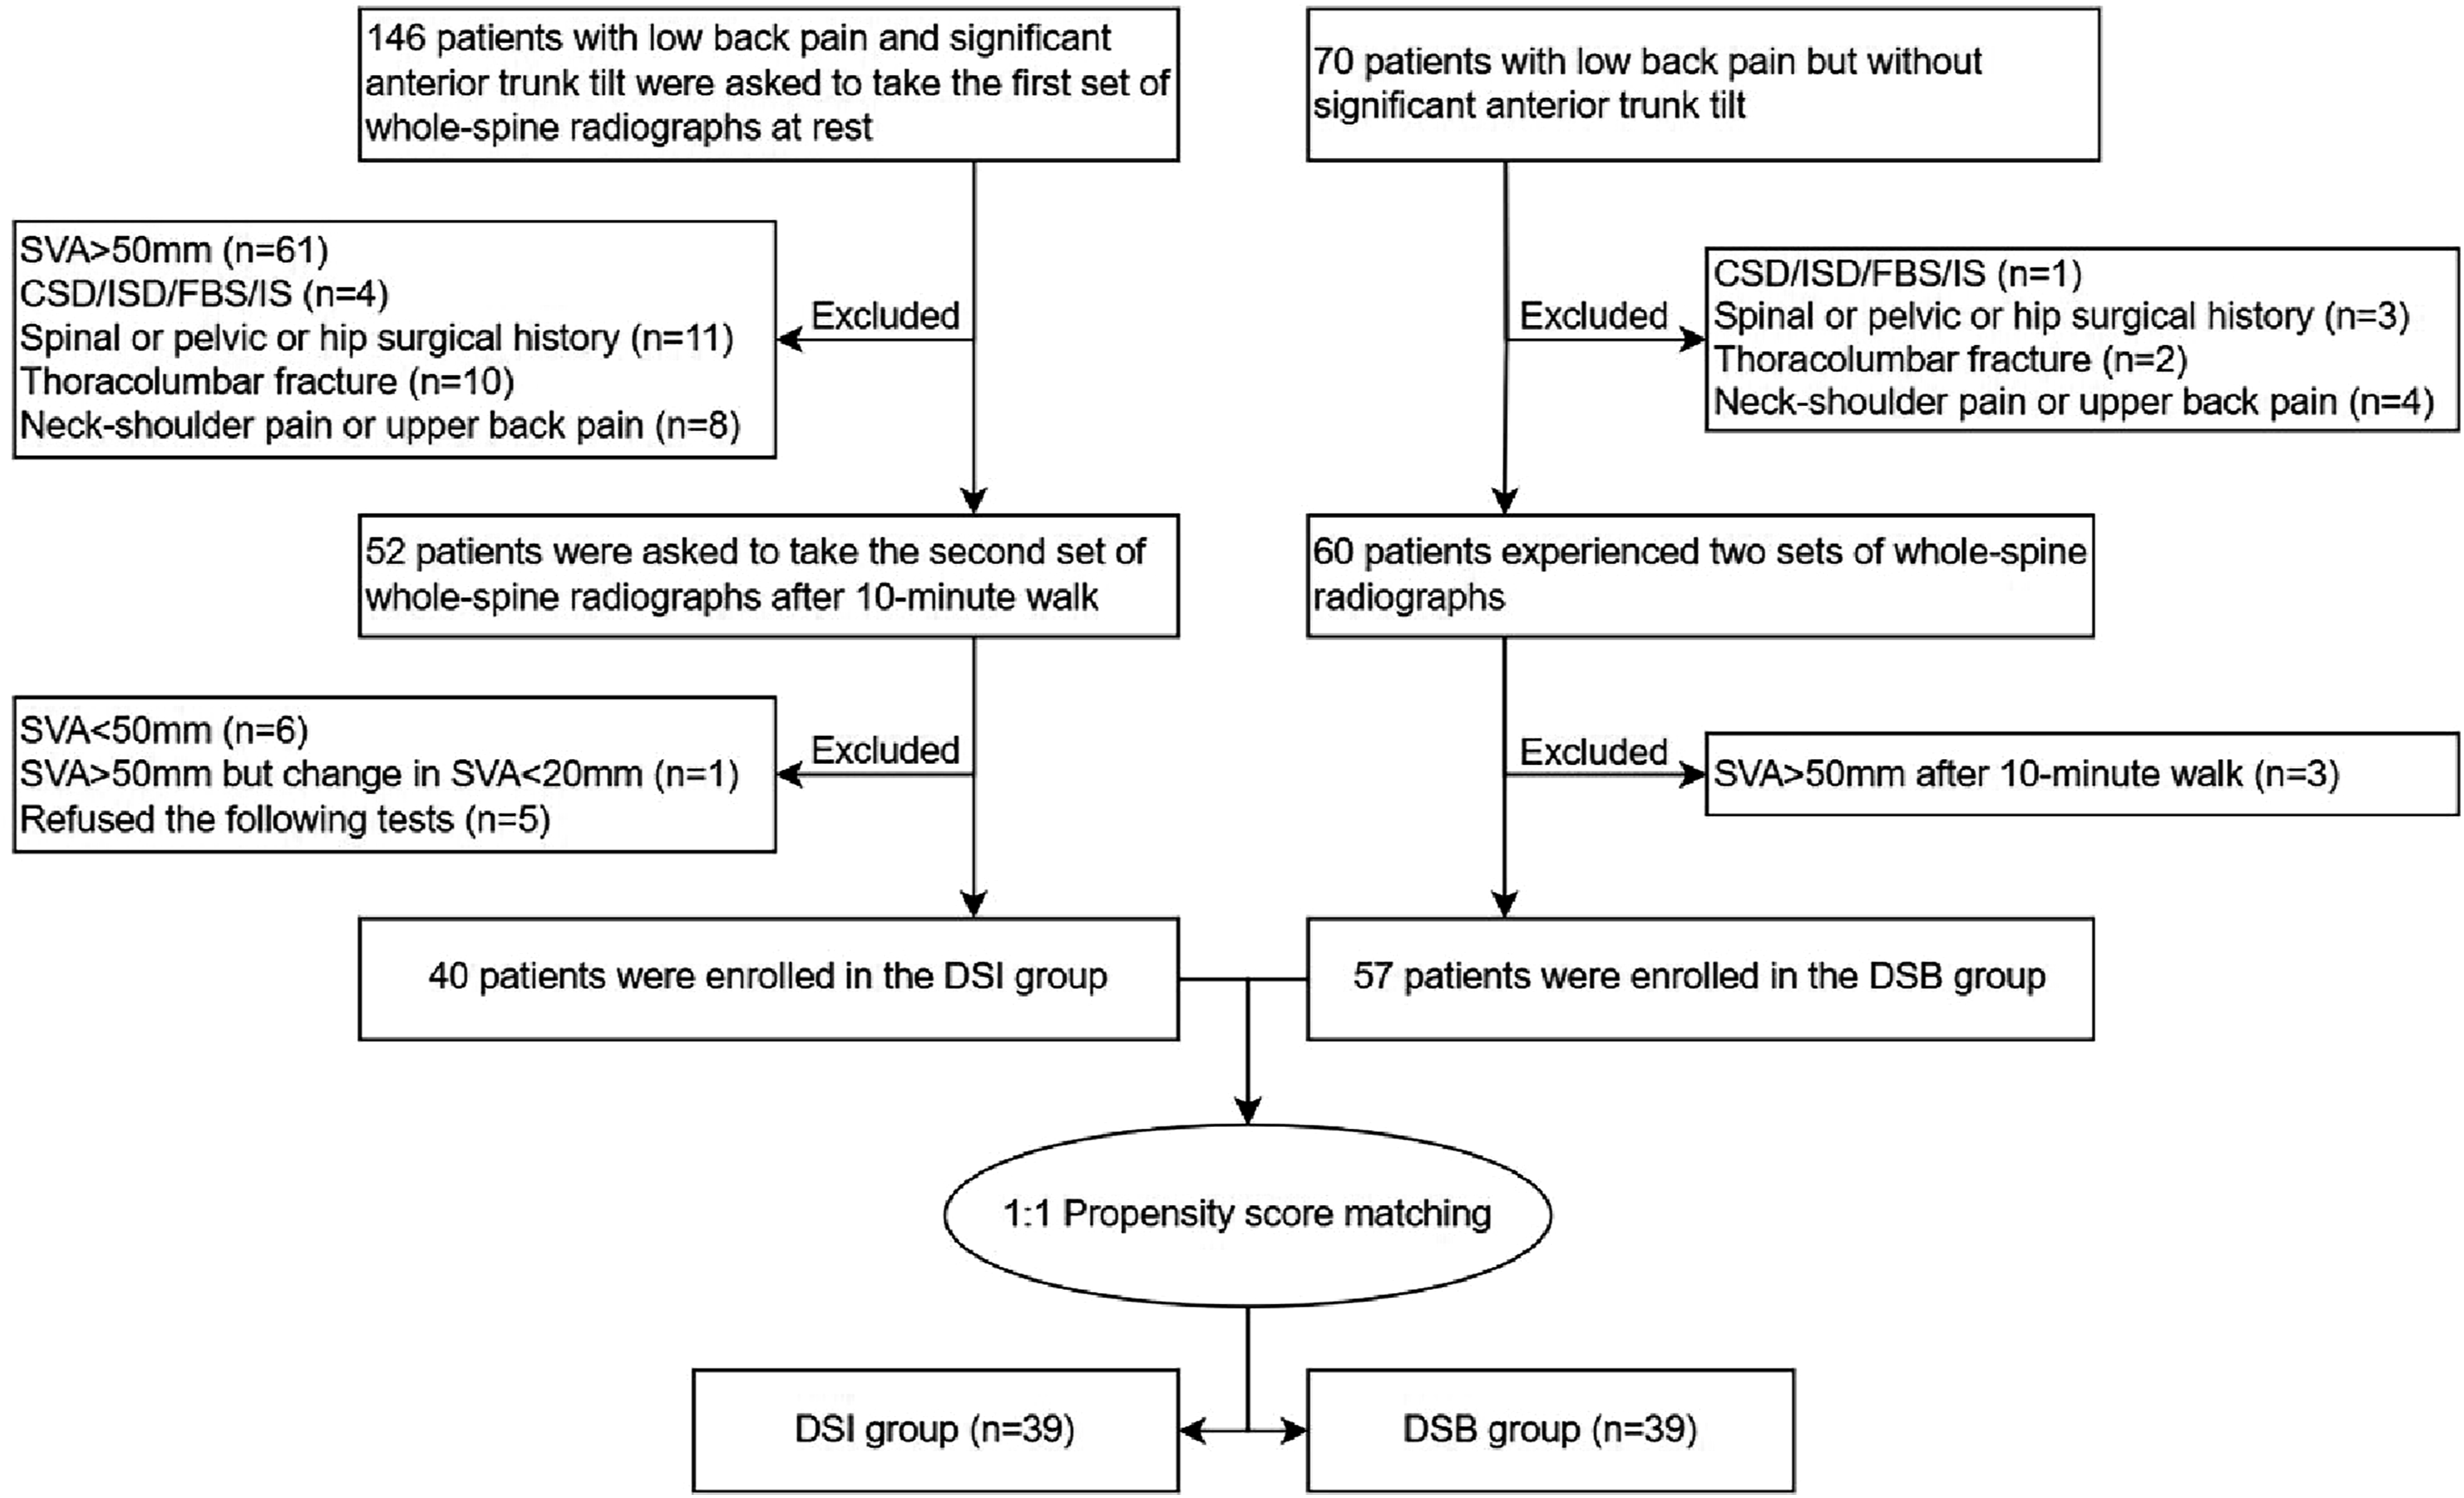
Specifically, after completing the first standing radiograph, Participants with sagittal vertical axis (SVA) greater than 50 mm were immediately asked to walk in the hallway for 10 min, during which they could not sit down or rest. Immediately after the 10-min walk, the repeat radiograph was obtained. A spine surgeon blinded to the participants supervised the walking process. Subsequently, participants with an SVA less than 50 mm, or although the SVA was greater than 50 mm, the change in SVA before and after walking was less than 20 mm, were categorized as the DSB group. Participants with an SVA greater than 50 mm and a change in SVA greater than 20 mm were categorized as the DSI group. Figure 1(A) illustrated the representative whole-spine radiographs for the DSB group, whereas Figure 1(B) depicted the corresponding image for the DSI group. The flowchart of grouping was shown in Figure 2. Representative Whole-Spine Radiographs of the DSB (A) and DSI Groups (B) Flowchart of Participants Enrollment and Grouping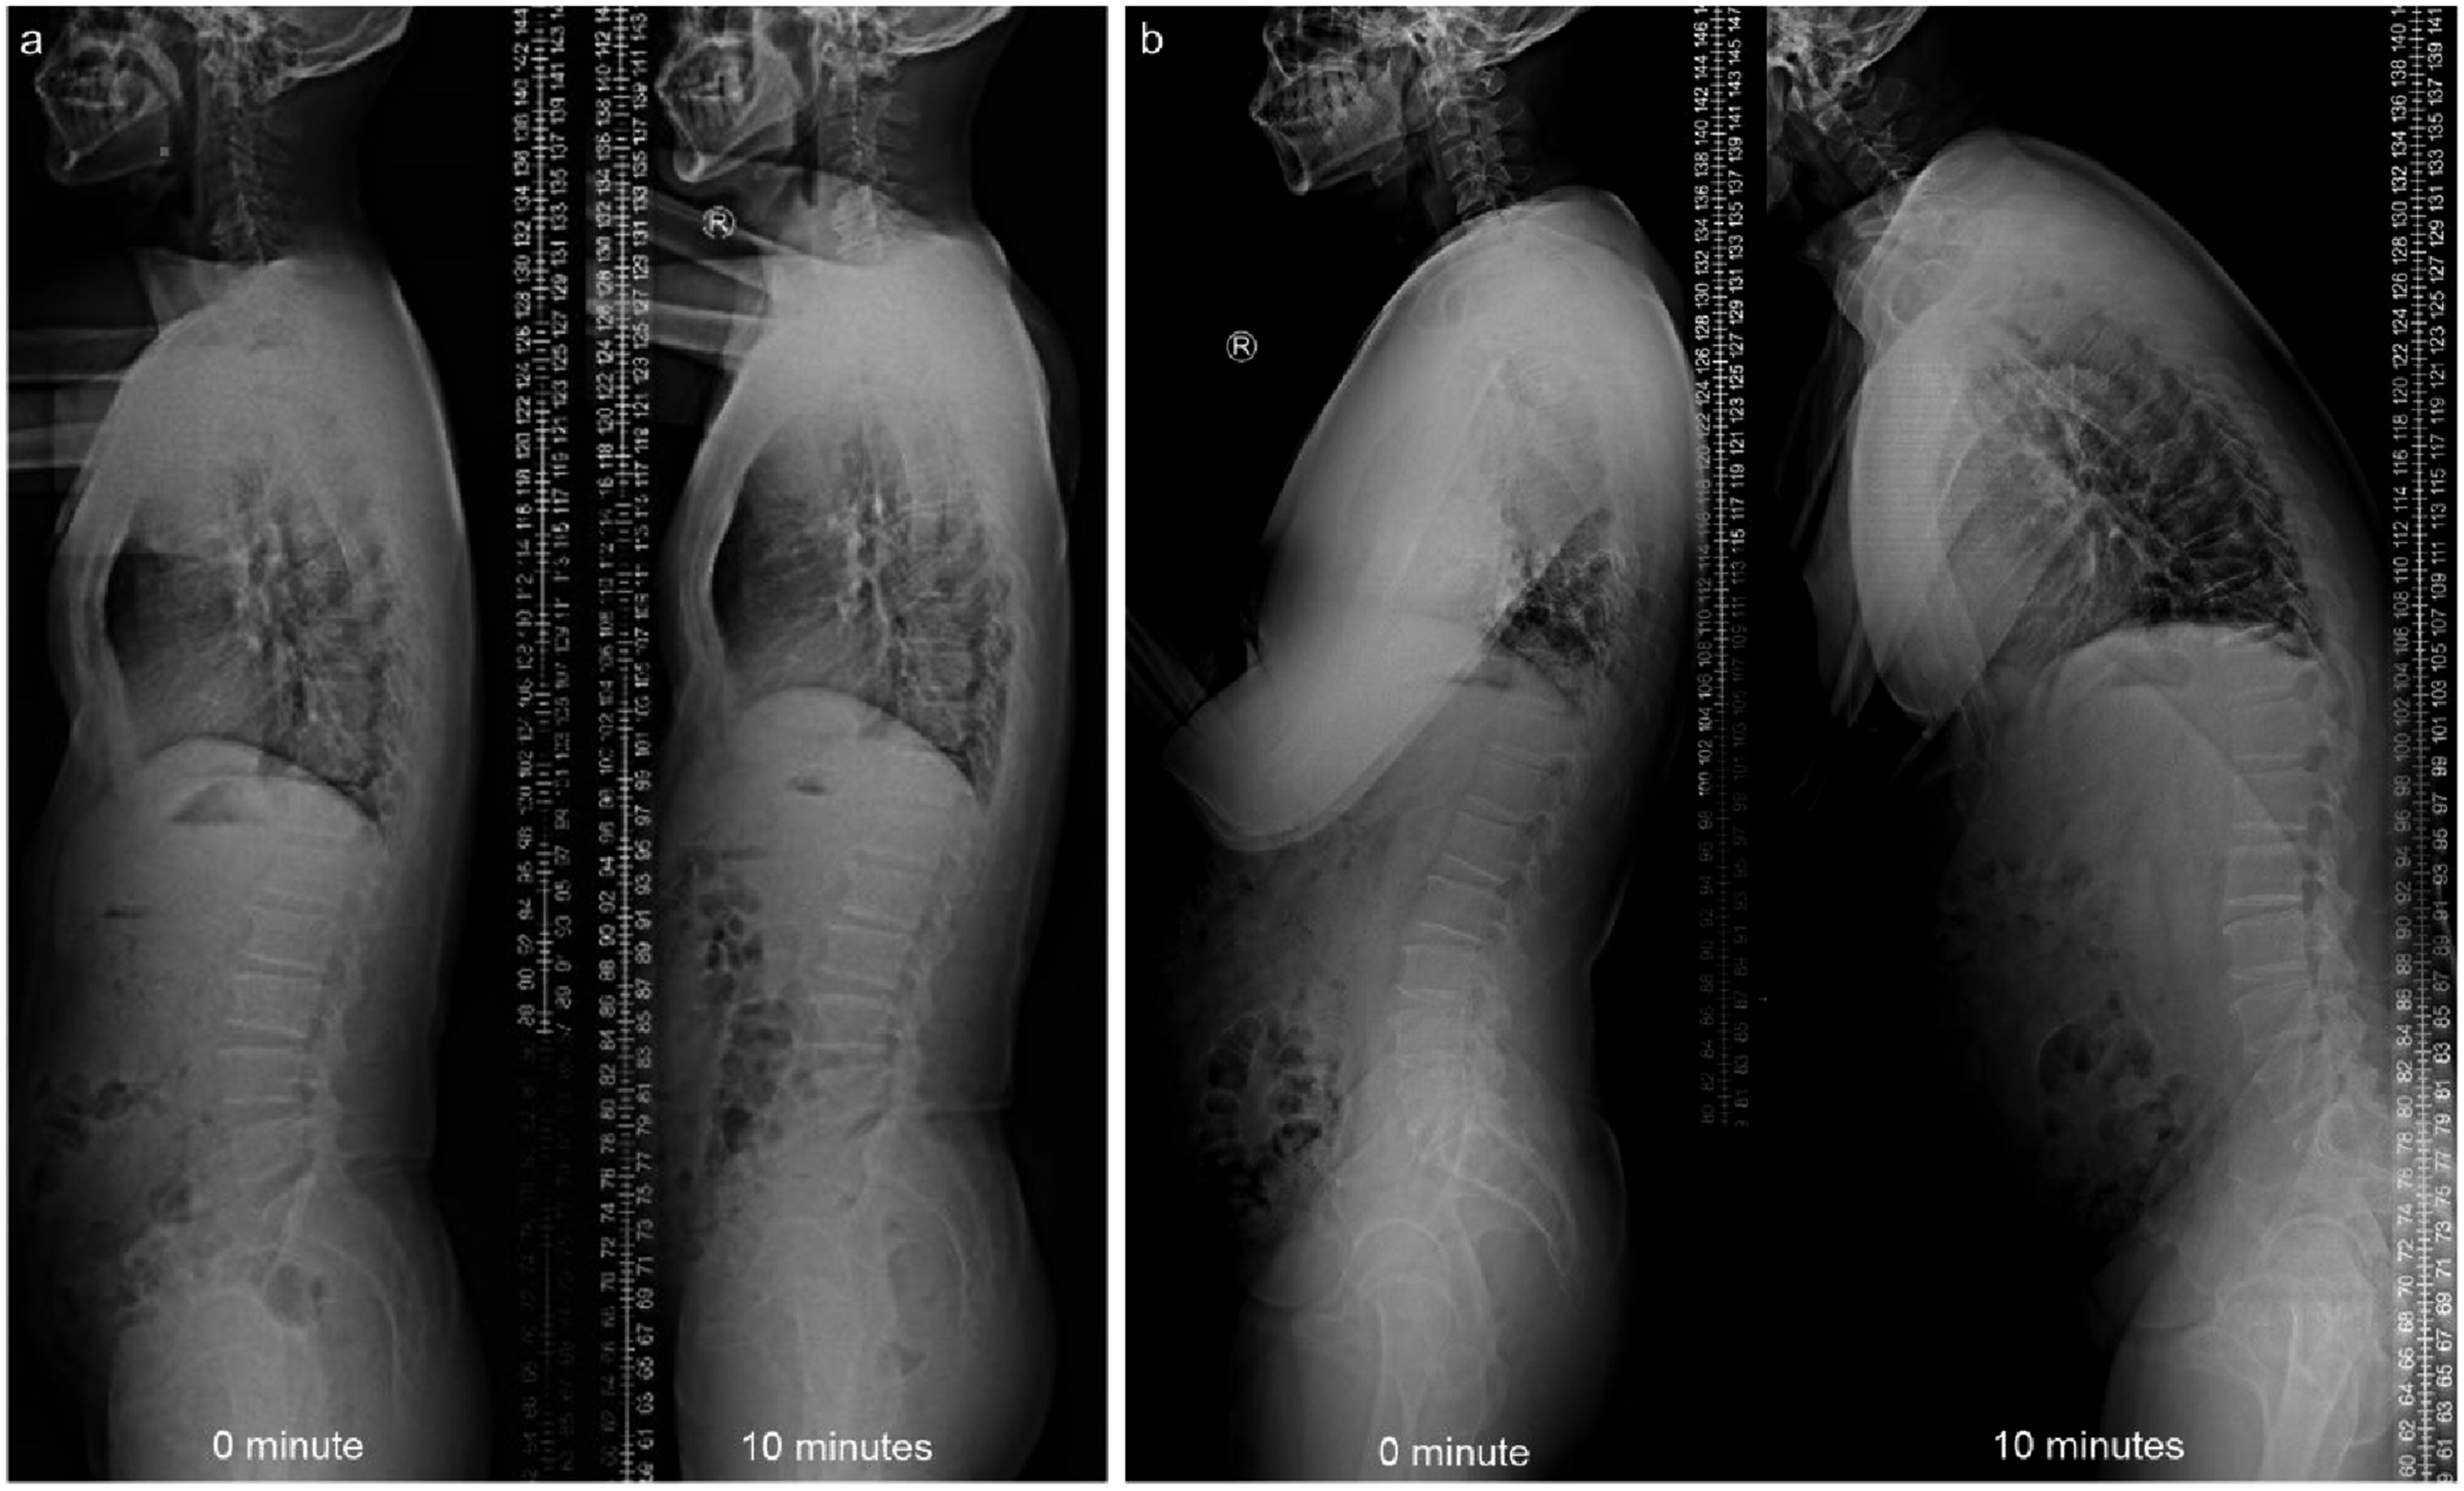
Spinopelvic Parameter Measurement
Participants were required to stand with arms forward, maintaining horizontal gaze. Analyses were performed on preoperative full length, 36-inch exposure radiographs of the spine that extended from the base of the skull to the proximal femur in the anterior-posterior and lateral planes. 13 Considering that spinal balance is influenced by both spinal compensation and pelvic compensation, radiographic parameters measured in the Picture Archiving and Communication System (PACS) included: SVA (sagittal vertical axis, the distance between the C7 plumb line and posterior superior corner on the top margin of S1), TK (thoracic kyphosis, the angle between the superior endplate of T3 and the inferior endplate of T12), LL (lumbar lordosis, the angle between the superior endplate of L1 and the superior endplate of S1), PT (pelvic tilt, the angle between the vertical and the line through the midpoint of the sacral plate to the femoral heads axis) and SS (sacral slope, the angle between the horizontal and the sacral plate). 14 All parameter measurements were performed by two spine surgeons who were blinded to the participants.
Surface Electromyography Measurements
Following recommendations of the SENIAM, 15 wireless surface electrodes were attached to the skin after the skin was shaved and cleaned using alcohol cotton to reduce skin resistance. A telemetric EMG system (Cometa WaveX EMG, Via Gran Sasso, Italy) was used to record sEMG signals. We chose the following muscles for assessment: ES, level L1, 2 cm on either side of the midline of the spinous process of the L1 lumbar vertebra; ES, level L4, 2 cm on either side of the midline of the spinous process of the L4 lumbar vertebra16,17; LM, 2 cm lateral to L5-S1 spinous process 11 ; and Gmax, halfway on the line joining the iliac crest to the trochanter of the femur. 18 Pairs of surface electrodes were attached to the skin above aforementioned muscles and consistent with the direction of the muscle fibers. The placements were performed upon palpation by one spine surgeon and one rehabilitation technologist. Participants walked back and forth on a 10-meter flat surface independently at natural speed and cadence. The EMG signals were recorded after walking was stabilized, and then the participant was allowed to continue walking for 10 min before the EMG signals were recorded again. The original sEMG signals were processed and analyzed by EMG works Analysis (EMG and motion tools software 8.0, Via Gran Sasso, Italy). The raw EMG signals were analogue-to-digitally converted and amplified by a factor of 1000, with a common mode rejection rate of >80 dB, bandpass filtered 20-400 Hz, and transmitted wirelessly to a receiver before digital-analogue conversion. The starting and ending points of each movement task were segmented and identified with the kinematic data collected synchronously by the EMG and motion tools software; incorporating smoothed data trials for each motion phase. During later offline analysis, all EMG signals were high-pass filtered using a 20 Hz cut-off frequency, and subsequently smoothed by a symmetrical moving root-mean-square filter with a 30 ms time epoch. The root mean square (RMS) was used to observe muscular activity and median frequency slope (MFs) was used to observe the muscle fatigue.19,20
Statistical Analysis
All statistical analysis were performed by SPSS (version 26, IBM, Armonk, New York). Continuous variables with a normal distribution are described as mean and standard deviation, while non-normally distributed variables are presented as median and interquartile range. Continuous variables between the DSI and DSB groups were analyzed using the Student’s t test or Mann-Whitney test depending on their adherence to normal distribution. Comparisons between individual pre-walking and post-walking variables were assessed by using the paired t-test or paired samples Wilcoxon signed-rank test, as appropriate. Categorical variables were recorded as frequency and proportion, and were compared between the groups by the Chi-square test. In this study, propensity score matching (PSM) was employed to match participants from the DSI and DSB groups, thereby to reducing bias in selection and enhancing estimation of group differences by balancing observed covariates simultaneously. 21 On the basis of age, sex, body mass index (BMI) and bone mineral density (BMD), the propensity score was computed using logistic regression. The matching algorithm was 1:1, with nearest neighbor matching technique, match tolerance of 0.04, and without replacement. The alpha level of significance was set at 0.05.
Results
The Demographic Data of the DSI Group and DSB Group before PSM
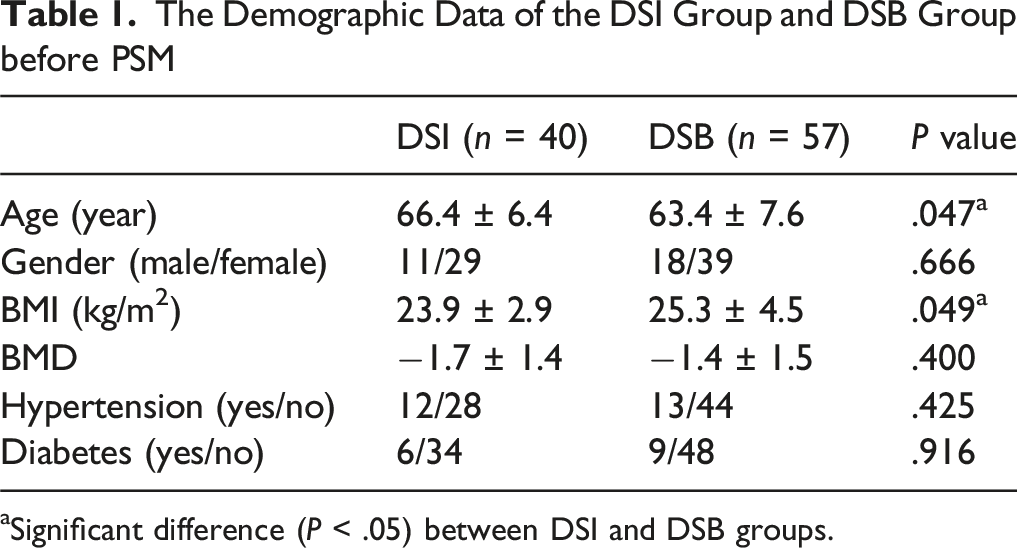
aSignificant difference (P < .05) between DSI and DSB groups.
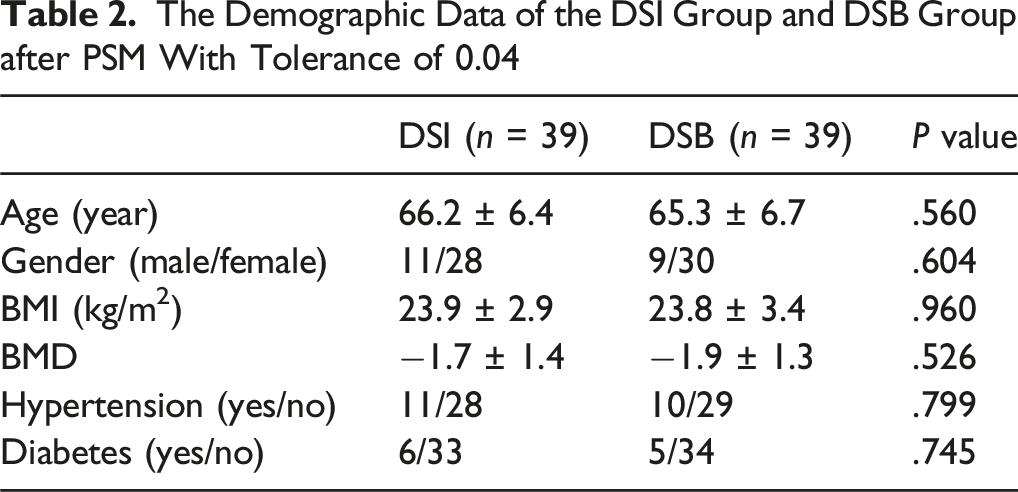
The Demographic Data of the DSI Group and DSB Group after PSM With Tolerance of 0.04
Comparison Between Spinopelvic Parameters of Initial Standing versus 10 min after Walking in the DSI and DSB Groups
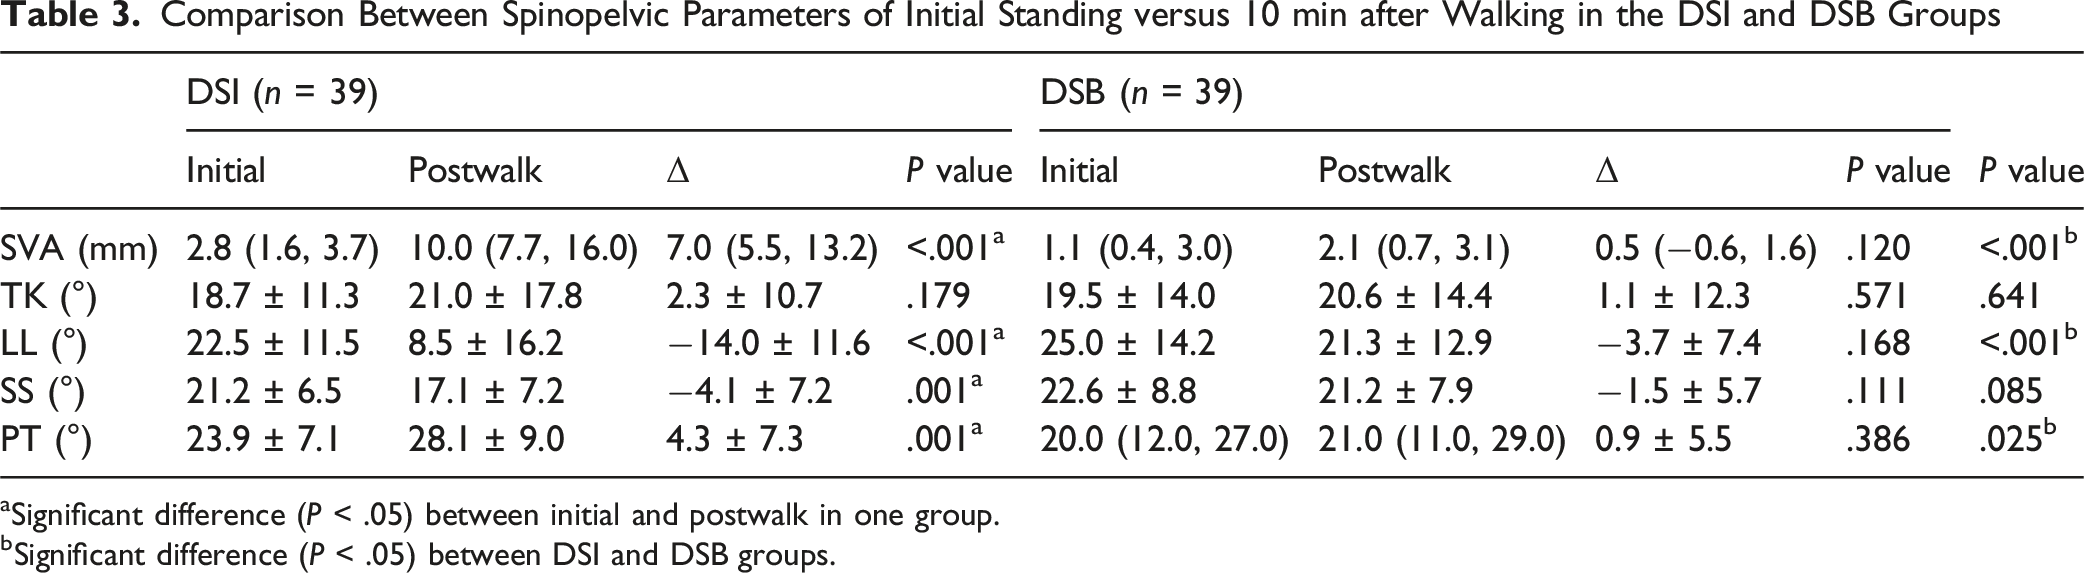
aSignificant difference (P < .05) between initial and postwalk in one group.
bSignificant difference (P < .05) between DSI and DSB groups.
Comparison of RMS Change in the DSI and DSB Groups
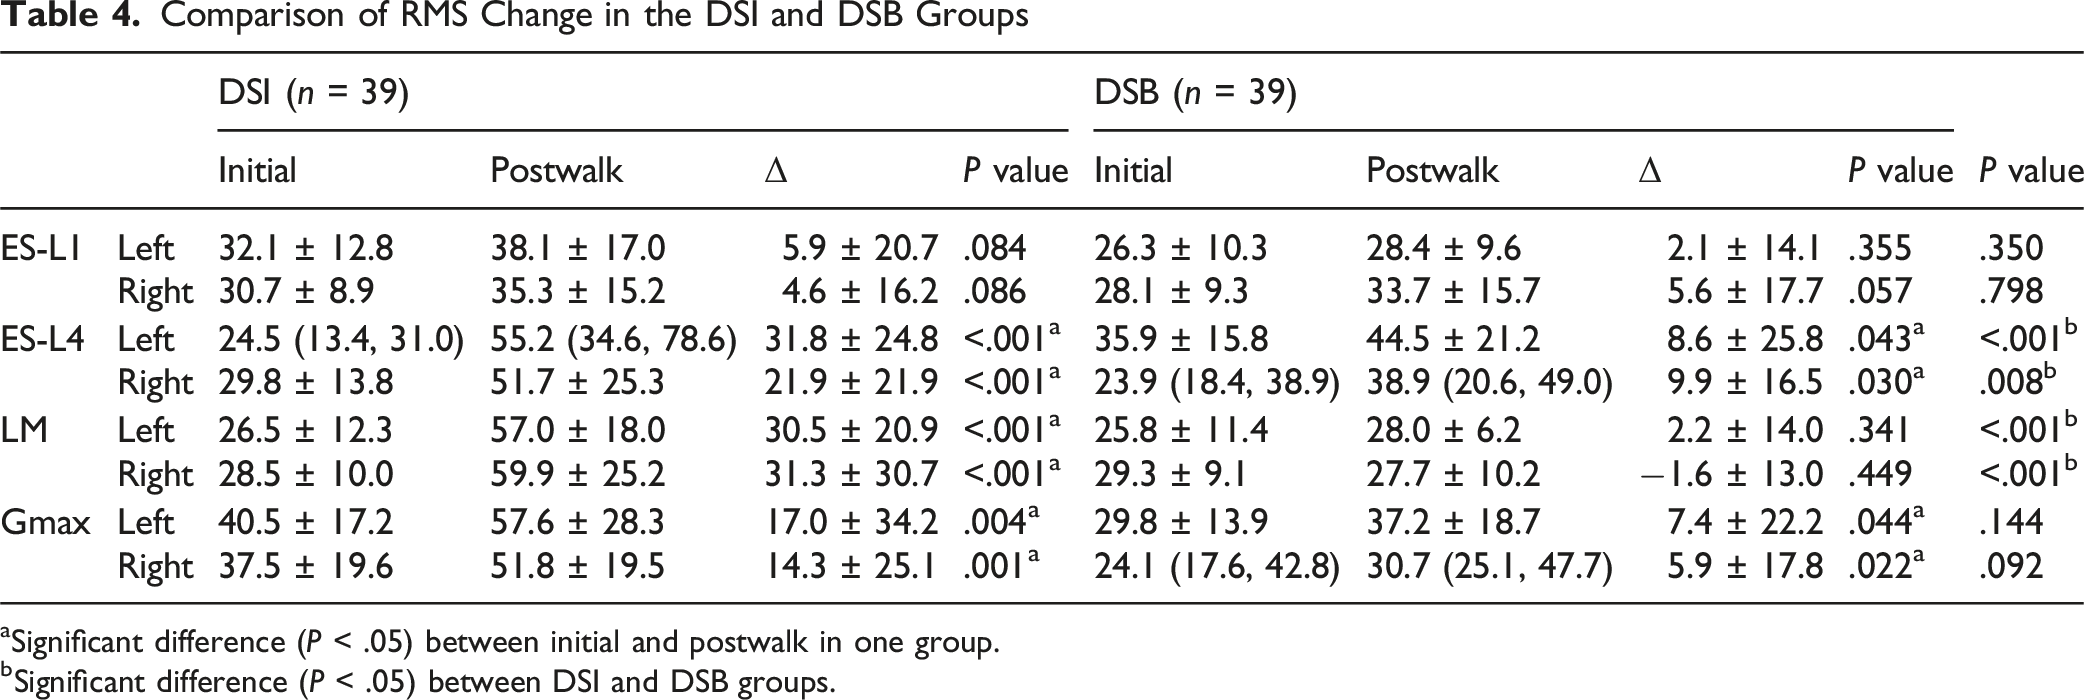
aSignificant difference (P < .05) between initial and postwalk in one group.
bSignificant difference (P < .05) between DSI and DSB groups.
Comparison of MFs Change in the DSI and DSB Groups
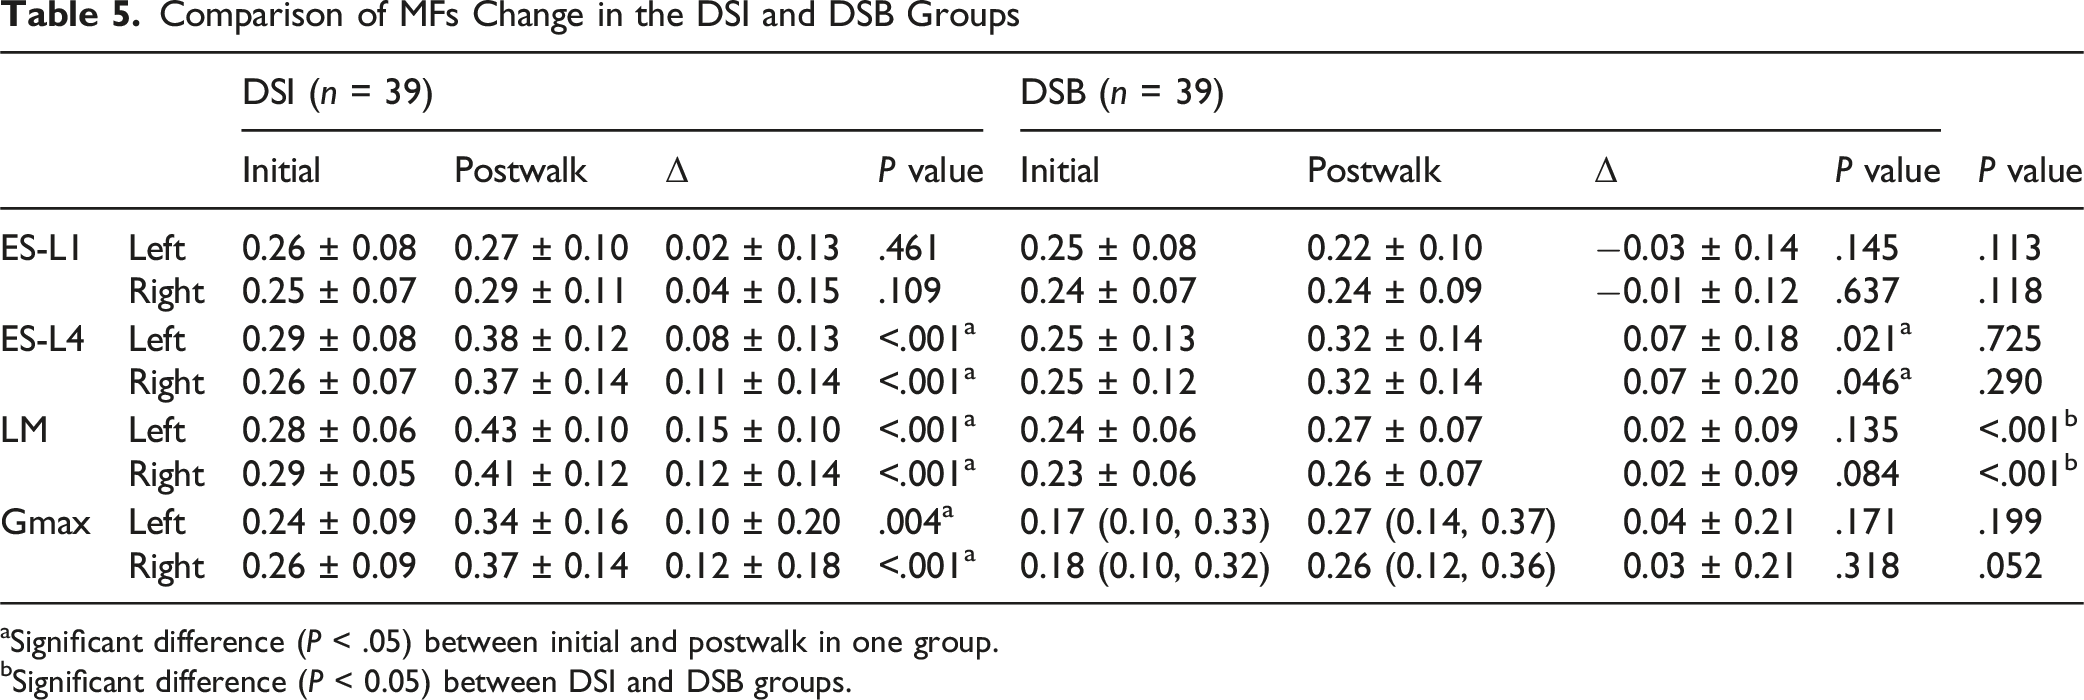
aSignificant difference (P < .05) between initial and postwalk in one group.
bSignificant difference (P < 0.05) between DSI and DSB groups.
Discussion
Lumbar stabilizing muscles, acting as a tension band at the posterior aspect of the spine, play a crucial role in correcting posture, stabilizing the spine, and distributing mechanical stress by mobilizing the forces of the posterior musculature. 3 Maintaining this upright posture required energy expenditure. While patients may achieve sagittal balance when stationary, prolonged walking can lead to muscle fatigue, revealing underlying imbalances. Thus, comparing X-rays before and after a 10-min walk provided a straightforward and reproducible method to assess these changes.3,22
This study demonstrated that, after walking for 10 min, participants in the DSI group showed increased C7PL and PT, while LL decreased, with TK remaining relatively unchanged. This suggested that the body had activated compensatory mechanisms to adjust the hinge positions of the lower lumbar spine and pelvis to maintain trunk balance, rather than relying on the structural integrity of the thoracolumbar spine, in an attempt to keep the center of gravity within the “economic cone”. 23 However, the compensatory capacity was insufficient to sustain balance. Additionally, compared to participants in the DSB group, the changes in PT and LL in the DSI group were significantly more pronounced before and after walking, further supporting this assumption.
Skeletal muscle fibers are categorized into Type I (slow twitch and relatively high fatigue resistance) and Type II (fast twitch and relatively low fatigue resistance), differing in contraction speed and fatigue resistance.24,25 sEMG allows for dynamic assessment of muscle activity, revealing changes in fiber composition that traditional imaging cannot capture. RMS, a time-domain indicator in sEMG, was positively correlated with the proportion of Type II fibers, while MFs, a frequency domain indicator, was closely associated with the proportion of Type I fibers. Yuan et al. 26 measured the electrical activity of paraspinal muscles in women with chronic LBP compared to healthy controls using sEMG. Their results indicated that the LM in women with LBP exhibited rapid excitation with significantly higher RMS values than those of healthy women. Asada et al. 27 found that patients with sagittal imbalance displayed significant fat infiltration and a reduction in the proportion of Type I fibers in the paraspinal muscles, leading to decreased recruitment capacity and ultimately a loss of fatigue resistance in these muscles. In this study, participants in the DSI group showed significantly increased activity in the ES-L4, LM, and Gmax after a 10-min walk, along with evident muscle fatigue, consistent with findings from previous studies. However, it was pleasantly noted that in the DSB group, although there were changes in the activity of ES-L4 and LM, the activation level and fatigue indicators of LM did not show significant alterations. Furthermore, intergroup comparisons revealed that, compared to the DSB group, the DSI group exhibited significant changes in the activation levels of ES-L4 and LM, as well as in the fatigue levels of LM during the transition from sagittal balance to imbalance. Therefore, while ES, LM, and Gmax demonstrated varying degrees of change, the key differences between the DSI and DSB groups primarily manifested in the ES and LM, particularly in the LM.
The ES and LM were the crucial contributors to spinal extension. The ES, located superficially and lateral to the LM, generated significant force during contraction. Weakness of ES had been associated with thoracic kyphosis, emphasizing its vital role in maintaining spinal stability. 28 Strengthening exercises for the ES had been shown to markedly improve sagittal spinal balance. 29 The LM, situated deeper and tightly adhered to the vertebrae with numerous attachment points, worked synergistically with the ES. Moser et al. 30 found a strong correlation between LM atrophy and increased LL, highlighting its key role in spinal stability. Additionally, LM dysfunction had been closely linked to the development of chronic LBP. 7 The influence of the Gmax was also significant. Research indicated that Gmax weakness contributed to anterior pelvic tilt and LBP, and Gmax strengthening improved spinal posture. 31 ES and lumbar multifidus LM contraction enables the spine to extend posteriorly, thereby indicating the critical role of ES and LM in maintaining spinal stability. A robust ES and LM have the capacity to augment compensatory capacity for spinal sagittal balance. Furthermore, a strong Gmax has been demonstrated to attenuate anterior pelvic tilt and mitigate low back pain. These findings demonstrated that the condition of the ES, LM, and Gmax directly impacted sagittal spinal balance, and targeted strengthening of these muscles could improve spinal stability and mitigate associated clinical symptoms. However, there had been limited research on changes in lumbar stabilizing muscles in patients with DSI. This study filled that gap by further exploring the specific contributions of lumbar stabilizing muscles to DSI.
Previous studies on changes in paraspinal muscles in DSI patients have primarily used lumbar MRI for observation, employing imaging parameters to assess paraspinal muscle function. This method can objectively reflect muscle condition using parameters such as muscle cross-sectional area and fat infiltration rate, making it an important approach for evaluating paraspinal muscle function. This study explores changes in lumbar paraspinal muscles in DSI patients from an electromyographic perspective. In future, we intend to combine imaging and pathological assessment methods to examine changes in the lumbar paraspinal muscles of DSI patients from multiple angles.
Overall, the study innovatively proposed that muscle degeneration in patients with DSI may follow a pattern of progression from deeper to more superficial layers and from distal to proximal regions. Furthermore, the condition of the LM was likely the most critical factor contributing to sagittal imbalance in DSI patients. This study was limited by its descriptive nature, which does not establish causal relationships or comprehensively evaluate thoracic paraspinal muscles due to lack of routine thoracic MRI scans. The relatively small sample size and single-center design also restrict generalizability.
Conclusion
This study highlights the significant role of lumbar stabilizing muscle overactivation and fatigue in DSI, with particular emphasis on the LM as the most pivotal factor. These findings provide a novel perspective on the pathophysiological mechanisms of sagittal imbalance and introduce new clinically relevant parameters. In future, we intend to combine imaging and pathological assessment methods to examine changes in the lumbar paraspinal muscles of DSI patients from multiple angles.
Footnotes
Funding
The authors disclosed receipt of the following financial support for the research, authorship, and/or publication of this article: This study was funded by the National Natural Science Foundation of China (82030069, 82472427), the National Key Research and Development Program of China (No. 2022YFA1205004).
Declaration of Conflicting Interests
The authors declared no potential conflicts of interest with respect to the research, authorship, and/or publication of this article.
Data Availability Statement
The data that support the findings of this study are not openly available due to reasons of sensitivity and are available from the corresponding author upon reasonable request.