
Abstract
Study design
Systematic Review.
Objectives
Cervical total disc arthroplasty (CTDA) remains an alternative to anterior cervical discectomy and fusion (ACDF) in select patients with cervical radiculopathy or myelopathy secondary to degenerative disc disease. Studies comparing CTDA to ACDF often have conflicting conclusions and varying quality. The purpose of this study was to utilize the fragility index (FI) to assess the robustness of randomized controlled trials (RCT) comparing CTDA to ACDF.
Methods
A systematic review was performed by searching PubMed, Ovid MEDLINE, Web of Science, and Embase for RCTs with 2 parallel study arms and 1:1 allocation of subjects investigating CTDA vs ACDF with at least 1 statistically significant, dichotomous outcome. The FI was calculated by individually shifting 1 patient from the event group to the non-event group with re-calculation of Fisher’s Exact test until the reported P value was no longer statistically significant (P > 0.05).
Results
The search identified 934 abstracts with 19 RCTs meeting inclusion criteria. The mean patient sample size was 276.4 (median 209, range 30-541). The number of patients lost to follow-up ranged from 0-229 (mean 69.7, median 45). The mean FI was 4.6 (range 0-30, median 2) with 3 (13.6%) of the studies having an associated FI of 0. Loss to follow up exceeded the fragility index in all but 2 studies.
Conclusion
RCTs comparing ACDF to CTDA are often fragile with only 1-2 patients experiencing an alternative outcome or lost to follow-up to change the studied outcome.
Keywords
Introduction
Anterior cervical discectomy and fusion (ACDF) has long been the mainstay of treatment for cervical radiculopathy or myelopathy in the setting of cervical radiculopathy. 1 More recently, cervical total disc arthroplasty (CTDA) has arisen as an alternative surgical option with the goal of preserving motion in the cervical spine and decreasing rates of adjacent segment disease (ASD). Although there is a substantial volume of literature comparing anterior cervical discectomy and fusion to cervical total disc arthroplasty, questions have arisen regarding the robustness of these studies which often have small sample sizes and inherent difficulties with blinding and follow-up. Given that these randomized controlled trials (RCTs) guide surgical intervention, it is important to verify the robustness or fragility of these RCTs in order to determine the relative degree of influence they should exert over clinical decision making.
The Fragility Index (FI) is a metric which can be utilized to assess study robustness or fragility. 2 The FI is the minimum threshold for the number of subjects required to have an alternative result in order for a significant dichotomous result to lose statistical significance.2-5 Maldonado et al present an illustration of this statistical test. 6 FI can also be divided by sample size to derive the fragility quotient (FQ), which inversely correlates with endpoint robustness. 4 FQ is thought to be more resilient to sample size bias. 6
An FI of 1 means that a change of only 1 event will change the statistical significance of an outcome. As a result, low FIs correlate with poor study robustness and vise-versa. The scale of what constitutes a robust FI does, however, vary throughout medical literature, with high impact medical articles boasting a median FI of 8 compared to a median of 2 associated with most surgical specialties. 4
The fragility index has been utilized across the orthopaedic and neurosurgical literature to probe RCT fragility or robustness. Comparisons have found that spine literature is amongst the least robust pools of data, with 75% of RCTs boasting an FI less than 3, a percentage which is 3 times greater than that of high impact medicine articles.2,4 Checketts et al reviewed studies classified as robust by the AAOS Clinical Practice Guidelines, finding a median FI of 2. 7 Similarly, a median FI of 2 was reported by Muthu et al in an updated systematic review of spine literature in 2021. 8 The purpose of this study was to investigate the FI of RCTs comparing ACDF vs CTDA in order to assess the robustness, or fragility, of these RCTS. It was hypothesized that the majority of studies would be on par with the FI of 2 demonstrated by both Evaniew et al and Muthu et al for previous spine literature with loss to follow-up frequently exceeding the FI.2,4,8
Methods
Study Selection
A systematic review was performed via the Preferred Reporting Items for the Systematic Reviews and Meta-analyses (PRISMA) guidelines, 9 with protocol registration through PROSPERO (ID: CRD42023464590). Search terms included “disc arthroplasty OR spinal arthroplasty OR spine arthroplasty OR cervical arthroplasty OR cervical total disc arthroplasty OR cervical total disc replacement OR cervical disc replacement AND randomized controlled trial OR randomized controlled trial OR randomized controlled trials.” The free-source artificial intelligence (AI) tool Rayyan (https://www.rayyan.ai/) was utilized to screen the PubMed, Ovid Medline, Web of Science, and Embase articles for RCTs with 2 parallel study arms and 1:1 allocation of subjects to treatment or control groups investigating CTDA vs ACDF with at least 1 statistically significant, dichotomous outcome.
Inclusion criteria limited the query to original English-language RCTs with 1:1 allocation of human test subjects to treatment (CTDA) vs control (ACDF) with at least 1 statistically significant (P < 0.05) dichotomous outcome variable. Several of the included studies were iterations of each other with the same initial pool of patients but different follow-up points and associated outcome variables / loss to follow-up. 8 Exclusion criteria included Non-English language, non-randomized trials (eg. case reports, case series, cohorts, cross-sectional studies, observational studies, commentaries, editorials, review articles), and abstracts only. Two independent reviewers (Z.K.B. and K.P.) screened all abstracts for inclusion/exclusion criteria and a third reviewer (S.L.L.) served as the tie-breaker where needed.
Data Extraction
The following data were extracted from articles queried: authors, journal name and impact factor, publication year, funding source, randomization and allocation methods, application of blinding, use of a priori power analysis, total sample size, loss to follow-up, primary outcome, first statistically significant dichotomous outcome variable encountered with its respective P value, the number of respective events for treatment/control group, and loss to follow-up. The Cochrane Risk of Bias tool was utilized by 2 independent reviewers (S.L.L. and Z.K.B.) to evaluate for bias and quality. When necessary, a third reviewer served as a tiebreaker.
Fragility Index Calculation and Statistical Analysis
The FI was calculated per methodology first described by Walsh et al via Fishers Exact test, moving 1 individual from the event to non-event category until the P value becomes non-significant. The FI essentially represents the number of tests required for this to occur. 5 The primary outcome or the first statistically significant dichotomous secondary outcome variable encountered was utilized per study. Calculations were performed utilizing the free-source calculator developed by Kane S.P. (https://clincalc.com/Stats/FragilityIndex.aspx). FIs were reported as whole numbers, with an FI of 1 indicating that a change of only 1 patient was required to convert a significant result to non-significant and FIs of 0 indicating that the original choice of statistical test was improper. 10 The larger the FI, the stronger - or more robust - the result and vice versa. The fragility quotient was derived by dividing FI by sample size.
Summary statistics were used to characterize the included studies sample size, loss to follow-up, FI, and FQ. Correlation between FI and sample size as well as journal impact factor were calculated via Spearman Correlation Coefficient with level of significance set at P < 0.05. Subgroup analysis was performed using correlation analysis. For qualitative variables, −1 and 1 were utilized for analysis. All statistical analysis, beyond FI calculations, was performed within Microsoft Excel (Version 16.37, Microsoft, Redmond, WA, USA).
Results
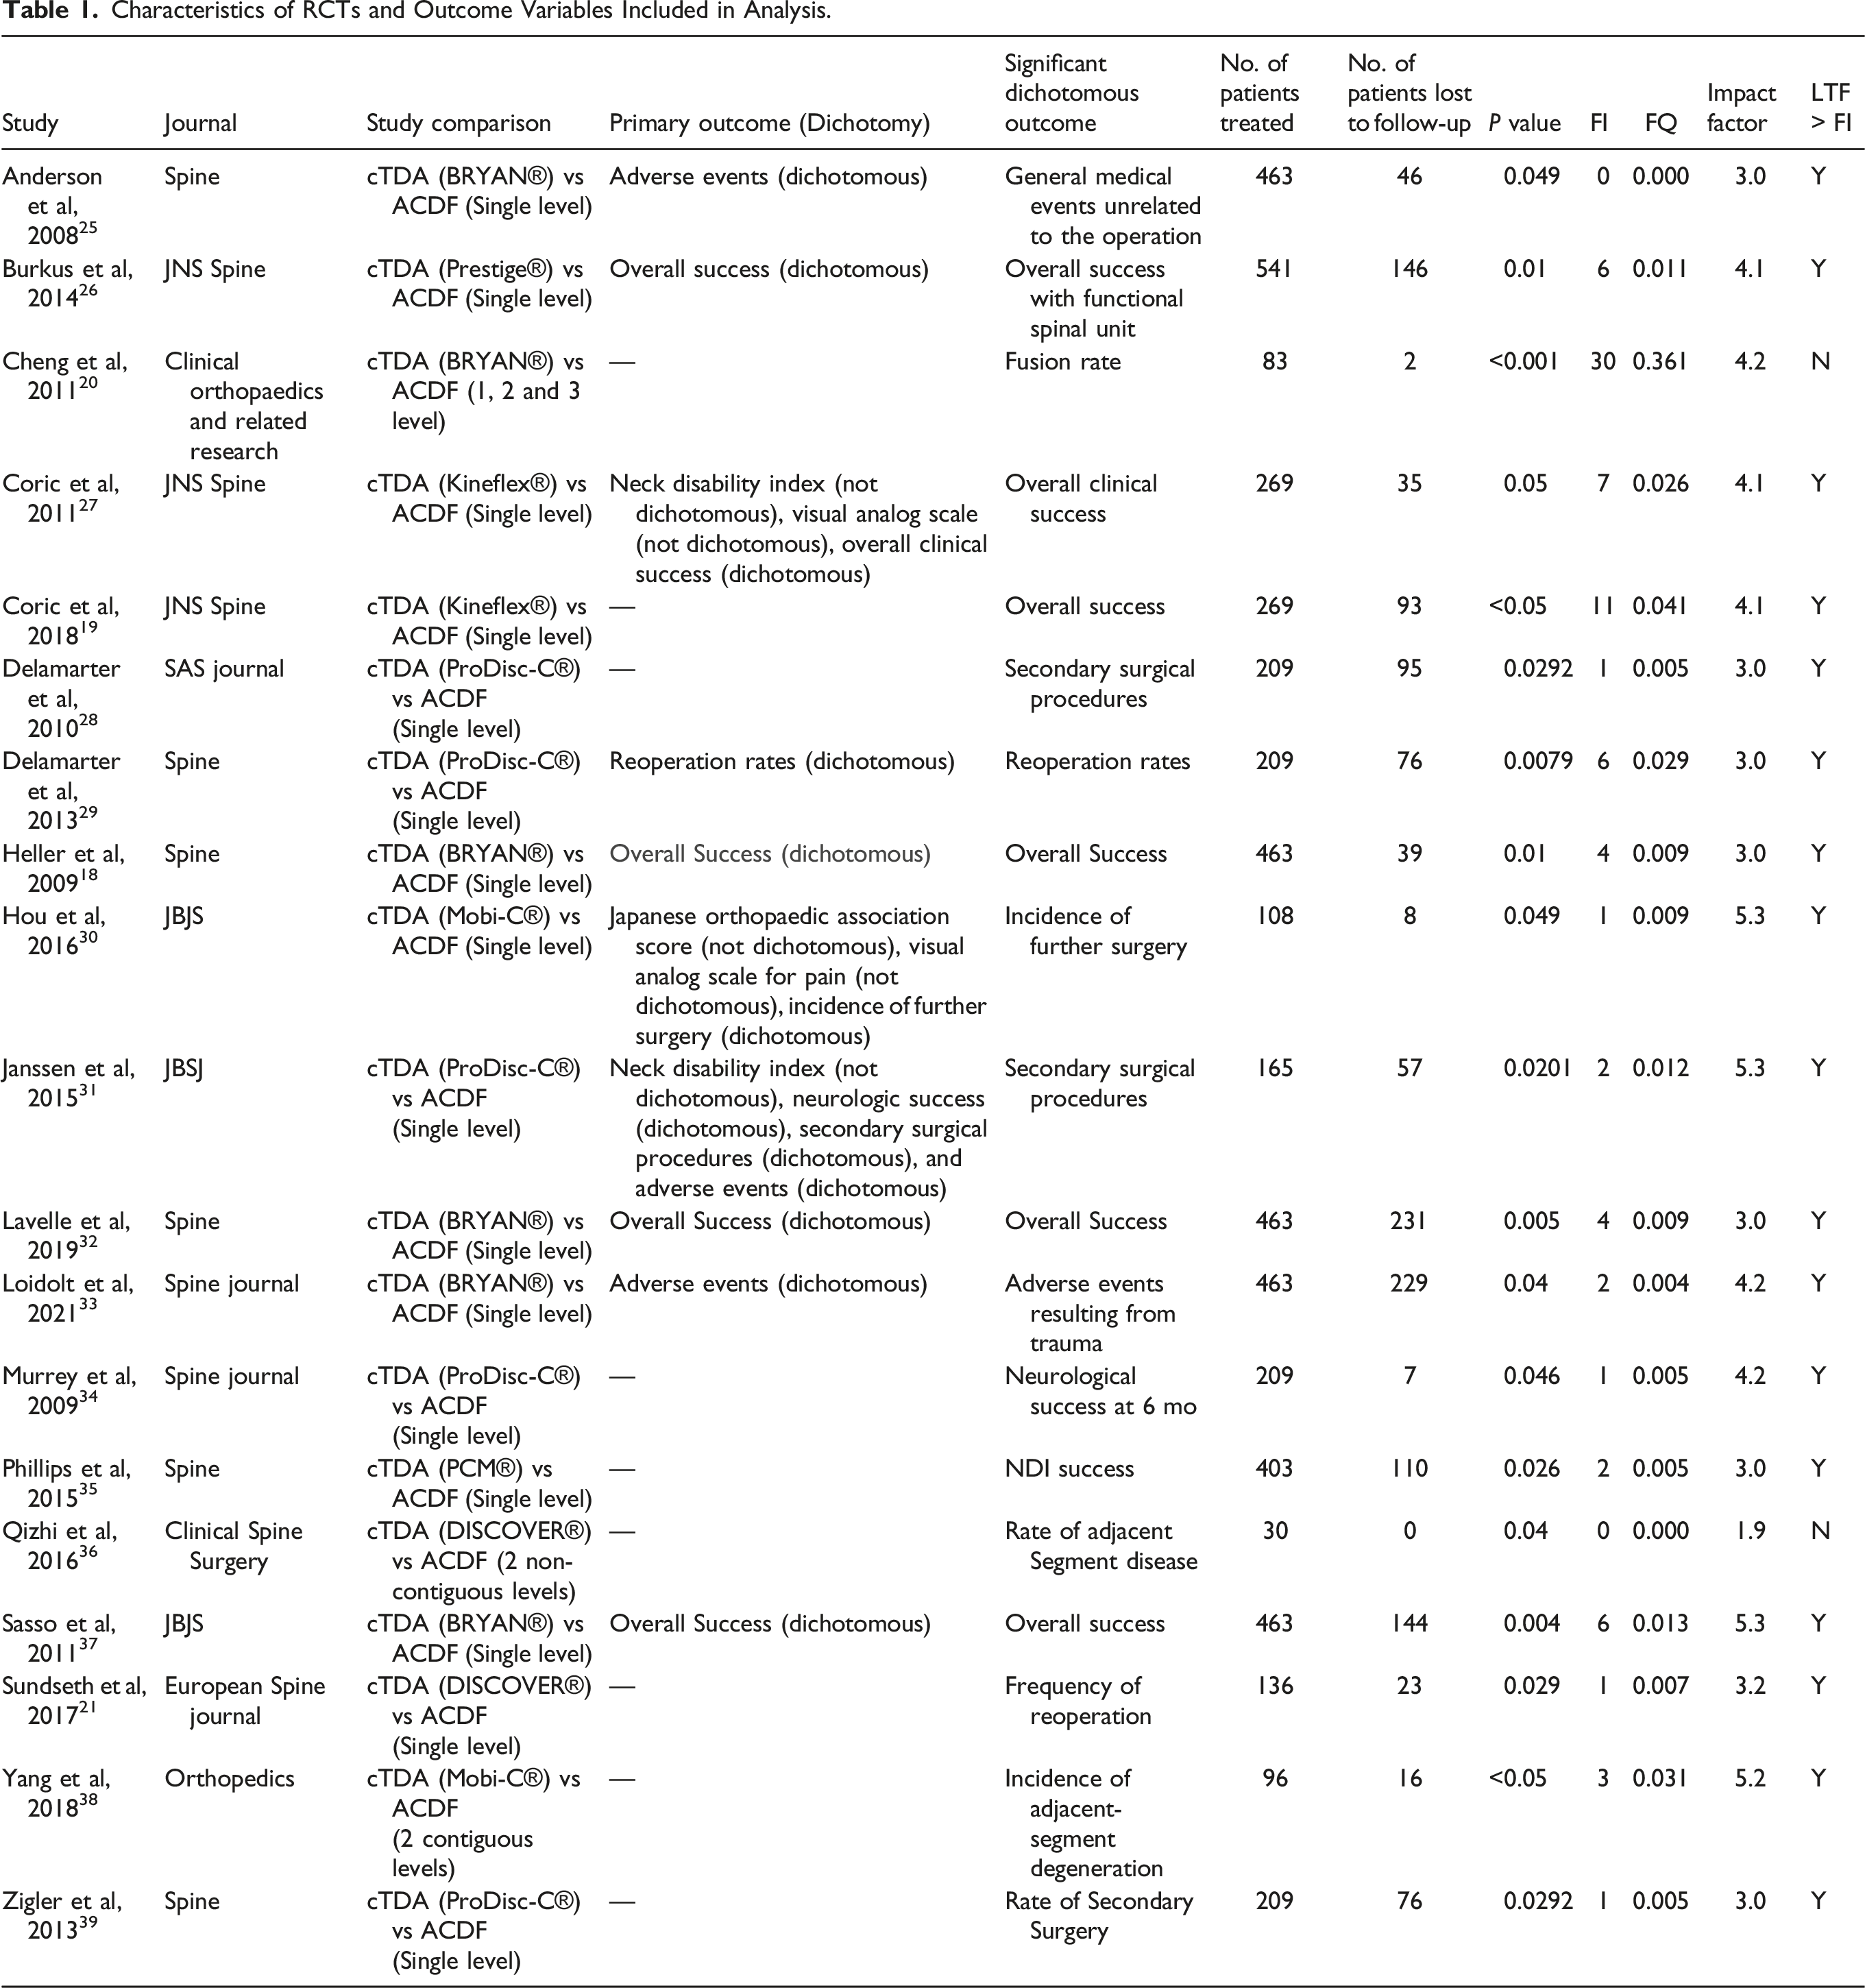
During screening, the search identified 928 abstracts. Of these abstracts, 19 (2.05%) of them were RCTs that met the inclusion criteria (Figure 1). These studies were published between the years of 2008 to 2021. The most frequently cited journal was Spine with 6 articles (31.6%) followed by Journal of Neurosurgery: Spine with 3 articles (13.6%). The majority of articles (n = 16, 84.2%) compared CTDA to ACDF at a single level. The remaining 3 articles compared CTDA to ACDF at either 2 contiguous levels, 2 non-contiguous levels, or up to 3 contiguous levels (Table 1). Preferred reporting items for systemic reviews and meta-analysis (PRISMA) flow diagram for systematic review of literature. Characteristics of RCTs and Outcome Variables Included in Analysis.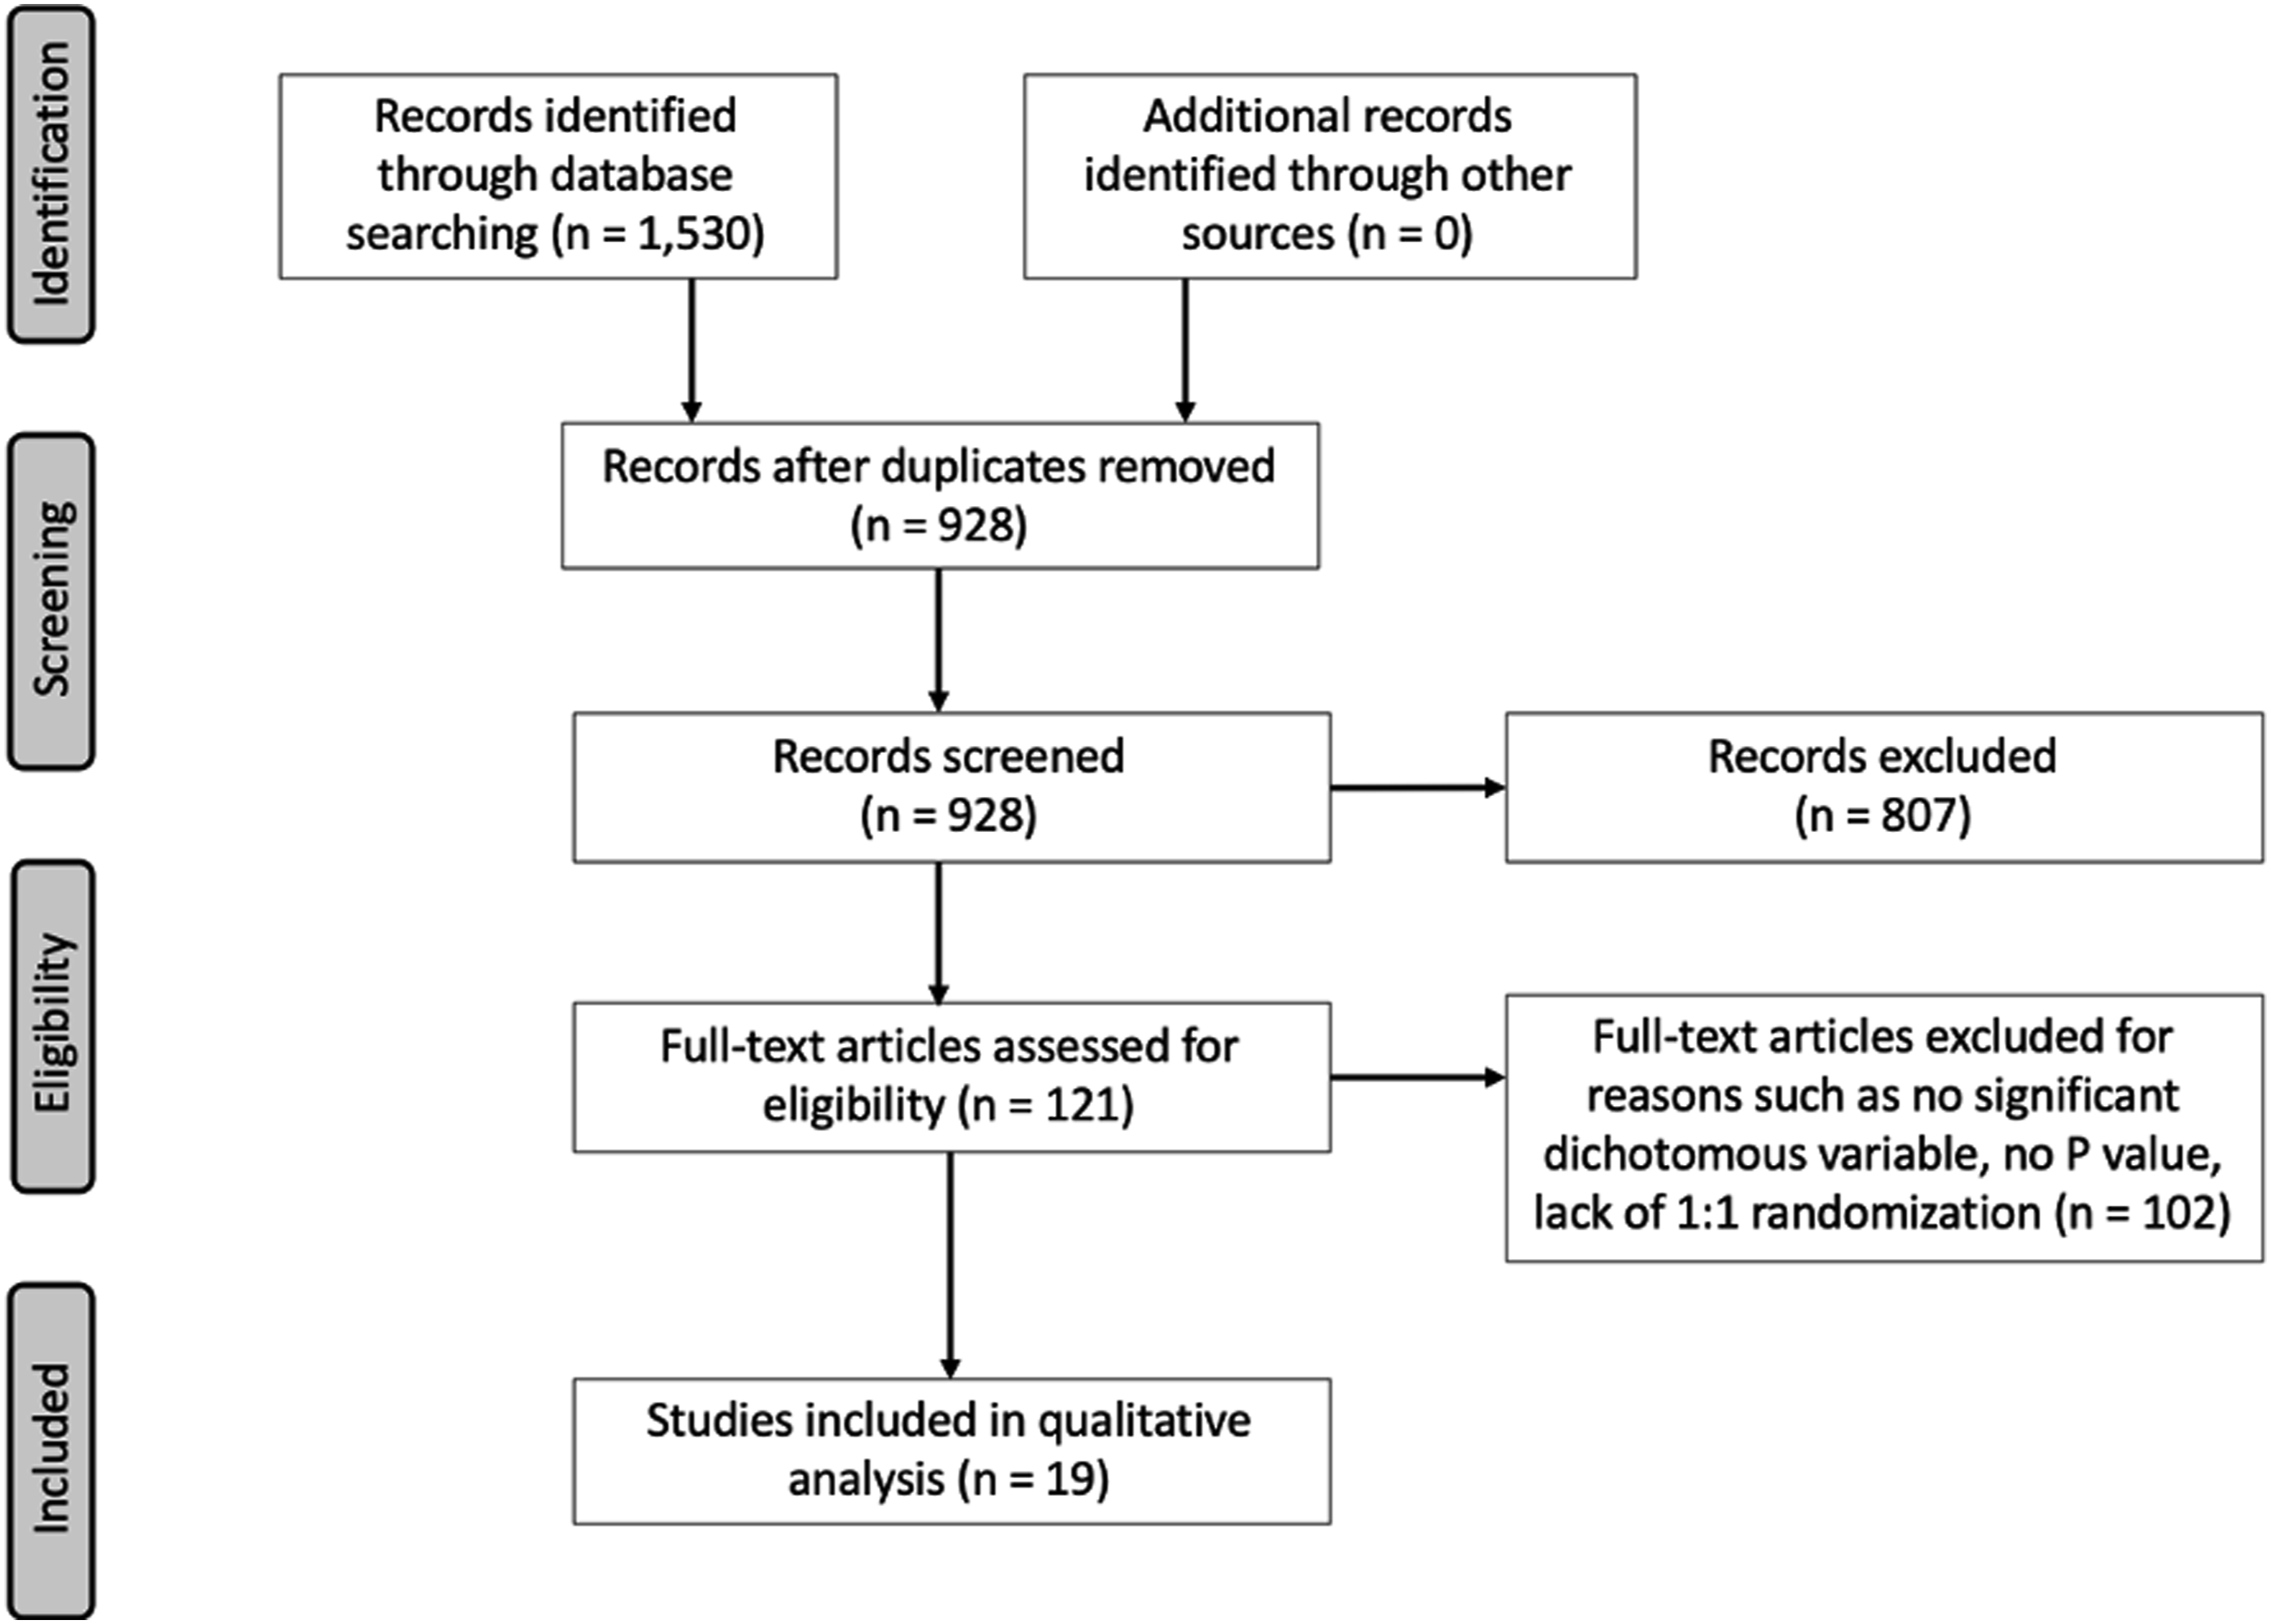
Bias and Quality Assessment Using Cochrane Risk-Of-Bias Tool.
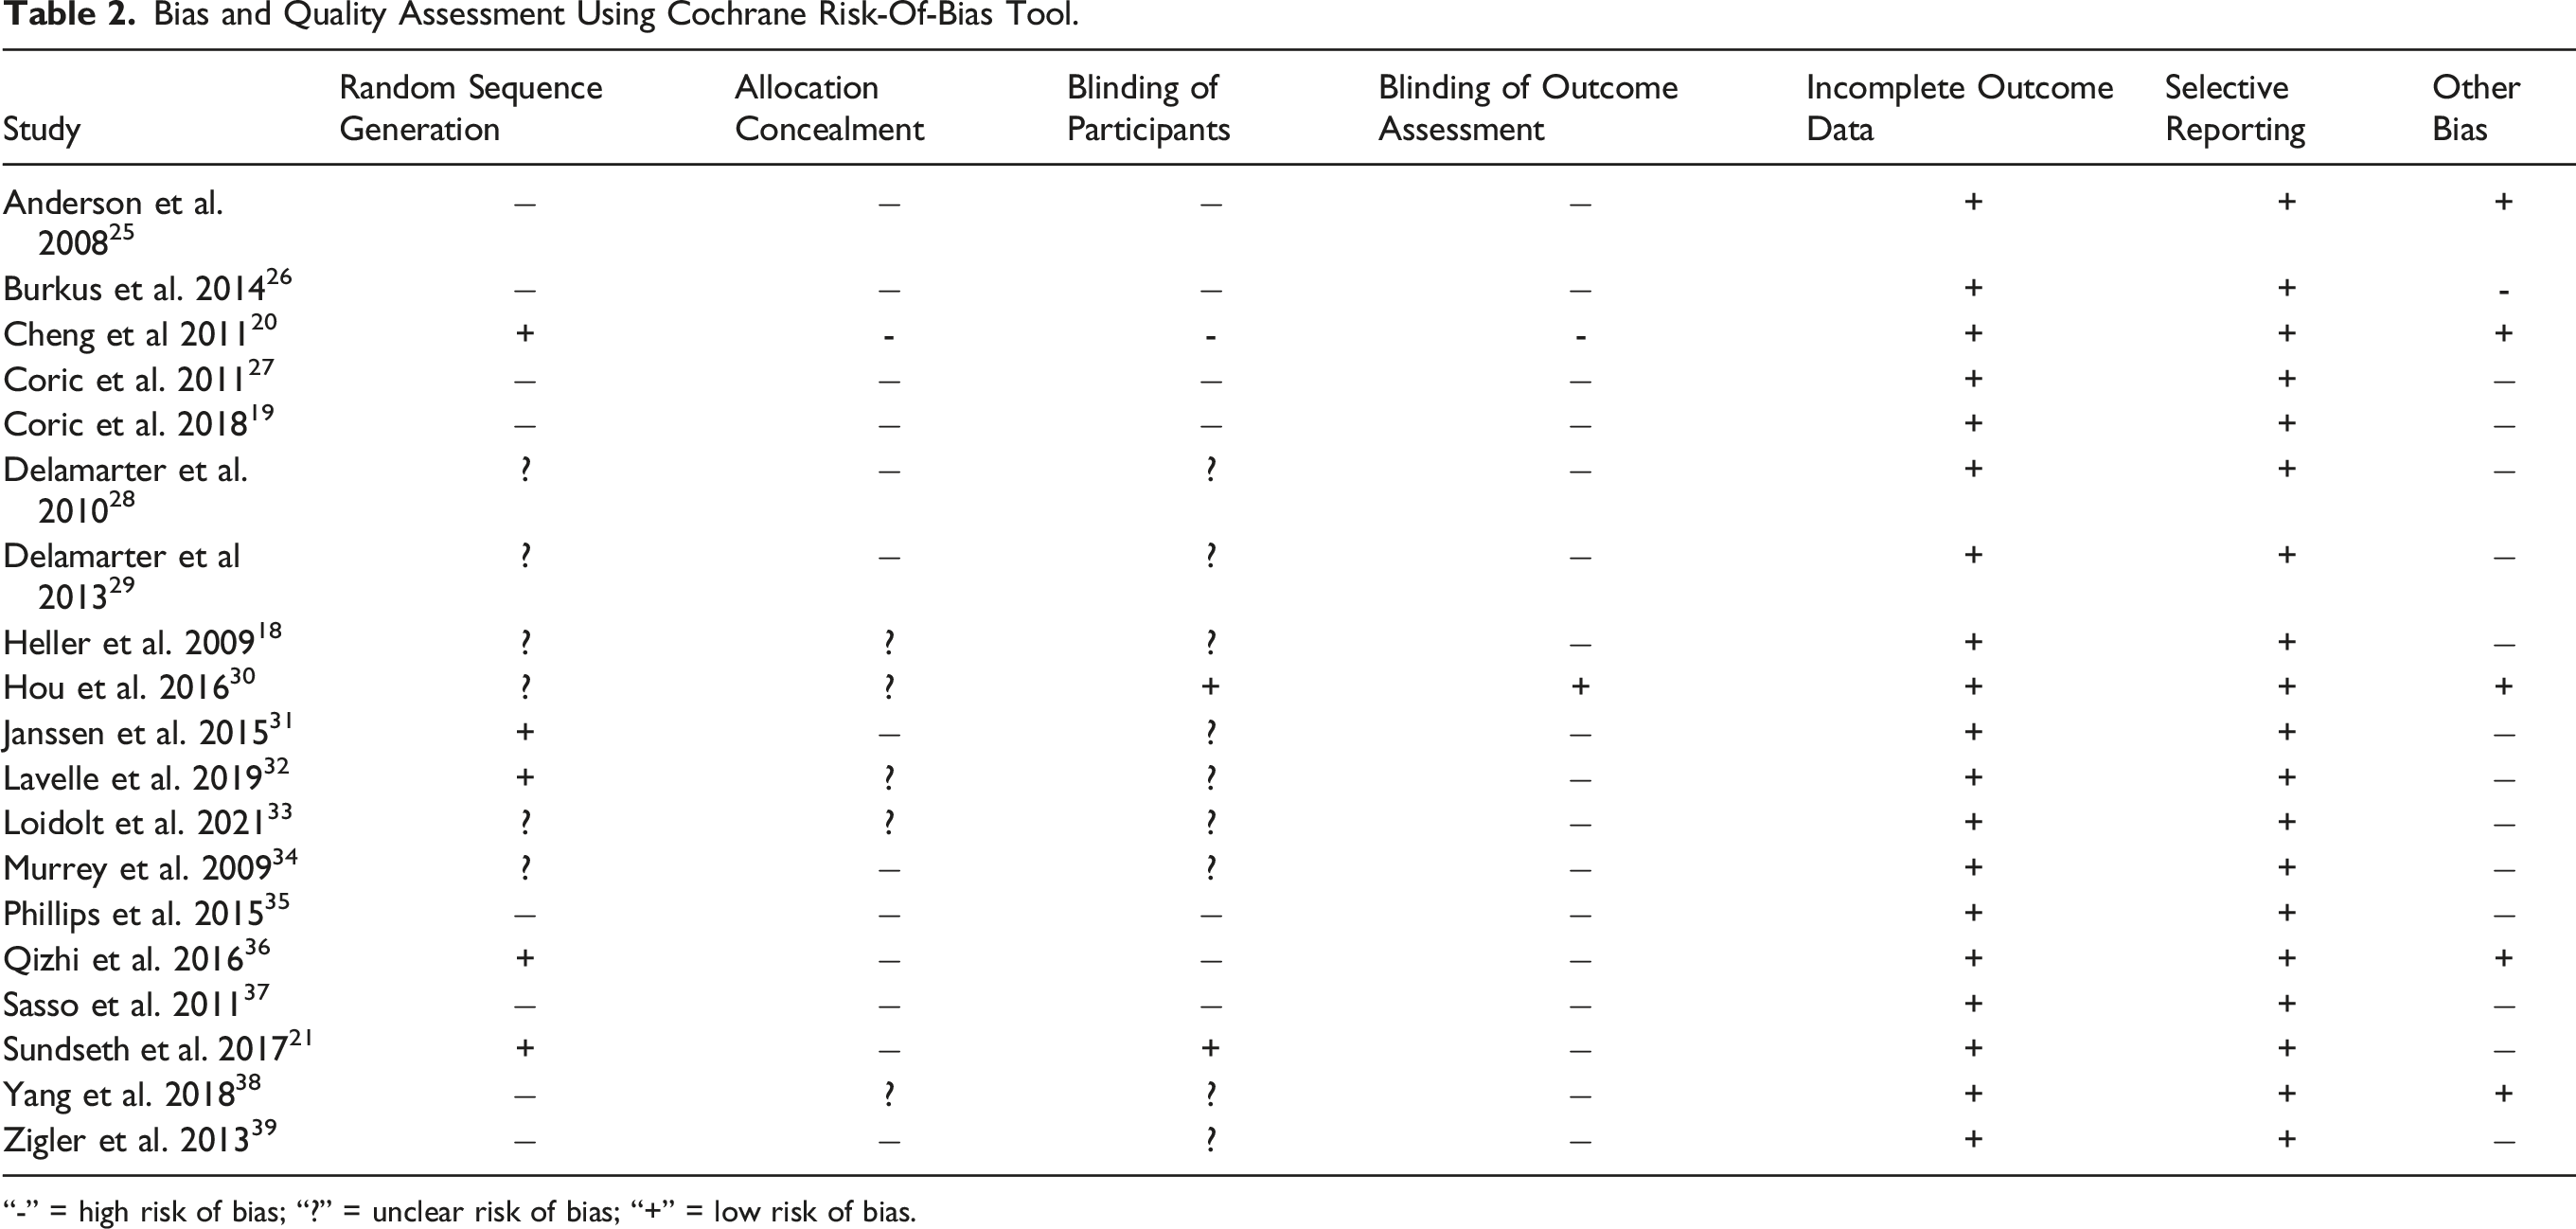
“-” = high risk of bias; “?” = unclear risk of bias; “+” = low risk of bias.
Summary of Study Details for Included RCT.
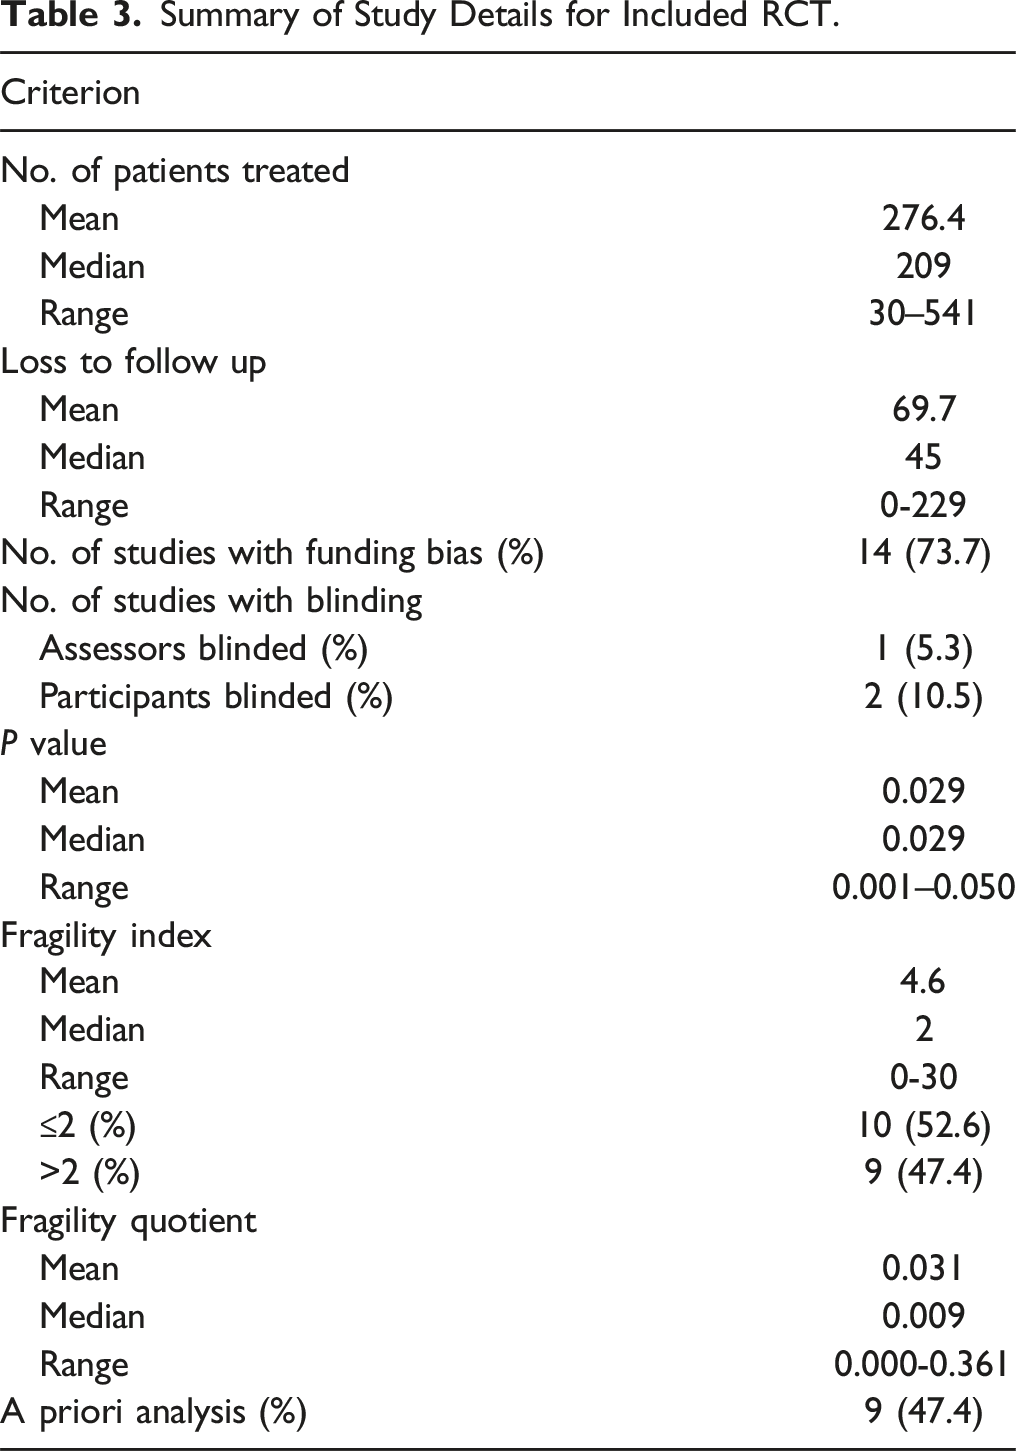
The primary outcome was available in 10 of 19 studies (52.6%) and was subsequently utilized as the significant dichotomous outcome to calculate FI in 9 of these 10 of studies (47.4% of all studies). The most commonly utilized outcomes were rate of reoperation/secondary surgery and overall success (31.6%). The remaining 10 studies used a secondary outcome for calculation of FI due to either lack of primary outcome or lack of significance or dichotomy in the primary outcome (Table 1). The reported P-value of the significant dichotomous outcomes used for FI calculation ranged from <0.001 to 0.049 (Table 3). FI was 0 in 3 (13.6%) studies and less than loss to follow-up in all but 2 studies (89.5%).
A combined 5251 total patients were included across all studies. The mean patient sample size was 276.4 (median 209, range 30-541). The number of patients lost to follow-up was 0 in 1 study with a mean of 69.7 (median 45, range 0-229). The mean calculated FI was 4.6 (median 2, range 0-30). The FI was less than or equal to 2 in 52.6% (10/22) of studies and greater than 2 in 47.4% (9/22) of studies. Two studies had an FI of zero. Loss to follow-up exceeded the FI in all but 1 study (which reported a loss to follow-up of 0 and an FI of 0). The mean FQ was 0.031 (median 0.009, range 0.000-0.361) (Table 3). There was no correlation between the FI and number of patients treated (Spearman coefficient = −0.141, P = 0.564). There was also no correlation between FI and impact factor (Spearman coefficient = 0.197, P = 0.420).
Discussion
Study Characteristics
The current study demonstrates that RCTs comparing ACDF vs CTDA are quite fragile, with the results echoing those of other FI assessments within spine surgery.2,4 The final number of RCTs included was 19, which is toward the lower end of similar Orthopaedic and Neurosurgical systematic reviews, which range from 5 to 104, with a median of 40.2,3,6,8,11-17
The median study population was 209, which was substantially larger than similar reviews, which ranged from 47 to 165 with a median of 84.2,3,6,8,11-15 This could be reflective of a priori power analyses with smaller effect sizes requiring larger sample sizes or could be a byproduct of strong industry funding providing resources for larger study sizes. Indeed, a weak positive correlation (R = 0.196) was found between industry funding and FI. However, Checketts et al previously demonstrated there to be no correlation between study power and funding source. 7 Additionally, the current review found that implementation of a priori analysis did not correlate with substantially greater FI (R = - 0.075) but did correlate with industry funding (R = 0.567). Interestingly, Journal Impact Factor correlated loosely (R = 0.193) with FI suggesting that reputable journals have a tendency to publish more robust studies; however, the weakness of the correlation suggests that reputability does not directly equate to robustness.
Interestingly, Herndon et al and Muthu et al demonstrated positive correlations between FI and sample size (R 0.14; R = 0.431) in the orthopedic arthroplasty and spine literature, respectively.8,11 In contrast, a weak negative correlation (−0.141) was found in the current study. The median FI was significantly greater at 6, compared to a median of 2.0 in this study, while the sample size was smaller with a median of 109.5 and mean of 193.4 (compared to 209 and 276.1, respectively). 11 Additionally, Muthu reported an FI of 2.0 with a smaller mean sample size of 133. 8 These findings seemingly contradict the notion that increasing sample size will increase FI and underscore the complexity of factors that undermine study validity.
A complex set of relationships exist between FI, follow-up duration, and percent lost to follow-up. A relatively strong positive relationship exists (R = 0.482) between follow-up duration and loss to follow-up, which likely influences the lack of correlation between follow-up and FI (0.010). As expected, there is a weakly negative correlation between FI and percent lost to follow-up (−0.258), which is important as loss to follow-up exceeded FI in 18 out of 19 studies. These results imply that the statistical utility of FI may be limited to studies with relatively short-term follow-up windows.
Fragility Index: Comparison to Orthopaedic Literature
In terms of FI, this study found that only 31.8% of CTDA vs ACDF studies meet the threshold of >2 that Checketts et al demonstrated for literature designated “strong” by the AAOS Practice Guidelines. 7 The large percentage of trials ≤2 (62.8%) is on par with that reported by Ruzbarsky et al (40% ≤ 2), Maldonado et al (50% ≤ 2), Ruzbarsky et al (73.3% ≤ 2) and Evaniew et al (75% ≤ 3).2,6,15,16 The median FI of 2.0 is low, but on par with similar orthopaedic and neurosurgical literature, where the median FI ranges from 1 to 6, with a median of 2.5 and mean of 3.33.2,3,6,8,11-17 Compared to the spine literature, the FI of 2 is on par with that demonstrated by Evaniew et al and Muthu et al, which include many overlapping studies, such as that by Coric et al, Cheng et al. Hiller et al and Engquist. et al.8,18-22
As expected, median loss to follow-up was quite high at 45. Loss to follow-up exceeded FI in 17 (89.5%) studies. This is on par with Orthopaedic and Neurosurgical literature, where losses to follow-up exceed FI in 31.2 – 74% of studies.2,3,6,12,14,15 It is, however, high compared to Checketts et al study of “strong” AAOS literature, where loss to follow up was greater than FI in only 32% of studies. 7 This would suggest that study validity is frequently threatened.4,23
Fragility Index: Effect Size and Power
Compared to the totality of the medical literature cannon, however, 2 is still rather low. 4 This could indicate that there is only a very slight difference in most outcomes comparing ACDF and CTDA, leading outcomes to appear fragile. Indeed, the notion that ASD is higher in ACDF was refuted by a meta-analysis by Verma et al, which included many of the same trials as the current study. 24 A strong clinical argument to this point is that intervention is often strongly dictated by surgeon preference as it is universally agreed upon that patients do quite well with either intervention.
Subgroup Analysis.
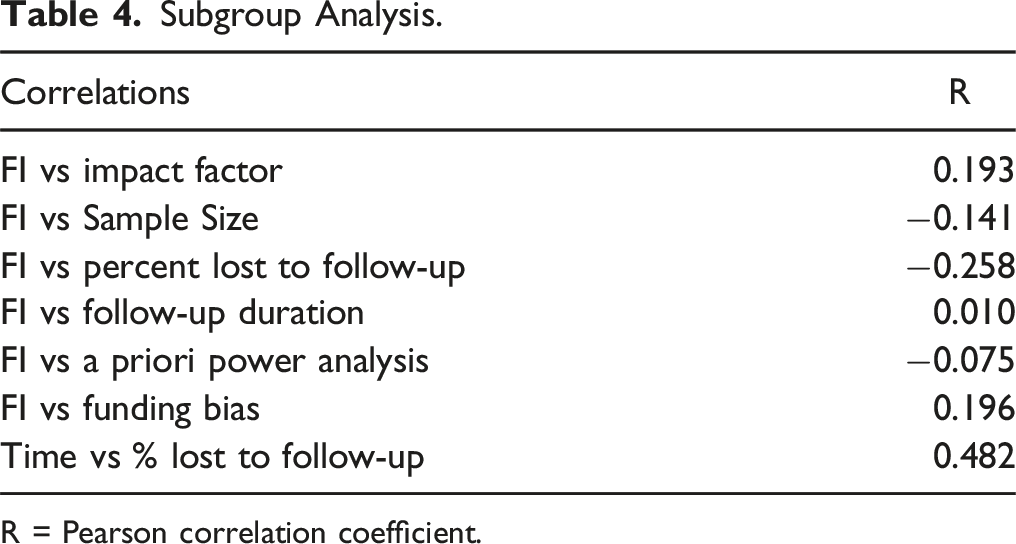
R = Pearson correlation coefficient.
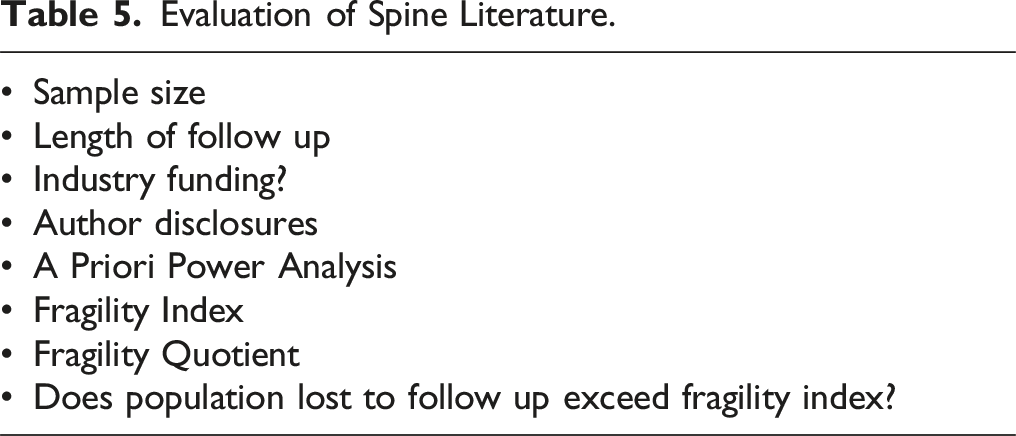
Evaluation of Spine Literature.
Bias
The current study found that 10 (52.6%) of studies reported losses greater than 20%, with a median of 27.0% and mean of 23.7%, indicating that the vast majority of studies must be analyzed with some degree apprehension. Dettori et al estimated that >20% loss to follow-up results in a serious threat to internal validity. 23 In this systematic review, only 3 studies (15.8%) met the Dettori et al threshold of <5% for little threat of bias. 23 These figures are on par with the findings of Checketts et al who found that 48.6% of trials deemed strong by the AAOS were at high risk of bias with only 4.2% being categorized as low risk. 7
Due to ethical concerns, blinding is a very difficult source of bias to fully eradicate. The vast majority of studies were unblinded. Only 1 study kept patients blinded for the complete duration of follow-up. 21 Several others kept concealment up until the time of surgery.18,25 It is possible that known treatment could influence patient-oriented functional outcomes, such as the SF-36, which were often a component of assessing overall device-success. Additionally, lack of physician blinding could influence physical exam or the decision to re-operate. However, radiographic parameters, such as rates of pseudarthrosis or adjacent segment disease, should hypothetically be immune to lack of proper blinding or concealment.
Clinical Ramifications
The current study demonstrates the inherent fragility of the fragility index, which is influenced by many interrelated factors, such as sample size, loss to follow-up, funding source, and journal impact factor. Given the lability of FI and its negative relationship to long term follow-up, which is crucial for many important clinical trials, the current study suggests that perhaps a new metric for study robustness is required for properly assessing studies. In this regard, the authors advise skepticism when reviewing studies with low FIs but do not believe that a low FI is in of itself enough to invalidate a study. This wholistic ideology outlined in Table 5 is in keeping with AAOS Research Designations, where problematic sources of bias have been found in upwards of 48.6% of influential studies, indicating that most studies are flawed and, therefore, 1 factor is not enough to invalidate results. 7 Given that strong FIs are rare and difficult to obtain, the Authors believe that a study with a strong FI should be interpreted as strong evidence; however, a weak FI should not automatically cause a study to be viewed as poor quality or prevent an otherwise compelling study from influencing standard of care.
Limitations
While FI provides a unique tool for assessing study robustness, it is not without its limitations. The first major limitation is the requirement of a dichotomous outcome. The majority of outcomes reported in spine literature are functional outcomes or measures of fusion, which are generally reported as discrete or continuous variables. This excludes the application of FI from a large number of outcomes. Additionally, variables must have met statistical significance, causing a large number of studies to be excluded.2,4,5,11,23 Another limitation to FI calculation is the original statistical analysis of included studies. It is possible for an FI to confusingly be zero if a Chi Square analysis was performed initially where a Fisher’s exact test may instead have been more appropriate. This is generally the case when sample sizes are less than 5.3,10
Conclusion
Randomized controlled trials comparing anterior cervical discectomy and fusion to cervical total disc arthroplasty are quite fragile with loss to follow-up frequently exceeding the fragility index. In many cases, 1 to 2 patients having an alternative outcome can change the statistically significant result assessed in these trials. Although the FI is unable to assess continuous variables, it offers an additional metric with which surgeons can analyze these trials prior to changing clinical practice.
Footnotes
Authors Note
Presented at AANS/CNS Section on Disorders of the Spine and Peripheral Nerves (Las Vegas, Nevada, February 2024).
Declaration of Conflicting Interests
The author(s) declared no potential conflicts of interest with respect to the research, authorship, and/or publication of this article.
Funding
The author(s) received no financial support for the research, authorship, and/or publication of this article.