
Abstract
Study Design
Retrospective comparative analysis.
Objective
To evaluate the impact of the spinal cord deformation rate (SCDR) on postoperative neurological deficits (PNDs) in spinal deformity surgery and to determine the optimal SCDR threshold for risk stratification.
Methods
Patients undergoing corrective surgery between October 2010 and March 2022 were included. Spinal cord morphology at the apex was assessed using axial T2-weighted magnetic resonance imaging, categorizing spinal cords into type-A and type-B. Differences between the two groups were analyzed and the odds ratio (OR) for PNDs in patients with type-B was calculated. For patients classified as type-B, univariate analysis was conducted to identify variables, including SCDR, that may influence PNDs risk. Statistically significant variables were further analyzed using multivariate analysis. The receiver operating characteristic (ROC) curve and area under the curve (AUC) analyses were performed to evaluate the discriminative ability of risk factors and determine the optimal cut-off value.
Results
Among 200 patients included, PNDs occurred in 17 cases (8.5%), predominantly in type-B (15/82 in type-B vs 2/118 in type-A, P < 0.001). Multivariate analysis revealed SCDR as an independent predictor of PNDs (OR = 1.076, P = 0.001). ROC analysis determined an optimal SCDR cutoff of 42.15% (AUC: 0.867), with 82.4% sensitivity, 88.5% specificity, and 98.2% negative predictive value (NPV). SCDR demonstrated superior predictive performance compared to the major Cobb angle (AUC: 0.776) and T-DAR (AUC: 0.769).
Conclusions
For patients undergoing corrective surgery, an SCDR of ≥42.15% serves as a strong predictor of PNDs. Its high NPV effectively excludes low-risk patients, offering improved risk stratification.
Keywords
Introduction
Surgical treatment of spinal deformity is a highly complex procedure with significant technical demands, and postoperative neurological deficits (PNDs) resulting from spinal cord dysfunction remain a major concern for both patients and surgeons.1,2 Previous studies have reported relatively high incidences of PNDs during spinal deformity correction, ranging from 3.3% to 23.0%, highlighting the need for precise risk assessment.2-6 The risk factors for PNDs in spinal deformity surgery can be broadly classified into patient-related and surgical factors. Patient-related factors include older age, larger major Cobb angles, preoperative spinal cord dysfunction, and the deformity angular ratio (DAR), while surgical factors include prolonged operative time, excessive blood loss, and the use of vertebral column resection (VCR) techniques.7-10 Despite the implementation of various prevention strategies—such as intraoperative neuromonitoring (IONM) and intraoperative ultrasound imaging—to minimize the risk of neurological impairment, PNDs continue to occur.11,12 Identifying high-risk patients preoperatively is crucial, as it allows for better preparation and the optimization of management strategies to mitigate these risks during surgery.1,13
A novel Spinal Cord Shape Classification System (SCSCS) was introduced in 2020 to evaluate spinal cord deformation and cerebrospinal fluid (CSF) presence at the apex of the major curve using preoperative axial T2-weighted magnetic resonance imaging (MRI). The SCSCS was retrospectively shown to be associated with IONM alerts during spinal deformity surgery, with findings indicating that SCSCS type-3 spinal cord morphology significantly increased the likelihood of IONM events. 14 Several subsequent studies have further demonstrated that SCSCS type-3 spinal cords are associated with a higher incidence of IONM alerts and PNDs during spinal correction surgery.1,4,5
Patients with SCSCS type-1 and type-2 spinal cords exhibit no apparent compression or deformation on MRI, and previous research has confirmed that the incidence of IONM data loss and/or PNDs does not significantly differ between these two groups.1,4,5,14 While SCSCS type-3 spinal cords do exhibit varying degrees of compression and deformation, the precise impact of deformation severity on PND risk remains unclear. Therefore, the SCSCS alone may not comprehensively reflect the effect of spinal cord compression and deformation on PNDs. To address this limitation, we reclassified SCSCS type-1 and type-2 spinal cords as type-A, while categorizing SCSCS type-3 spinal cords as type-B. Furthermore, for patients with type-B spinal cords, we introduced the spinal cord deformation rate (SCDR) as a quantitative measure of deformation severity. The objective of this study was to compare the incidence of PNDs among patients with different spinal cord types and to further evaluate the impact of SCDR on PNDs risk in patients with type-B spinal cords.
Materials and Methods
Patients
We reviewed preoperative full-spine X-rays and MRI scans of the affected region in patients undergoing surgical correction of spinal deformity at a single academic center between October 2010 and March 2022. Only patients with complete medical records and imaging data were included in the study. The exclusion criteria were as follows: (1) Patients with active infections or recent severe spinal trauma; (2) Patients with a history of drug dependence, mental disorders, malignancy, or prior intraspinal surgery at the apex; (3) Patients with a type-A spinal cord whose apex was located below the level of the conus medullaris, or patients with a type-B spinal cord whose apex was below T12; (4) Patients with intraspinal abnormalities, such as diastematomyelia, syringomyelia, or tethered spinal cord; (5) Patients who had undergone preoperative halo traction.
Additionally, we reviewed each patient’s preoperative and postoperative neurological status. All patients underwent posterior deformity correction and fusion utilizing pedicle screw/rod constructs, with surgeries primarily performed for deformity correction or neurological improvement. Posterior-based osteotomies were performed at the discretion of the surgeon to achieve optimal correction. Preoperative MRIs were obtained within three months of the scheduled surgery.
Imaging Evaluation
Preoperative and postoperative full-spine X-rays were obtained in both anteroposterior and lateral views for all patients. Using the Picture Archiving and Communication System (PACS) (GE Healthcare, Mount Prospect, IL, USA), the following parameters were measured on X-rays: major Cobb angle, deformity angular ratio (DAR, Cobb angle divided by the number of vertebrae involved) which included coronal DAR (C-DAR), sagittal DAR (S-DAR), total DAR (T-DAR = C-DAR + S-DAR). The major Cobb angle was defined as the greater value between the coronal and sagittal Cobb measurements.
MRI was performed on all patients using either a 1.5 T or 3.0 T system (Siemens, Germany or General Electric, Boston, MA, USA) to assess the degree of spinal cord compression and deformation. In our center, 3.0 T MRI scanners are prioritizes for patients with spinal deformity, except in cases where magnetically sensitive implants (e.g., cardiac pacemakers) are present, requiring the use of a 1.5 T scanner. Following the classification system described by Sielatycki et al,
14
we categorized spinal cord morphology based on T2-weighted axial MRI at the apex of the curve, considering both spinal cord shape and cerebrospinal fluid (CSF) signal: A type-A spinal cord was defined as a smooth round/oval appearance of the spinal cord with or without visible CSF between the spinal cord and the apical concave pedicle and/or vertebral body. A type-B spinal cord was defined as a spinal cord that is compressed and deformed by the apical concave pedicle or vertebral body with no intervening CSF between the cord and the pedicle/body (Figure 1). Two types of spinal cord morphology at the curve apex. On T2-weighted axial magnetic resonance imaging, type-A spinal cord exhibits a smooth, round/oval appearance with or without visible cerebrospinal fluid (CSF) between the spinal cord and the apical concave pedicle and/or vertebral body. Type-B spinal cord is deformed and compressed by the apical concave pedicle or vertebral body with no intervening CSF between the spinal cord and the pedicle/vertebral body.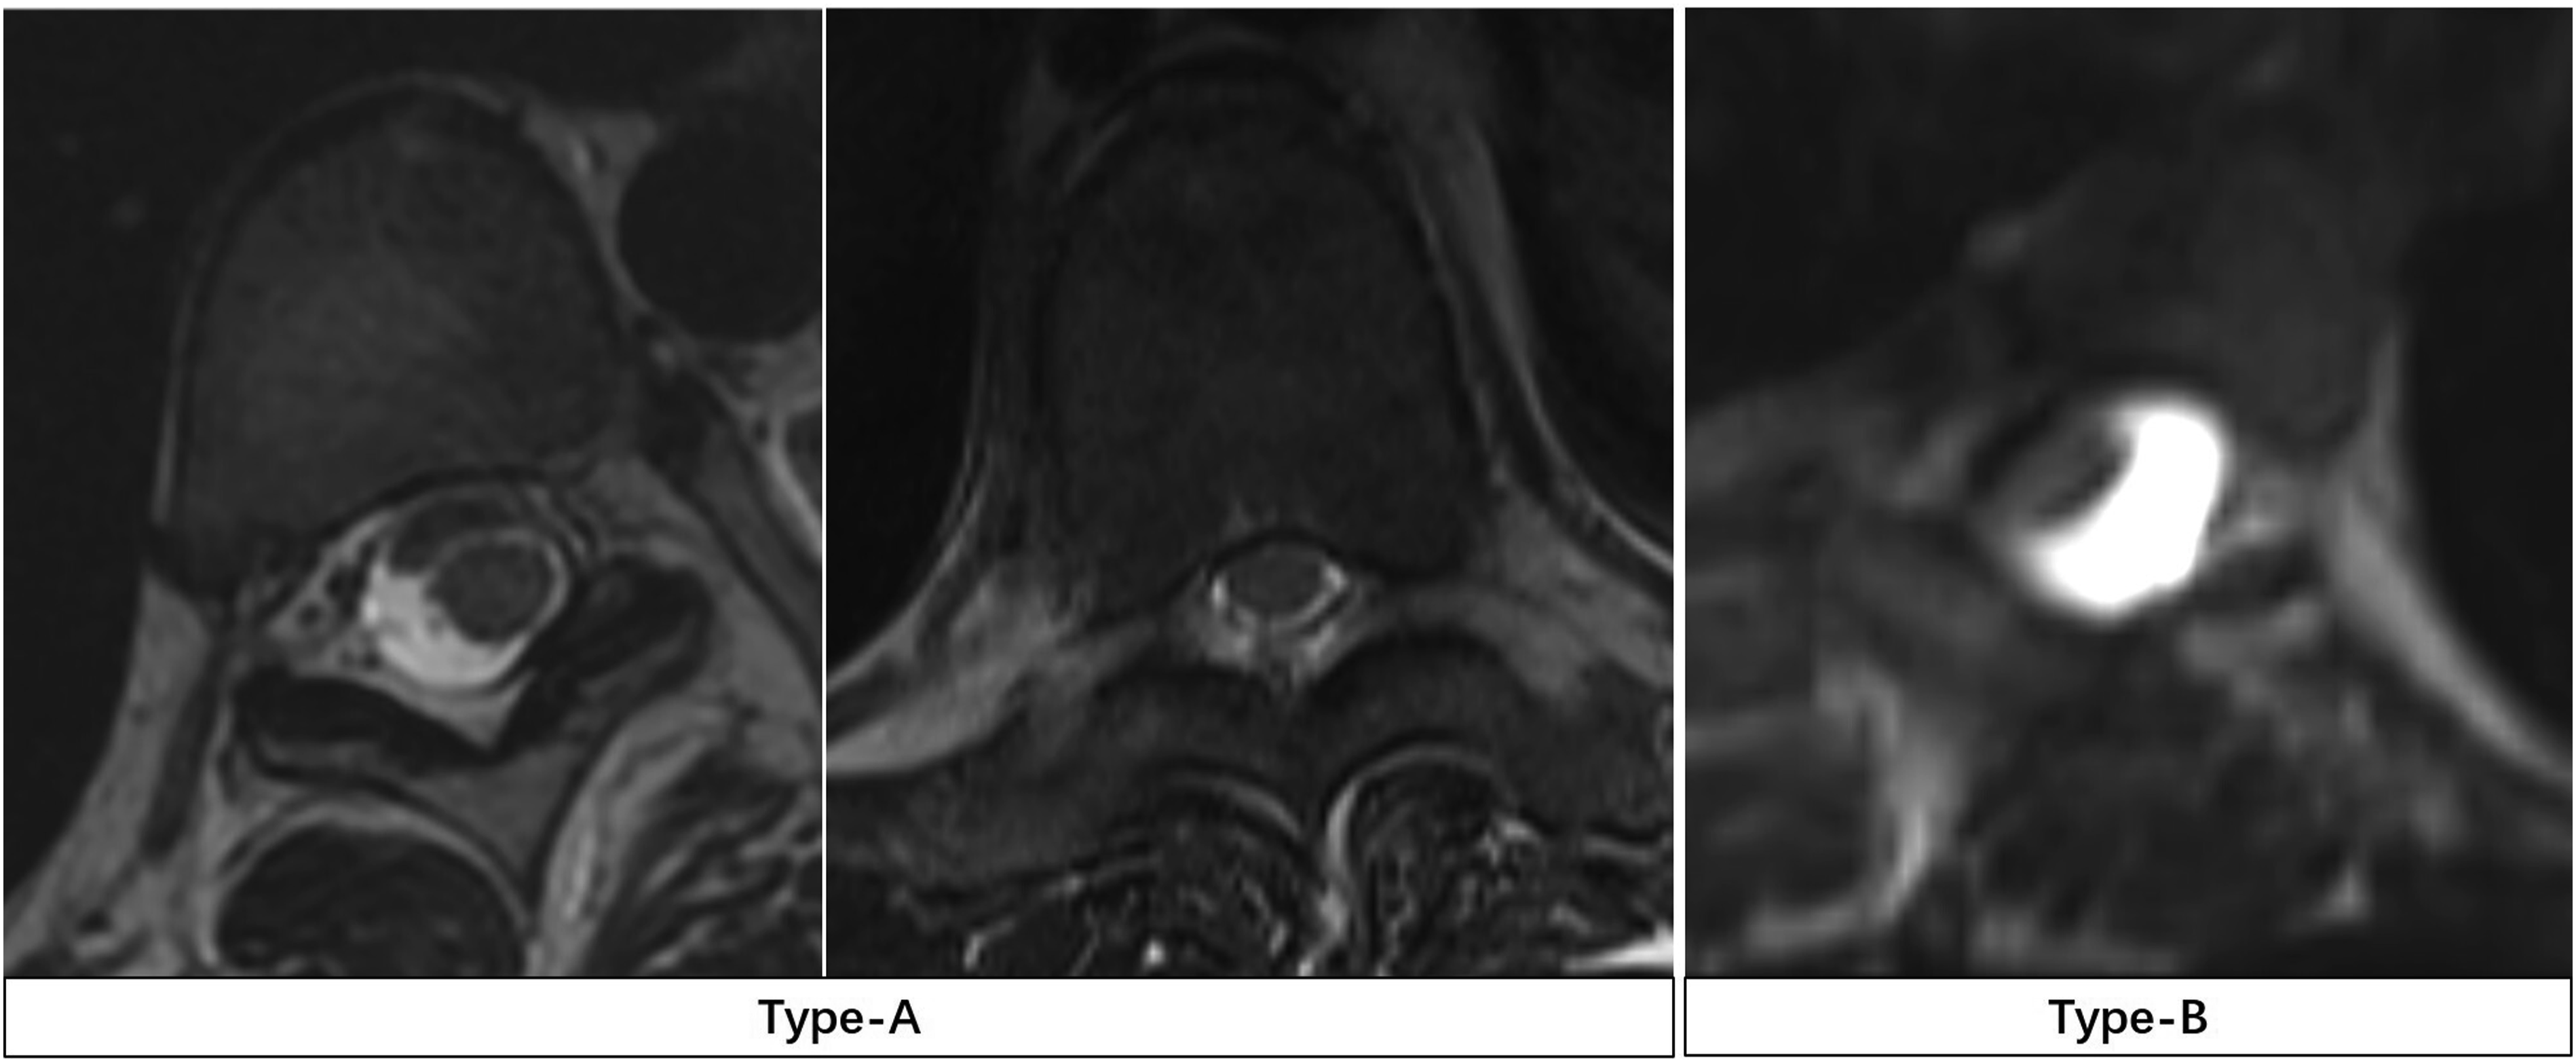
For type-B spinal cords, we additionally measured the spinal cord cross-sectional at the apex region (A1) and at an adjacent unaffected region (A2) using T2-weighted axial MRI. The SCDR was defined as:
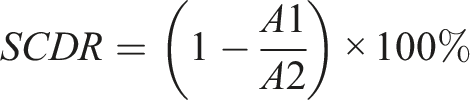
This metric was used to quantitatively assess the extent of spinal cord deformation (Figure 2). T2-weighted axial MRI of a patients with congenital kyphosis. (A) The area of the spinal cord at the apex region (A1 = 21.6 mm2). (B) The area of the spinal cord at adjacent no compression and deformation region (A2 = 38.1 mm2). The spinal cord deformation rate (SCDR) is calculated as 1 minus A1 divided by A2 and multiplied by 100% [SCDR=(1-A1/A2) × 100%=(1-21.6/38.1) ×100% = 43.3%].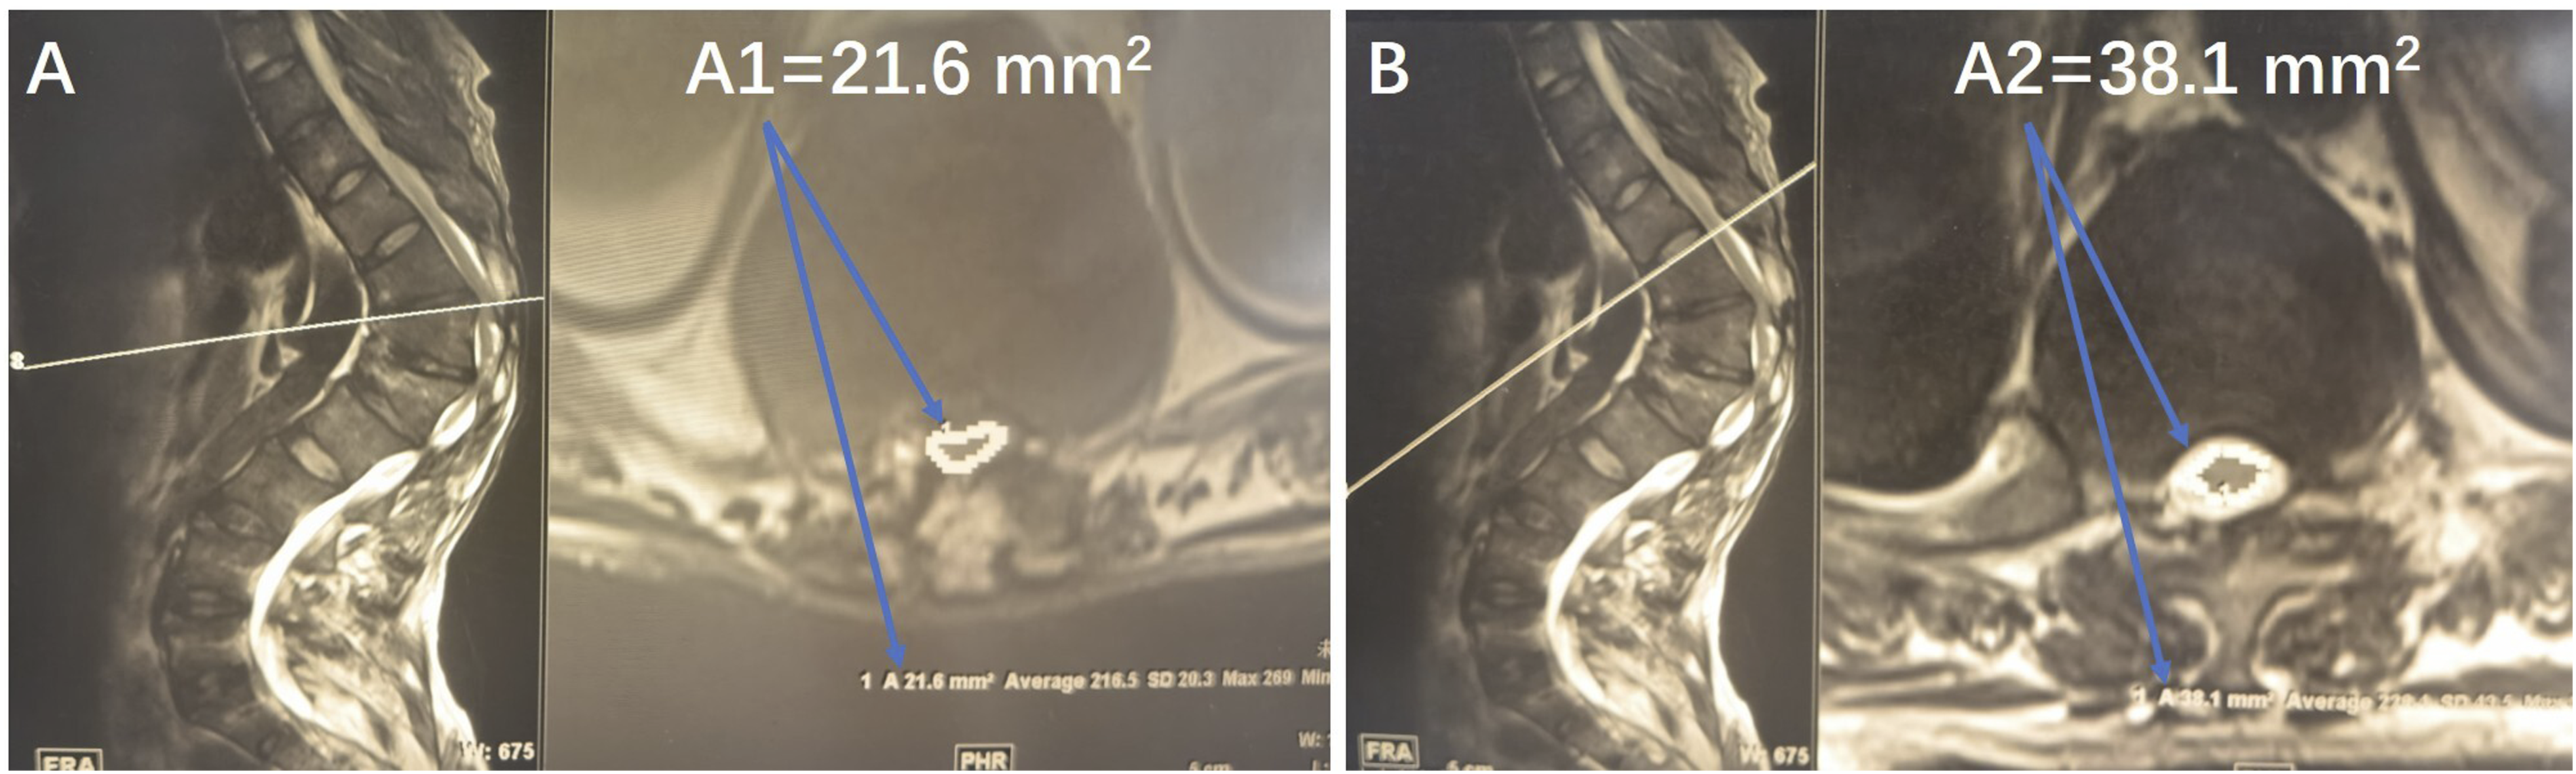
Neurological Evaluation and Perioperative Management
Preoperative and postoperative neurological assessments were conducted by reviewing medical records, including neurological symptoms, somatic sensations, lower limb muscle strength, tendon reflexes, and pathological signs for all patients. PNDs were defined as either a worsening of pre-existing sensory, motor or bowel dysfunction or the development of new sensory, motor or bowel dysfunction following surgery. Neurological symptoms caused by postoperative epidural hematoma formation were excluded from the definition of PNDs.
All spinal deformity osteotomy and corrective surgeries in our center were performed by highly experienced senior surgeons, with intraoperative care managed by an expert team of anesthesiologists responsible for maintaining stable mean arterial pressure (MAP). Moreover, all procedures were conducted under continuous IONM. In response to any IONM alerts, the following standardized protocol was implemented: first, the technical integrity of the monitoring system—including electrode positioning and signal baseline stability—is verified; second, physiological parameters are optimized by elevating MAP to >80 mmHg, maintaining hemoglobin levels above 10 g/dL, and reducing the anesthetic depth; third, if the alerts persisted, surgical interventions such as reversal of corrective forces, localized decompression, or osteotomy completion are performed. Unresolved alerts prompt a wake-up test to confirm motor function. This consistent perioperative management strategy played a critical role in mitigating neurological risks and reducing the incidence of PNDs.
Statistical Methods
All statistical analyses were performed using the SPSS software version 26 (SPSS Inc., Chicago, IL, USA). The normality of the data was determined by the Kolmogorov-Smirnov test (K-S test). Normally distributed continuous variables were expressed as mean and standard deviation (SD). Non-normally distributed Continuous variables were reported as median and interquartile range (IQR). Categorical variables were presented as frequencies and percentages. The Student’s t test or Mann–Whitney U test was used to assess the differences in continuous variables between type-A and type-B spinal cord groups. Chi-Square or Fisher’s exact test was used for categorical data analysis. To identify factors influencing PND risk in patients with Type-B spinal cords, univariate analysis was first performed. Variables showing statistical significance were further analyzed using multivariate binary logistic regression analysis. To assess the discriminative ability of continuous risk factors, receiver operating characteristic (ROC) curve analysis was performed, and the area under the curve (AUC) with 95% confidence intervals (CI) was calculated. The optimal cut-off value was determined by maximizing Youden’s index and the corresponding sensitivity, specificity, positive predictive value (PPV), and negative predictive value (NPV) were calculated for the cut-off value. P < 0.05 was considered statistically significant.
Results
Basic Descriptive Statistics
Demographics and Clinical Characteristics of all Patients.
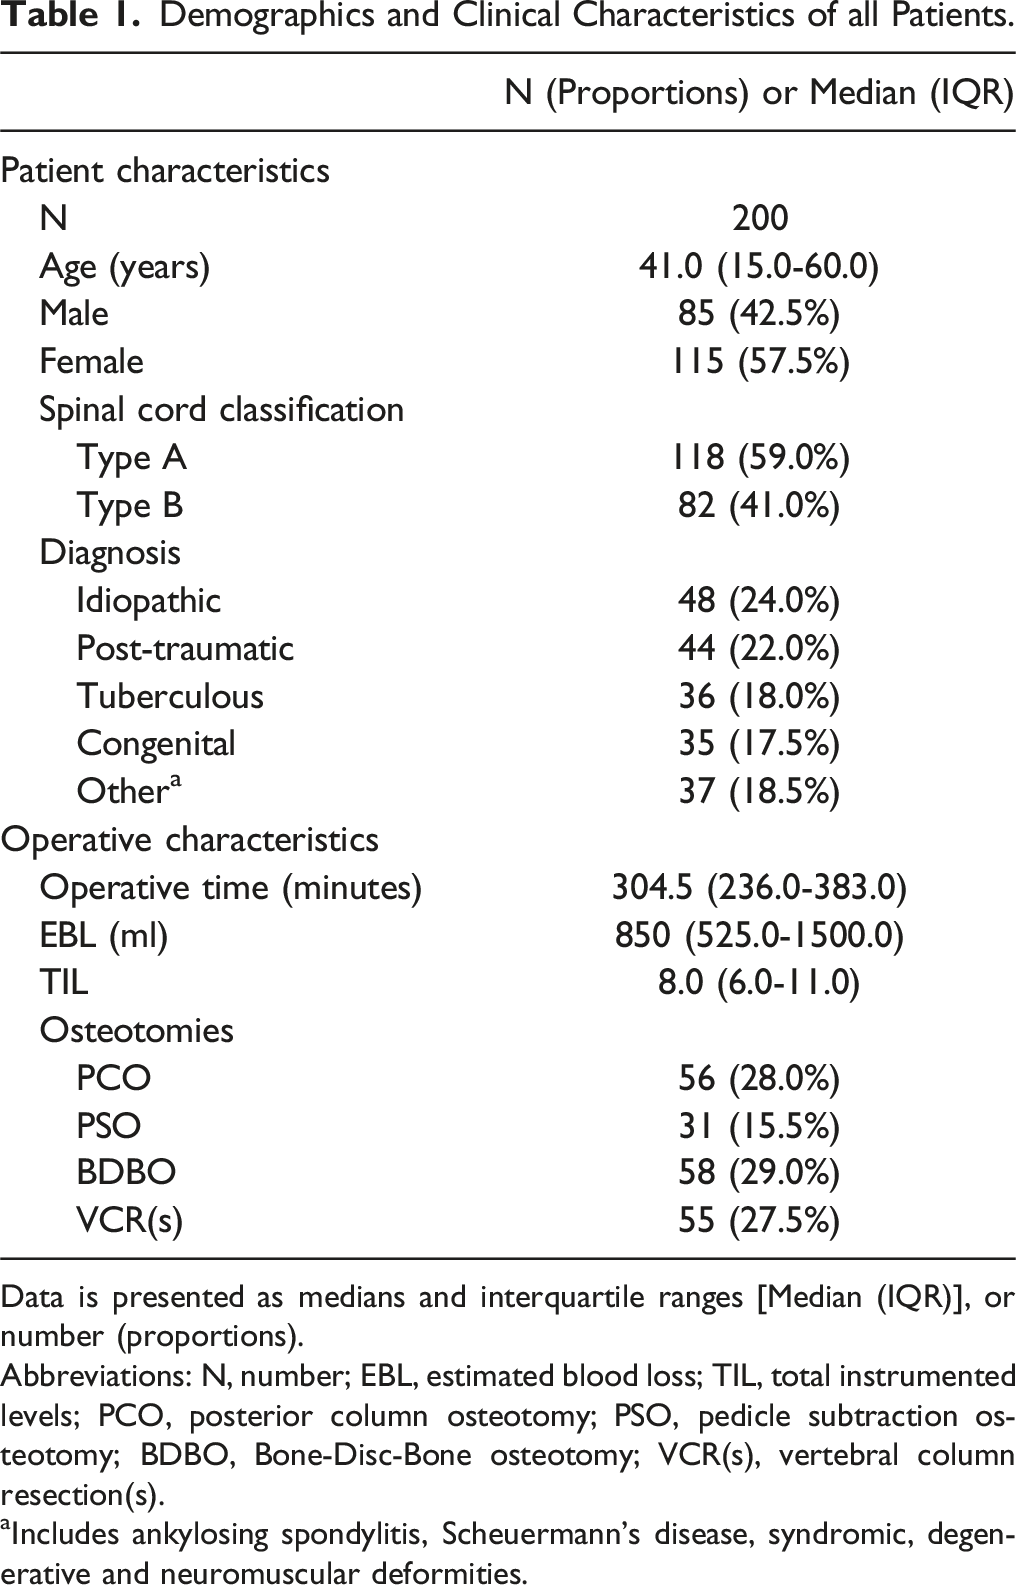
Data is presented as medians and interquartile ranges [Median (IQR)], or number (proportions).
Abbreviations: N, number; EBL, estimated blood loss; TIL, total instrumented levels; PCO, posterior column osteotomy; PSO, pedicle subtraction osteotomy; BDBO, Bone-Disc-Bone osteotomy; VCR(s), vertebral column resection(s).
aIncludes ankylosing spondylitis, Scheuermann’s disease, syndromic, degenerative and neuromuscular deformities.
Comparison of Patients with Type-A and Type-B Spinal Cords
No significant difference in age was observed between the two groups [37.0 (15.0-61.0) vs 42.0 (16.5-57.0), P = 0.985]. The proportion of female patients was significantly higher in the type-A group (75/118 vs 40/82, P = 0.038). The major Cobb angle in type-A patients was 56.3° ± 17.2° preoperatively, which improved to 13.9° (8.6°-22.0°) immediately postoperative, resulting in a deformity correction rate of 74.5% (64.0%-84.0%). In contrast, Type-B patients had a significantly larger preoperative major Cobb angle of 80.9° ± 29.1°, which improved to 27.5° (14.9°-39.4°) postoperatively, yielding a deformity correction rate of 66.5% (56.0%-86.0%). The deformity correction rate was significantly higher in the Type-A group compared to the Type-B group (P < 0.001). Significant differences were also observed in preoperative C-DAR (8.3 ± 2.5 vs 11.2 ± 5.2, P = 0.001) and S-DAR [12.1 (9.3-14.5) vs 13.9 (10.7-18.4), P = 0.003] between the two groups. Regarding surgical factors, patients with a type-B spinal cord had longer TIL [8.0 (6.0, 10.0) vs 9.0 (7.0, 12.0), P = 0.007], longer operative time [276.0 (225.0, 335.5) vs 344.0 (278.3, 451.5), P < 0.001], and greater EBL [700.0 (500.0, 1200.0) vs 1050.0 (775.0, 2000.0), P < 0.001].
Demographics and Clinical Characteristics Between Patients With Different Spinal Cord Types.
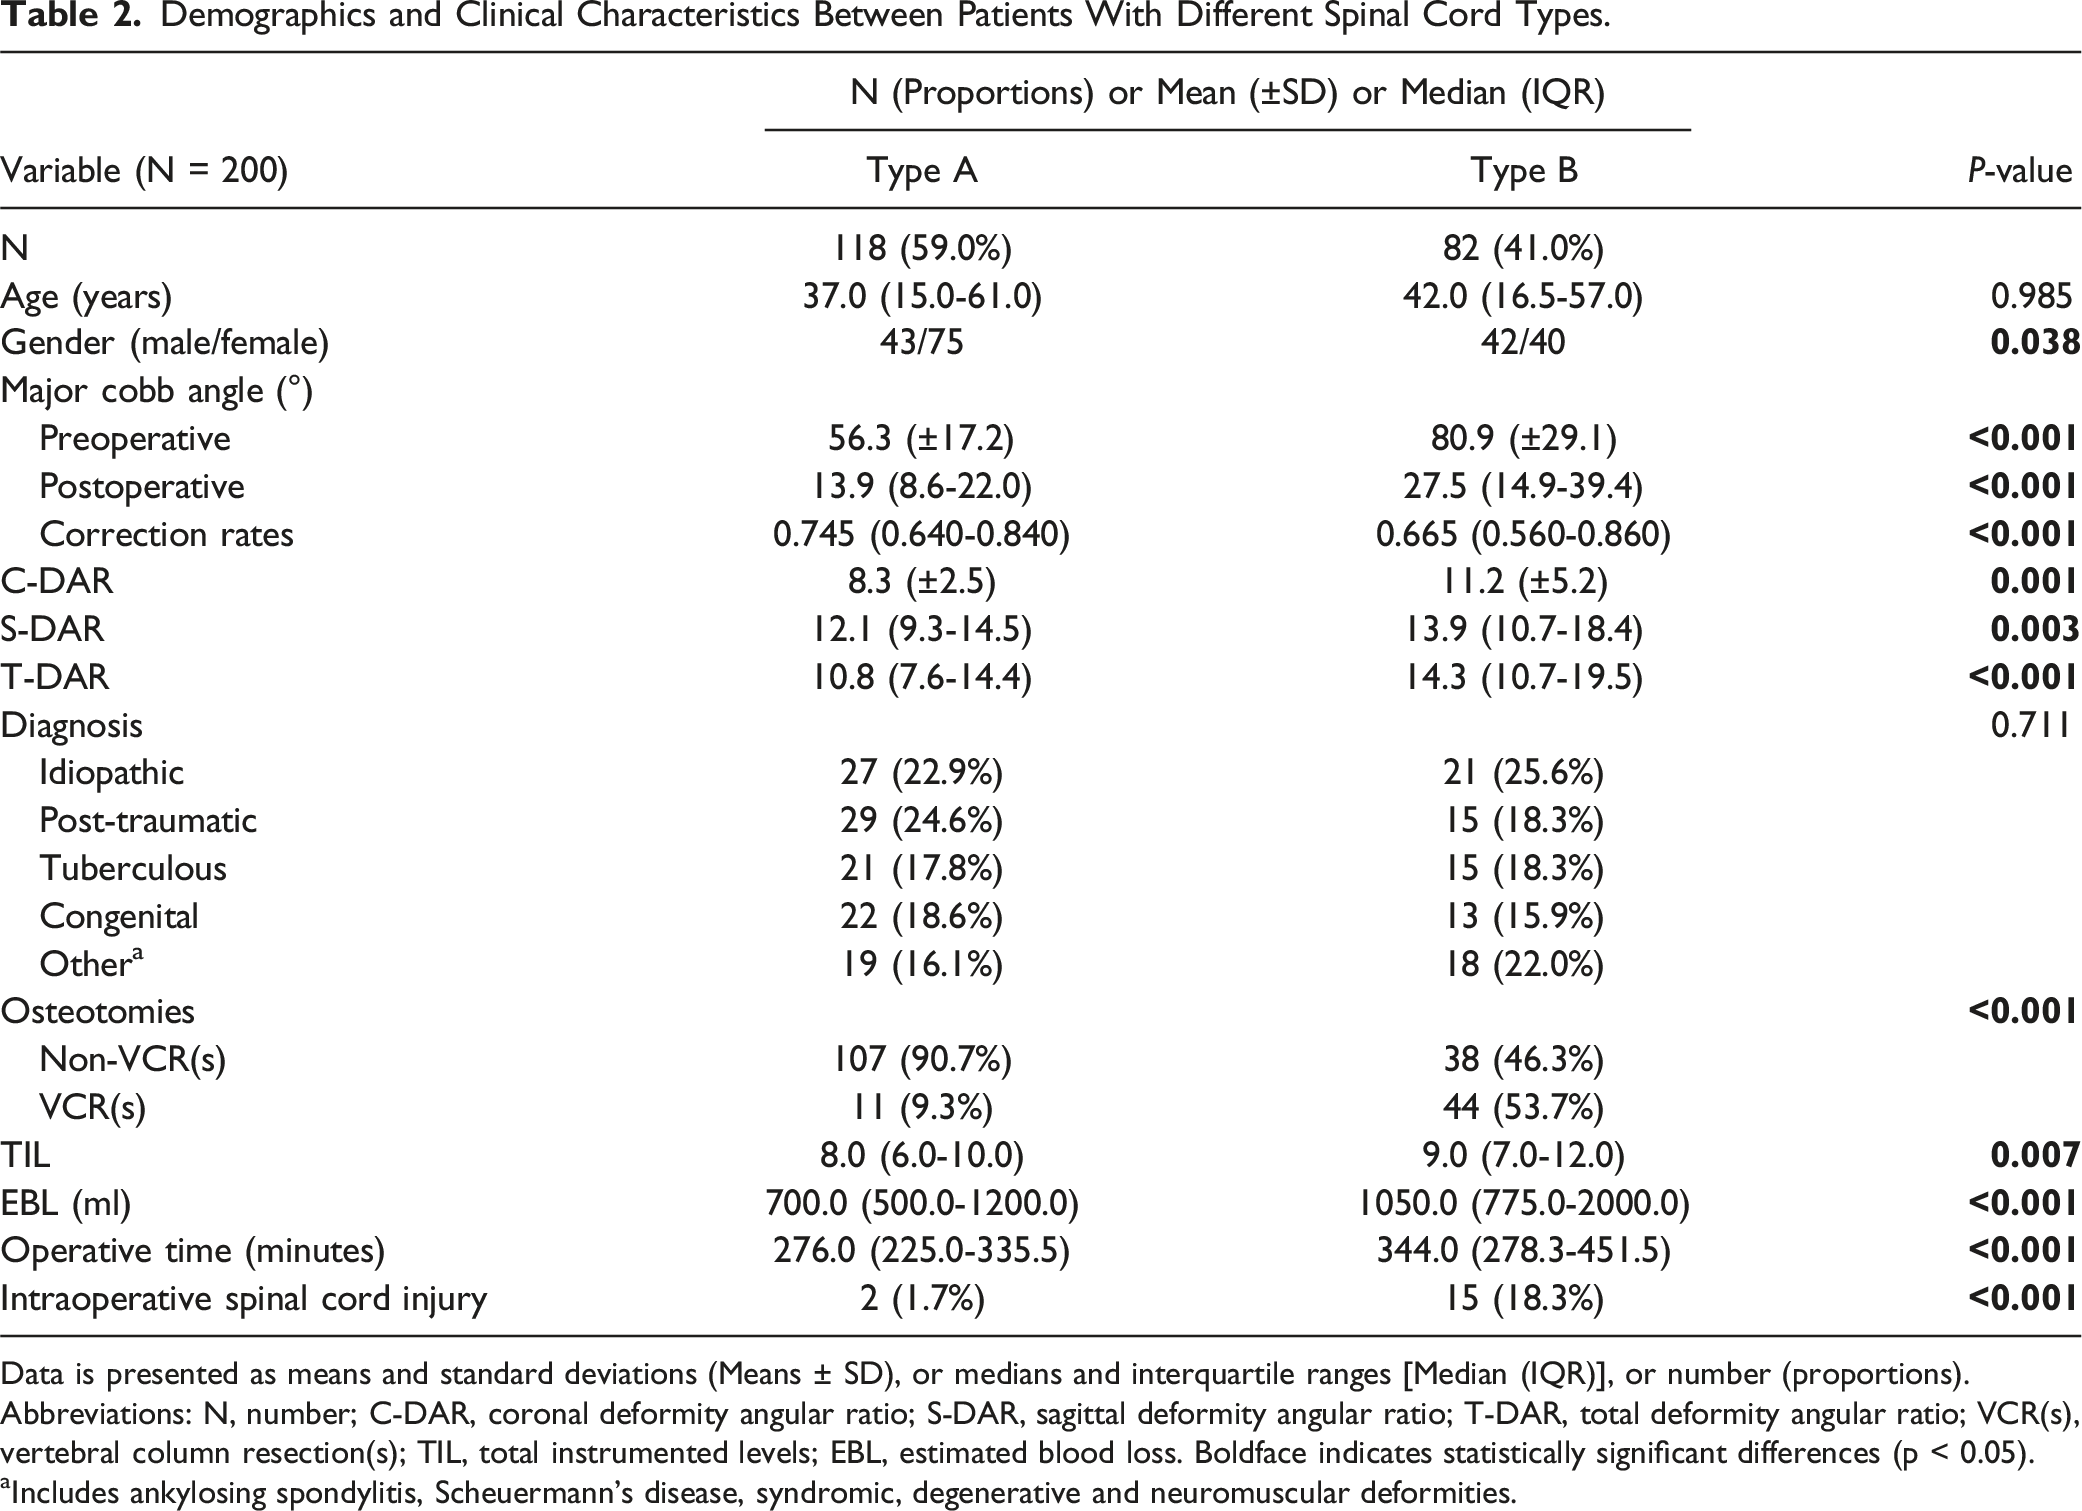
Data is presented as means and standard deviations (Means ± SD), or medians and interquartile ranges [Median (IQR)], or number (proportions).
Abbreviations: N, number; C-DAR, coronal deformity angular ratio; S-DAR, sagittal deformity angular ratio; T-DAR, total deformity angular ratio; VCR(s), vertebral column resection(s); TIL, total instrumented levels; EBL, estimated blood loss. Boldface indicates statistically significant differences (p < 0.05).
aIncludes ankylosing spondylitis, Scheuermann’s disease, syndromic, degenerative and neuromuscular deformities.
The Odds Ratio of PNDs in Patients With Different Spinal Cord Types.
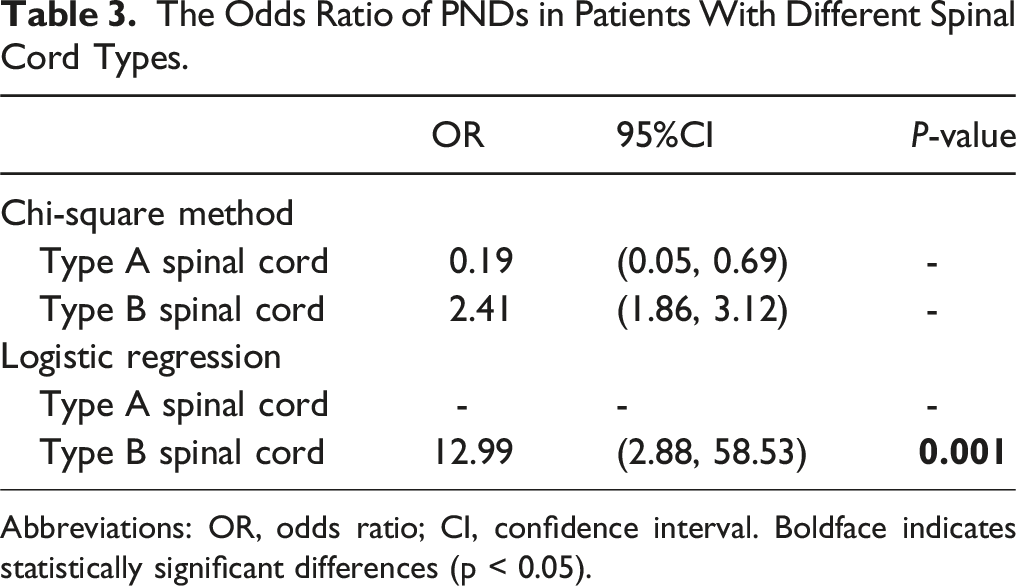
Abbreviations: OR, odds ratio; CI, confidence interval. Boldface indicates statistically significant differences (p < 0.05).
Univariate and Multivariate Analysis of Patients with Type-B Spinal Cord
Univariate Analysis of PNDs in Patients With Type-B Spinal Cord.
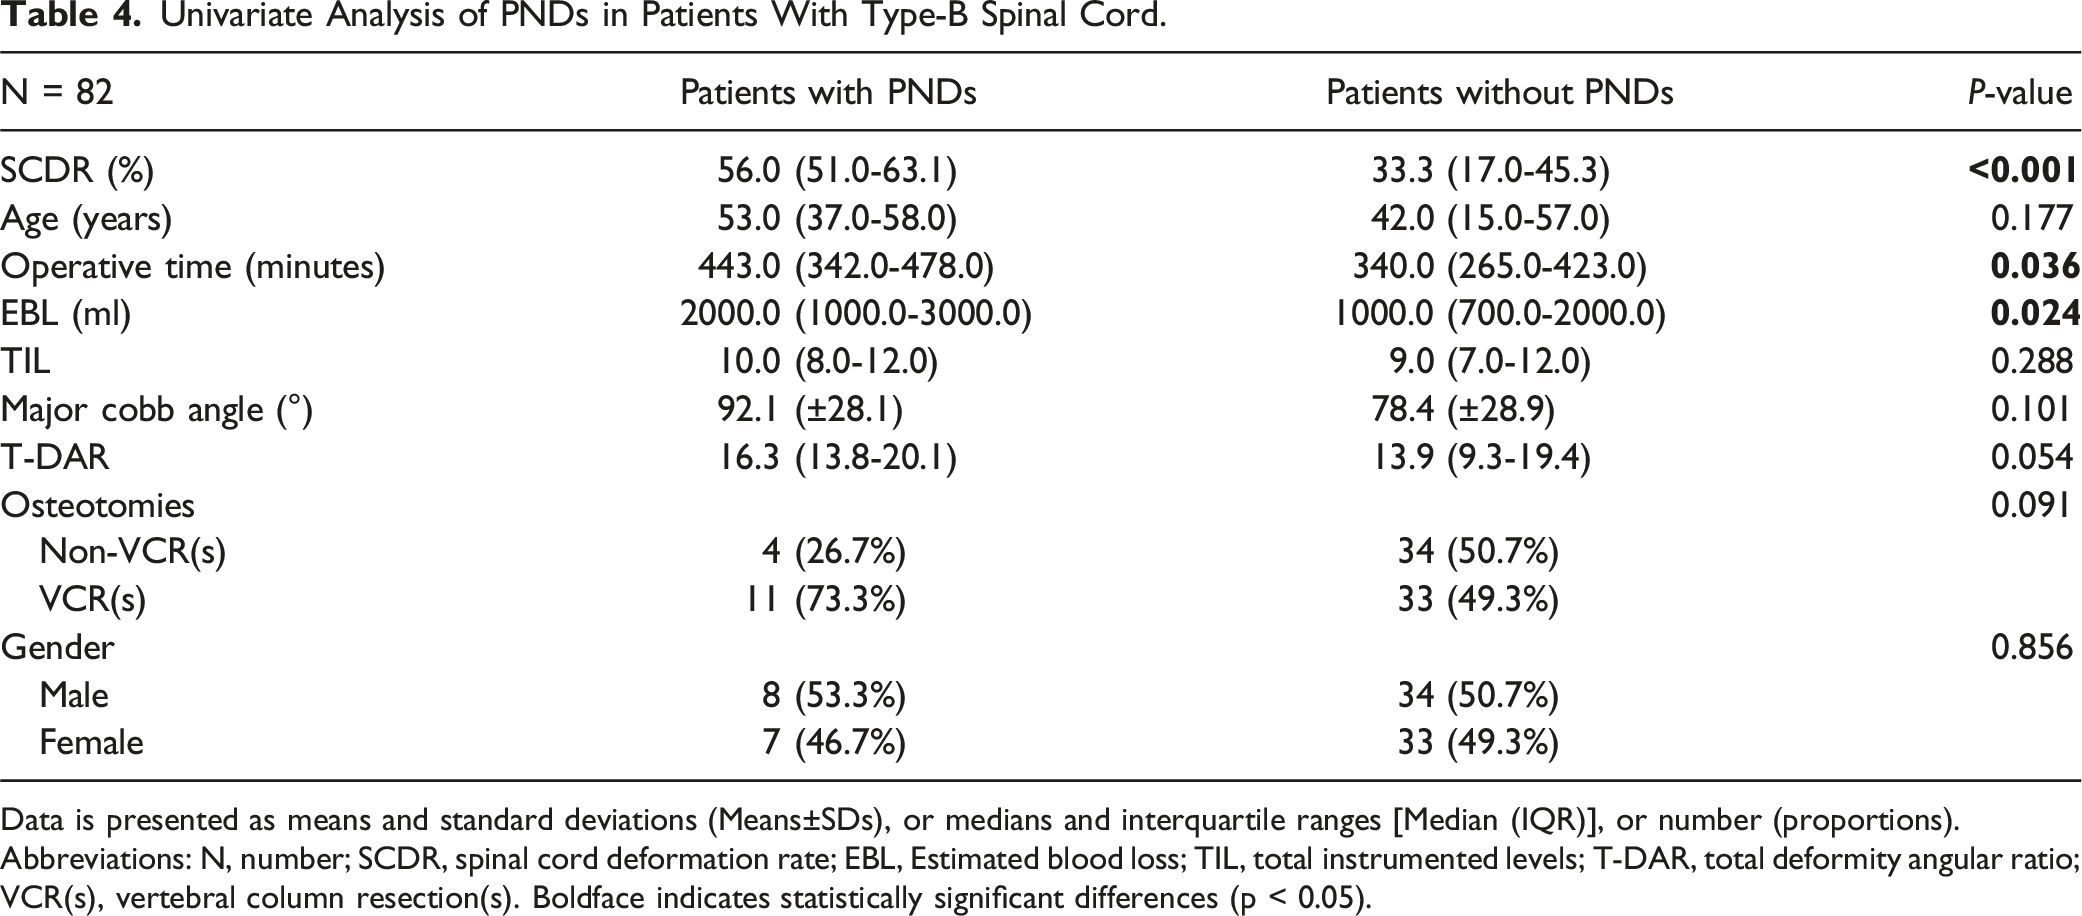
Data is presented as means and standard deviations (Means±SDs), or medians and interquartile ranges [Median (IQR)], or number (proportions).
Abbreviations: N, number; SCDR, spinal cord deformation rate; EBL, Estimated blood loss; TIL, total instrumented levels; T-DAR, total deformity angular ratio; VCR(s), vertebral column resection(s). Boldface indicates statistically significant differences (p < 0.05).
Multivariate Binary Logistic Regression Analysis Results of PNDs in Patients With Type-B Spinal Cord.
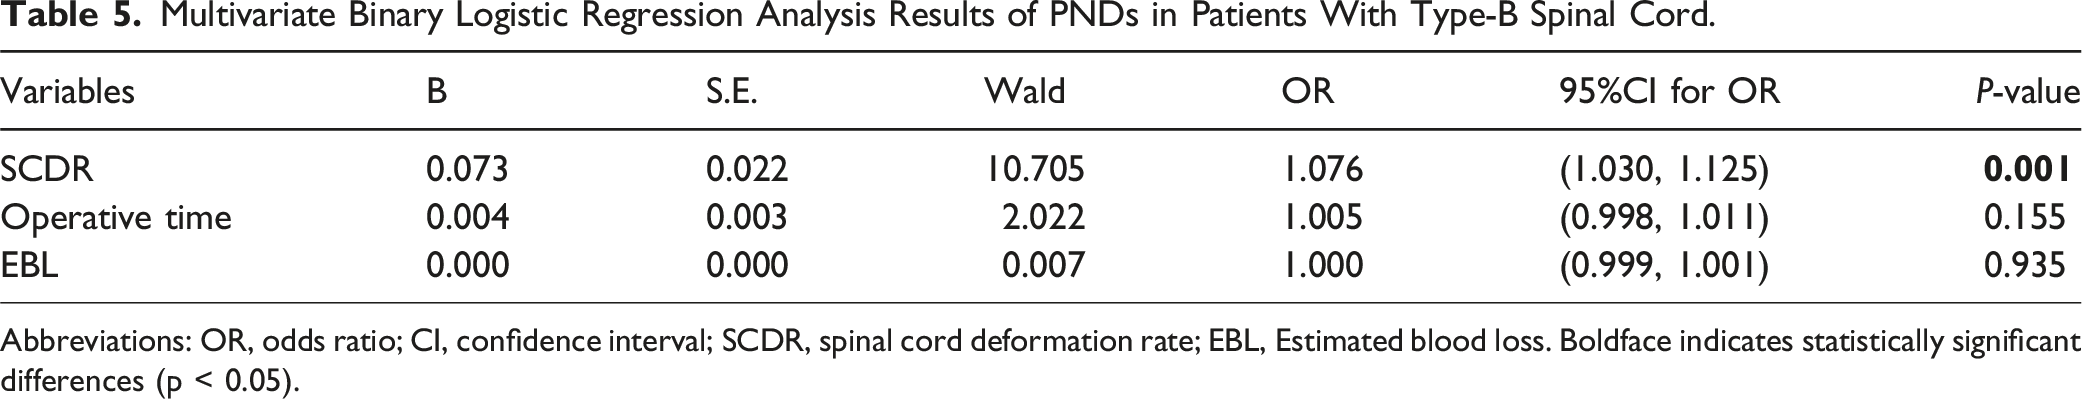
Abbreviations: OR, odds ratio; CI, confidence interval; SCDR, spinal cord deformation rate; EBL, Estimated blood loss. Boldface indicates statistically significant differences (p < 0.05).
ROC Curve Analysis for Predicting PNDs and Optimal SCDR Thresholds
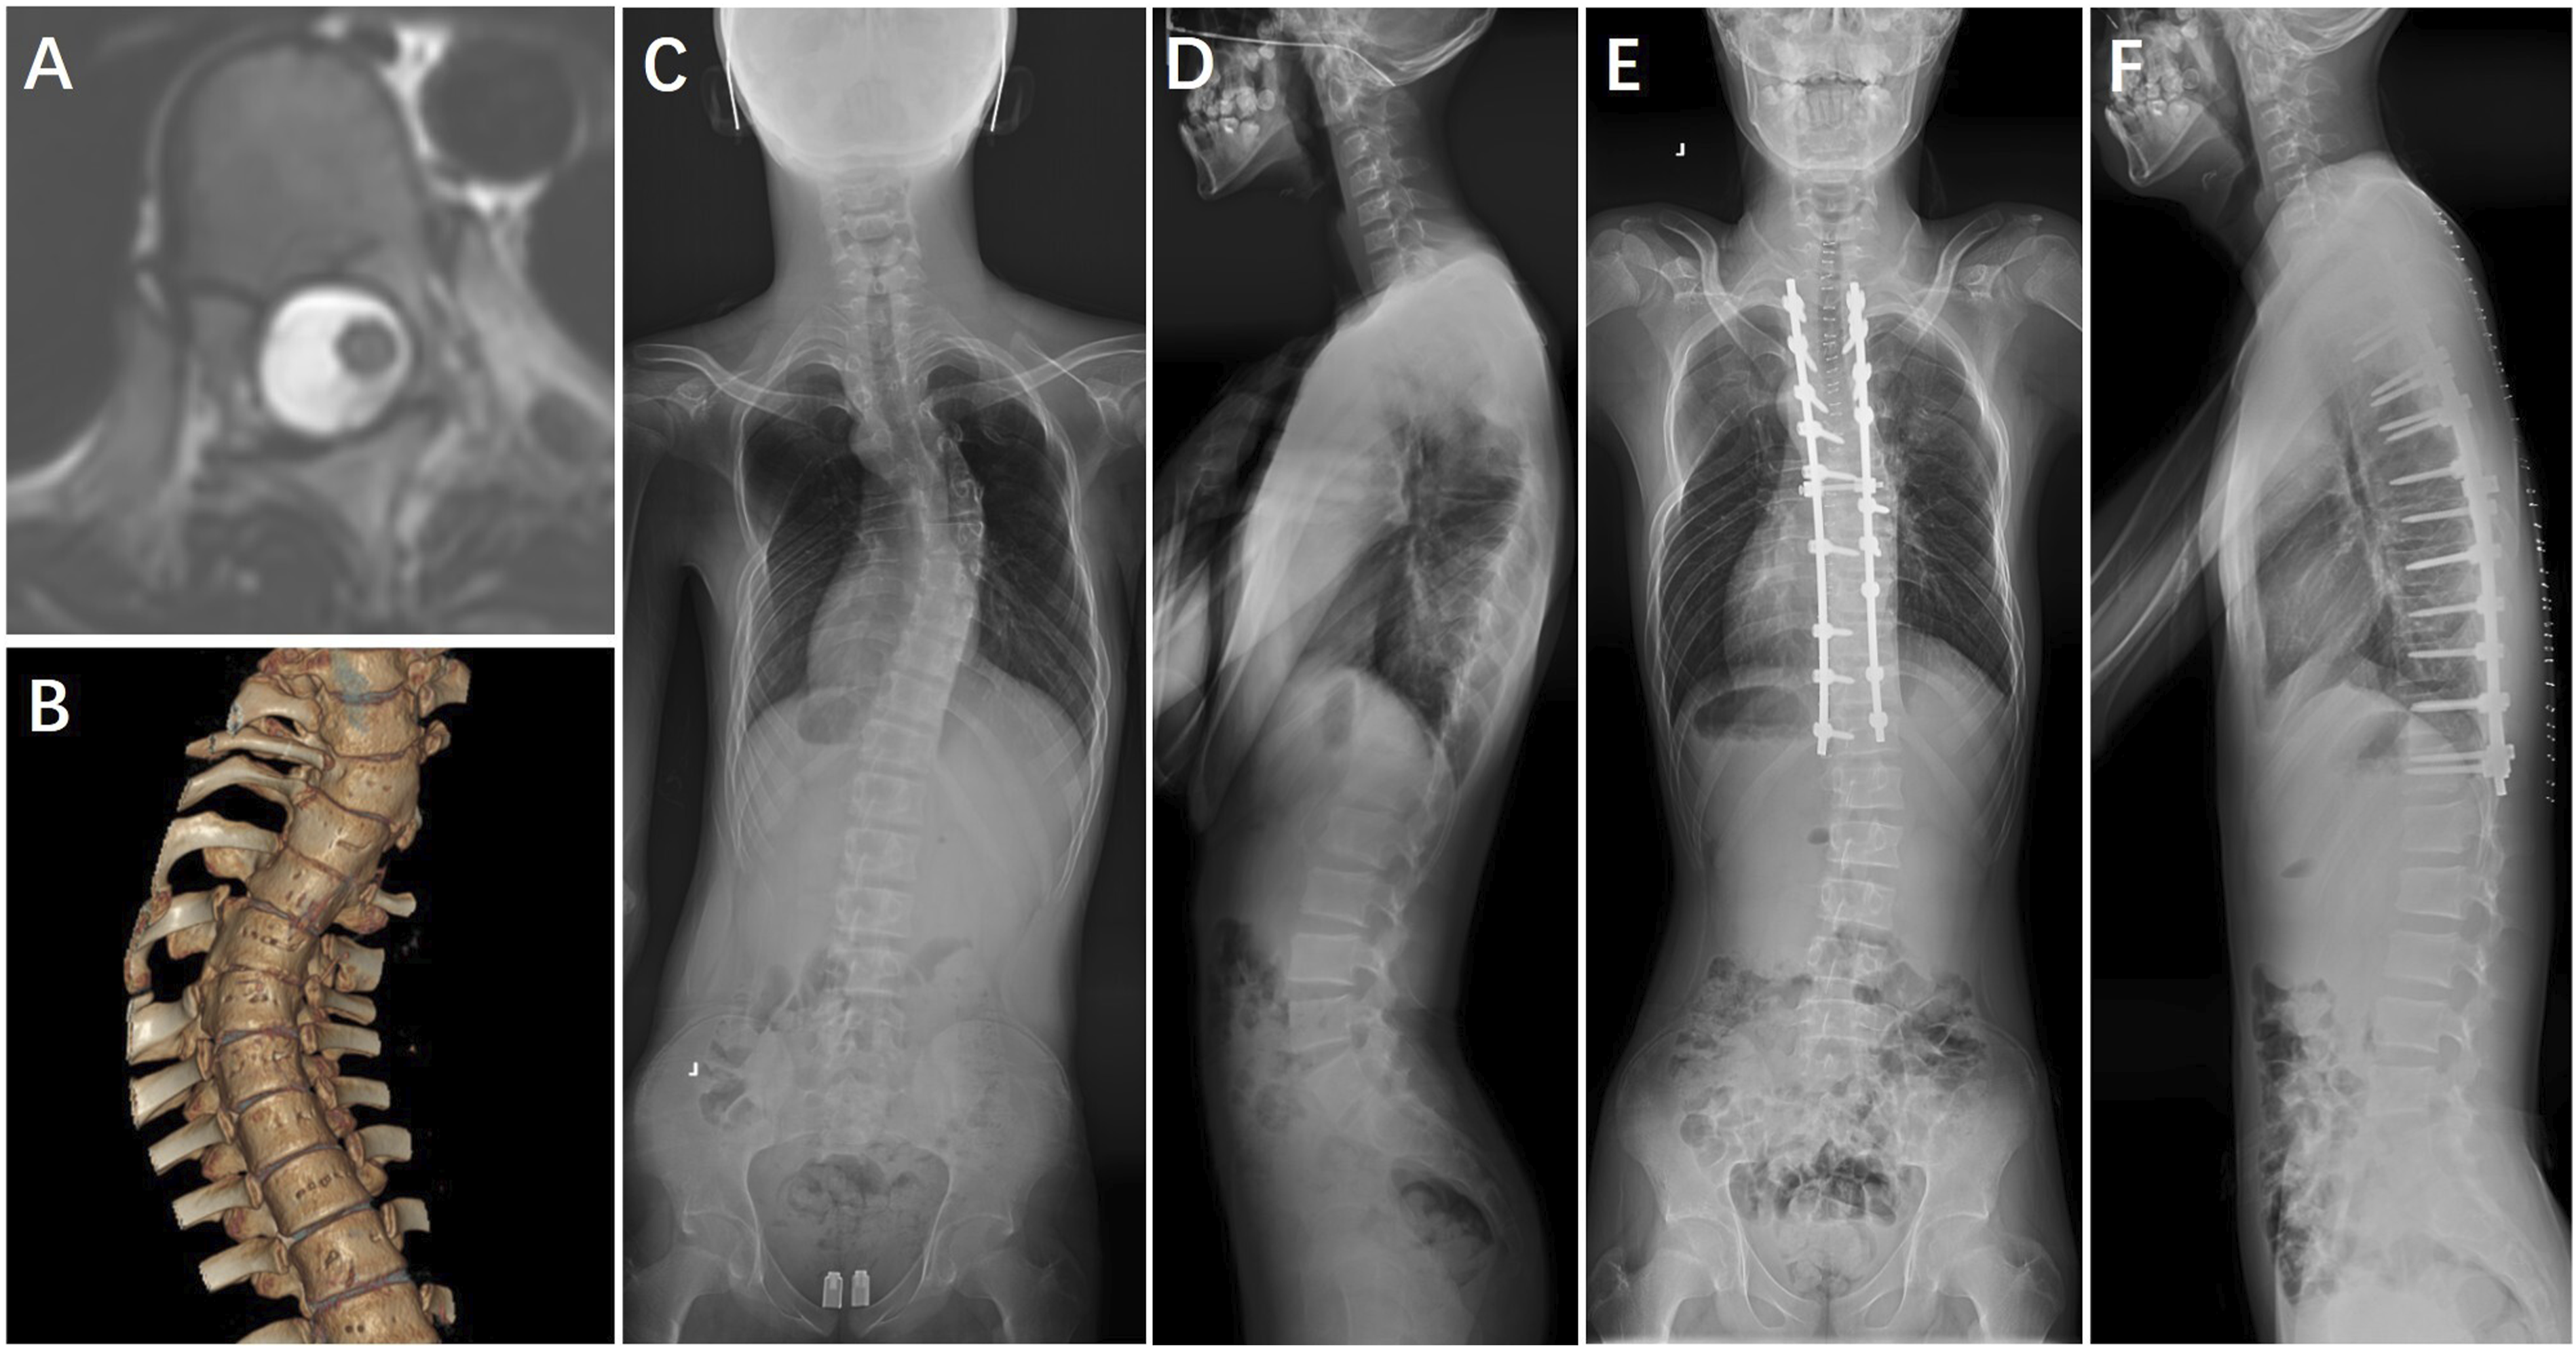
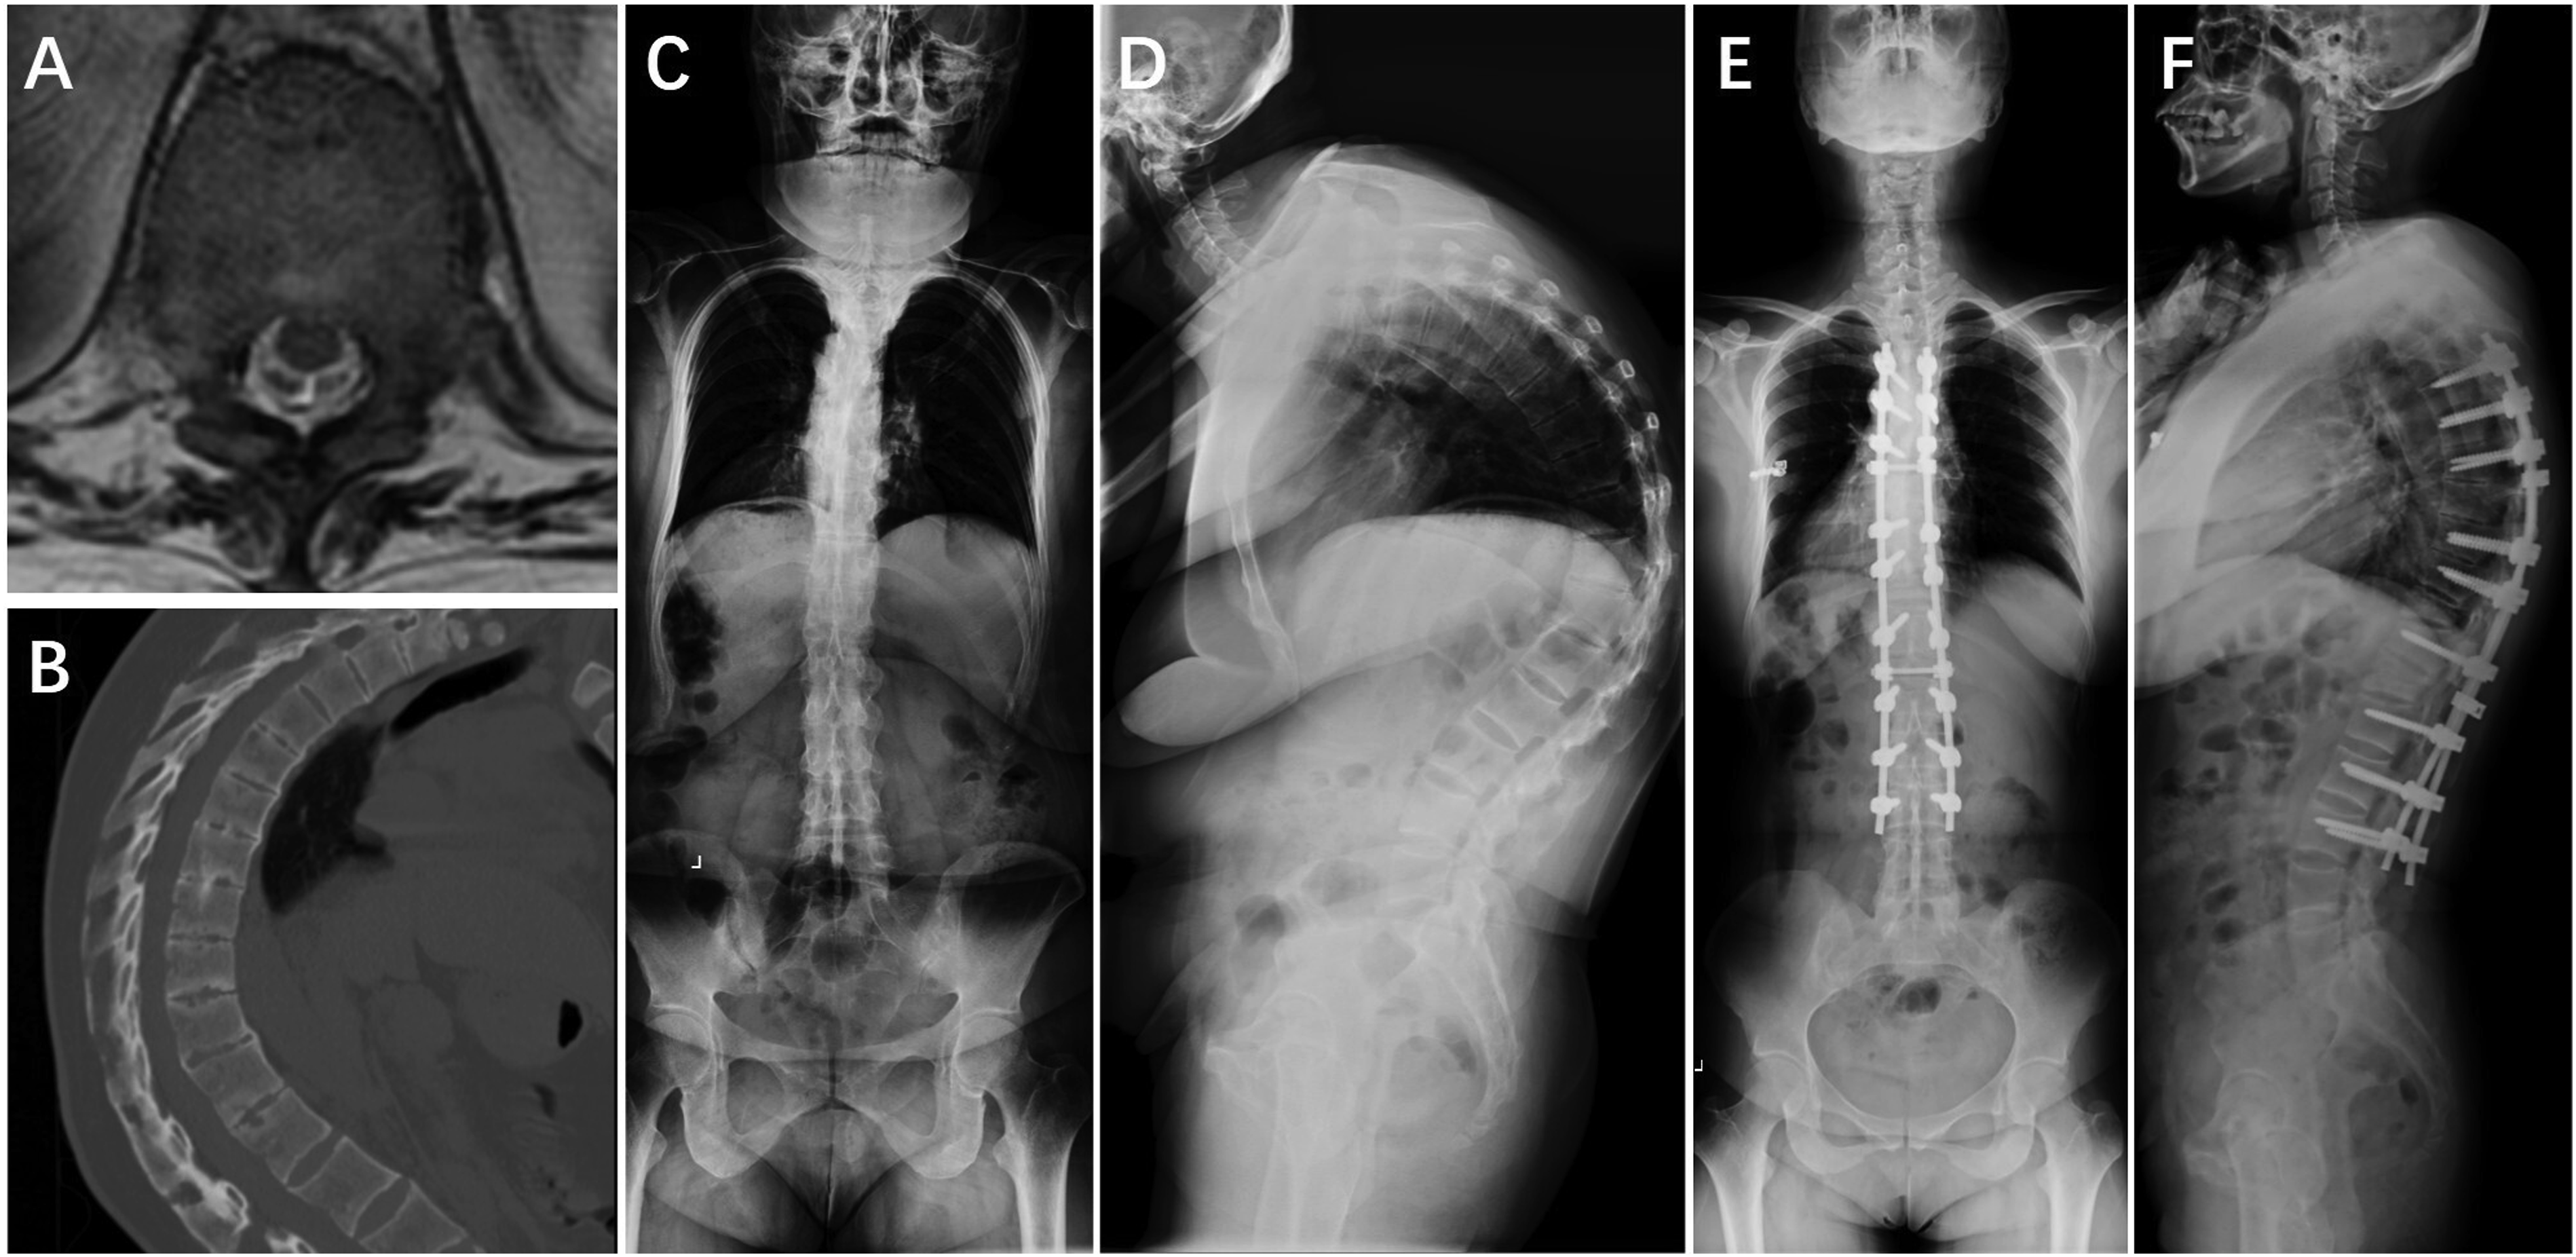
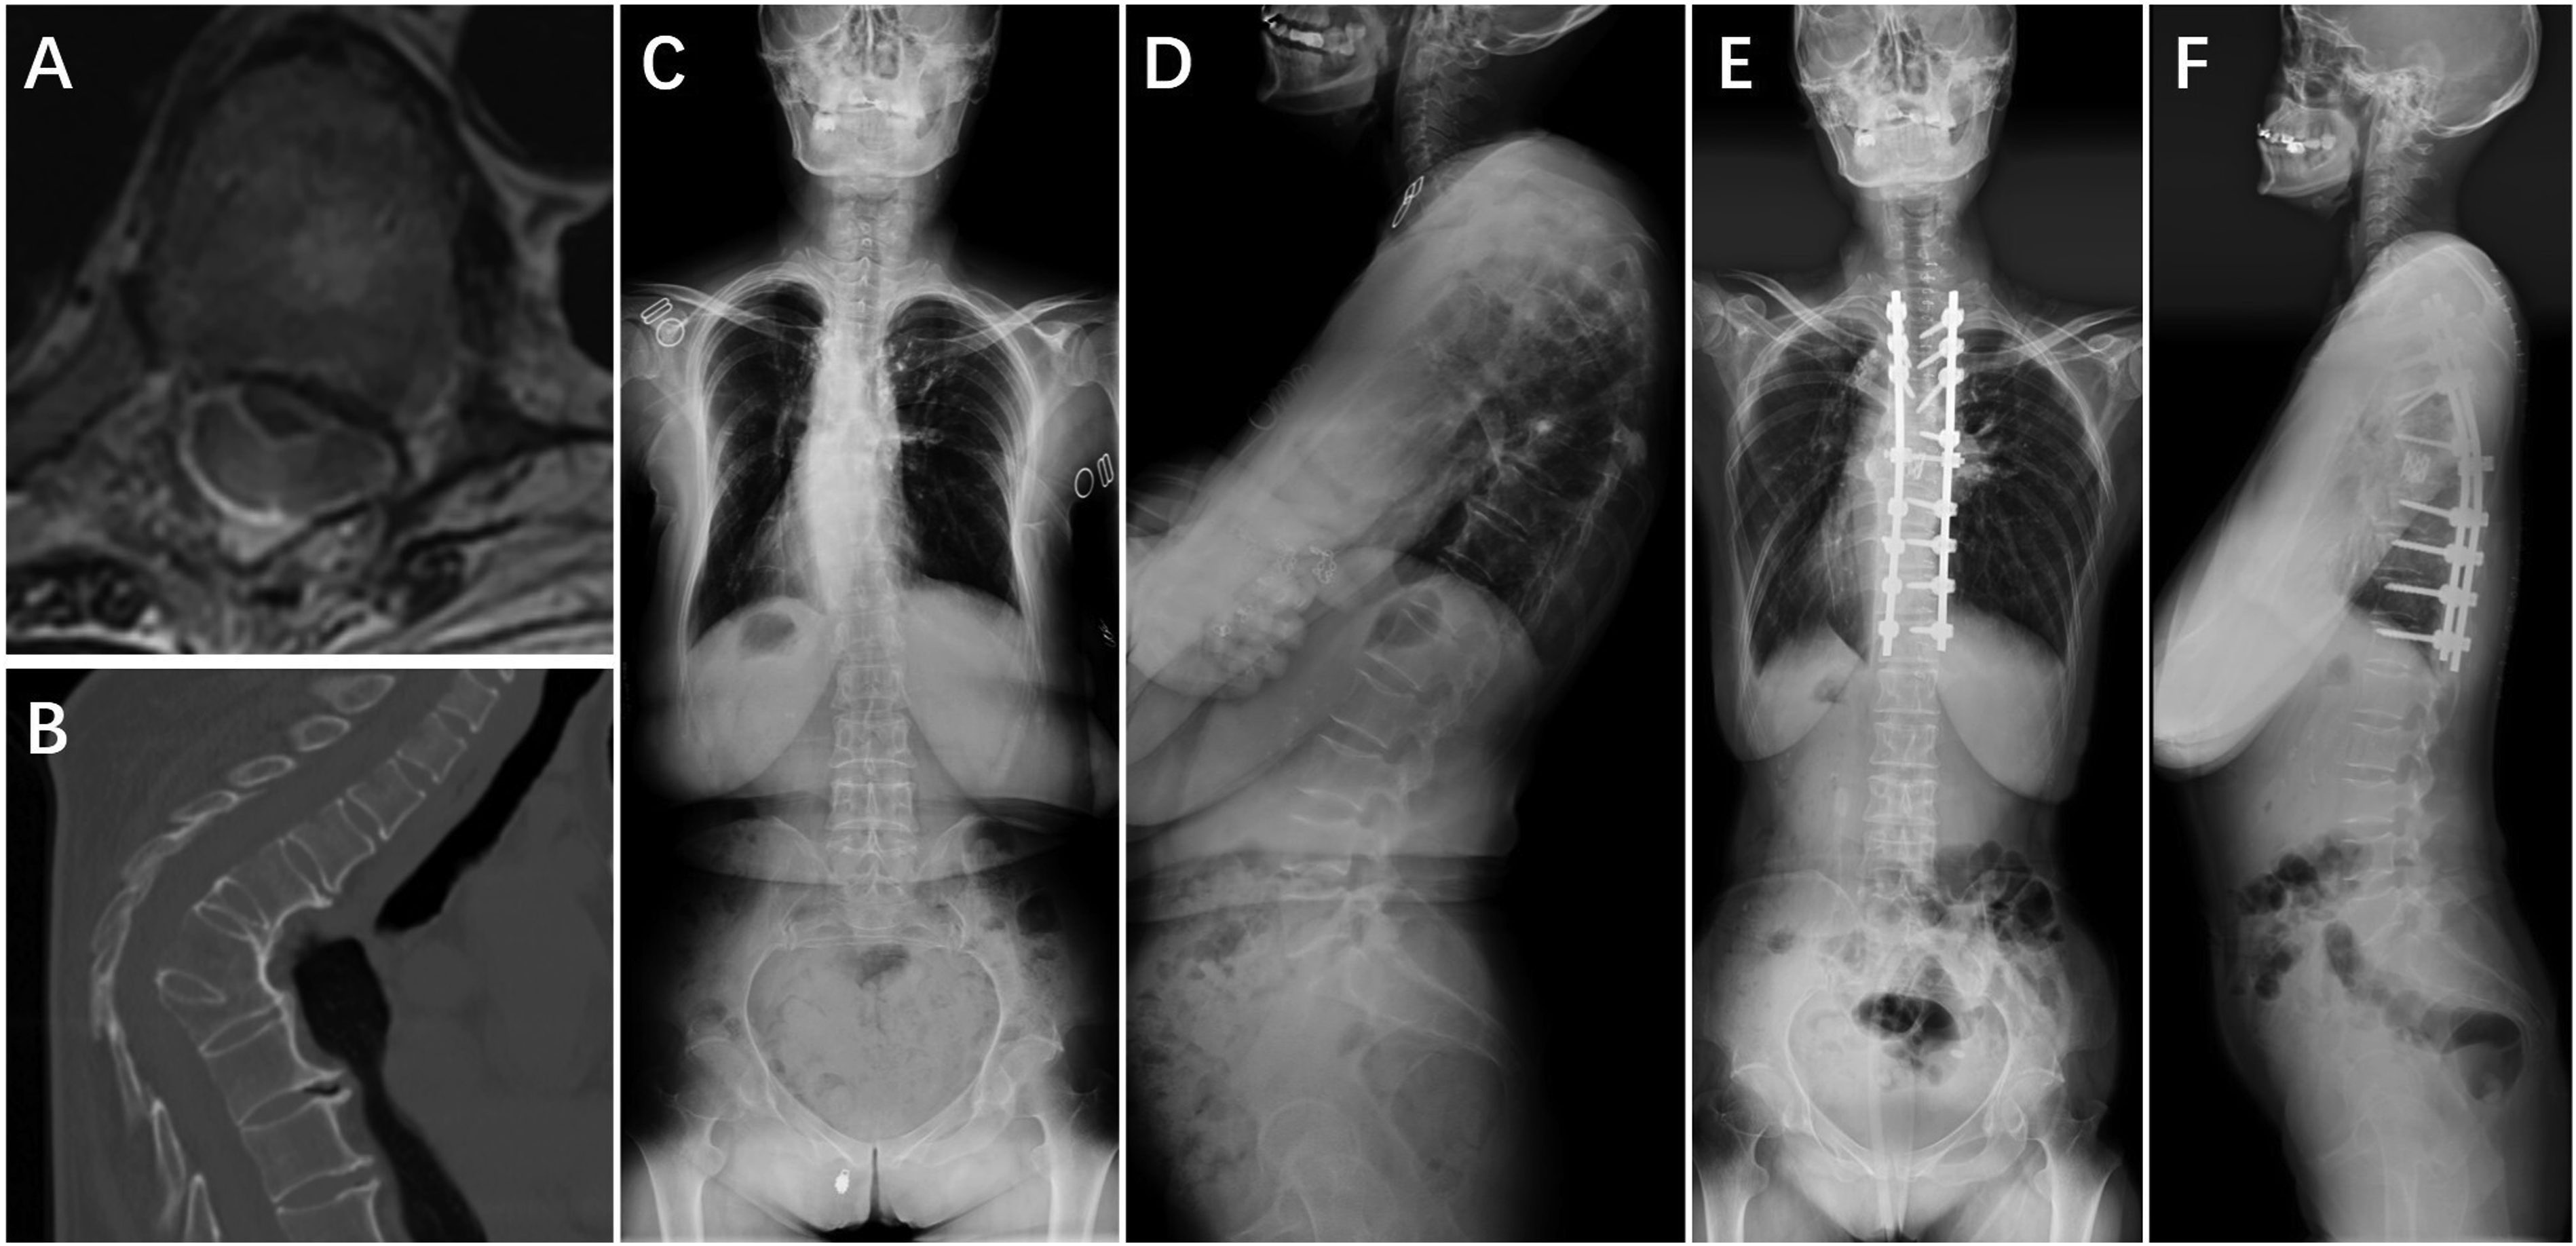
To compare the predictive efficacy of SCDR, the major Cobb angle, and T-DAR for PNDs and to determine the optimal SCDR threshold, ROC curve analysis was performed (Figure 3). The analysis identified an optimal SCDR cutoff value of 42.15%, with an AUC of 0.867 (95% CI: 0.761-0.972), sensitivity of 82.4%, specificity of 88.5%, a PPV of 40%, and an NPV of 98.2%. Although the PPV was relatively low, the high NPV indicates that patients with an SCDR below 42.15% had less than a 2% probability of developing PNDs, underscoring its effectiveness in excluding low-risk cases. Furthermore, the ROC analysis revealed that SCDR outperformed the major Cobb angle (AUC: 0.776, 95% CI: 0.675-0.877) and T-DAR (AUC: 0.769, 95% CI: 0.688-0.850) in predicting PNDs. These findings suggest that SCDR is a more effective predictor of PNDs, highlighting its potential for enhanced clinical risk stratification in patients undergoing spinal deformity correction. Representative cases are shown in Figures 4–6. The receiver operating characteristic (ROC) curve analysis comparing spinal cord deformation rate (SCDR), major Cobb angle, and total deformity angular ratio (T-DAR) in assessing the risk of postoperative neurological deficits (PNDs). The area under ROC curve (AUC) were 0.867 (95% CI: 0.761-0.972) for SCDR, 0.776 (95% CI: 0.675-0.877) for major Cobb angle, and 0.769 (95% CI: 0.688-0.850) for T-DAR. A 15-year-old male patient diagnosed with adolescent idiopathic scoliosis. (A)Preoperative axial T2-weighted MRI showing a round spinal cord morphology with cerebrospinal fluid circumferentially at the apex of the main thoracic curve, classified as Type-A. (B) Preoperative three-dimensional reconstructed CT scan. (C), (D) Preoperative standing anteroposterior and lateral radiographs showing a major Cobb angle of 51.1° and a C-DAR of 5.7. (E), (F) Immediate postoperative standing anteroposterior and lateral radiographs demonstrating significant correction of deformity. The patient underwent Ponte osteotomies and intervertebral space release from T5 to T7, followed by posterior spinal instrumentation/fusion from T2 to T12. No neurological deficits were observed postoperatively. A 40-year-old female patient diagnosed with kyphosis due to ankylosing spondylitis. (A) Preoperative axial T2-weighted MRI showing a round spinal cord morphology without cerebrospinal fluid circumferentially at the apex of the kyphosis, classified as Type-A. (B) Preoperative sagittal CT scan. (C), (D) Preoperative standing anteroposterior and lateral radiographs showing a major Cobb angle of 122.6° and an S-DAR of 10.2. (E), (F) Immediate postoperative standing anteroposterior and lateral radiographs demonstrating significant correction of deformity. The patient underwent Smith-Petersen osteotomies from T6 to T7, and pedicle-subtraction osteotomies at T10 and T12, followed by posterior spinal instrumentation/fusion from T4 to L3. No postoperative neurological deficits were observed. A 43-year-old female patient diagnosed with tuberculosis-related kyphosis. (A) Preoperative axial T2-weighted MRI demonstrating compression and deformation of the spinal cord against the vertebral body, with no intervening cerebrospinal fluid, classified as Type-B. (B) Preoperative sagittal CT scan. (C), (D) Preoperative standing anteroposterior and lateral radiographs showing a major Cobb angle of 82.8° and an S-DAR of 16.6. (E), (F) Postoperative standing anteroposterior and lateral radiographs taken before discharge demonstrating significant correction of deformity. The patient underwent vertebral column resection from T7 to T8, followed by posterior spinal instrumentation/fusion from T2 to T12. Postoperatively, the patient experienced a decrease in left lower limb muscle strength from grade IV to grade II, along with significant sensory deficits below the knee. Following in-hospital physiotherapy, her neurological function gradually recovered to preoperative levels.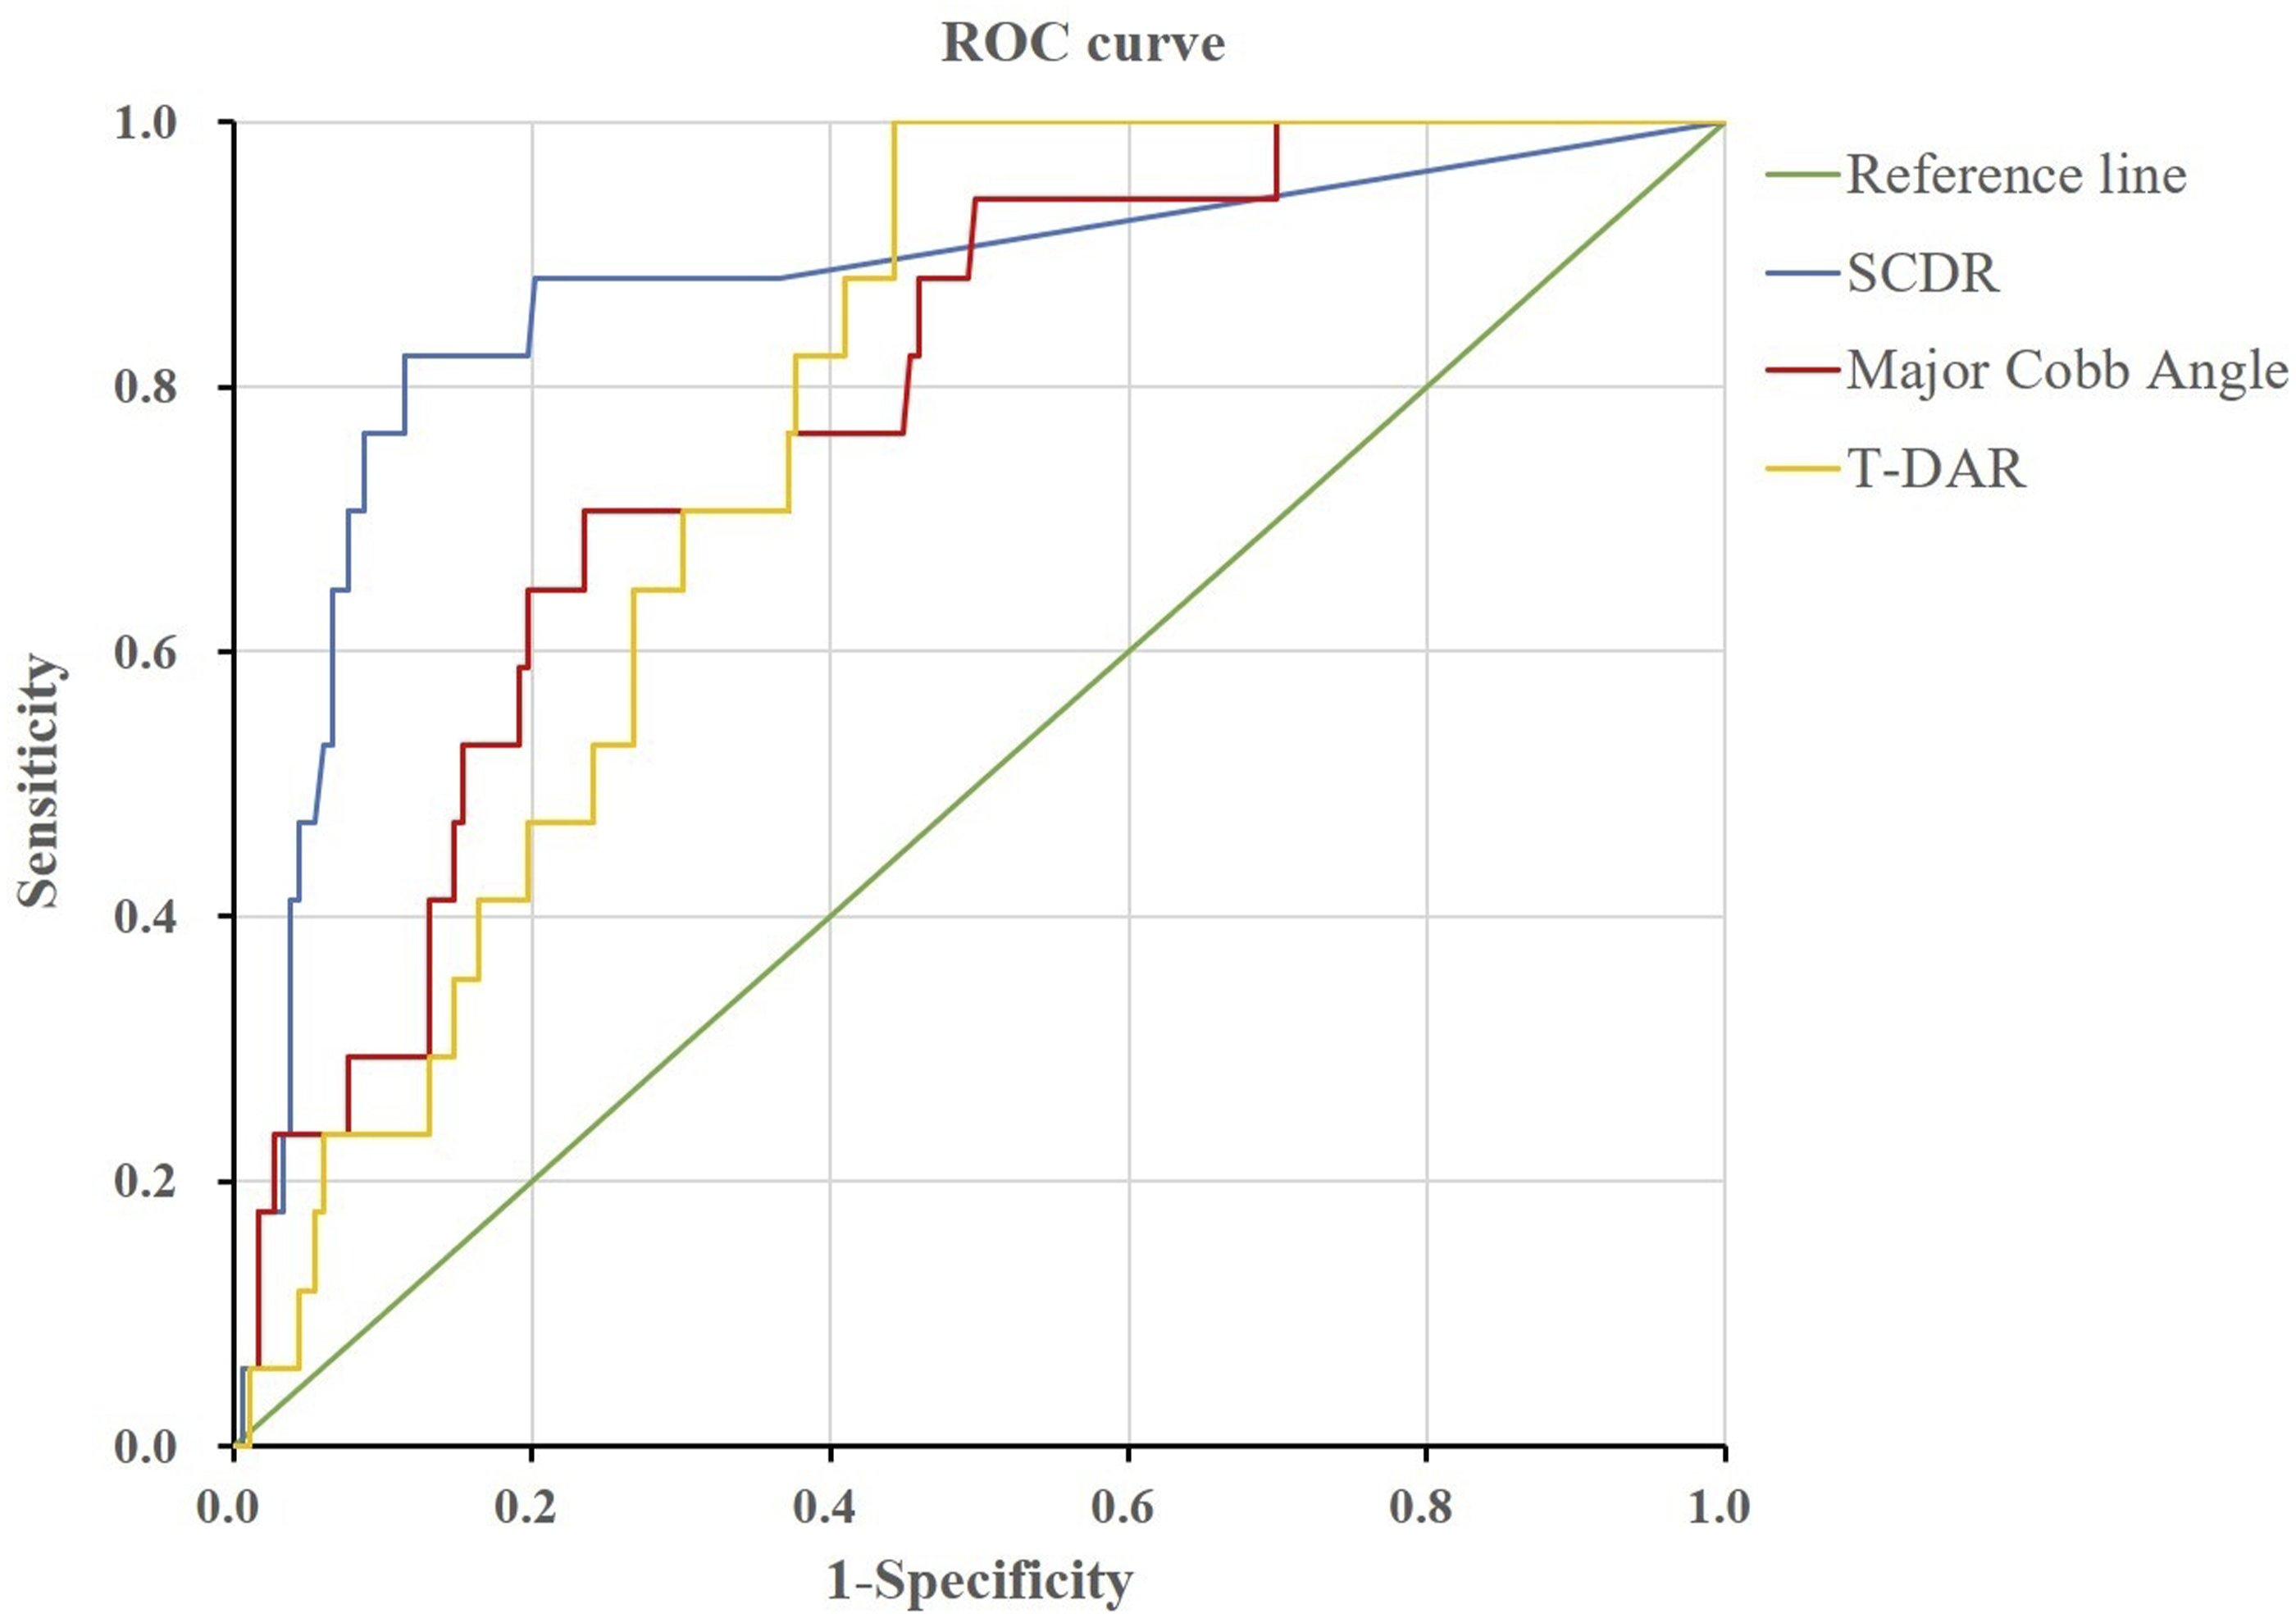
Discussion
The risk of PNDs is one of the most critical concerns for patients undergoing corrective surgery for spinal deformity. 4 Accurately assessing this risk preoperatively remains a significant challenge for spinal surgeons. Previous studies have found several preoperative risk factors associated with PNDs in corrective surgery, including older age, larger Cobb angle or DAR , longer operative time, greater EBL and 3CO.7-10,15,16 More recently, the SCSCS was proposed and validated as an effective tool for predicting IONM data loss during spinal deformity correction.1,4,14 However, we found that patients with SCSCS type-1 and type-2 spinal cords exhibited no visible spinal cord deformation, and the incidence of IONM alerts and/or PNDs did not significantly differ between these two groups. Based on these findings, we reclassified SCSCS Type-1 and Type-2 spinal cords as Type-A, while categorizing SCSCS Type-3 spinal cords as Type-B. The primary objective of this study was to validate the impact of different spinal cord types on PNDs and further explore the role of SCDR in predicting PNDs in patients with type-B spinal cords. By identifying patients at greater risk of spinal cord dysfunction, our findings provide valuable insights for preoperative risk assessment and surgical decision-making in spinal deformity correction.
In our study, the incidence of PNDs was 8.5%, which aligns with previous findings. 4 The reported incidence of PNDs in our study is lower than that in some other studies, likely because we focused exclusively on postoperative spinal cord injury, whereas many prior studies included both spinal cord and nerve root injuries.2,3,6 Our results demonstrate that the risk of PNDs is significantly higher in patients with type-B spinal cords, a finding that is consistent with previous research.1,4,14 Compared with type-A spinal cords, type-B spinal cords exhibit visible compression and deformation, which may compromise spinal cord blood supply and cause adhesions between the dura and the concave tissue, ultimately increasing the risk of PNDs. 14
Consistent with previous studies, our finding indicate that patients with type-B spinal cords have larger DAR and major Cobb angles, and this trend still exists postoperatively.1,4,14 Previous studies have also shown that a larger sagittal Cobb angle was significantly associated with an increased risk of PNDs during kyphotic deformity correction surgery. 9 Additionally, patients with T-DAR ≥25 or S-DAR ≥15 who received VCR have been reported to have a higher risk of PNDs. 10 Another study found that patients with S-DAR >7 or T-DAR >27 were at a higher risk of IONM alerts during posterior spinal fusion for severe pediatric spinal deformity without 3CO. 17 However, our study highlights that SCDR is a stronger predictor of PNDs in patients with type-B spinal cords compared to the major Cobb angle or DAR. Specifically, for every 1 % reduction in the spinal cord’s cross-sectional area at the apex of the deformity (compared to the adjacent normal spinal cord), the risk of PNDs increases by 7.6 %, and when SCDR ≥42.15%, the risk of PNDs increased substantially. This result suggests that in type-B spinal cord patients, the major Cobb angle and DAR have already reached a threshold that places them in the “danger zone” of PNDs, making SCDR a crucial factor for predicting spinal cord functional impairment during corrective surgery.
Furthermore, our study found that the risk of PNDs in patients with type-B spinal cords is 12.99 times higher than in those with type-A spinal cords. Given this significant risk elevation, we suggest that when managing patients with a Type-B spinal cord, surgeons should consider tailored strategies to minimize neurological risk. These may include preoperative traction to improve the deformity angle and potentially reduce the osteotomy grade; Comprehensive preoperative preparation to ensure adequate blood availability and optimal management of comorbid conditions; And the use of advanced intraoperative techniques, such as navigation-assisted screw placement and digital technology-guided osteotomy and correction. Furthermore, enhanced multimodal neuromonitoring with a lowered alert threshold, maintenance of appropriate mean arterial pressure to prevent spinal cord hypoperfusion, and the consideration of staged osteotomy and correction procedures may further mitigate the risk of neurological complications. These strategies underscore the importance of individualized surgical planning based on spinal cord morphology to ultimately improve patient outcomes.
The results of this study showed that 16 out of 144 patients (11.1%) who underwent 3CO developed PNDs, while only 1 out of 56 patients (1.8%) who underwent PCO experienced PNDs. This finding suggests that 3CO carries a significantly higher risk of PNDs. Previous studies have also demonstrated that PCO has a lower risk of neurological complications compared to 3CO.18,19 3CO is typically performed to correct severe or rigid spinal deformities and is associated with a substantial risk of neurological complications, particularly during osteotomy closure.20,21 The correction of severe spinal deformities may impair spinal cord perfusion and/or lead to spinal cord stretch-induced dysfunction. 1 Previous studies have emphasized the importance of maintaining adequate MAP, as increasing MAP when IONM data is lost can often restore spinal cord function.22,23 To mitigate the risks associated with 3CO, alternative techniques have been explored. Studies have shown that approaches such as transvertebral transposition of the spinal cord,24,25 preoperative halo-gravity traction,26,27 and postoperative halo-femoral traction following posterior spinal release, 28 may serve as effective substitutes for 3CO, with relatively lower risks of PNDs. Additionally, recent study has demonstrated that performing 3CO with the assistance of a personalized 3D-printed guide template can reduce the risk of PNDs and shorten operative time in the correction surgery of severe and complex adult spinal deformities. 29
Compared to non-VCR-based techniques, the VCR-based technique have been associated with a 6.78-fold higher incidence of neurological complications. 21 However, in our study, univariate analysis in type-B spinal cord patients showed no significant effect of VCR on PNDs. One possible explanation is that most previous studies compared the risk of PNDs between VCR and low-grade osteotomies., whereas in our study, all 15 patients with neurological dysfunction had undergone 3CO, and the majority of type-B spinal cord patients ( 68/82, 83.0 % ) also underwent 3CO. This suggests that the severity of spinal cord deformation and the necessity for 3CO itself may be the dominant factors influencing PND risk, rather than the specific use of VCR. Furthermore, previous study has confirmed no significant difference in major surgical complications between the PSO and VCR groups. 30 A modified posterior vertebral column resection (PVCR) technique, proposed by Garg et al., has been reported to further reduce the risk of PNDs during surgery compared to the conventional technique. 31
In univariate analysis, patients with PNDs exhibited longer operative time and higher EBL, which is consistent with previous studies showing that patients with IONM alert also had significantly longer operative time and greater EBL than those without alert. 23 However, these factors did not remain significant in multivariate logistic regression analysis. This may be attributed to the fact that prolonged operative time and increased blood loss can lead to insufficient spinal cord perfusion, which may subsequently trigger IONM alerts. 23 In response to such alerts, intraoperative interventions—such as increasing the MAP, administering blood transfusions, and promptly concluding the surgery—are implemented, thereby mitigating the direct impact of these factors on neurological outcomes. Moreover, operative time and EBL may be confounded by other critical variables, including the severity of spinal cord deformation, the complexity of the surgical techniques employed, and the experience of the surgical team, which may more directly influence the risk of PNDs.
This study has several limitations. Firstly, differences in the location of the deformity apex, corresponding surgical strategies, and osteotomy techniques among patients may have introduced deviations in the results. Secondly, spinal deformity is inherently three-dimensional, and due to variations in MRI technicians’ operating habits and current technological limitations, the cross-sectional area of the spinal cord may not always be measured on a perfectly vertical section. Moreover, although we standardized our measurements using T2-weighted imaging, the use of MRI scanners from different manufacturers and with varying field strengths (1.5 T vs 3.0 T) may have introduced some measurement variability, which should be taken into account when interpreting our findings. Thirdly, this study was limited by a relatively small sample size of patients with PNDs (n = 17), which may affect the robustness of the multivariate analysis. Future studies with larger cohorts are warranted to further validate and extend these findings. Finally, preoperative evaluation of spinal cord morphology was limited to the axial plane on T2-weighted MRI, including sagittal and coronal planes could have provided further insights into spinal cord deformation. Despite these limitations, this study provides practical evidence for exploring the risk of PNDs in patients with different degrees of spinal cord deformation and offers a framework for the quantitative evaluation of spinal cord deformation. With advancements in MRI imaging and three-dimensional reconstruction technology, more accurate spinal cord area measurements could be achieved using artificial intelligence-based methods. In the future, spinal cord deformation assessment may become an essential criterion for neurological risk stratification and spinal deformity correction management.
Conclusion
Patients with type-B spinal cords exhibited more severe spinal deformities, a higher proportion of VCR procedures, longer operative time, greater intraoperative blood loss, and a significantly higher risk of PNDs. When SCDR ≥42.15%, the risk of PNDs increased substantially. Although MRI-based spinal cord deformation is not the sole determinant of PNDs, it has shown promising potential in preoperative neurological risk assessment for patients undergoing spinal deformity correction. Therefore, we recommend incorporating spinal cord deformation and SCDR as key risk stratification criteria in surgical decision-making and deformity correction management, following further validation and reliability testing in future research.
Footnotes
Author contributions
JN designed the study, collected the data, analyzed the data, and wrote the manuscript. LY, JZ, and YL collected the data. ZC supervised the study. YZ designed the study and revised the manuscript. All authors have read and approved the submitted version of the manuscript.
Declaration of conflicting interests
The author(s) declared no potential conflicts of interest with respect to the research, authorship, and/or publication of this article.
Funding
The author(s) disclosed receipt of the following financial support for the research, authorship, and/or publication of this article: The study received funding support from (1) National Natural Science Foundation of China (Grant Number: 82272540); (2) Key Clinical Projects of Peking University Third Hospital (Grant Number: BYSYZD2022028); (3) Beijing Science Fund Projects (Grant Number: L232127).
Ethical Statements
Data Availability Statement
The datasets generated during and/or analyzed during the current study are not publicly available due to the privacy concerns of the data but are available from the corresponding author on reasonable request.