
Abstract
Study Design
Retrospective study.
Objectives
The current study compares the ability of the modified Frailty Index (mFI), the American Society of Anesthesiologists (ASA) classification, the modified Charleston Comorbidity Index (mCCI), the American College of Surgeons Surgical Risk Calculator (SRC), and the Fusion Risk Score (FRS) to predict perioperative outcomes.
Methods
Comorbidity indices were calculated for patients undergoing elective thoracic and lumbar spinal fusion at a single institution and assessed for their discriminative ability in predicting the desired outcomes using an area under the curve (AUC) analysis.
Results
393 patients met the inclusion and exclusion criteria. Patients being treated for adult spinal deformity (ASD) had the highest rate of complications (44.4%). The FRS had acceptable discrimination (AUC >0.7) and the highest ability among the methods studied to predict any adverse effects, new neurological deficit, return to OR within 90 days, and surgical site infection. It had good discrimination ability (AUC >0.8) predicting durotomy, respiratory failure (RF) requiring intubation, hemodynamic instability, and sepsis. The SRC had acceptable discrimination and highest ability to predict deep venous thrombosis (DVT). The mCCI had excellent and the highest ability to predict acute renal failure (ARF). For the other outcomes, the indices had either poor predictive ability (AUC 0.6-0.7) or no discriminative ability (AUC <0.6).
Conclusions
The FRS had a better ability than the ASA, mCCI, mFI, and SRC to predict the most perioperative adverse events and reoperation. Further study is needed to develop preoperative indices with better predictive ability of postoperative outcomes.
Introduction
The number of spinal fusion procedures performed in the United States has increased significantly over the last 30 year. 1 A variety of factors have likely contributed to the increased utilization of fusion procedures, including an increase in the life expectancy of the population, improvements in surgical technique, medical management, and postoperative care.1,2 Elderly patients, generally defined as older than 65 years, often have more comorbidities than younger cohorts, increasing their risk for postoperative complications and mortality.3,4 Therefore, early identification of patients at risk for medical and surgical complications can help optimize the safety and efficacy of surgical decision making.
Preoperative strategies to identify patients at elevated risk of postoperative complications are crucial to assist providers in the safe selection of surgical candidates. Many preoperative indices have been developed to help physicians and patients understand the risks of surgery. Some of the most utilized indices are the modified-Frailty Index (mFI), the modified Charlson Comorbidity Index (mCCI), and the American Society of Anesthesiologists (ASA) classification. 5
The Canadian Study of Health and Aging Frailty Index (FI) was created in 2001as an index of 70 variables that measured cumulative deficits related to functional, physical, cognitive, and social domains. 6 The mFI is a shortened version that includes 11 items on the FI that were matched to variables included in national databases and has been validated in several surgical specialties, including spine surgery.7,8
The Charlson Comorbidity Index (CCI) is a composite score of age and comorbid conditions originally developed to predict 10-year all-cause mortality in medical patients. The modified version of the CCI (mCCI) allows the use of this index across different datasets. 9 The mCCI has been shown to have a correlation with outcomes after spinal surgery.5,10
The American Society of Anesthesiologists (ASA) physical status classification system was developed with the goal of describing a patient’s physiological reserve. 11 ASA class has been correlated with complications in patients undergoing spinal surgery. 12
The American College of Surgeons (ACS) National Surgical Quality Improvement Program (NSQIP) surgical risk calculator (SRC) utilizes 21 patient related variables as well as the planned procedure to predict risk of complications within the first 30 days following surgery and length of stay. 13 It has been previously used to assess risk of complications in patient undergoing spine surgery with mixed outcomes.14,15
The Fusion Risk Score (FRS) was developed by Hartin et al 16 to quantify the risk of developing complications in the first 90-days after spinal fusion surgery in patients over the age of 65. It uses several independent variables to calculate a risk score that is predictive of 90-day complications, the risk of intensive care unit (ICU) admission, operative time, blood loss and hospital length of stay (LOS) after thoracolumbar spinal fusion surgery. 17 To our knowledge, no study has evaluated how the FRS performs in its predictive ability when compared to these other indices.
The purpose of this study is to compare the performance of the FRS to the mFI, mCCI, the SRC, and ASA in the prediction of postoperative adverse events, readmissions, and reoperations following elective thoracic and lumbar spine fusion procedures in elderly patients.
Methods
This study was approved by the Institutional Review Board at Allina Health (IRB 19512913). Need for consent was waived as this study was considered minimal risk for patients. The records of all patients older than 65 undergoing elective thoracic or lumbar spinal fusion between January 2019 and June 2020 at a single institution were reviewed. Patients were excluded from the study if they had incomplete information prohibiting the calculation of the different scores being assessed, or were undergoing fusion due to trauma, tumor, or infection. Patients were included in the cohort based upon Current Procedural Terminology codes for thoracic and lumbar fusion with or without interbody (22558, 22585, 22600, 22612 22614, 22630, 22632, 22633, 22634, 22610, 22556)
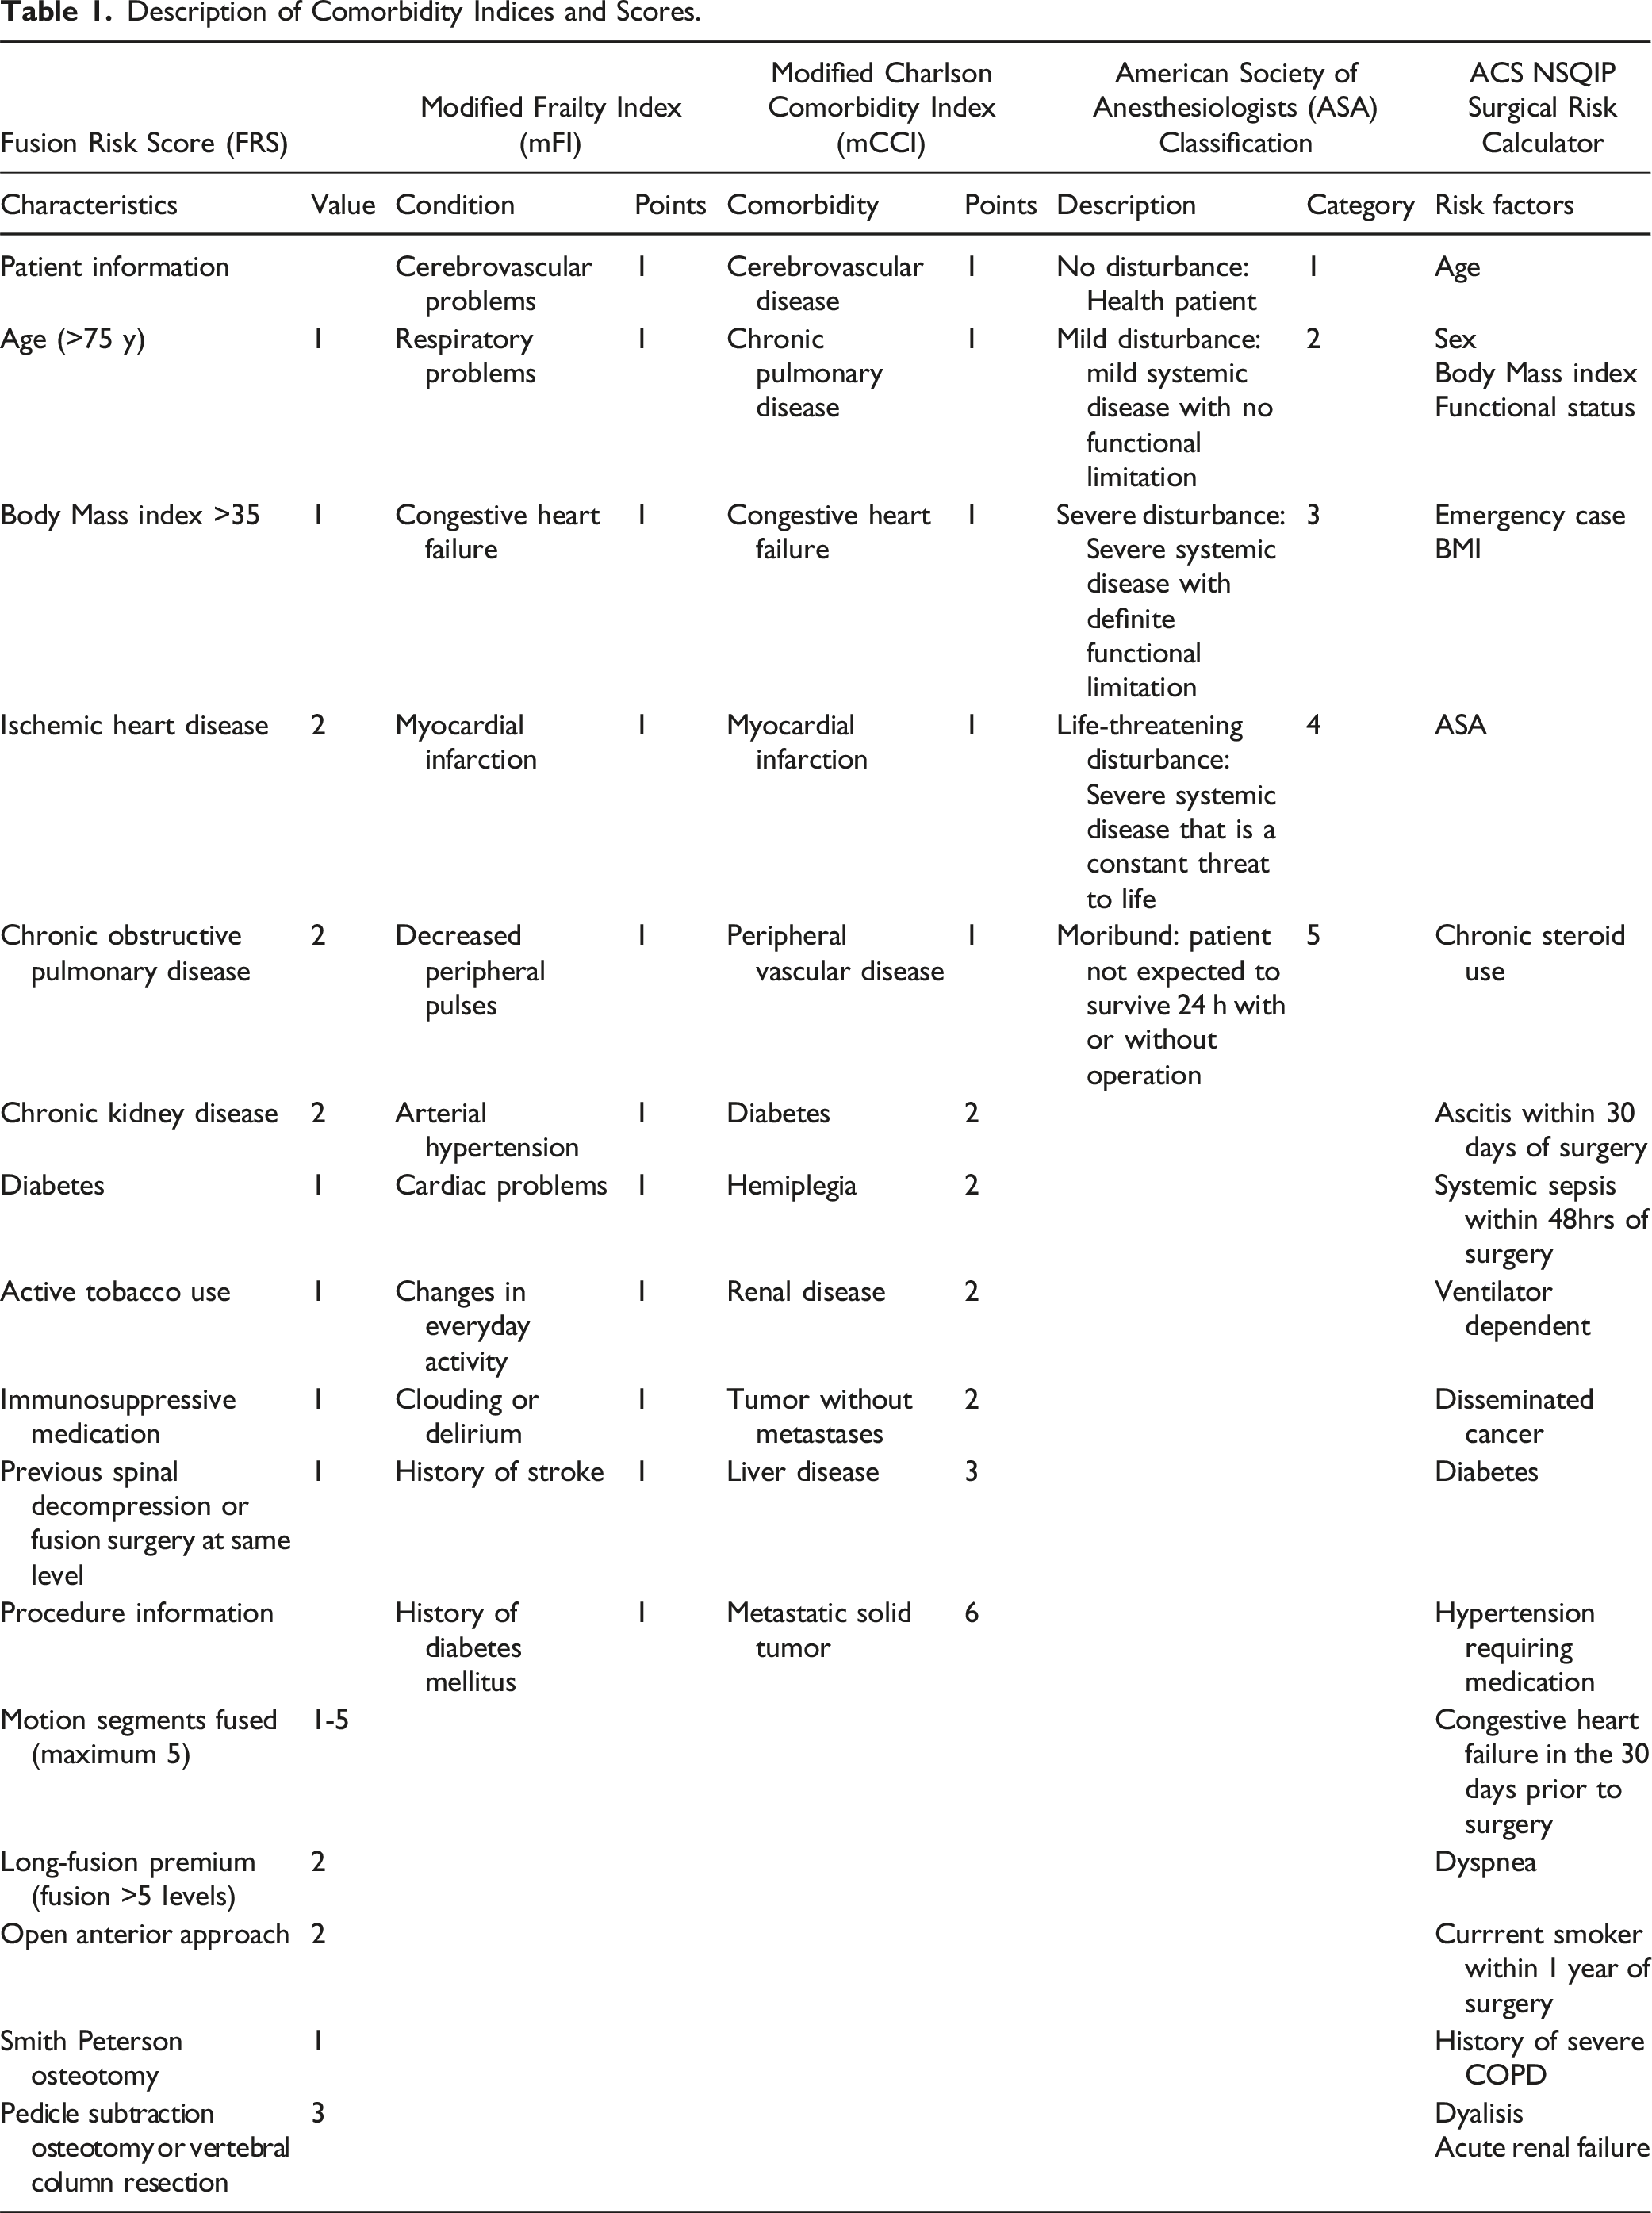
Patient and Procedural Information
Description of Comorbidity Indices and Scores.
Outcomes
Complications recorded included cardiac arrest, death within 90 days of surgery, deep vein thrombosis, myocardial infarction, postoperative respiratory failure (RF) requiring intubation, RF not requiring intubation, pulmonary embolism, return to the operating room within 90 days of surgery, durotomy, new postoperative neurological deficit, sepsis, stroke, hemodynamic instability requiring fluid resuscitation and/or vasopressors (if documented on assessment by internal medicine, intensivist, or surgical teams and excluding orthostatic hypotension), acute kidney injury, respiratory failure, cardiac arrythmia, pneumonia, surgical site infection, and urinary tract infection occurring in the first 90 days after surgery. Any adverse event captured patients developing one of the complications recorded (not including emergency department visits, readmission, or discharge other than home), but not in additive fashion, meaning that patients experiencing multiple complications were counted as a single occurrence of any adverse effect. Secondary outcomes included extended length of stay (ELOS), which was defined as LOS greater than or equal to the 75th percentile, 5 discharge to higher level of care, 90-day readmission,90-day emergency department visits, and 2-year reoperation. The Clavien-Diendo Classification was used to grade the severity of adverse events.18,19 If the same patient experienced more than one complication, the grade of the most severe was selected.
Clinical outcomes including the Oswestry Disability Index (ODI), Visual Analog Score (VAS) for back and leg pain were recorded preoperatively and at the 2-year follow up. Radiographic outcomes recorded included successful fusion at the 2-year follow up, occurrence of pseudoarthrosis, rod breakage, or screw loosening. Radiographic assessment of fusion was performed on dynamic radiographs and CT scans, when available, using the modified Brantigan-Steffee-Fraser scale and findings were categorized as grades I (radiographic pseudoarthrosis), II (indeterminate fusion), and III (solid radiographic fusion). 20
Statistical Analysis
The ability of each score to predict the predetermined outcomes was assessed by using the area under the curve (AUC) from a receiver operating characteristics (ROC) curve analysis and 95% confidence intervals (95% CIs). The AUC is a commonly used measure to evaluate how well a test correctly identifies individuals with a given outcome or diagnosis vs those without it. 21 It can be interpreted as the probability that a randomly chosen diseased subject is rated or ranked as more likely to be diseased or have a given outcome than a randomly chosen nondiseased subject. 22 This interpretation is based on nonparametric Mann-Whitney U statistics that is used in calculating AUC. 22 The higher the AUC, the better the test’s ability to predict the outcome being evaluated. When used in diagnostic testing, an AUC of 0.9-1 is considered excellent, 0.8-0.9 good, 0.7-0.8 fair or acceptable, 0.6-0.7 poor, and 0.5-0.6 a non-predictor. 23 If there was overlap between the prognostic ability of these scores, the statistical difference was assessed using the DeLong method for Correlated ROC curves. 24
Chi-square or Fisher exact tests were used to evaluate categorical variables and the unpaired t test or Mann-Whitney rank-sum test for continuous variables as appropriate. A backward stepwise logistic regression analysis was performed, and odds ratios were calculated based on regression coefficients in the final multivariable model. The level of significance was set at a two-sided alpha of 0.05. SPSS version 29.0 (IBM Corporation, 2021, Armonk, NY, USA) was utilized for all statistical analyses.
Results
A total of 421 patients underwent elective thoracic and lumbar fusion between January 2019 and June 2020. Of these, 393 met inclusion and exclusion criteria and were included in the analysis (Figure 1. Patient flow diagram). The average age was 72.7 ± 5.4 years (mean ± standard deviation); average BMI was 31.1 ± 12.6 kg/m2; 55.9% of patients were women. Fifty-one percent of patients had undergone previous spine surgery at the same or adjacent level. Patient flow diagram.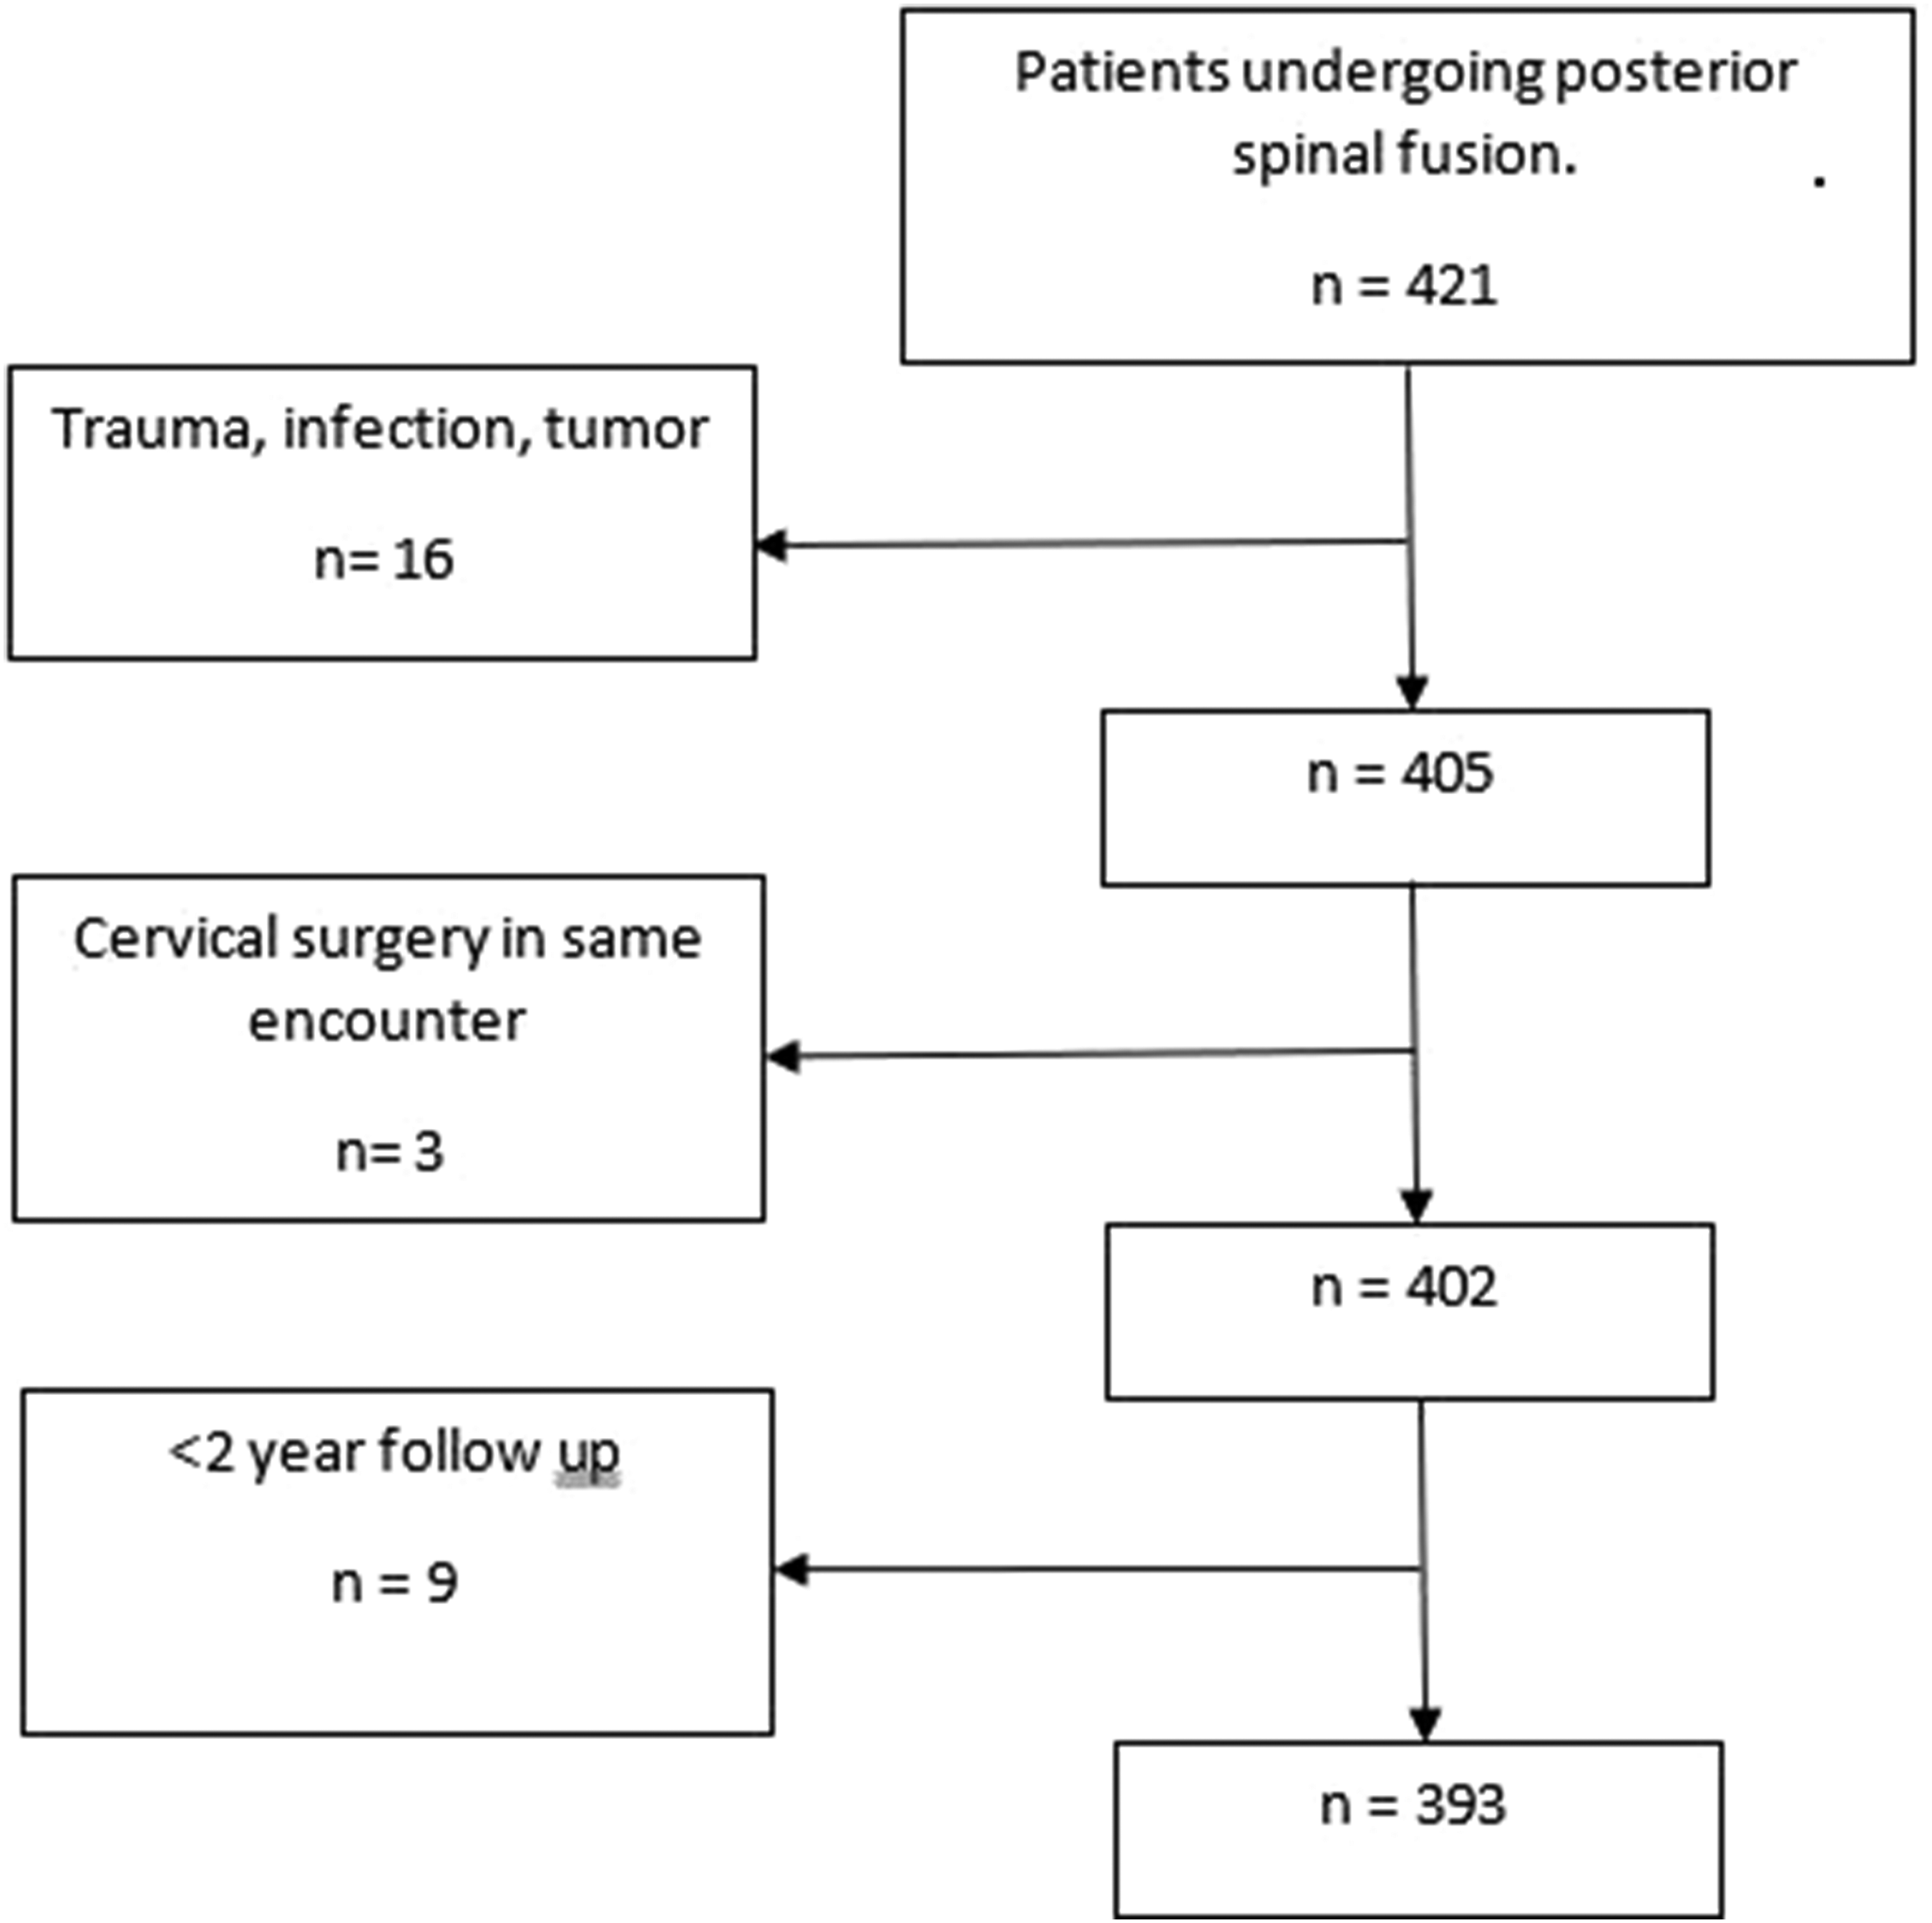
Patient Distribution by Diagnosis and Index Score.
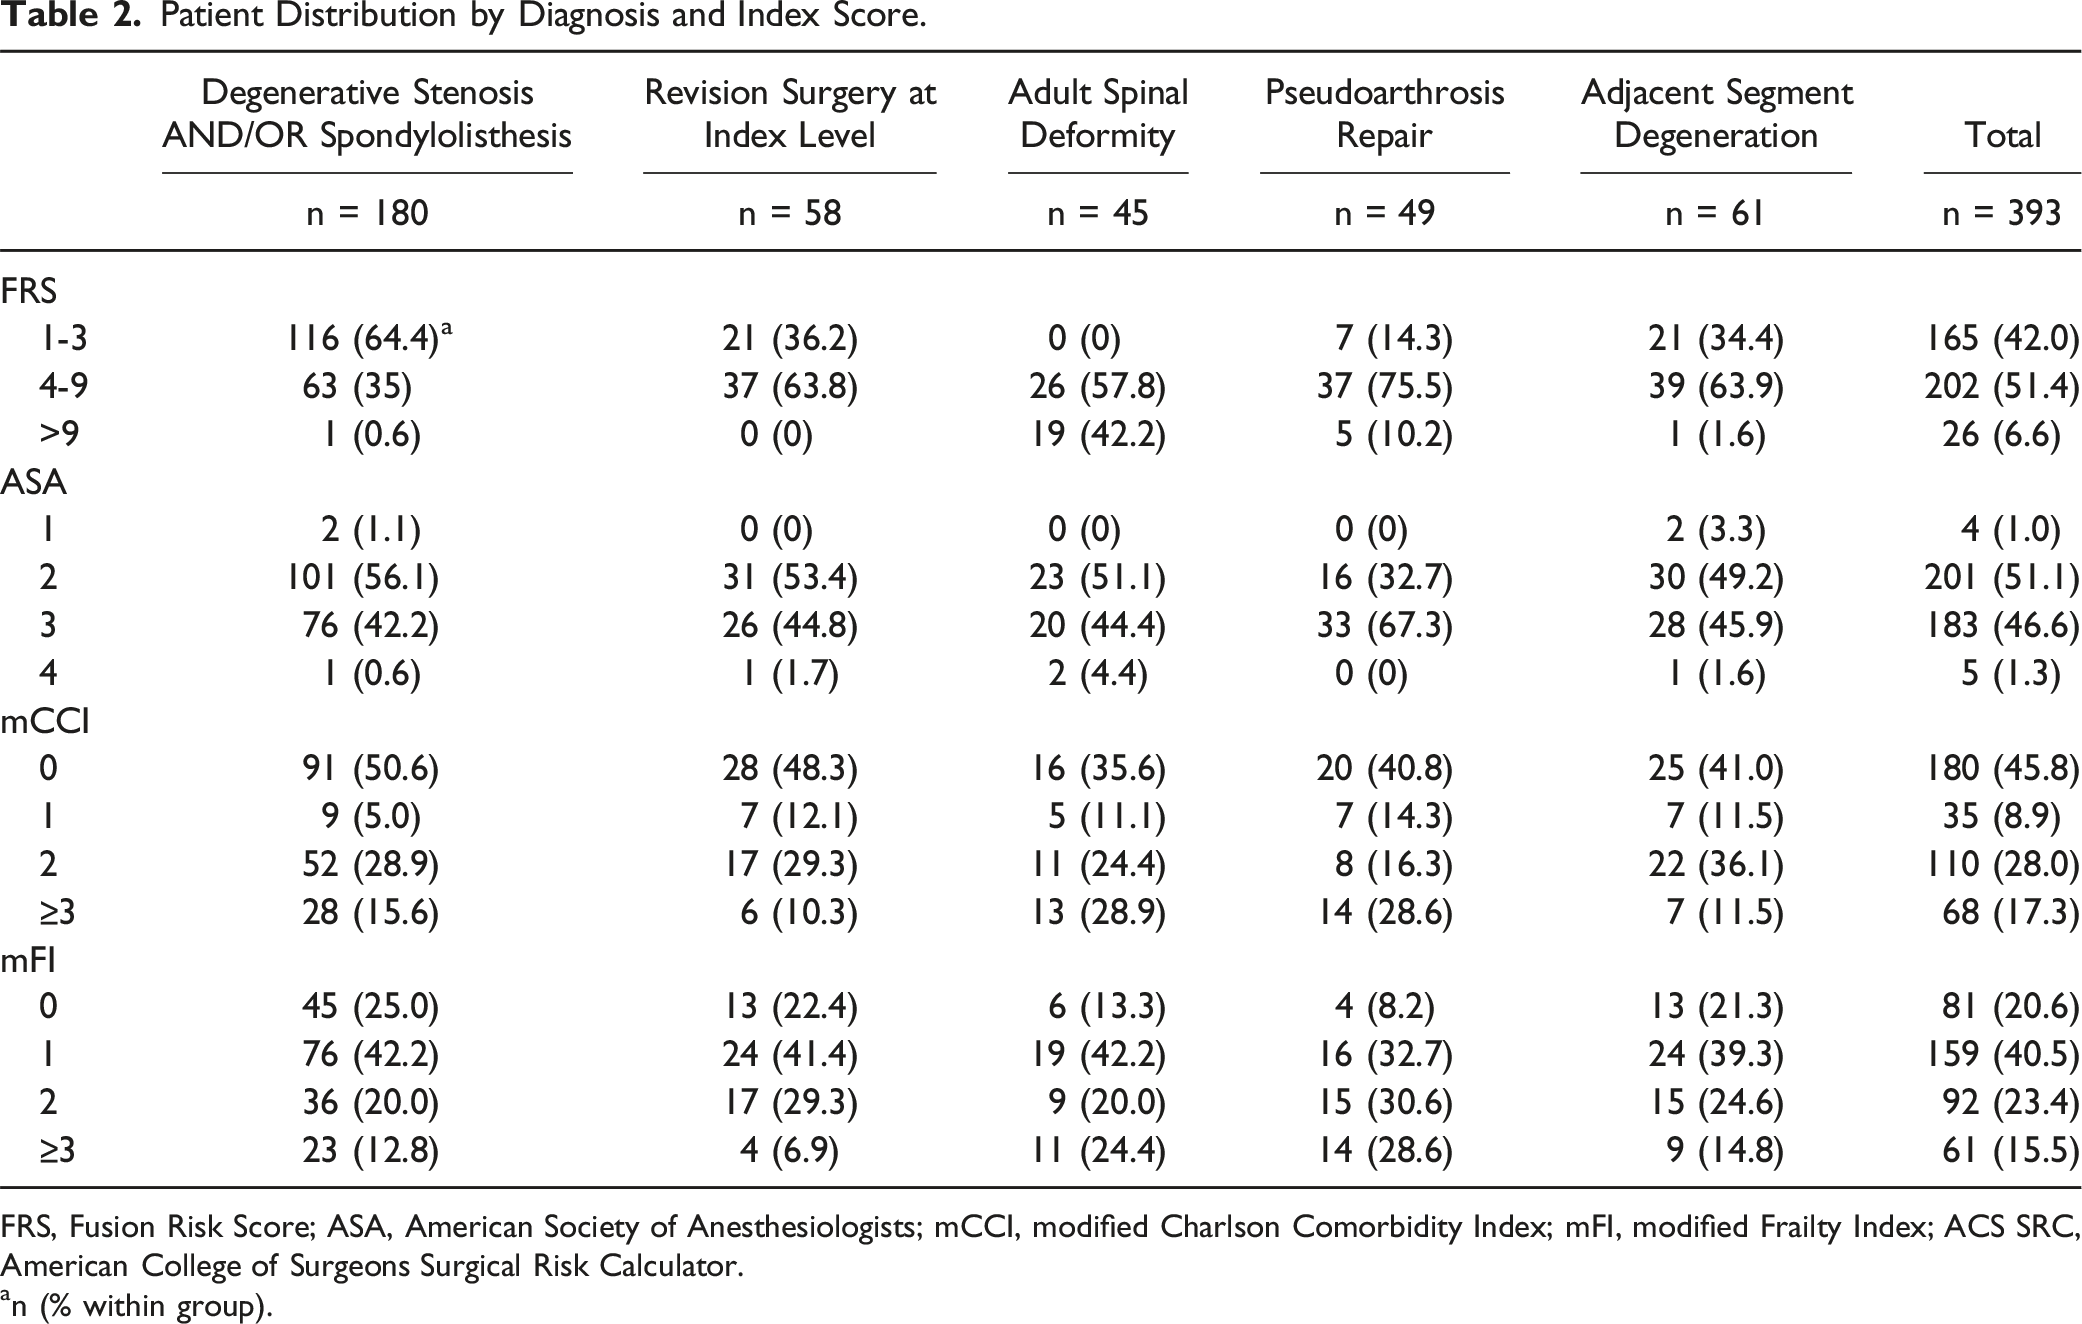
FRS, Fusion Risk Score; ASA, American Society of Anesthesiologists; mCCI, modified Charlson Comorbidity Index; mFI, modified Frailty Index; ACS SRC, American College of Surgeons Surgical Risk Calculator.
an (% within group).
Complications by Index Classification.
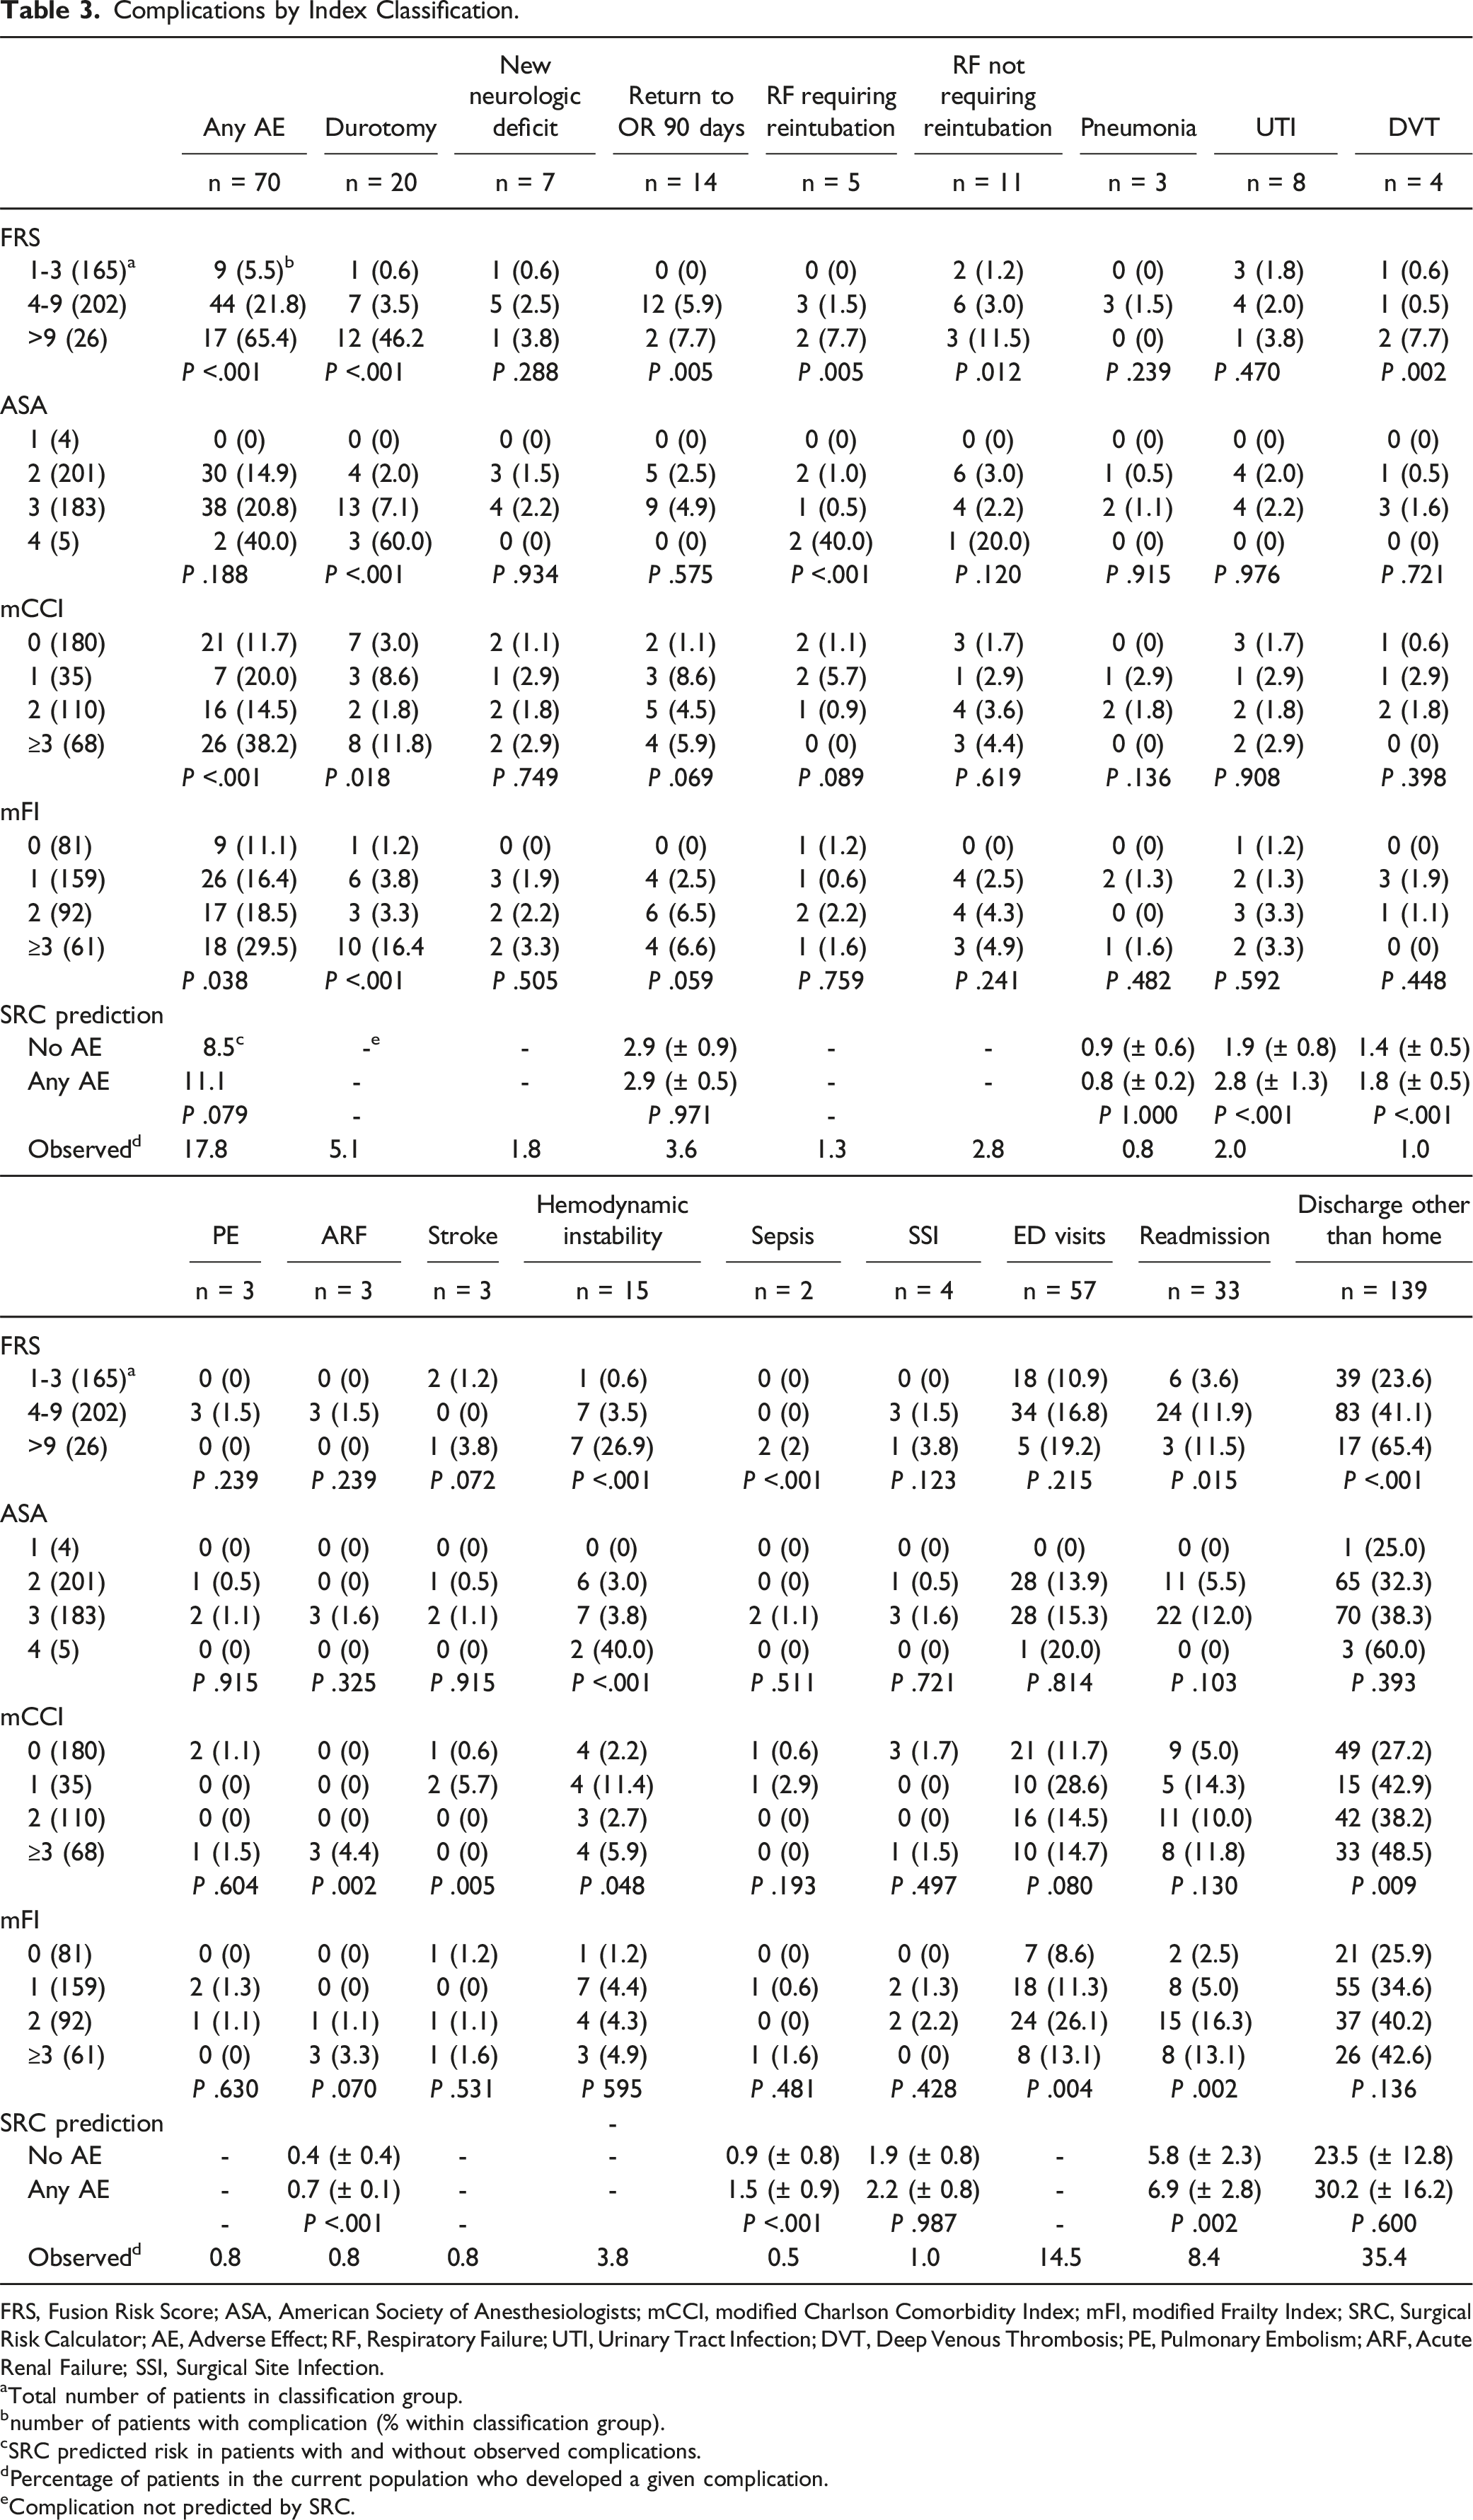
FRS, Fusion Risk Score; ASA, American Society of Anesthesiologists; mCCI, modified Charlson Comorbidity Index; mFI, modified Frailty Index; SRC, Surgical Risk Calculator; AE, Adverse Effect; RF, Respiratory Failure; UTI, Urinary Tract Infection; DVT, Deep Venous Thrombosis; PE, Pulmonary Embolism; ARF, Acute Renal Failure; SSI, Surgical Site Infection.
aTotal number of patients in classification group.
bnumber of patients with complication (% within classification group).
cSRC predicted risk in patients with and without observed complications.
dPercentage of patients in the current population who developed a given complication.
eComplication not predicted by SRC.
Complications by Diagnosis.
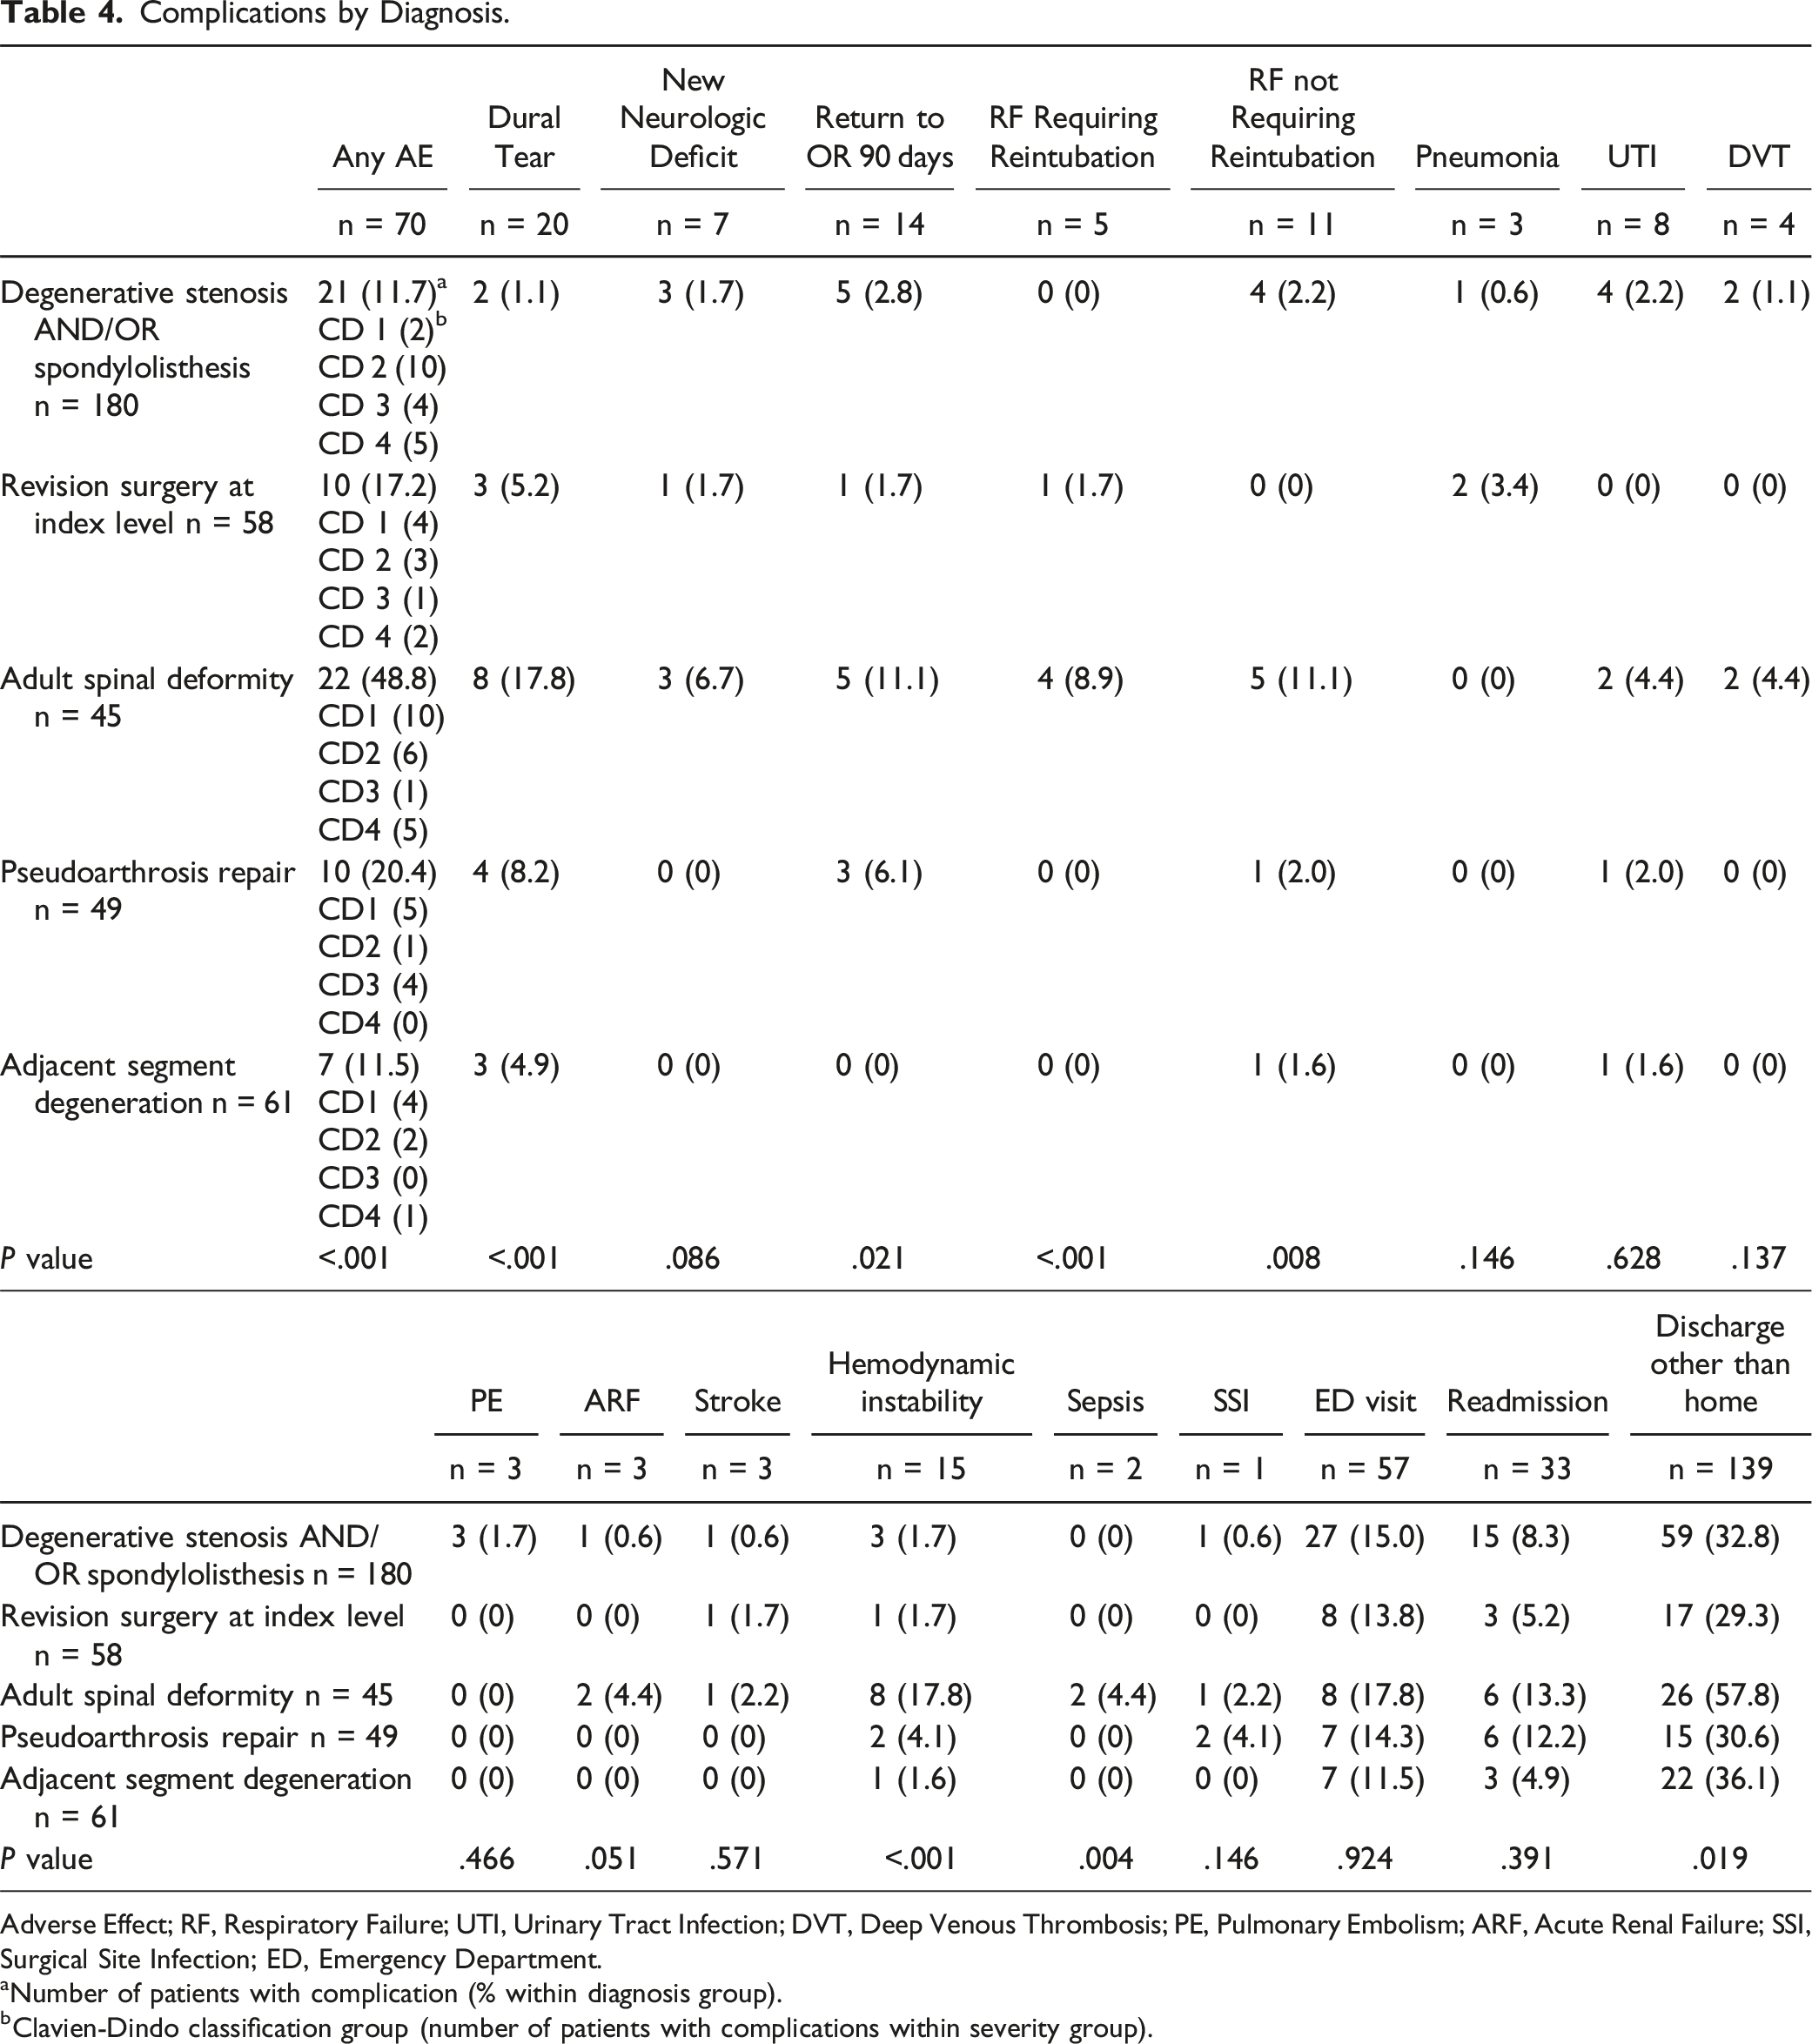
Adverse Effect; RF, Respiratory Failure; UTI, Urinary Tract Infection; DVT, Deep Venous Thrombosis; PE, Pulmonary Embolism; ARF, Acute Renal Failure; SSI, Surgical Site Infection; ED, Emergency Department.
aNumber of patients with complication (% within diagnosis group).
bClavien-Dindo classification group (number of patients with complications within severity group).
Complications by Surgical Approach and Interbody Use.
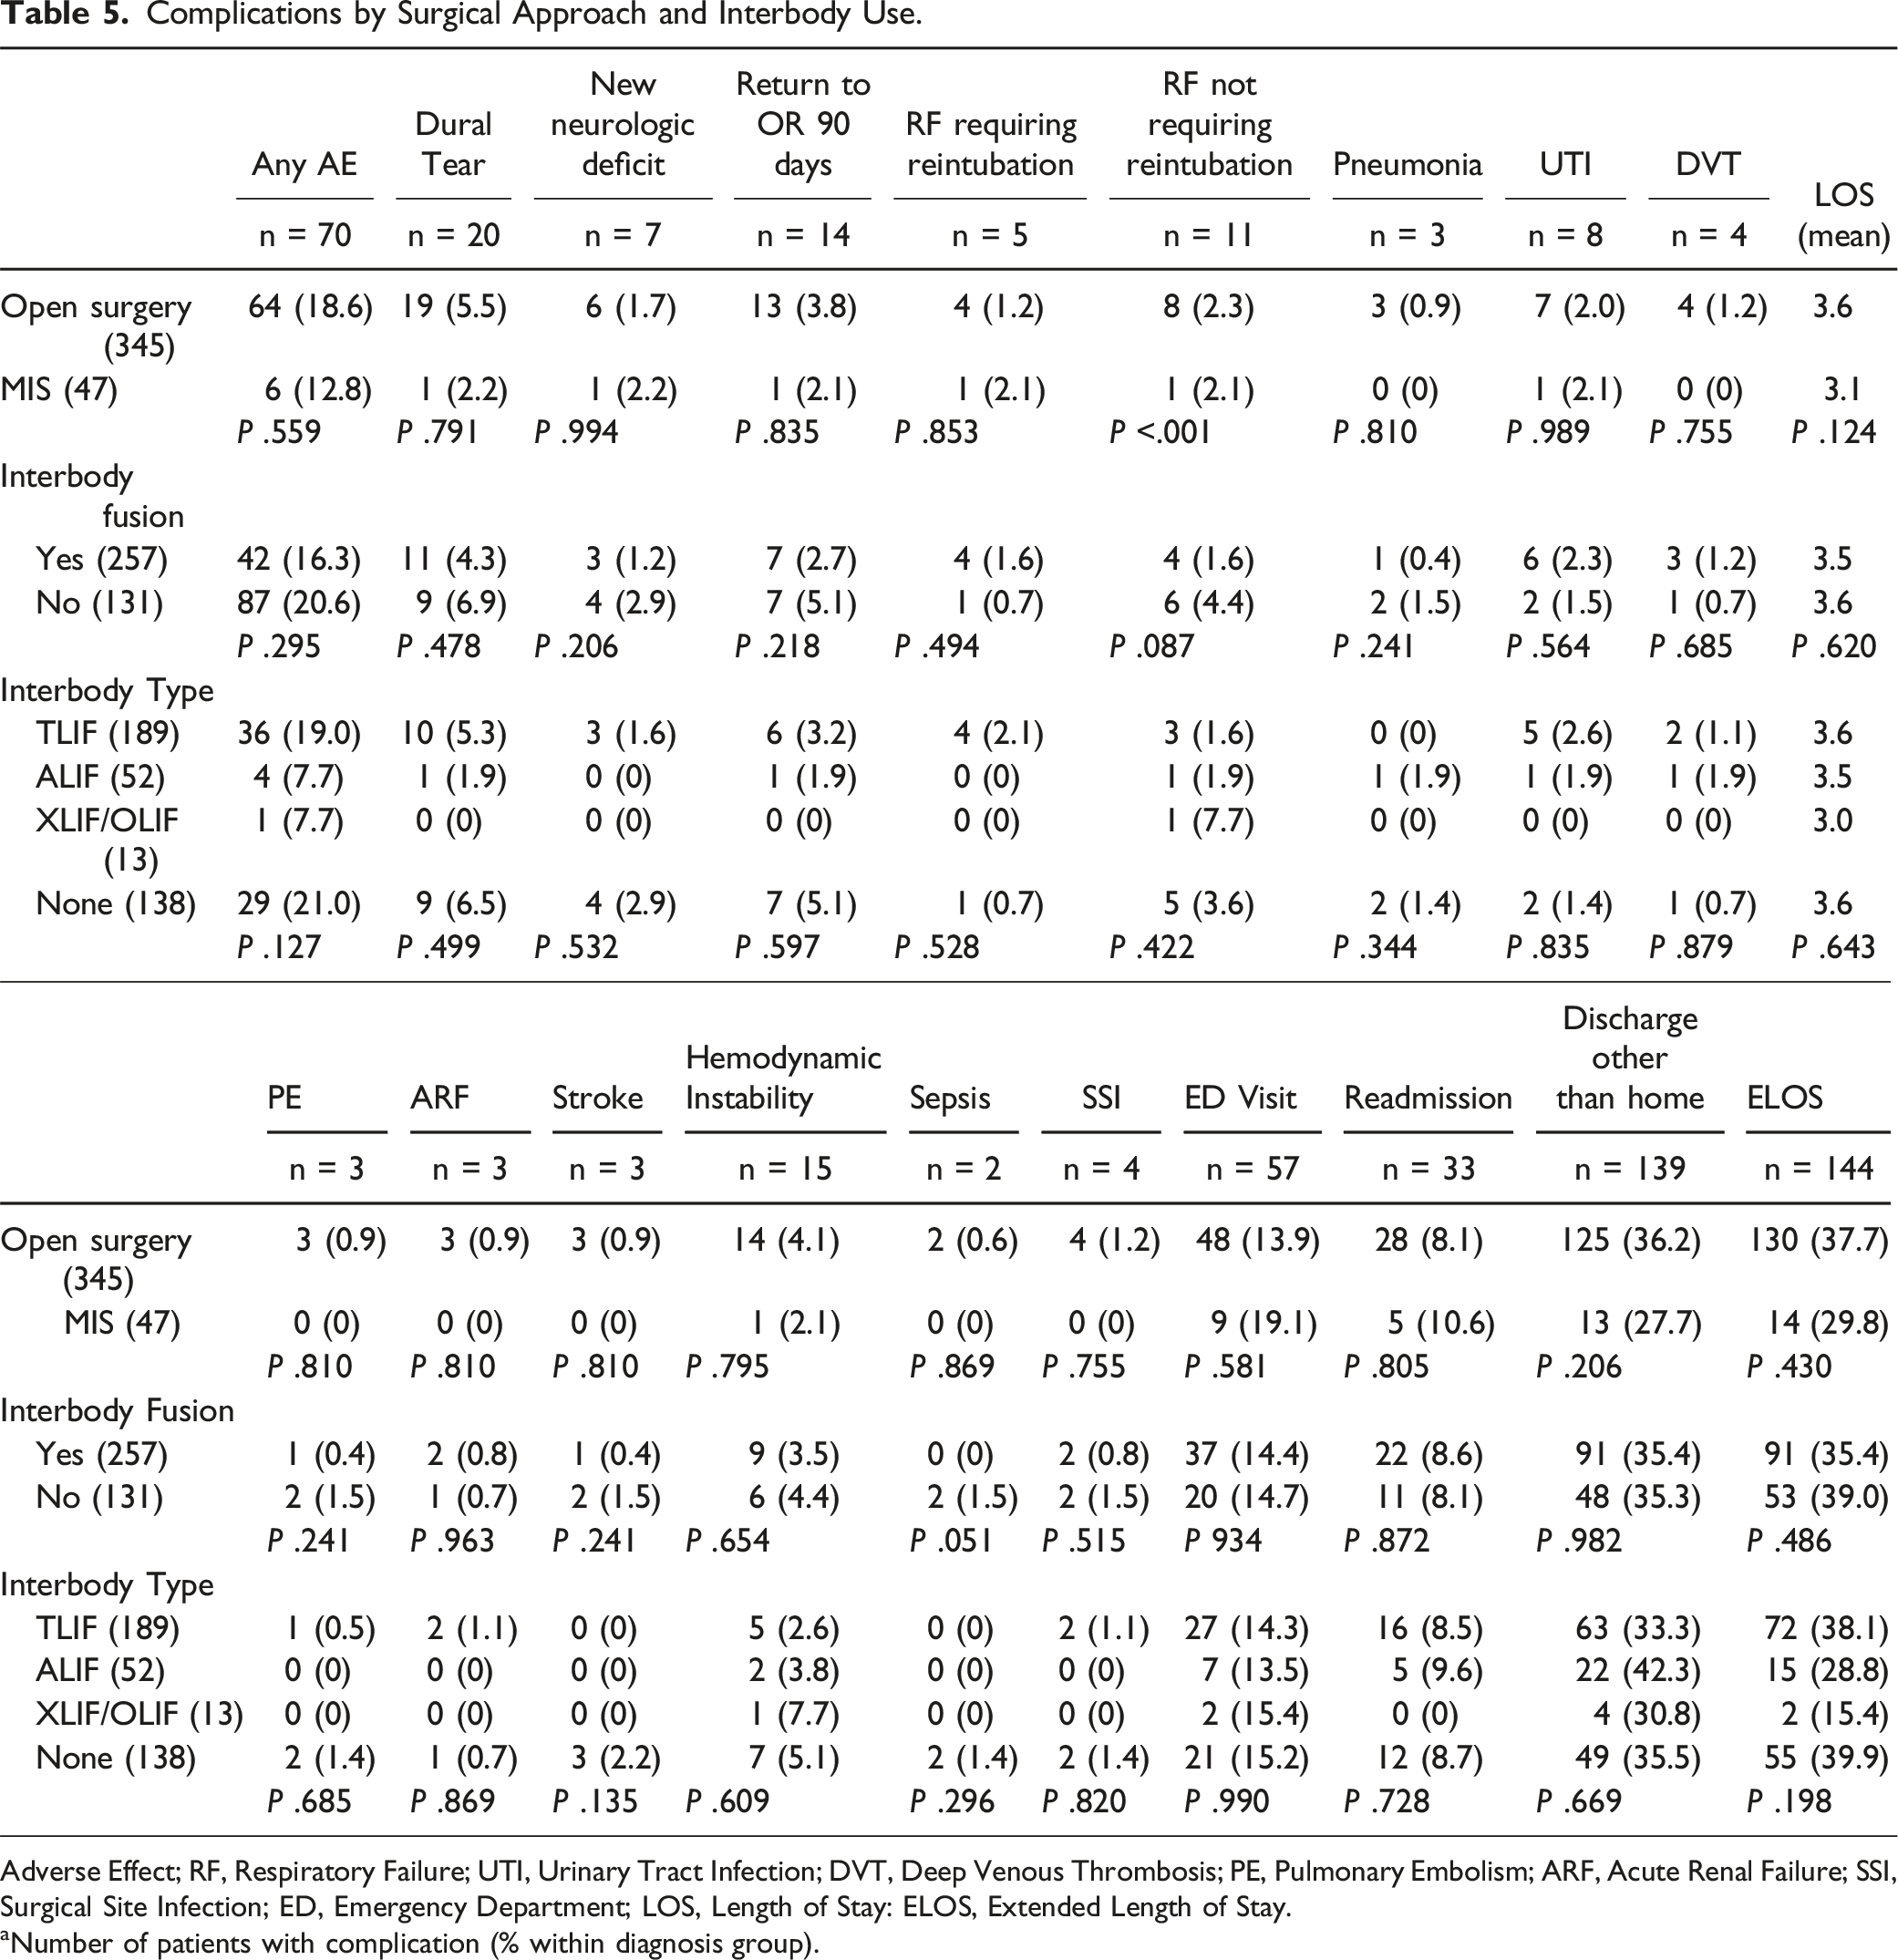
Adverse Effect; RF, Respiratory Failure; UTI, Urinary Tract Infection; DVT, Deep Venous Thrombosis; PE, Pulmonary Embolism; ARF, Acute Renal Failure; SSI, Surgical Site Infection; ED, Emergency Department; LOS, Length of Stay: ELOS, Extended Length of Stay.
aNumber of patients with complication (% within diagnosis group).
Area Under the Receiver Operator Curve Analysis.
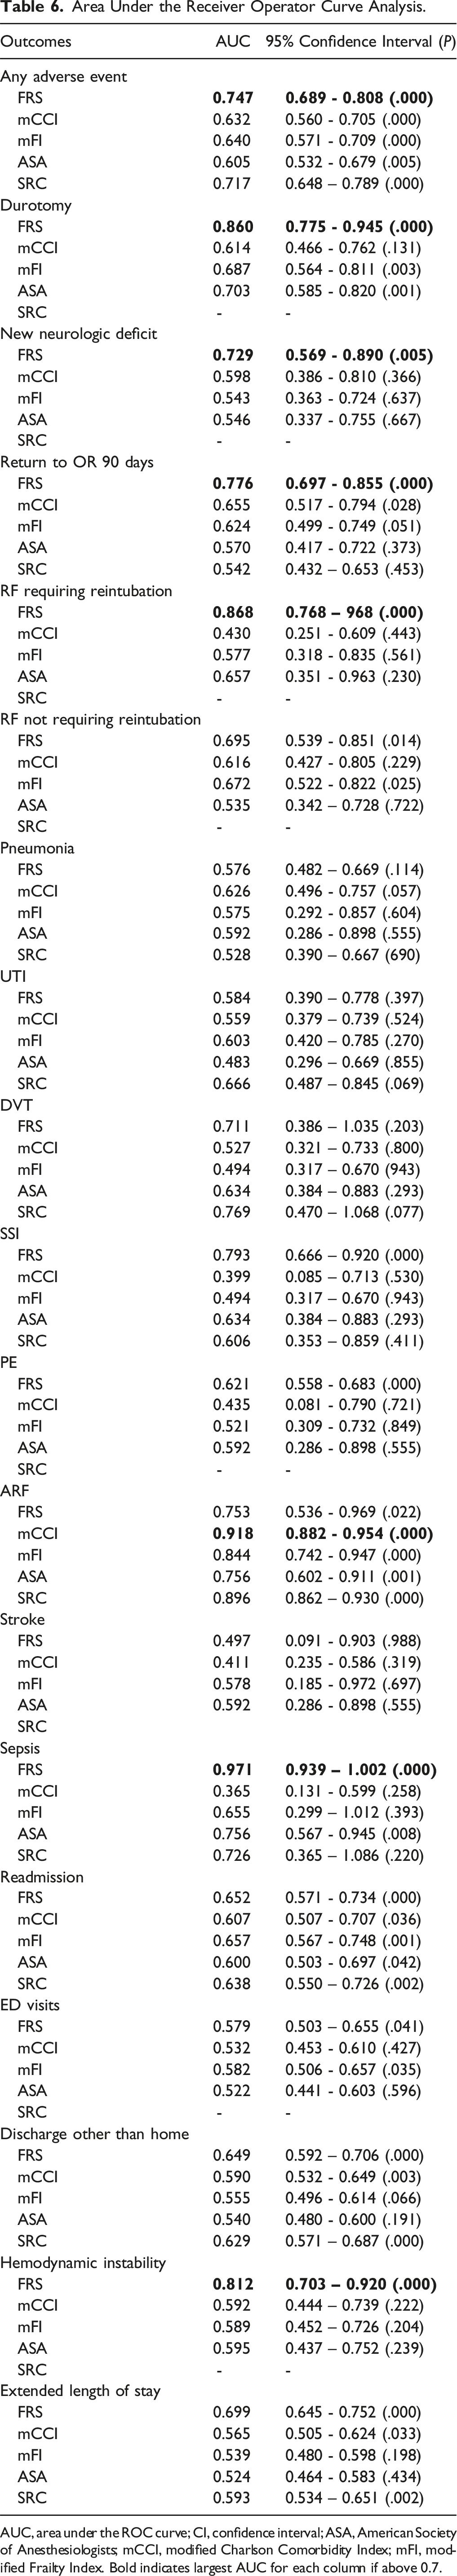
AUC, area under the ROC curve; CI, confidence interval; ASA, American Society of Anesthesiologists; mCCI, modified Charlson Comorbidity Index; mFI, modified Frailty Index. Bold indicates largest AUC for each column if above 0.7.
Multivariate Regression Analysis.
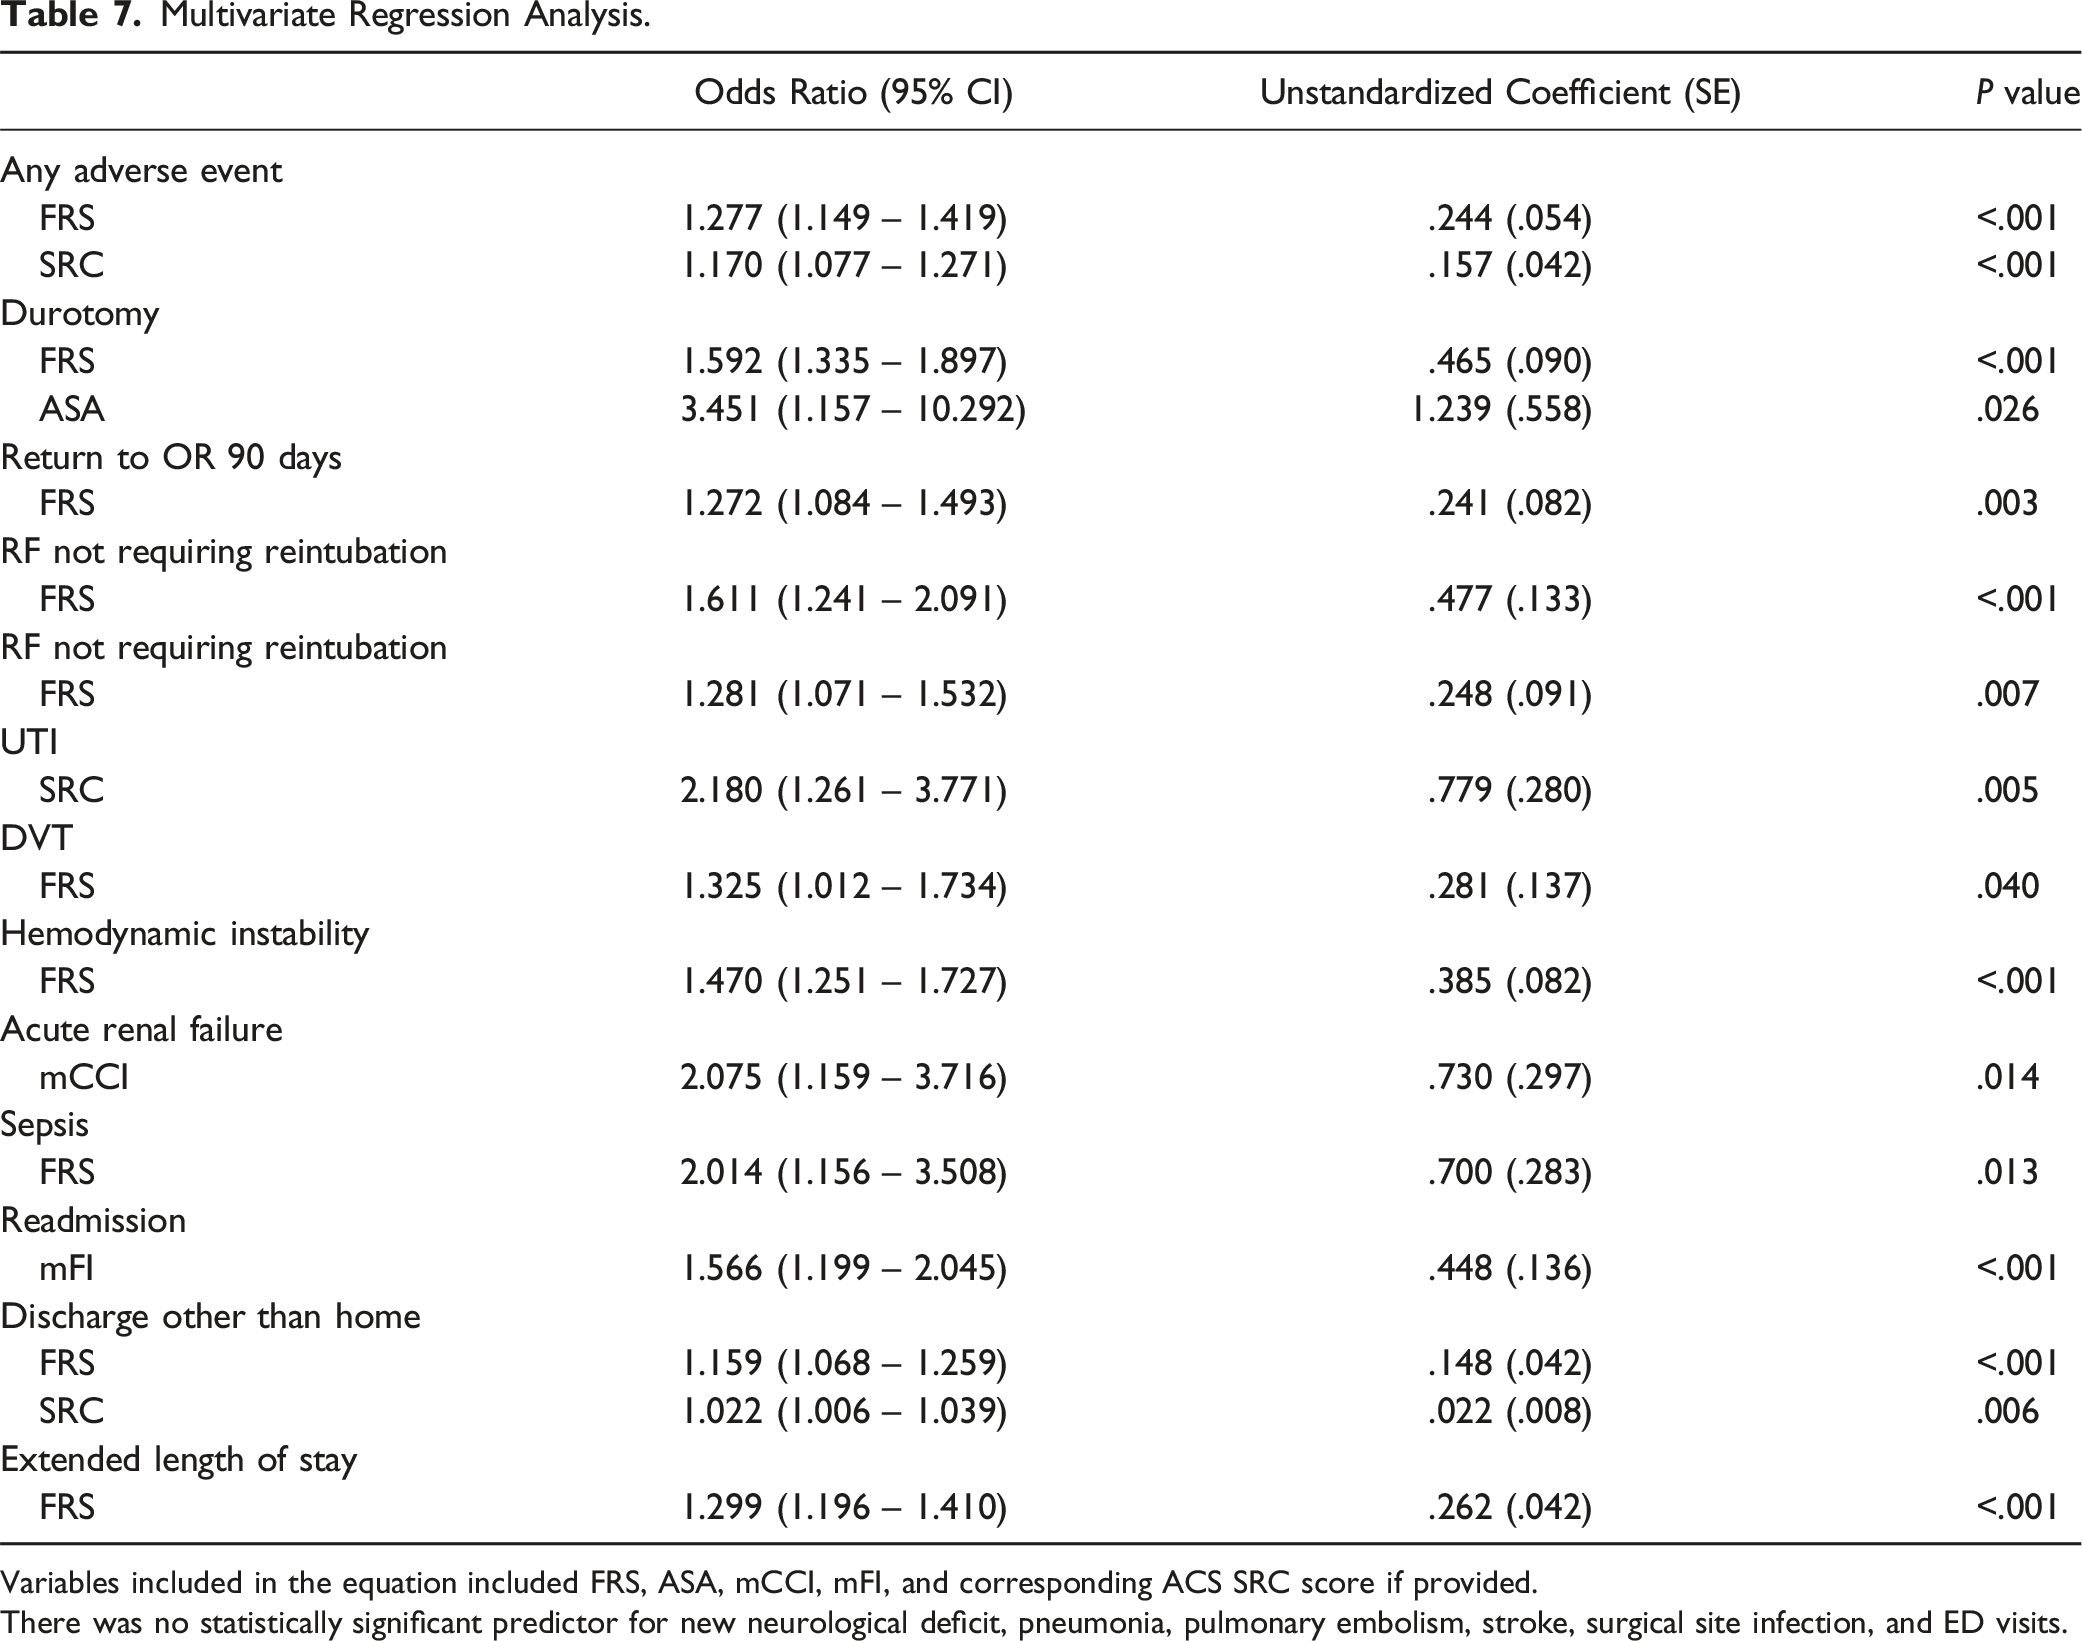
Variables included in the equation included FRS, ASA, mCCI, mFI, and corresponding ACS SRC score if provided.
There was no statistically significant predictor for new neurological deficit, pneumonia, pulmonary embolism, stroke, surgical site infection, and ED visits.
Overall mean LOS was 3.5 ± 1.8 days. Figure 2 shows the LOS distribution among the different diagnoses. The ASD group had the highest rate of ELOS (71.1%), followed by the ASD group (37.7%), pseudoarthrosis repair (36.7%), degenerative stenosis/spondylolisthesis (31.1%), and revision surgery at index level (25.9%). Box and whisker representation of length of stay by diagnosis.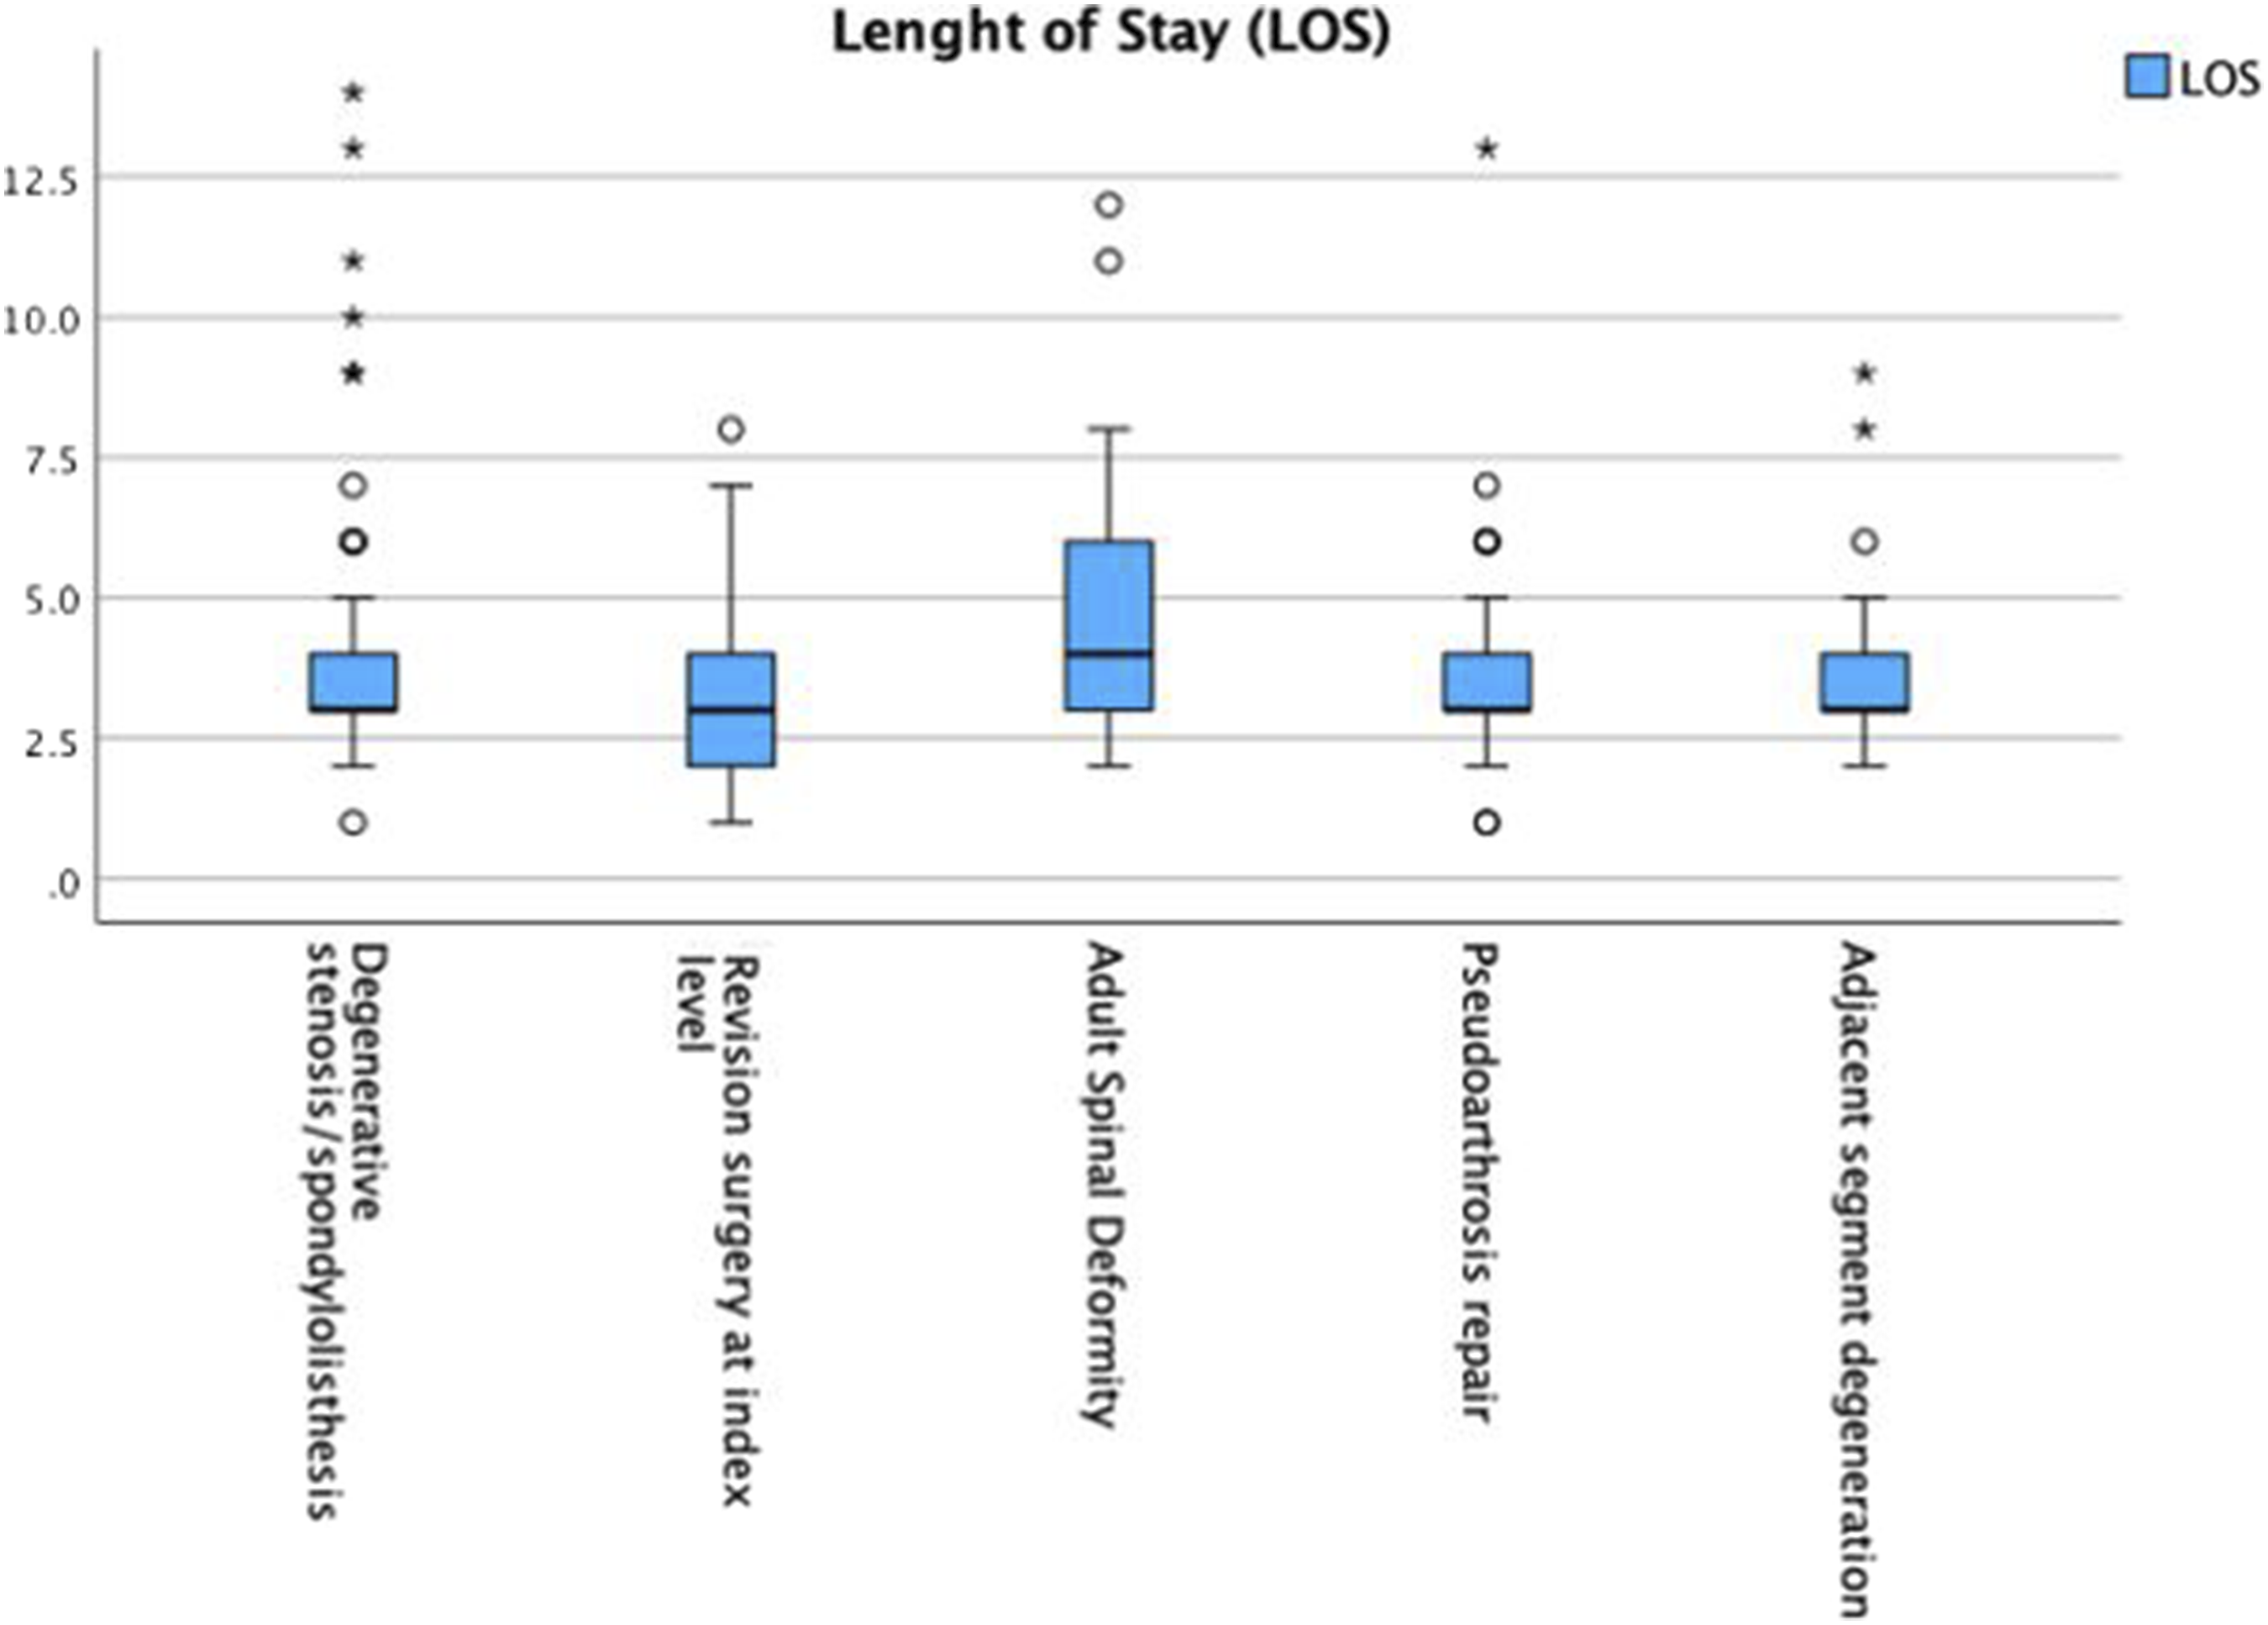
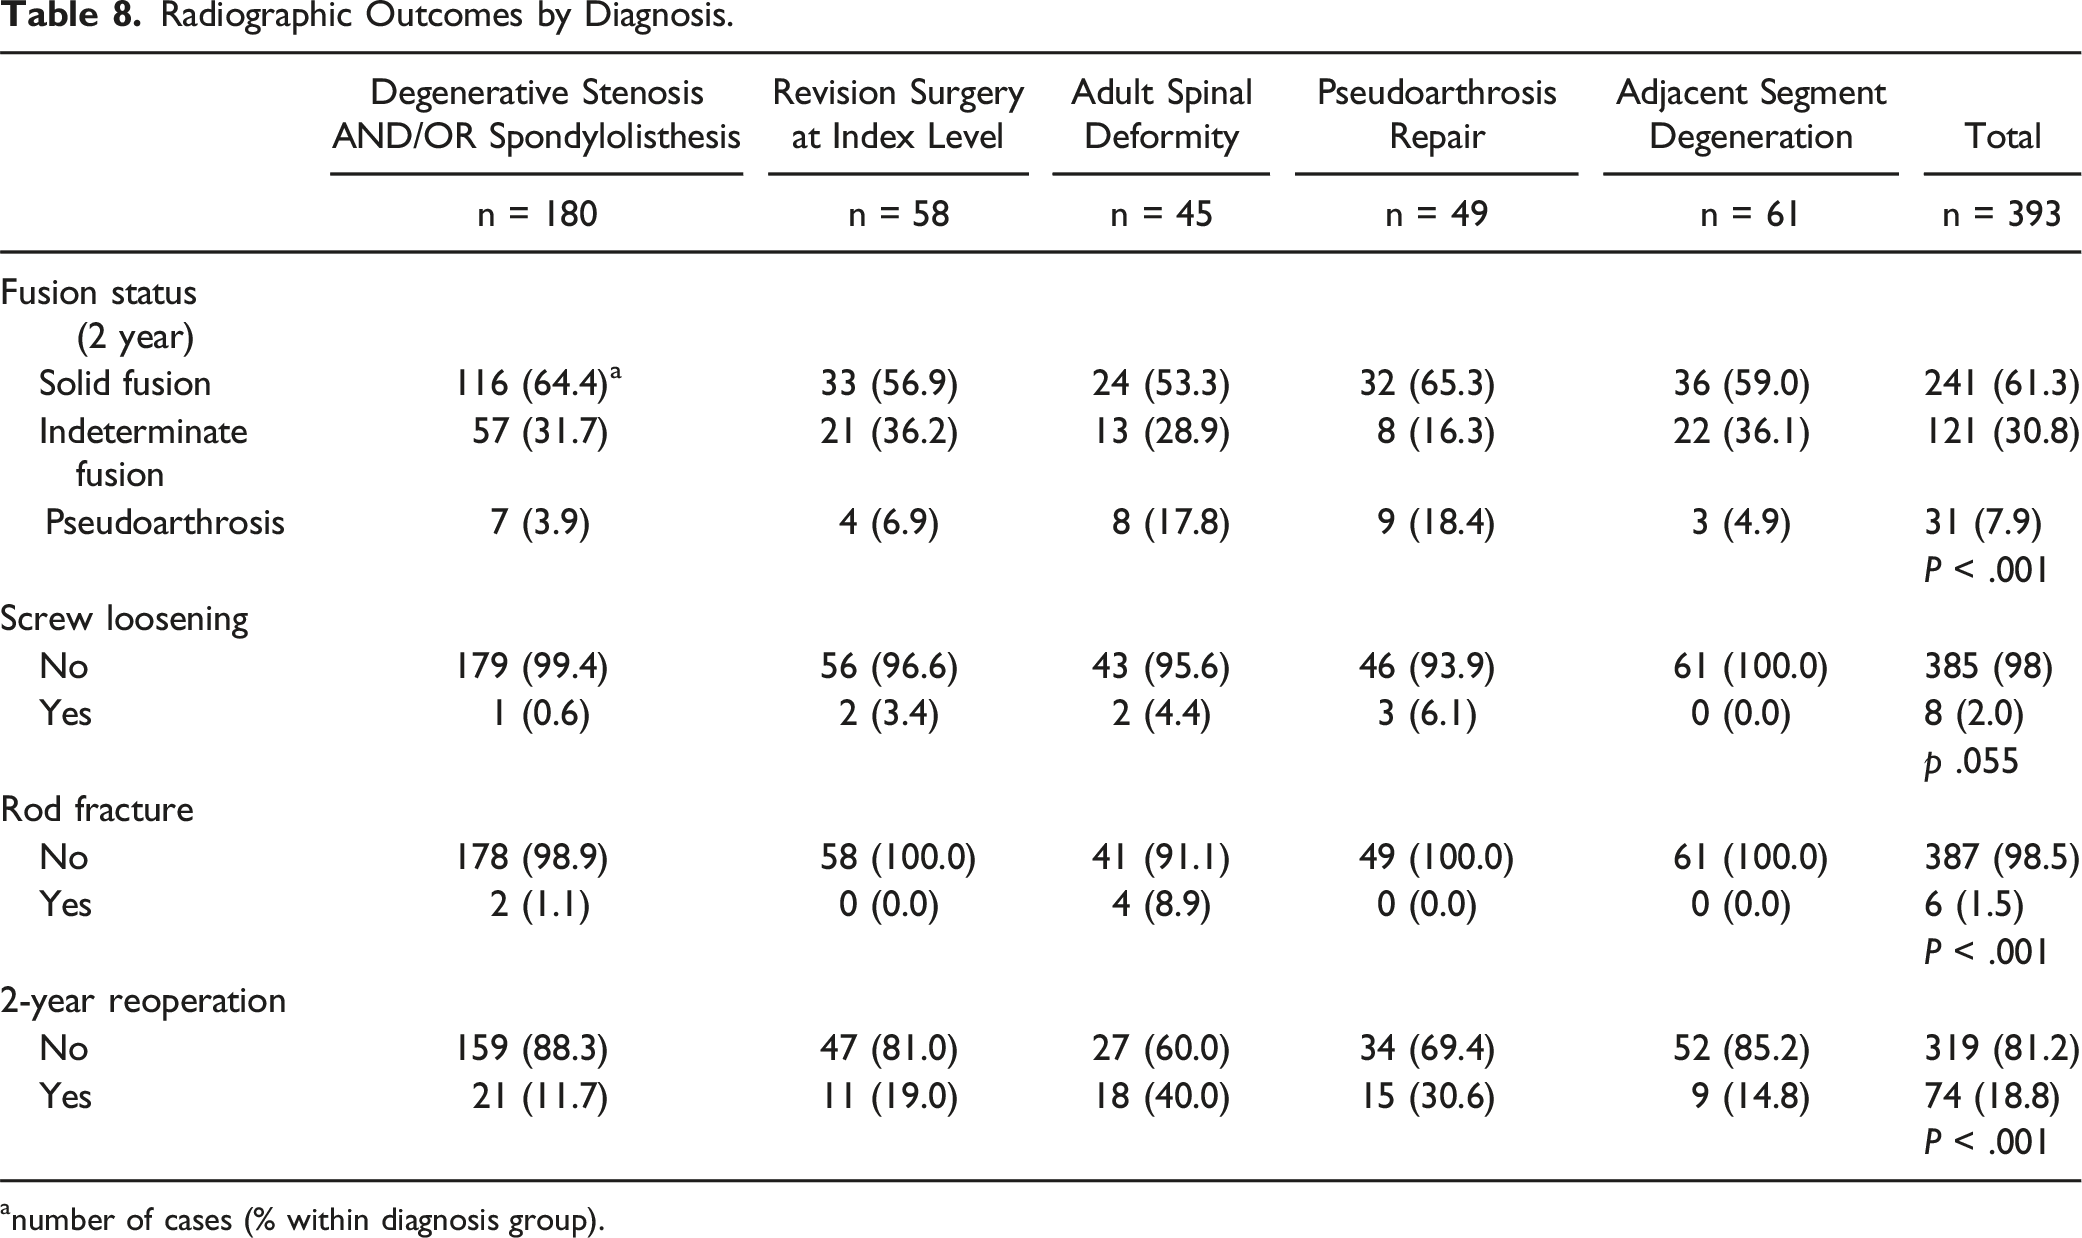
Preoperative and 2-year postoperative ODI, VAS back and leg scores distributed by diagnosis are presented in Figure 3. Mean preoperative ODI for the entire cohort was 45.6 (±14.3), 2-year ODI was 30.0 (±17.7), with a mean improvement of 15.6 (±16.5). Mean preoperative VAS for back pain was 5.9 (±2.4), 2-year postoperatively it was 2.9 (±2.7), with a mean improvement of 3.1 (±2.8). Mean preoperative VAS for leg pain was 5.3 (±2.9), 2-year postoperatively it was 2.2 (±2.6), for a mean improvement of 3.1 (±3.1). Radiographic outcomes are presented in Table 8. Overall rate of pseudoarthrosis was 7.9%, screw loosening 2.0%, rod fracture 1.5%, and 2-year reoperation was 18.8%. Pseudoarthrosis rates were higher in the ASD (17.8%) and the pseudoarthrosis repair group (18.4%). There was no significant difference in the rate of screw loosening between groups. Rod fracture rate was highest in the ASD group (8.9%). Two-year reoperation rate was highest in the ASD (40.0%) and pseudoarthrosis repair (30.6%) groups. Box and whisker representation of preoperative and 2-year postoperative ODI and VAS. Radiographic Outcomes by Diagnosis. anumber of cases (% within diagnosis group).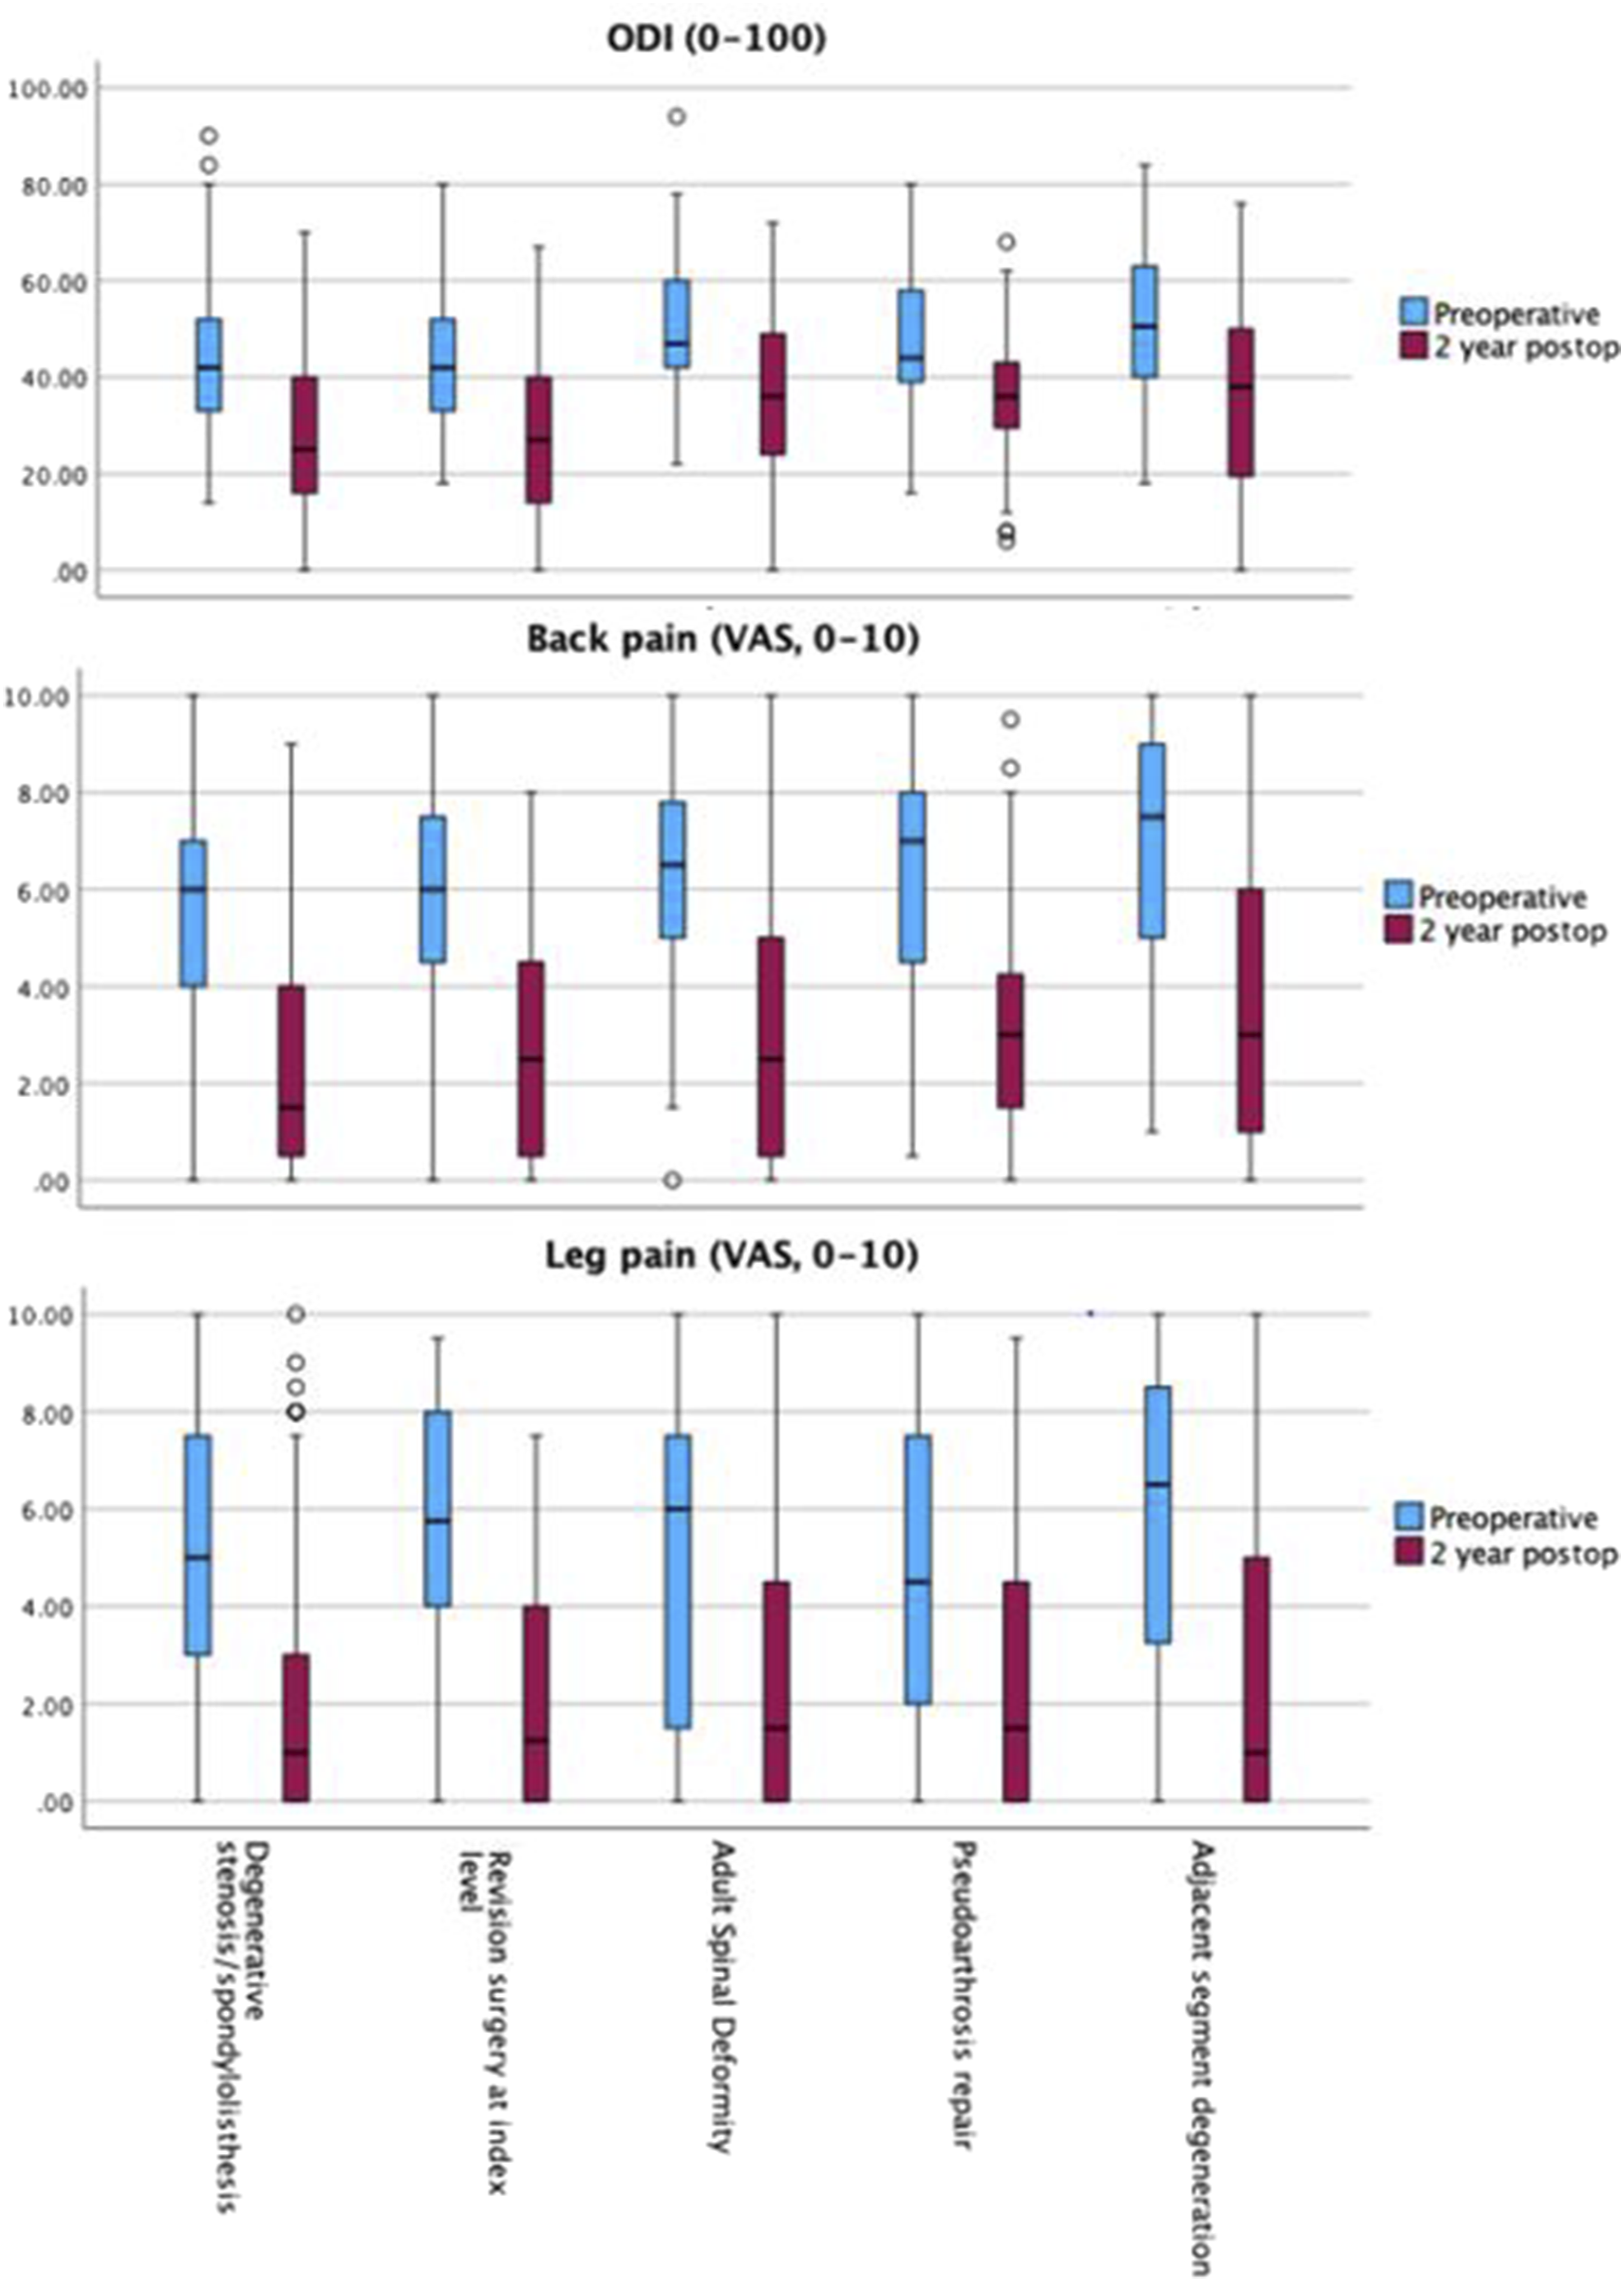
Discussion
With an aging patient population with increased comorbidities, the use of preoperative risk stratification tools has gained increased attention. The mFI, mCCI, and ASA have been used extensively in the orthopaedic literature and have been shown to be related to postoperative adverse events after spinal fusion procedures.10,25,26 Ondeck et al 5 recently reported a comparison of these indices using data from 16,495 patients using the NSQIP database to compare the ability the indices to predict postoperative adverse events, ELOS, and discharge to higher level of care after spine surgery. They reported that the index with the best predictive ability was the ASA. However, besides having a poor predictive ability to predict discharge to higher level of care (ASA and mFI), these indices did not have any predictive ability for other outcomes (AUC <0.6).
The FRS was developed with the goal of predicting the risk of postoperative complications in the first 90 days after a broad range of elective thoracic and lumbar fusion procedures.16,17 To our knowledge, this is the first study to compare the FRS score to other indices to predict postoperative complications, reoperations, readmissions, and ED visits. The ACS SRC was included in the study given that it also considers the surgical procedure being performed. 13
In our analysis of patients undergoing elective thoracic and lumbar fusion, we found that the FRS had the best overall predictive ability as seen on Table 6. The FRS had the highest and fair predictive ability predicting any adverse event, new neurological deficit, RF not requiring intubation, and 2-year reoperation. It had the highest and good predictive ability predicting durotomy, RF requiring reintubation, and hemodynamic instability requiring fluid resuscitation and/or vasopressor support. It had the highest and excellent predictive ability predicting sepsis. The ACS SRC had the highest and fair predictive ability predicting UTI and DVT. The mCCI had the highest and excellent predictive ability predicting acute renal failure. It is important to note that the ACS SRC only provides risk estimates for 12 of the 19 variables assessed in the AUC analysis, and the predictions are only for the first 30 postoperative days. Our analysis evaluated the first 90 postoperative days. The ability of the FRS to serve as a predictor of many of the adverse events evaluated was seen again after performing a regression analysis.
The greater overall accuracy of the FRS as compared to the ACS SRC may be due to its more comprehensive consideration of the surgical procedure being performed. The ACS SRC considers only one Current Procedural Terminology (CPT) code for its analysis, therefore limiting a more complete evaluation of the complexity of the procedure. McCarthy et al 14 evaluated the accuracy of the ACS SRC in predicting complications in patients undergoing lumbar and cervical primary fusions and reported that the calculator was only able to predict “any complication” and “discharge to skilled nursing facility” in the cervical cohort and was not able to make accurate predictions in the lumbar cohort. Narain et al 27 reported that the ACS SRC was a fair predictor of discharge to non-home facility (AUC 0.71) and surgical site infection (AUC 0.70), and a good predictor of acute kidney injury (AUC 0.81). Similarly, in our study the ACS SRC had good predictive ability for renal failure (AUC 0.896), and a fair predictive ability for UTI (AUC 0.726), sepsis (AUC 0.726), and DVT (AUC 0.769). Several studies of the ACS SRC in patients undergoing other types of spine surgery have also questioned the validity of this preoperative risk stratification tool in spine surgery.15,28,29
As compared to the mFI, mCCI, and ASA, the FRS and the ACS SRC include variables related to the surgical invasiveness of the proposed procedure. There have been other models that also consider surgical invasiveness when evaluating preoperative risk in patients undergoing spinal surgery. In a retrospective study of 1745 patients Lee et al 30 presented a similar model to predict medical complications after spine surgery. The authors reported an AUC of the ROC of 0.76 for any complication and 0.81 for major medical complications. The cohort they evaluated included patients being treated for spinal trauma and infection; patients with either of these two diagnoses had the greatest odds of developing complications. As compared to the FRS, this model included other comorbidities (history of asthma, rheumatoid arthritis, pre-existing neoplasm, seizure or syncope, anemia, bleeding disorders, and congestive heart failure), other diagnoses (degenerative, trauma, neoplasm, other), additional levels of surgery (cervical, thoracic, lumbosacral), and additional surgical approaches (anterior, posterior, combined). This model also assessed surgical invasiveness as described by Mirza et al. 31 Zehnder et al 32 also recently presented a predictive model which was evaluated in a cohort of patients undergoing spinal surgery for lumbar degenerative conditions and assessed for medical and surgical complications arising between admission and discharge. The variables included in their model included age, sex, whether patients had had previous spine surgery (at the same level or at a different level), BMI, smoking status, ASA, the modified Mirza Invasiveness Index, pathology other than degenerative disease (trauma, deformity, infection, tumor), and method of surgical intervention (conventional or minimally invasive). Their model had an AUC of 0.74 for medical complications, and 0.64 for surgical complications.
Although the model presented by Lee et al 30 had better predictive ability than the FRS for any complication (AUC 0.76 vs AUC 0.74), we believe that the FRS is more generalizable for elective spine fusion procedures because patients with trauma and infection were excluded in our study. Neither of these studies evaluated reoperation, readmission, or ED visits. Both models used the surgical invasiveness index (SII) presented by Mirza et al. 31 An advantage of the FRS as compared to these other models is its simplicity. The FRS was made with particular attention to maintaining simplicity to allow for real-world use by only using the most common and most significant predictors of perioperative risk. 16 Despite not using as many variables as these other two models, the FRS has comparable predictability of perioperative complications. Moreover, the inclusion of an assessment of surgical invasiveness makes the FRS a stronger predictive model when compared to indices like the mFI and the mCCI that focus solely on demographics and medical comorbidities. In addition, the FRS can be modified by changing the procedure planned to reduce the index. In the current study, patients undergoing surgery for ASD experienced the highest rate of complications, ELOS, 90-day, and 2-year reoperation. This is consistent with what has been previously reported in the literature.33-37
Preoperative indices like the ones assessed in this study, can be valuable tools for evaluating patients before surgery. They offer a general sense of the potential risks associated with the procedure and provide insights into the patient’s overall health. However, these indices have notable limitations. Often, they are developed using data from specific populations, which may limit their applicability to other groups. Additionally, indices designed to predict a particular outcome may not accurately forecast other outcomes. As medical practices and surgical techniques advance, these indices can become outdated unless they are continually reassessed for their relevance and accuracy. From an utility standpoint, and based on the results of this study, it appears more beneficial to use preoperative indices in older or sicker patients in whom knowledge of their risk may help guide the surgeon to select a surgical technique that minimizes these risks. From a utility standpoint, and based on the results of this study, preoperative indices seem particularly beneficial for older or sicker patients. Understanding their risk profiles can help surgeons choose surgical techniques that minimize potential complications.
Limitations to this study include a relatively small patient population compared with other similar studies. Also, the retrospective nature of this study makes the results dependent on the quality of the data available and missing values or inaccurate documentation could change the statistical results. Despite the promising results, it is also important to note that for most outcomes, all indices had an AUC <0.8 and therefore were fair to poor predictors with a few exceptions. Nonetheless, in this study we only included patients with complete information. Moreover, we reviewed each individual patient chart to collect complete data to verify its accuracy.
Conclusion
Our study suggests that in patients older than 65 years of age undergoing elective thoracic and lumbar fusion surgery, the FRS may be more accurate than the mFI, mCCI, ASA and ACS SRC in identifying adverse outcomes after surgery. Further research is needed to expand on the clinical utility of preoperative risk stratification indices.
Footnotes
Declaration of conflicting interests
The author(s) declared no potential conflicts of interest with respect to the research, authorship, and/or publication of this article.
Funding
The author(s) received no financial support for the research, authorship, and/or publication of this article.