
Abstract
Study Design
Retrospective Study.
Objective
Myxopapillary ependymomas (MPEs) are a unique subgroup of spinal ependymomas originating from the filum terminale’s ependymal glia. The 2021 WHO classification reclassified all MPEs as grade 2, recognizing their higher recurrence risk. Due to their rarity, our objective with this study is to understand MPEs’ clinical course and optimal management through a large retrospective cohort analysis.
Methods
From the years 2000 to 2020, patients with MPEs were identified from the Surveillance, Epidemiology, and End Results (SEER) database. Univariate and multivariable Cox proportional hazard models were run to identify variables that had a significant impact on the primary endpoint of overall survival (OS). A predictive nomogram was built to predict 5-year and 10-year survival probability.
Results
This retrospective cohort includes 1373 patients. Patients 65 years or older at diagnosis had a poorer OS (P < 0.001). Most patients received subtotal resection. Only 320 patients (23%) received gross total resection (GTR). Patients that received GTR had the best OS when compared against all other modalities of treatment (P < 0.05). Receiving radiotherapy did not affect OS in patients with MPE (P = 0.2). Nomogram includes patient age and treatment modalities, demonstrating acceptable accuracy in estimating the survival probability at 5-year and 10-year intervals, with a C-index of 0.80 (95% CI of 0.71 to 0.90).
Conclusion
This study highlights the survival benefit of GTR in the treatment of patients with MPE. The role of adjuvant radiotherapy remains unclear as it did not seem to improve OS. The nomogram stratifies the risk of survival in patients with MPE based on age and treatment modality.
Short Summary Sentence
Here, we present 1 of the largest retrospective analyses to-date looking at patients with myxopapillary ependymoma using the SEER database. Also, we have developed the first nomogram to predict survival outcome and to assist in guiding clinical practice and prognostication.
Background
Myxopapillary ependymoma (MPE) is a histological variant of ependymoma that accounts for 13% of all ependymomas. 1 These tumors primarily arise from spinal ependymal cells most commonly within the conus medullaris, cauda equina and filum terminale.2,3 For this reason, they are predominantly found in the lumbosacral region. Most commonly presenting in patients between ages 30 and 50, MPE has a reported incidence of 1 per million person-years.4,5
Characteristically, MPE manifest as well-defined, low-grade lesions; however, they can seed the subarachnoid space and spread. 6-8 In some cases, these tumors have disseminated through the cerebrospinal fluid leading to “drop metastases” at the time of diagnosis.9,10 The 2021 WHO classification of CNS tumors has reclassified all MPE as grade 2 since they have an elevated risk of recurrence. 11 Despite this potential for recurrence, the overall prognosis for individuals with MPE remains highly favorable. Notably, reported 10-year overall survival and progression-free survival rates stand at 92% and 61%, respectively. 12
A comprehensive understanding of the clinical trajectory and optimal management approach for MPE remains limited. While complete surgical removal can result in a cure for some patients, others experience symptomatic relapse even after gross total resection (GTR).13-19 Several factors have emerged as potential predictors of outcomes, including the extent of surgical resection, mode of resection (en bloc vs piecemeal), tumor size at the time of early detection and surgery, distance of the tumor from the conus medullaris, involvement of sacral spinal levels, presence of ambiguous tumor boundaries, bony erosions, utilization of adjuvant radiation therapy (regardless of resection extent), and the occurrence of surgical complications.1,13-17,20,21
Due to the rarity of MPE, prior studies that have investigated clinical outcomes on patients with this tumor are limited by sample size. In the current study, we utilize the Surveillance, Epidemiology and End Result (SEER) database to investigate clinical characteristics and treatment modalities that influence survival in patients with MPE. Our retrospective cohort study is 1 of the largest to study this specific patient population. In addition, we present a predictive nomogram model to guide future prognostication.
Methods and Materials
Study Design and Cohort Selection
All data collected in this dataset is publicly available. Therefore, this study did not require review from an Institutional Review Board and was deemed exempt from consent requirements. This study complies with the National Cancer Institute’s (NCI) SEER limited-user data end user agreement.
This study examines data from NCI SEER 18 database collected from 2000 to 2020. Patients were extracted using the International Classification of Diseases for Oncology, version 3 (ICD-O-3) using the histology and behavior morphology code 9394/0, 9394/1, and 9394/3 corresponding to all myxopapillary ependymoma tumors. The primary endpoint of our study was OS which was defined as the time from diagnosis until the time of death, as reported by SEER. Patient sex, patient age, patient race, year of diagnosis, tumor behavior, tumor location, tumor size, and treatments used were selected as prognostic factors. Of note, the current SEER database does not provide sufficient data on the type of radiation therapy and type of chemotherapy agents used. This is addressed later in the manuscript as a limitation. Also, patient’s age at diagnosis was only available in years; thus, an age of zero was defined as patient age between birth and 1 day before age 1. Data for some analyzed factors was incomplete. Those without data were excluded from statistical analysis involving those factors.
Statistical Analyses
Each of the categories was assessed using Cox proportional hazard analysis using the Breslow method for ties. First, a univariate survival analysis was performed on all prognostic factors. Any prognostic factors that showed statistical significance (P value <0.05) were included in subsequent multivariable survival analysis. The Kaplan-Meier method was employed to visualize a subset of survival curves corresponding to the prognostic factors that showed statistically significant differences in OS based on the log-rank test. Finally, based on the results of the Cox multivariable proportional hazard model, a nomogram was built assessing 5-year survival probability and 10-year survival probability. All statistical analyses were performed by R package (version 4.2.0, 2022) using the “survival”, “survminer”, “pROC”, and “rms” packages.
Results
Demographics
In total, the retrospective cohort included 1373 patients. There was only 1 patient that needed to be excluded due to missing information on survival data. There were 105 deaths that occurred during the time that SEER was collecting data on this cohort.
Our cohort included more males (n = 793; 58%). The median age at diagnosis was 41-years-old (range: 0-91 years-old). The patient age was subdivided into three categories: pediatric (<19 years old), adult (19 to 65 years old), and elderly (>65 years old). Most patients were between ages 19 to 65 years old (n = 1091; 79%). There were 144 patients (10%) in the pediatric cohort and 138 patients (10%) in the elderly cohort. Most of the patients were Non-Hispanic White (n = 993; 72%). There were 221 Hispanic patients (16%), 63 Non-Hispanic Asian or Pacific Islander patients (5%), 60 Non-Hispanic Black patients (4%), and 14 Non-Hispanic American Indian/Alaska Native (1%). Only 22 patients had unknown data on race (2%). The year of diagnosis was categorized into two groups: 2000 to 2010 and 2011 to 2020. There were 575 patients (42%) diagnosed between the years 2000 and 2010, while 723 patients (53%) were diagnosed between the years 2011 and 2020.
The tumor behavior was categorized as either benign/borderline or malignant. Most patients had a tumor that was benign/borderline in nature (n = 1335; 97%). The tumor location was divided into four main categories: cauda equina, intracranial, spinal cord, spinal meninges. These categories were determined based on the SEER data provided under “Primary Site labeled.” Tumors that were coded as “72.1 Cauda Equina” were categorized in the cauda equina group. Tumors that were coded as “71.0 Cerebrum”, “71.3 Parietal Lobe”, “71.4 Occipital Lobe”, “71.5 Ventricle, NOS”, “71.6 Cerebellum”, “71.7 Brain stem”, and “71.9 Brain, NOS” were categorized in the intracranial group. Tumors that were coded as “72.0 Spinal Cord” were categorized in the spinal cord group. Tumors that were coded as “70.1 Spinal Meninges” were categorized in the spinal meninges group. Tumors that were categorized as “49.6 Conn, subcutaneous, other soft tissue: trunk, NOS”, “72.5 Cranial Nerve, NOS”, “72.8 Overlapping lesion of brain & CNS”, and “72.9 Nervous system, NOS” were excluded from the analysis due to the fact there were too few patients in these categories and they were not pertinent locations of interest for our analysis. There were 1256 patients (91%) in the spinal cord group, 75 patients (5%) in the cauda equina group, 18 patients (1%) in the intracranial group, and 17 patients (1%) in the spinal meninges group. The tumor size at diagnosis was available for 835 patients based on the measurement of the largest diameter length (61%). There were 494 patients with tumors that were ≤3.0 cm (36%). There were 236 patients with tumors that were between 3.1 cm and 6.0 cm (17%). There were 105 patients with tumors that were ≥6.0 cm (8%). Tumor laterality at diagnosis was available for 11 patients (<1%); therefore, this variable was omitted in further analysis due to limited data availability.
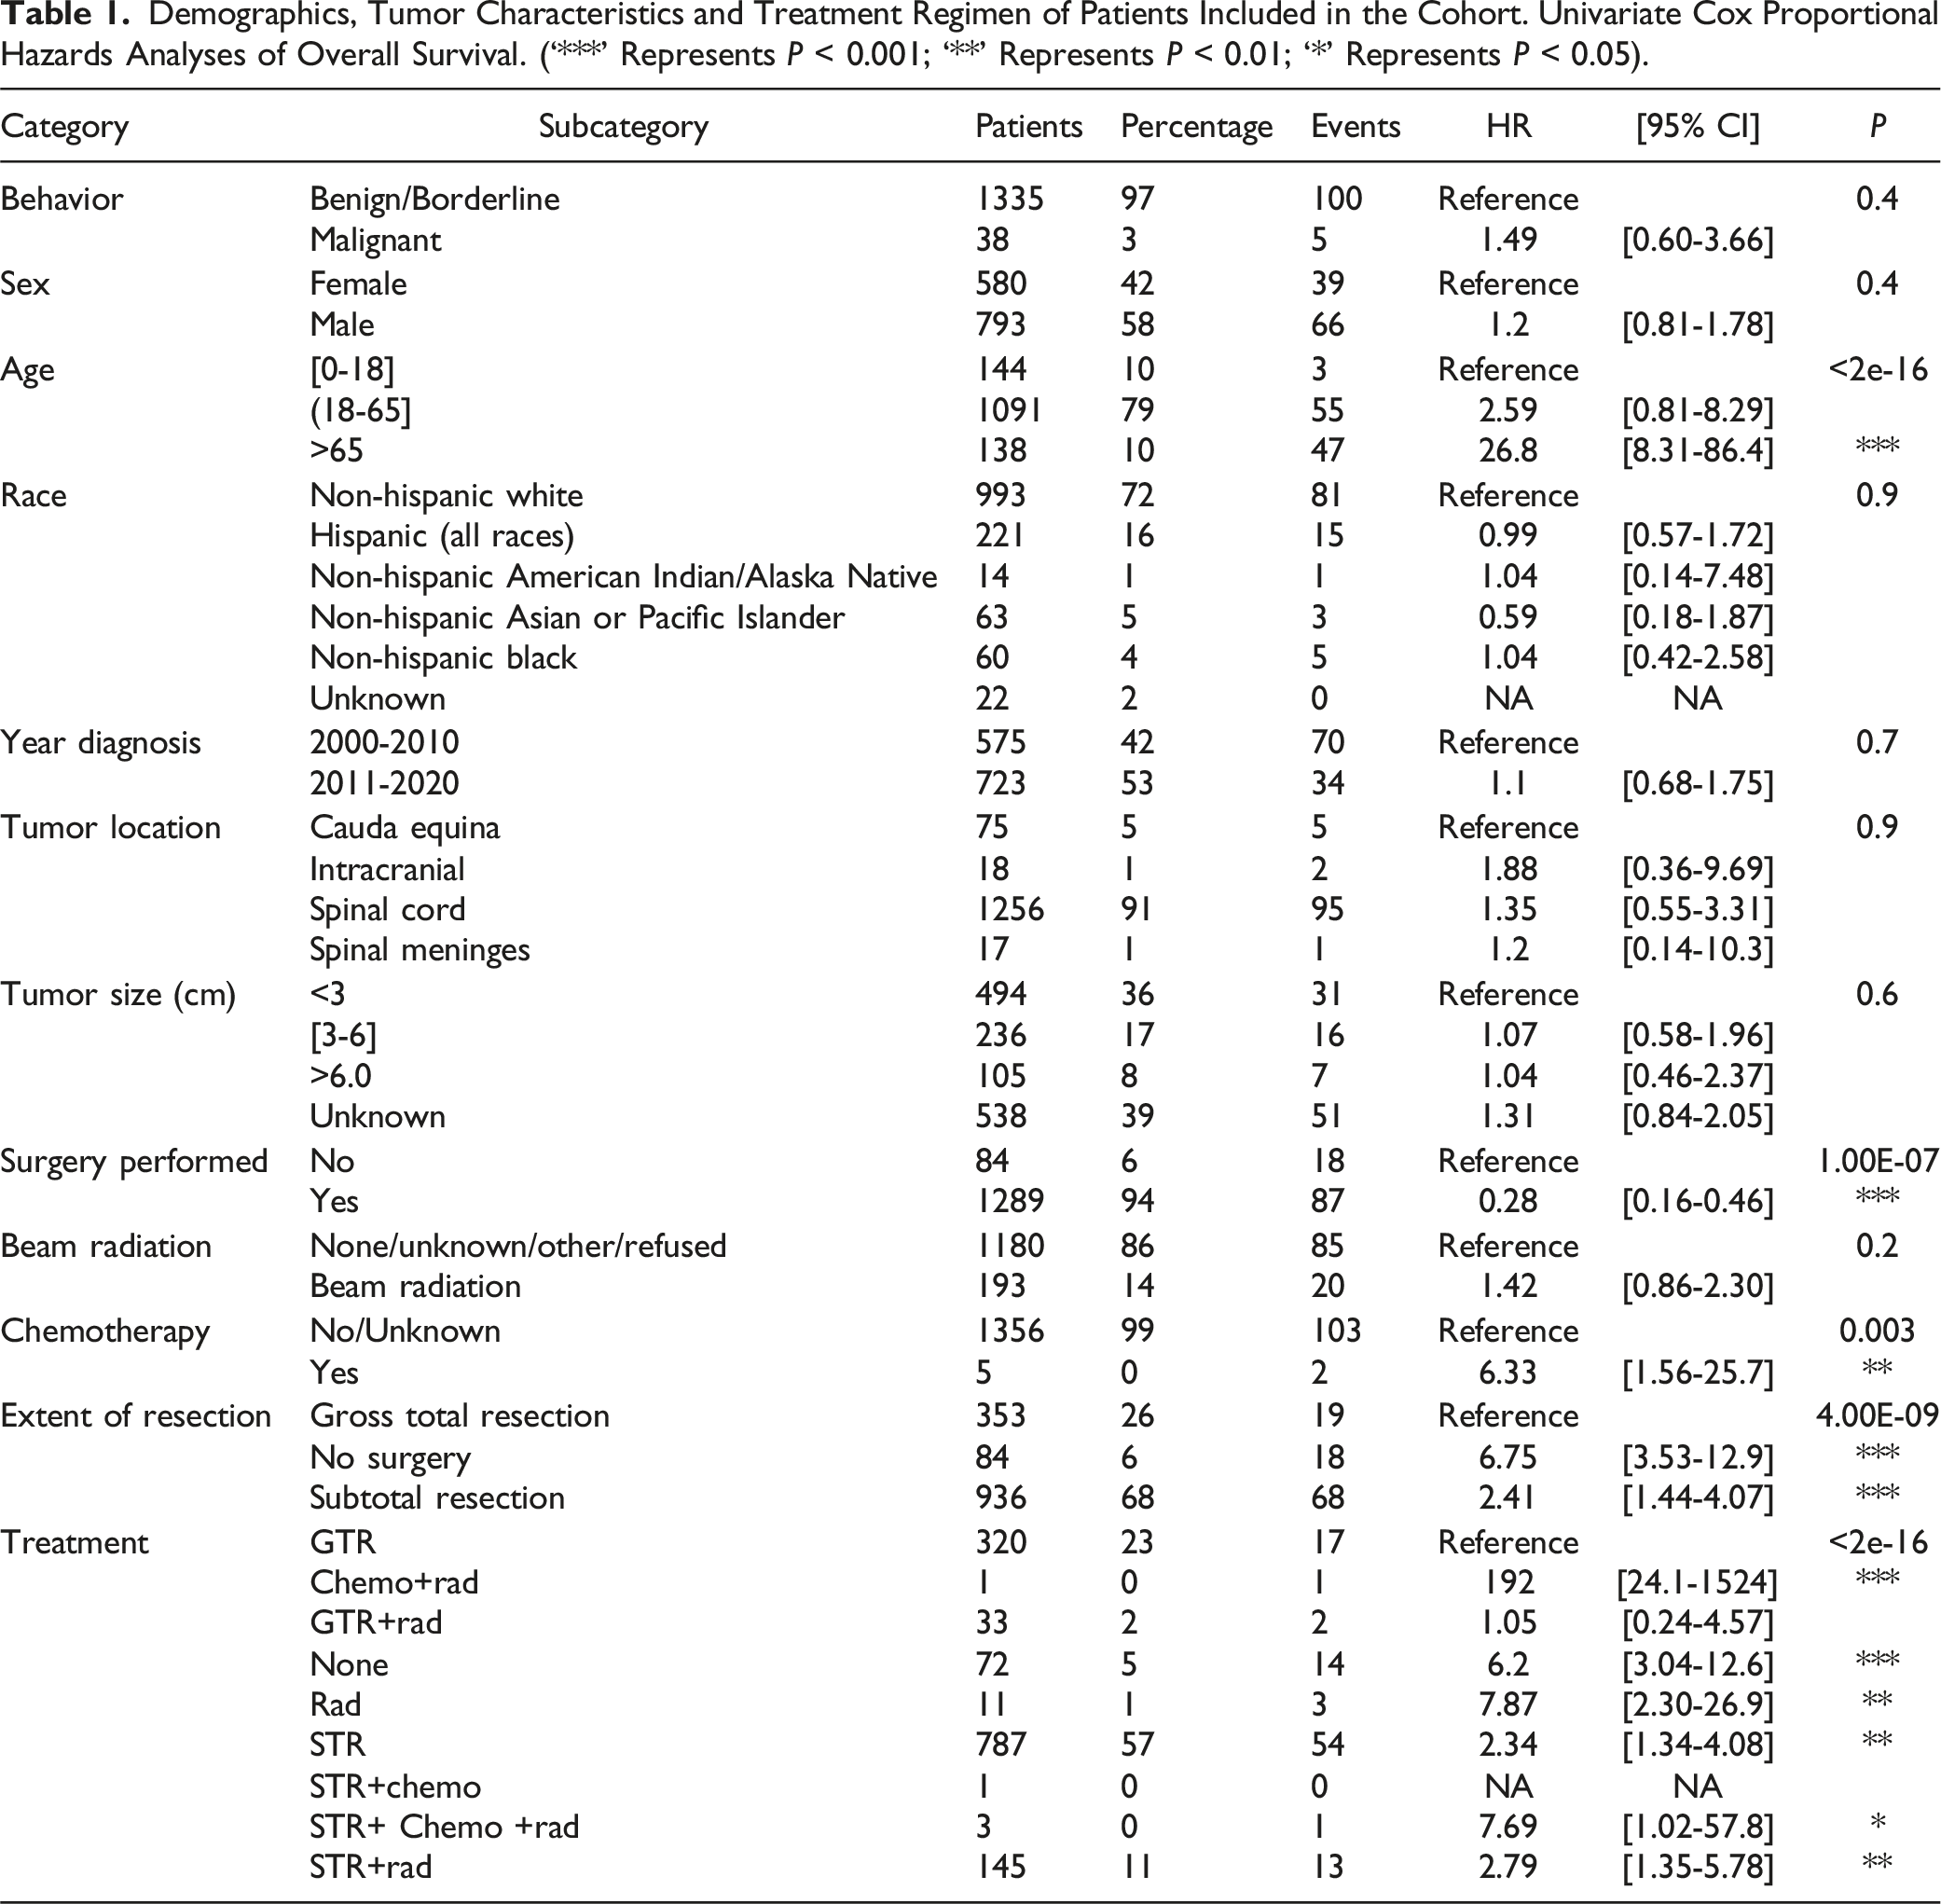
Demographics, Tumor Characteristics and Treatment Regimen of Patients Included in the Cohort. Univariate Cox Proportional Hazards Analyses of Overall Survival. (‘***’ Represents P < 0.001; ‘**’ Represents P < 0.01; ‘*’ Represents P < 0.05).
Treatment Modality
In this cohort, 1301 patients (95%) received treatment while 72 patients (5%) did not receive treatment. There were 320 patients (23%) that received only gross total resection (GTR), 787 patients (57%) that received only subtotal resection (STR), and 11 patients (1%) that received only radiation. The remaining patients in this cohort received a combination of treatments. There were 145 patients (11%) that received STR with radiation, 33 patients (2%) that received GTR with radiation, three patients (<1%) that received STR with chemotherapy and radiation, 1 patient (<1%) that received STR with chemotherapy, and 1 patient (<1%) that received chemotherapy and radiation. Since patients that received either STR with chemotherapy and radiation, STR with chemotherapy, or chemotherapy and radiation were less than 1% of the total cohort, we decided to exclude them from the analysis due to low number of patients.
Those patients that received GTR had the best OS when compared to basically all the other treatment modalities (P < 0.05). Although those patients that received GTR with radiation had no difference in OS compared to patients that received GTR (P = 0.08). Table 1 summarizes these results of our univariate Cox proportional hazard model for all the treatment modalities.
Multivariable Analysis
A multivariable Cox proportional hazard model was used on patient age and treatment modality used. These were the prognostic factors that had a statistically significant impact on OS based on the univariate Cox proportional hazard model (P < 0.05). Patients 65 or older still remained to have poorer OS compared to the pediatric cohort (age<19 years), based on the multivariable analysis (P < 0.001). Patients between 19 and 65 years had no difference in OS compared to the pediatric cohort (P = 0.09). When compared to GTR, all treatment modalities except for those that received GTR and radiation had poorer OS based on the multivariable analysis (P < 0.05). A forest plot was developed to display the results of the multivariable analysis (Figure 1). This is a forest plot of the multivariable Cox proportional hazard model, which includes patient age and treatments modalities received.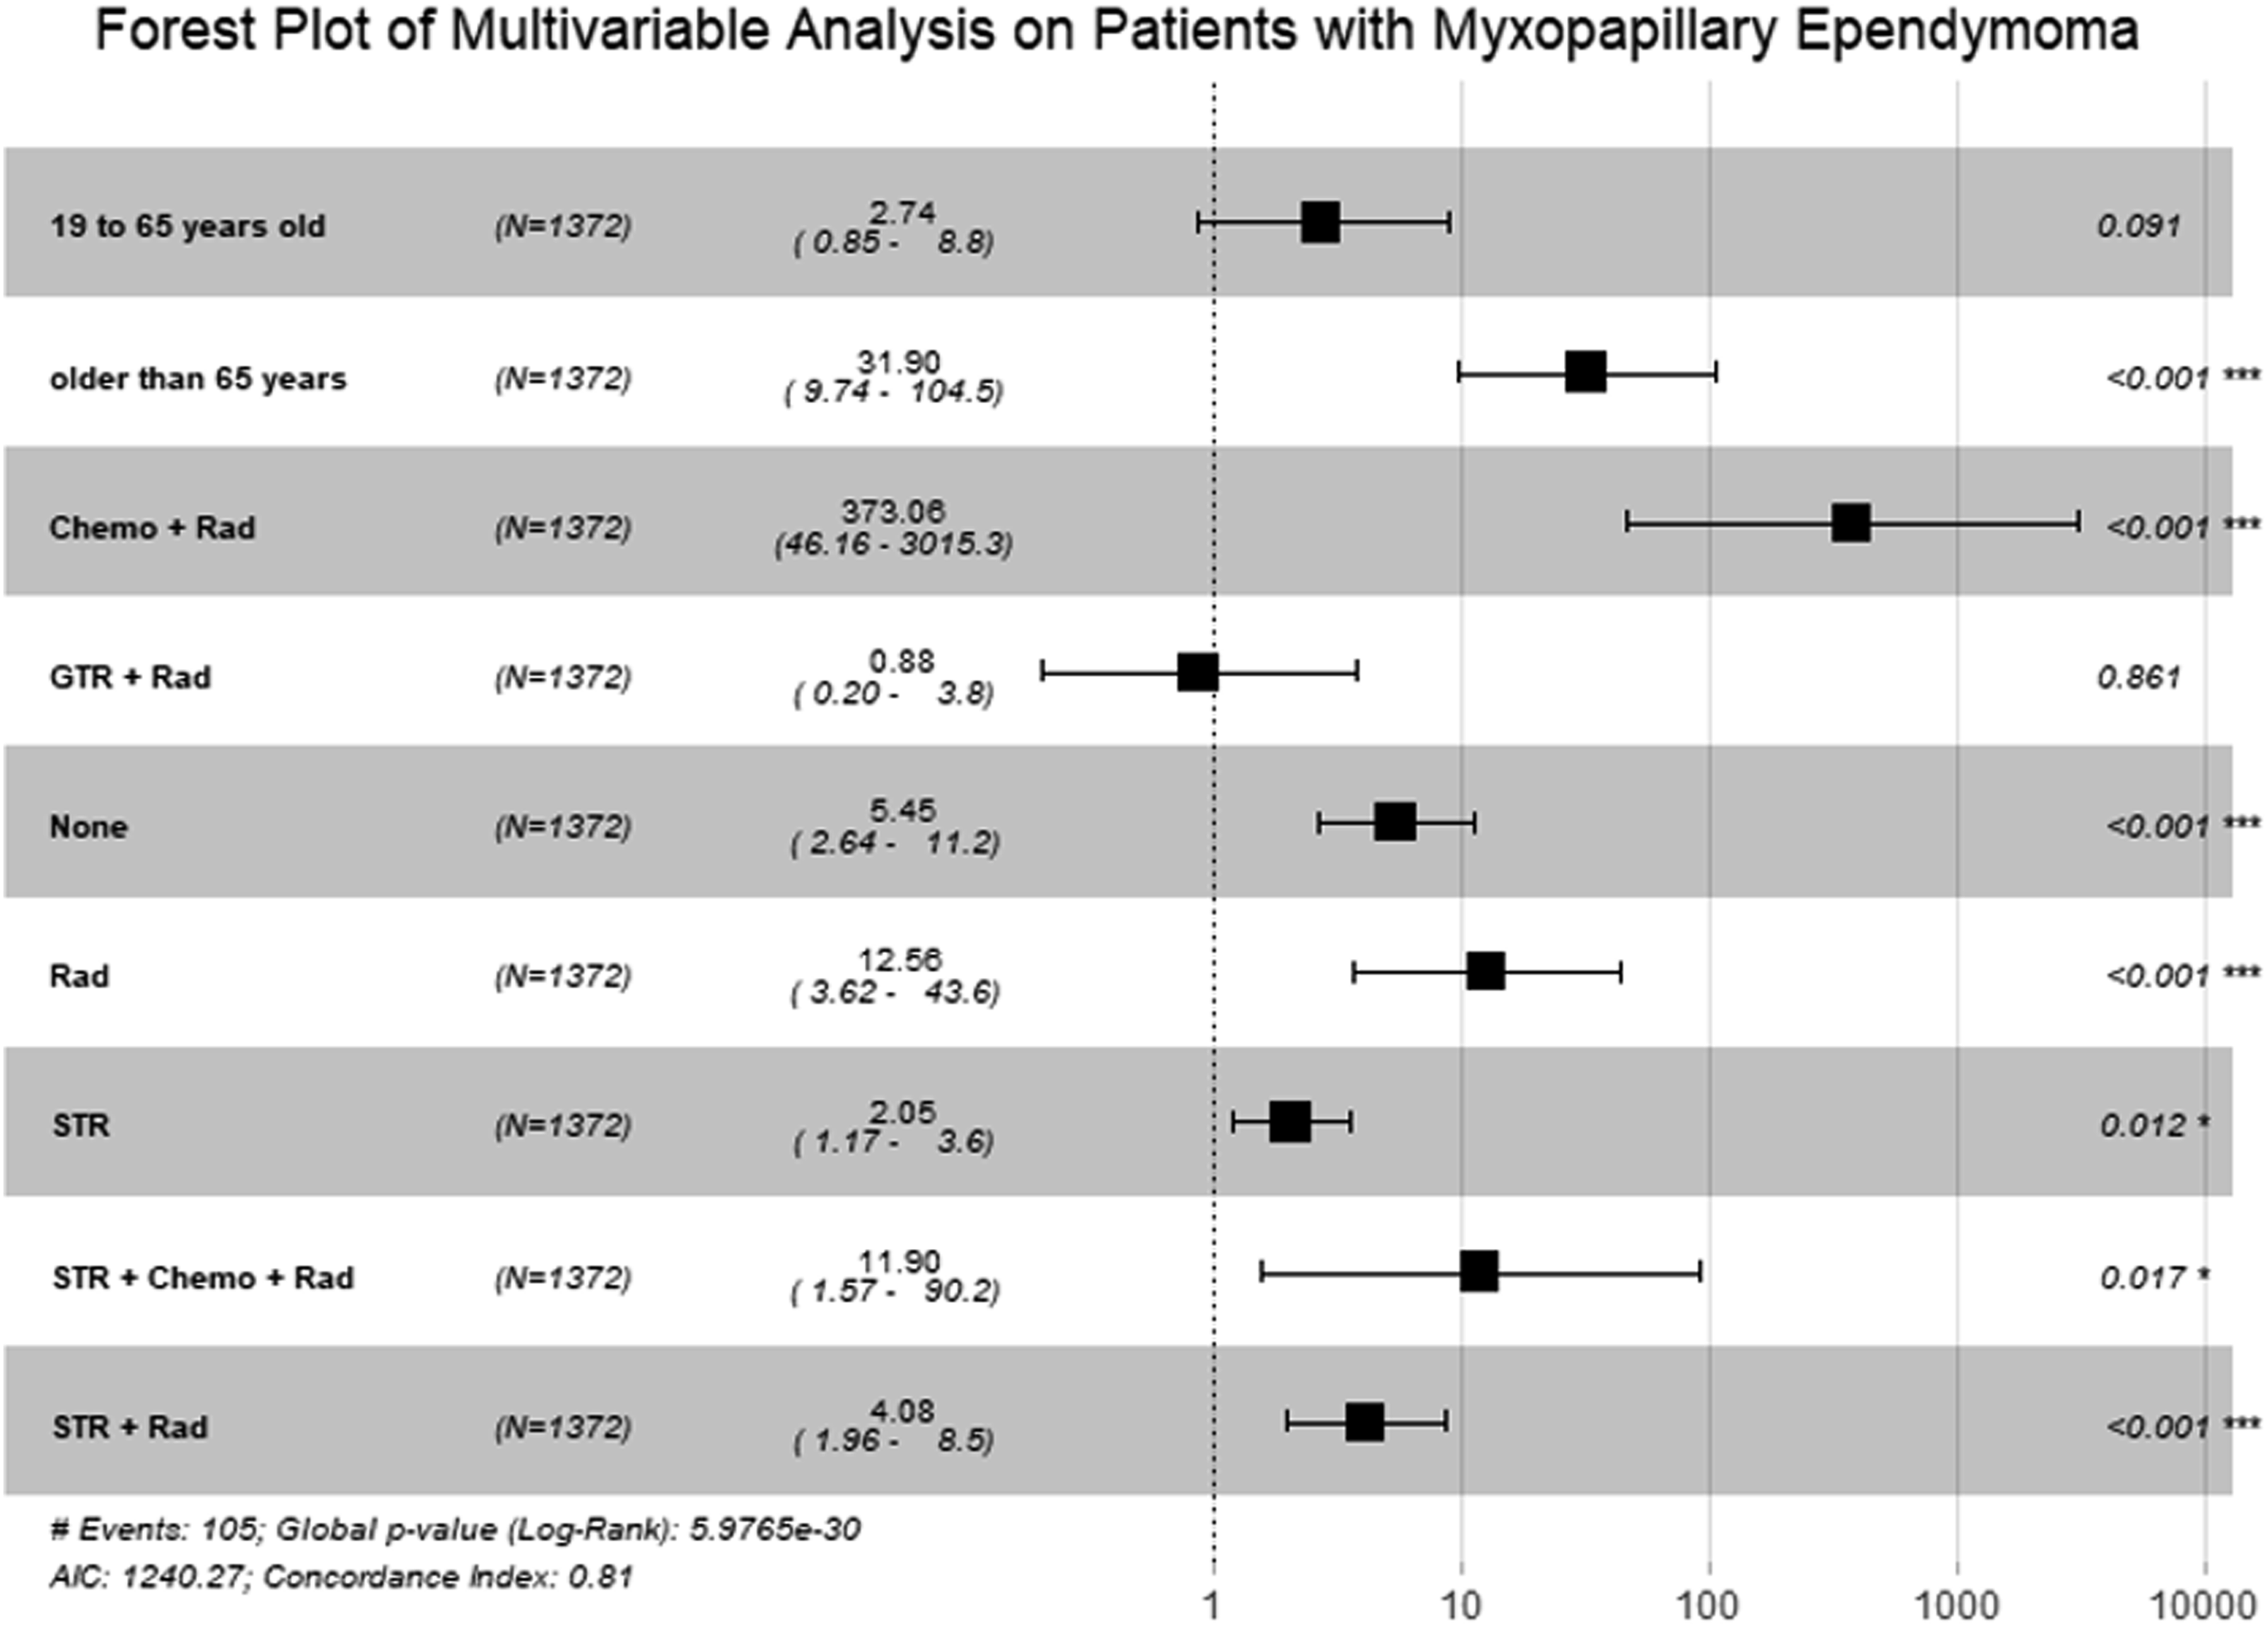
Survival Analysis
Using the Kaplan-Meier method, a subset of survival curves were generated. First, an overall survival curve of the entire cohort was generated (Figure 2(a)). The median OS was not met for our cohort. The 1-year, 2-year, 5-year, and 10-year OS were 98.3% (95% CI 97.6%–99%), 97.6 (95% CI 96.8%–98.5%), 95.7% (95% CI 94.6%–96.9%), and 91.3 (95% CI 89.4%–93.2%), respectively. We generated survival curves that compares the pediatric, adult and elderly age categories (Figure 2(b)). The median OS for pediatric and adult patients was not yet reached. The median OS for elderly patients was 125 months with 95% CI of 111 months to not yet reached. (a) This is a KM survival curve for the entire cohort. The median OS was still not reached for this cohort. (b) This graph illustrates the KM survival curves for each of the different age categories: 18 years or younger, 19 to 64 years old, and 65 years and older. The median OS was still not reached for the 18 years or younger and 19 to 64 years old age categories. The median OS for the 65 years and older age category was 125 months with a 95% CI of 111 months to not yet reached.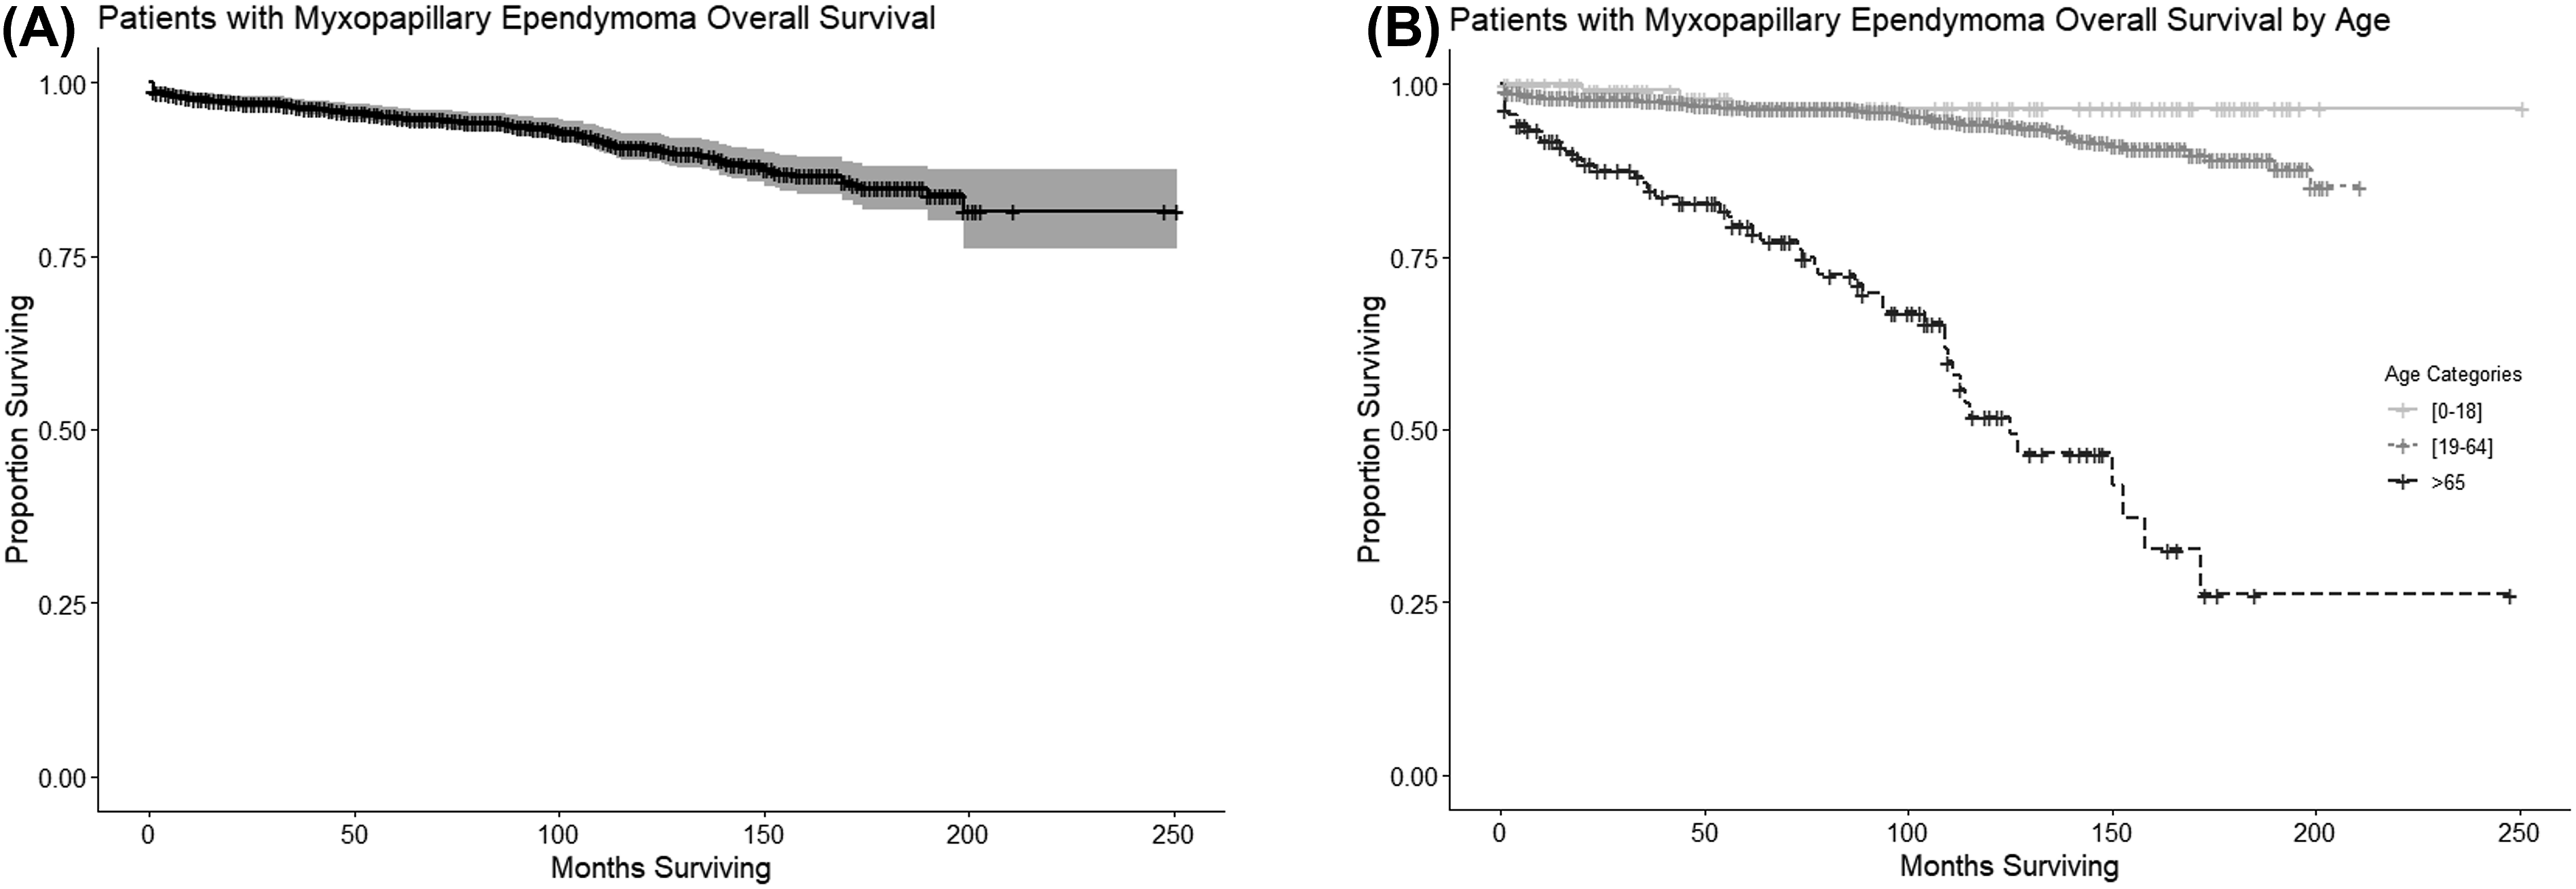
Additionally, we created survival curves to compare the different treatment modalities used to better understand how different treatments impacted OS (Figure 3). For this analysis, patients that received chemotherapy and radiation only, subtotal resection with chemotherapy, and subtotal resection with chemotherapy and radiation were excluded due the fact that each of these categories had very low number of patients (<1%). Patients that received no treatment had a median OS not yet reached with a 95% CI of 169 months to not yet reached. Patients that received GTR, STR, and STR with radiation had a median OS that was not yet reached with a 95% CI not yet reached. Patients that received GTR with radiation had a median OS of 199 months with a 95% CI not yet reached. Patients that received radiation only had a median OS not yet reached with a 95% CI of 90 months to not yet reached. This graph displays the KM survival curves by each treatment modality. For this analysis, patients that received chemotherapy and radiation only, subtotal resection with chemotherapy, and subtotal resection with chemotherapy and radiation were excluded due the fact that each of these categories had very low number of patients (<1%). Patients that received no treatment had a median OS not yet reached with a 95% CI of 169 months to not yet reached. Patients that received GTR, STR, and STR with radiation had a median OS that was not yet reached with a 95% CI not yet reached. Patients that received GTR with radiation had a median OS of 199 months with a 95% CI not yet reached. Patients that received radiation only had a median OS not yet reached with a 95% CI of 90 months to not yet reached.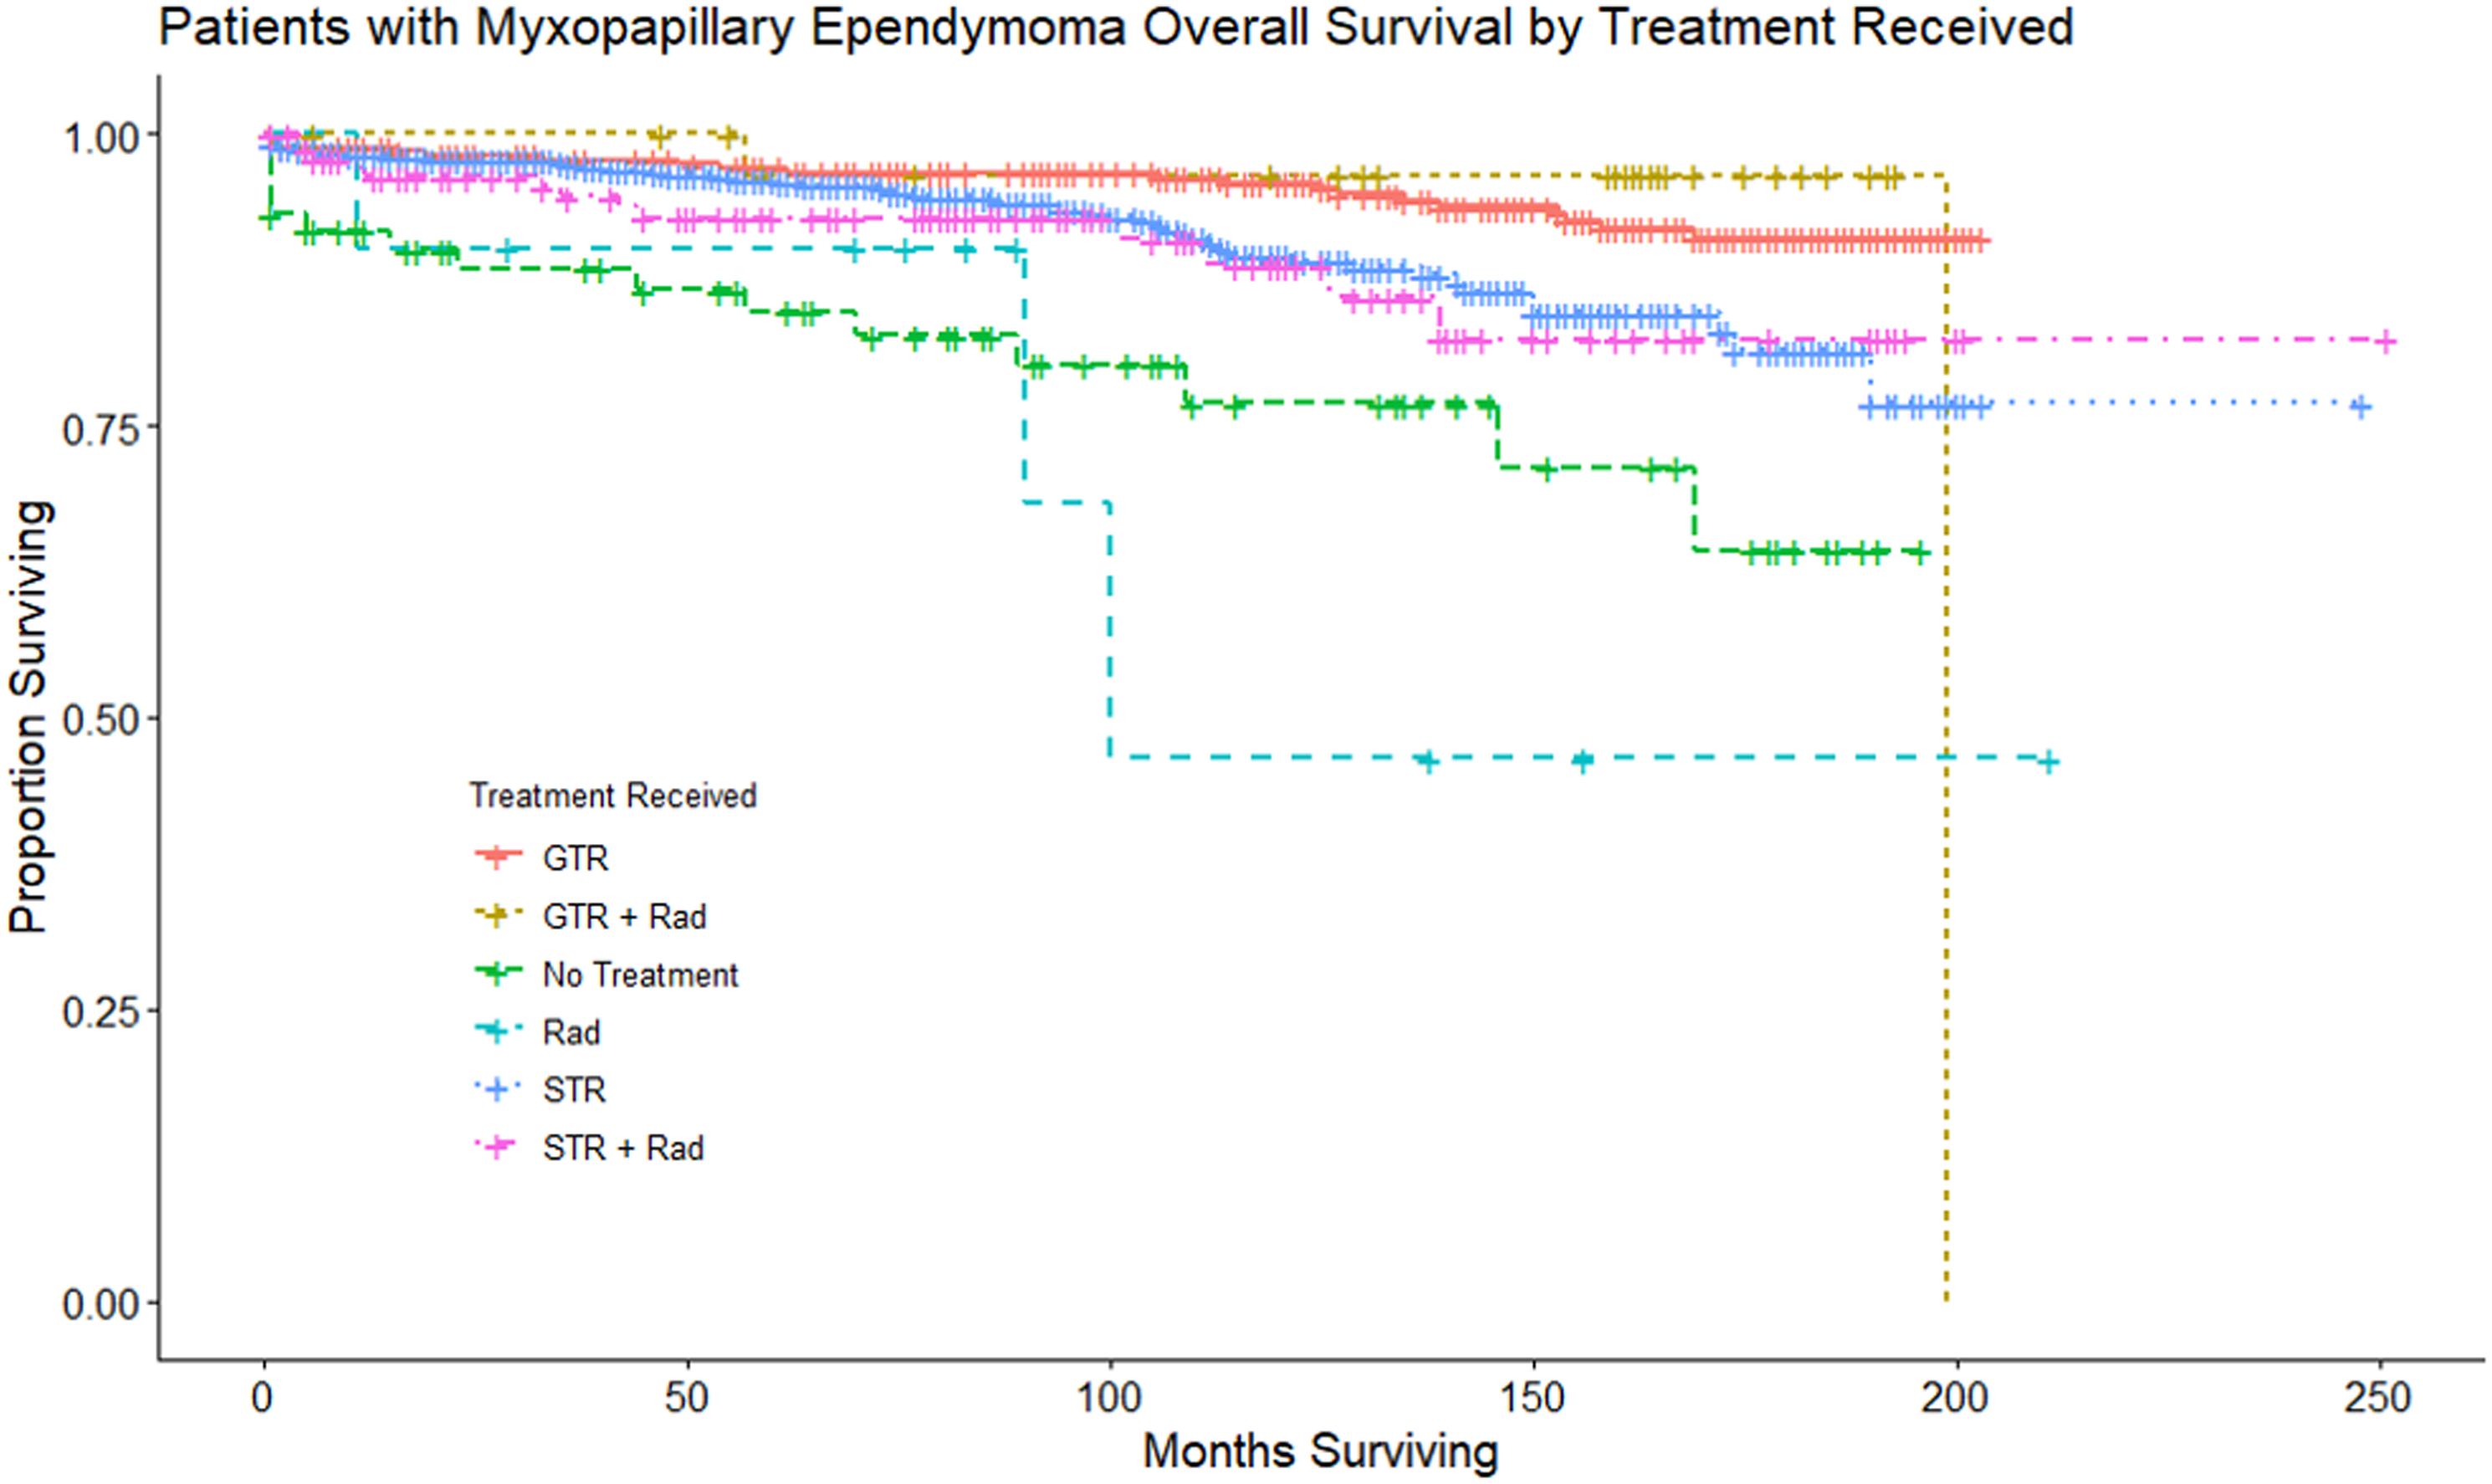
Nomogram
We developed a nomogram to help guide treatment for patients with MPEs, incorporating statistically significant prognostic factors found in our Cox proportional hazard models above (Figure 4(a)). Our nomogram included patient age and different treatment modalities as the primary prognostic factors. An internal verification of this prognostic nomogram was calculated using the entire dataset and confirmed using bootstrapping verification. The nomogram was found to have a concordance-index (C-index) of 0.80 (95% CI of 0.71 to 0.90). This indicates that there is a strong congruence between the findings on the nomogram and the actual results in the internal verification. A calibration plot was built as well showing strong congruence between the predicted model and the actual survival results for the first 100 days (Figure 4(b)). A Receiver Operating Characteristic (ROC) curve shows acceptable discrimination with an area under the curve (AUC) value of 0.77. (Figure 4(c)). (a) This is a predictive nomogram which includes age and treatment modalities received as the two primary variables. These were chosen as they were the only statistically significant prognostic factors found using Cox proportional hazard model analysis. (b) This is a calibration plot that predicts the ability of this nomogram to correctly predict survival probability across the first 100 days from diagnosis. The black line represents the actual data while the blue line represents the predicted data. This calibration plot has a mean error of 0.01. (c) This is a Receiver Operating Characteristic (ROC) curve that shows acceptable discrimination with an area under the curve (AUC) value of 0.77.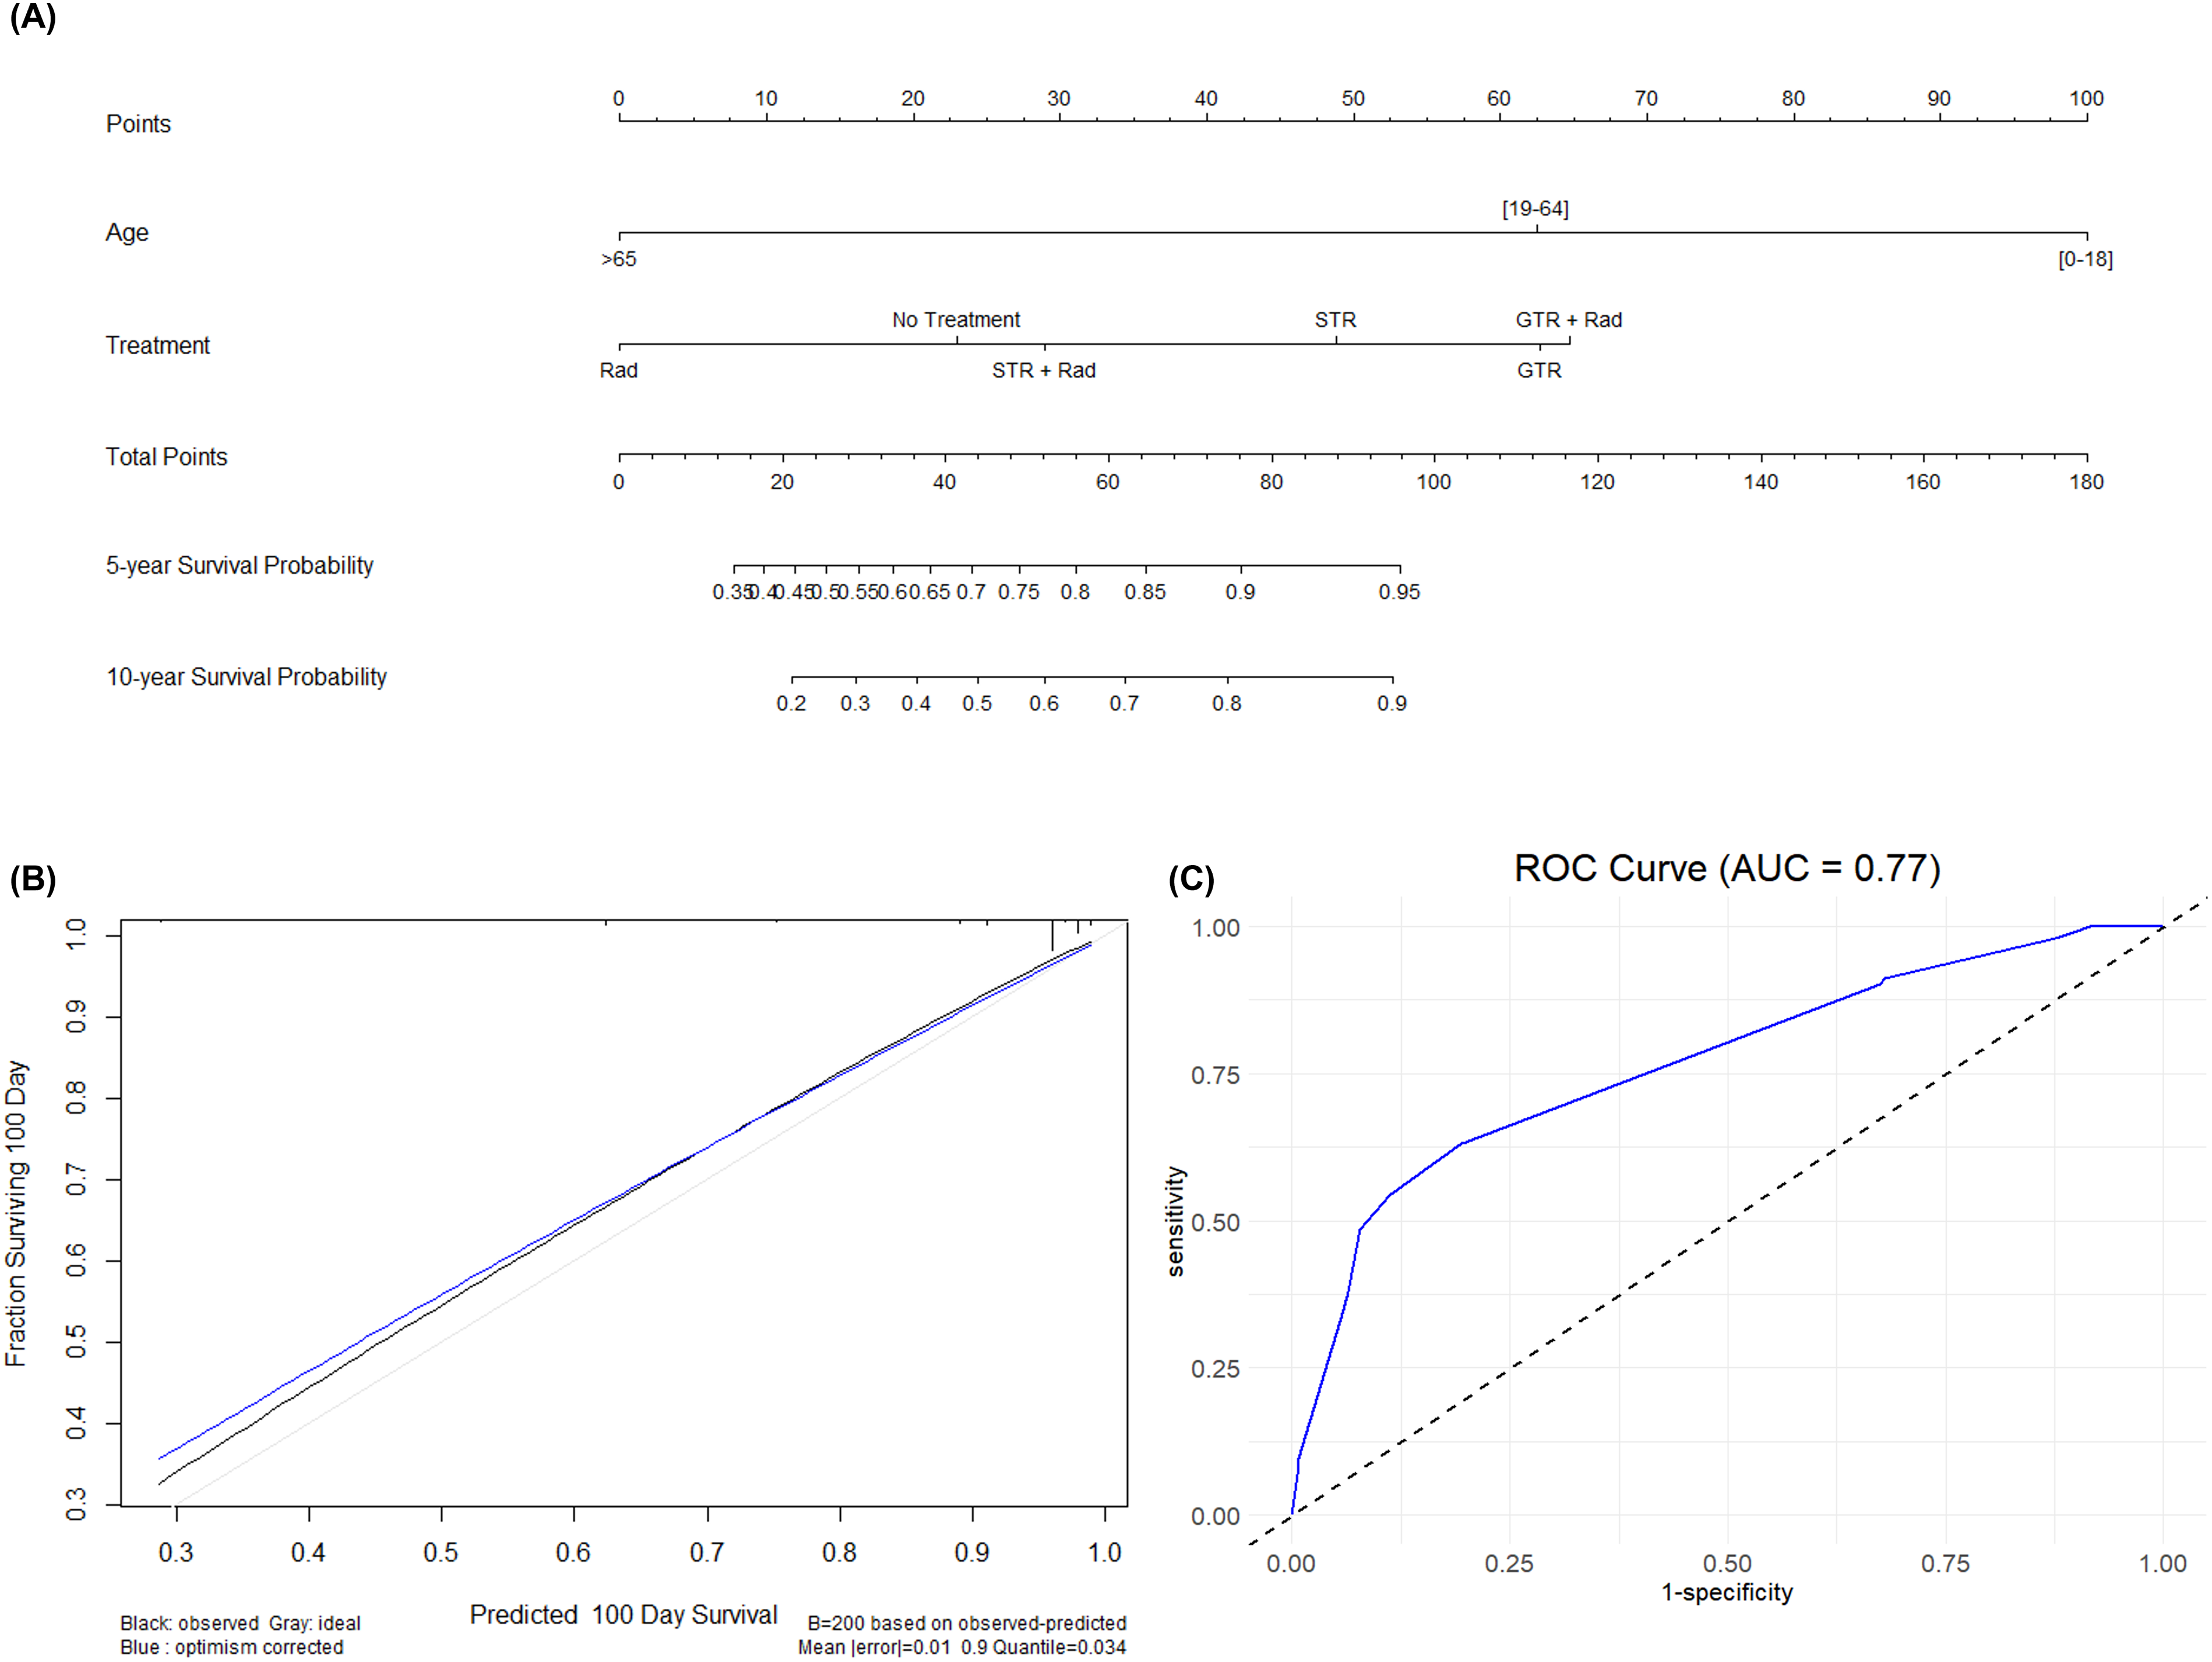
Discussion
Even though MPE have been historically considered to be benign tumors, they still are complex tumors to treat due to their likelihood of recurrence and dissemination. The reclassification of this tumor to grade 2 by the 2021 WHO classification is a testament to the challenges faced when treating patients with MPE. For this reason, it is necessary to conduct large cohort analyses in hopes to attain better prognostication and guidance for the most optimal treatment options. In the current study, we present 1 of the largest retrospective cohort analyses on patients with MPE.
Age at Diagnosis
Most of the patients with MPE in our cohort were between the ages of 19 and 65. However, patients older than 65 years were found to have the worst OS. Other studies have also highlighted age as a prognostic indicator of survival. Bates et al reported improved outcomes in patients with MPE younger than 30 years. 22 Similarly, a prospective study at MD Anderson Cancer Center found that patients younger than 35 years had a survival benefit. 1 Interestingly, although prior studies report improved OS in younger patients, multiple studies also report worse progression-free survival (PFS) in younger patients relative to older patients. [cite] In fact, 1 study focused on pediatric patients with MPE found that over half the patients presented with disseminated spinal disease at the time of diagnosis. Given the extensive surgical resection often required to treat patients with MPE, the discrepancy between PFS and OS may stem from better functional status and reduced disease burden in younger patients compared to older ones. 22
Treatment Modalities
The most optimal treatment strategy for patients with MPE still remains unclear. Achieving complete surgical resection might be technically challenging due to the complexity of the cauda equina anatomy. Upon reviewing the literature, the general frequency of GTR is between 27 and 100%. 23 In our study, there were 353 patients (26%) that received GTR while 936 patients (68%) in total received STR. Feldman and colleagues performed a systematic review of 28 articles in total including 475 patients which showed that GTR was associated with reduced recurrence rates compared to STR. 5 Meanwhile, Akyurek and colleagues looked at a smaller cohort of patients with MPE at the MD Anderson Cancer Center where they found that the extent of resection was not associated with improved OS or PFS. 1 In the present study, our findings showed improved OS with GTR compared to STR; however, we did not have any information on recurrence rate, so it was not possible to assess whether extent of resection had an impact on tumor recurrence. This limitation is addressed in more detail later in the text. The role of adjuvant radiation therapy (RT) still remains controversial. In Feldman and colleagues’ systematic review adjuvant RT was not associated with low overall recurrence. 5 Contrary to this finding, a retrospective cohort analysis of 183 patients with spinal MPE at the MD Anderson Cancer Center and the Rare Cancer Network concluded that patients that didn’t receive GTR or didn’t receive adjuvant RT had a higher likelihood of tumor recurrence or progression. 12 Their recommendation was to give high-dose adjuvant RT (>50 Gy) for those patients that undergo STR. Another study followed patients for 11 years and found that adjuvant RT improves tumor progression irrespective of the extent of surgery. 24 In contrast to some of these studies, our study shows no difference with the use of adjuvant RT in the survival of patients regardless of the extent of resection. This can be concluded simply based on the findings that those patients that received GTR with adjuvant RT had no statistically significant difference in OS compared to patients that received GTR alone. Also, when comparing patients that received GTR those patients that received STR and those that received STR with adjuvant RT both had poorer OS. Therefore, it appears that adjuvant RT did not impact the OS of patients, especially if it did not provide a survival benefit to those patients that received STR. This may be due to the lack of standardized adjuvant RT dosing system. 12 This also may be a result of limited follow-up period inherent to the SEER database studies.
In addition, the role of adjuvant chemotherapy is still not completely understood, mainly due to the lack of literature exploring the use of this treatment modality. One case is reported in the literature which shows remarkable efficacy of temozolomide use for the treatment of a recurrent spinal MPE in a patient. 25 In our entire cohort, only 5 patients received adjuvant chemotherapy. Given the low number of patients, we excluded them from our final analysis. Currently, the general guidelines suggest that chemotherapy can be a viable option for treatment in those patients whose disease does not respond to surgery or RT. 26
Nomogram
Our study is unique from prior studies on MPE due to the development of a predictive nomogram based on statistically significant factors found in the Cox proportional hazard models. To our knowledge, this is the first ever nomogram built for this specific patient population. We believe that this tool holds promise in the field of cancer research by providing a method for clinicians to quickly assess survival probability and guide treatment. Although it is possible to build a nomogram with variables that are not statistically significant, we chose to only use the variables that were found to have statistically significant impact on OS.
Limitations
There are several limitations to this study that should be addressed in future studies. Ideally, these tumor related studies should be performed prospectively as the retrospective analyses may have inherent bias in terms of cohort selection. Some of the limitations, however, are inherent to the SEER database. The SEER database does not include details about the progression of disease post-treatment, perioperative performance status, recurrence rate of tumor, whether repeat surgery was needed, the radiation dose, type of radiation received, and type of chemotherapy received. In addition, number of tumors (1 vs multiple) and data about social determinants of health such as level of income or treatment facility (academic center vs non-academic) were not available for this tumor, which could have enhanced our analysis further. These are a few details we believe might benefit our understanding of prognostication and treatment for this tumor.
Conclusion
In conclusion, here we present 1 of the largest retrospective cohort studies to look at patients with MPE. Our findings show that those patients diagnosed at an older age (65 years or older) had the poorest OS. We also show that GTR has the best OS in terms of treatment. Contrary to some prior studies, we show that adjuvant RT does not provide a survival benefit. However, further studies are needed to look at longer follow-up to better assess tumor progression. Additionally, metabolomic, genetic or immunohistochemical studies are also needed to identify potential tumor markers for not only prognostication but also optimal management.
Footnotes
Acknowledgements
We do not have any acknowledgements to disclose.
Author Contributions
All authors contributed significantly to the experimental design, its implementation, or analysis and interpretation of the data. All authors were involved in the writing of the manuscript at the draft and revision stages and have read and approved the final version.
Declaration of conflicting interests
The author(s) declared no potential conflicts of interest with respect to the research, authorship, and/or publication of this article.
Funding
The author(s) received no financial support for the research, authorship, and/or publication of this article.
Contributionship
Conceptualization: AB, SA, JC, AH, VP, AO. Data curation: AB, SA. Formal analysis: AB, SA, JC. Investigation: AB, SA, JC, AH, VP, AO. Methodology: AB, SA, JC, AH. Supervision: JC, VP, AO, Validation: AB, SA, JC, AH, VP, AO, Visualization: AB, SA, JC, AH, VP, AO, Writing – Original draft: AB, SA, JC, AH, VP, AO. Writing – Review & Edition: AB, SA, JC, AH, VP, AO.