
Abstract
Study Design
Bioinformatics analysis of Gene Expression Omnibus (GEO).
Objective
Ossification of the ligamentum flavum (OLF) and ankylosing spondylitis (AS) represent intricate conditions marked by the gradual progression of endochondral ossification. This investigation endeavors to unveil common biomarkers associated with heterotopic ossification and explore the potential molecular regulatory mechanisms.
Methods
Microarray and RNA-sequencing datasets retrieved from the Gene Expression Omnibus (GEO) repository were harnessed to discern differentially expressed genes (DEGs) within the OLF and AS datasets. Subsequently, Weighted Gene Co-expression Network Analysis (WGCNA) was implemented to pinpoint co-expression modules linked to OLF and AS. Common genes were further subjected to an examination of functional pathway enrichment. Moreover, hub intersection genes were identified using the Least Absolute Shrinkage and Selection Operator (LASSO) regression, followed by an evaluation of diagnostic performance in external OLF and AS cohorts. Lastly, an analysis of immune cell infiltration was conducted to scrutinize the correlation of immune cell presence with shared biomarkers in OLF and AS.
Results
A total of 1353 and 91 Differentially Expressed Genes (DEGs) were identified in OLF and AS, respectively. Using the Weighted Gene Co-expression Network Analysis (WGCNA), 2 modules were found to be notably significant for OLF and AS. The integrative bioinformatic analysis revealed 3 hub genes (MAB21L2, MEGF10, ISLR) as shared risk biomarkers, with MAB21L2 being the central focus. Receiver Operating Characteristic (ROC) analysis exhibited a strong diagnostic potential for these hub genes. Gene Ontology (GO) analysis indicated their involvement in the positive regulation of myoblast proliferation. Notably, MAB21L2 was singled out as the optimal common biomarker for OLF and AS. Furthermore, an analysis of immune infiltration demonstrated a correlation between MAB21L2 expression and changes in immune cells. Activated CD8 T cells were identified as shared differential immune infiltrating cells significantly linked to MAB21L2 in both OLF and AS.
Conclusion
This study represents the first instance of identifying MAB21L2 as a prospective diagnostic marker for patients contending with OLF associated with AS. The research results indicate that the ECM-receptor interaction and the cell-cell adhesion may play a role in both disease processes. This newfound knowledge not only enhances our understanding of the pathogenesis behind spinal ligament ossification but also uncovers potential targets for therapeutic interventions.
Keywords
Introduction
Ankylosing spondylitis (AS) is a persistent inflammatory ailment that predominantly impacts the axial skeleton, particularly the sacroiliac joints and spine, giving rise to distinctive inflammatory dorsalgia.1,2 It affects .55% of populations of European ancestry (herein termed Europeans) 3 and .23% of Chinese, 4 but is uncommon in Africans and Japanese. In addition to inflammatory back pain and arthritic degeneration, pathological new bone formation and spinal ankylosis stand as primary hallmarks of AS. When osteophytes span the entirety of a joint, the implicated joint becomes immobilized, culminating in axial joint rigidity, spinal ankyloses, and the potential for enduring disability. Although current treatments effectively quell inflammation in active AS, including nonsteroidal anti-inflammatory drugs (NSAIDs), Tumor Necrosis Factor Alpha (TNF-α) antibodies, and interleukin-17 inhibitors, these therapeutic interventions do little to mitigate the radiographic advancement of AS.5-7
Ossification of the ligamentum flavum (OLF) is a prevalent spinal disorder characterized by the ectopic ossification of the ligamentum flavum, often serving as a leading etiology of thoracic spinal stenosis. 8 It is most commonly found in middle-aged and elderly individuals, with a higher frequency of reports in Asia.9,10 It predominantly occurs in the lower thoracic vertebrae. 9 The pathological process of OLF involves endochondral ossification. The pathogenesis of OLF is influenced by a combination of systemic and local factors, including genetic predisposition, metabolic disturbances, abnormal secretion of sex hormones, and mechanical stress. However, the precise etiology and mechanisms underlying the transition from normal ligaments to ossified structures in OLF remain elusive. Investigating the molecular targets and cellular mechanisms of ectopic ossification in OLF could potentially provide more effective therapeutic options for this condition.
Ossification of the ligamentum flavum and AS both manifest in spinal ligament ossification. Although the pathogenesis of AS is not yet fully understood, inflammation and new bone formation have been recognized as the primary pathological processes in AS. 11 The supraspinous ligaments and ligamentum flava are the main targets of ossification in AS,12,13 resulting in severe pathological changes. Prior research endeavors have underscored the significance of genetic predisposition and the role of inflammatory responses in OLF and AS, with an exploration of susceptibility loci in each of these maladies. 14 Activation of the inflammatory response likely plays a contributory role in promoting the osteoblastic differentiation of ligament fibroblasts in OLF. 15 MRI examinations of patients with AS indicate that the emergence of new bone formation in vertebral syndesmophytes is more inclined to transpire in regions with prior inflammation rather than in areas devoid of inflammation. 16 Moreover, inflammation promoted the expression of osteoinductive proteins and indirectly facilitated the pathological formation of new bone at the enthesis. 17 Based on the premise that inflammation triggers the reparative process preceding new bone formation, the inefficacy of anti-inflammatory treatments can be attributed to their administration occurring too late to preempt ectopic new bone development in AS patients who conform to diagnostic criteria involving enthesitis and unequivocal radiographic sacroiliitis. Furthermore, the preponderance of new vertebral syndesmophytes emerges at locations devoid of prior evidence of inflammation,18,19 implying that new bone formation in AS is not solely induced by inflammation.
The pathological progression of OLF and AS entails the process of endochondral ossification. 20 However, the precise mechanism underlying pathological new bone formation in OLF and AS remains elusive. Osteophytes arise through the process of endochondral ossification, involving the differentiation of periosteal cells into chondroblasts and subsequently into osteoblasts. 1 Notably, recent observations have revealed chondrocyte differentiation within the ligaments of early-stage AS patients, with subsequent cartilage formation followed by calcification. 21 Nonetheless, there is a paucity of research dedicated to unraveling the osteogenic mechanisms concerning transcriptional regulation and signaling pathways implicated in syndesmophyte formation in OLF and AS. Consequently, a broader spectrum of perspectives is imperative to delineate shared biomarkers and potential pathways associated with the advancement of ossification in spinal ligaments.
In light of the swift advancement in microarray and high-throughput sequencing technologies, bioinformatics methodologies have become increasingly prominent in investigating the interplay between diseases. The rapid evolution of bioinformatics approaches affords us a more profound comprehension of disease pathobiology at the genetic level.
22
Utilizing high-throughput methods and bioinformatics approaches could illuminate the fundamental mechanisms driving ectopic ossification, thereby elucidating the genetic basis for their analogous manifestations in spinal ligament ossification. In this investigation, publicly available gene expression data from the GEO database were scrutinized. A systems biology methodology was subsequently employed to delineate shared gene pathways and diagnostic markers between OLF and AS. Subsequent to this, an assessment of the interaction between these diagnostic markers and infiltrating immune cells was conducted, aiming to attain a more profound comprehension of the pathophysiological mechanisms potentially uniting OLF and AS. The findings offered preliminary insights into shared biomarkers and pathways implicated in the pathogenesis of OLF and AS, thereby unveiling novel therapeutic targets. The research flowchart of this research was shown in Figure 1. Research design flow chart.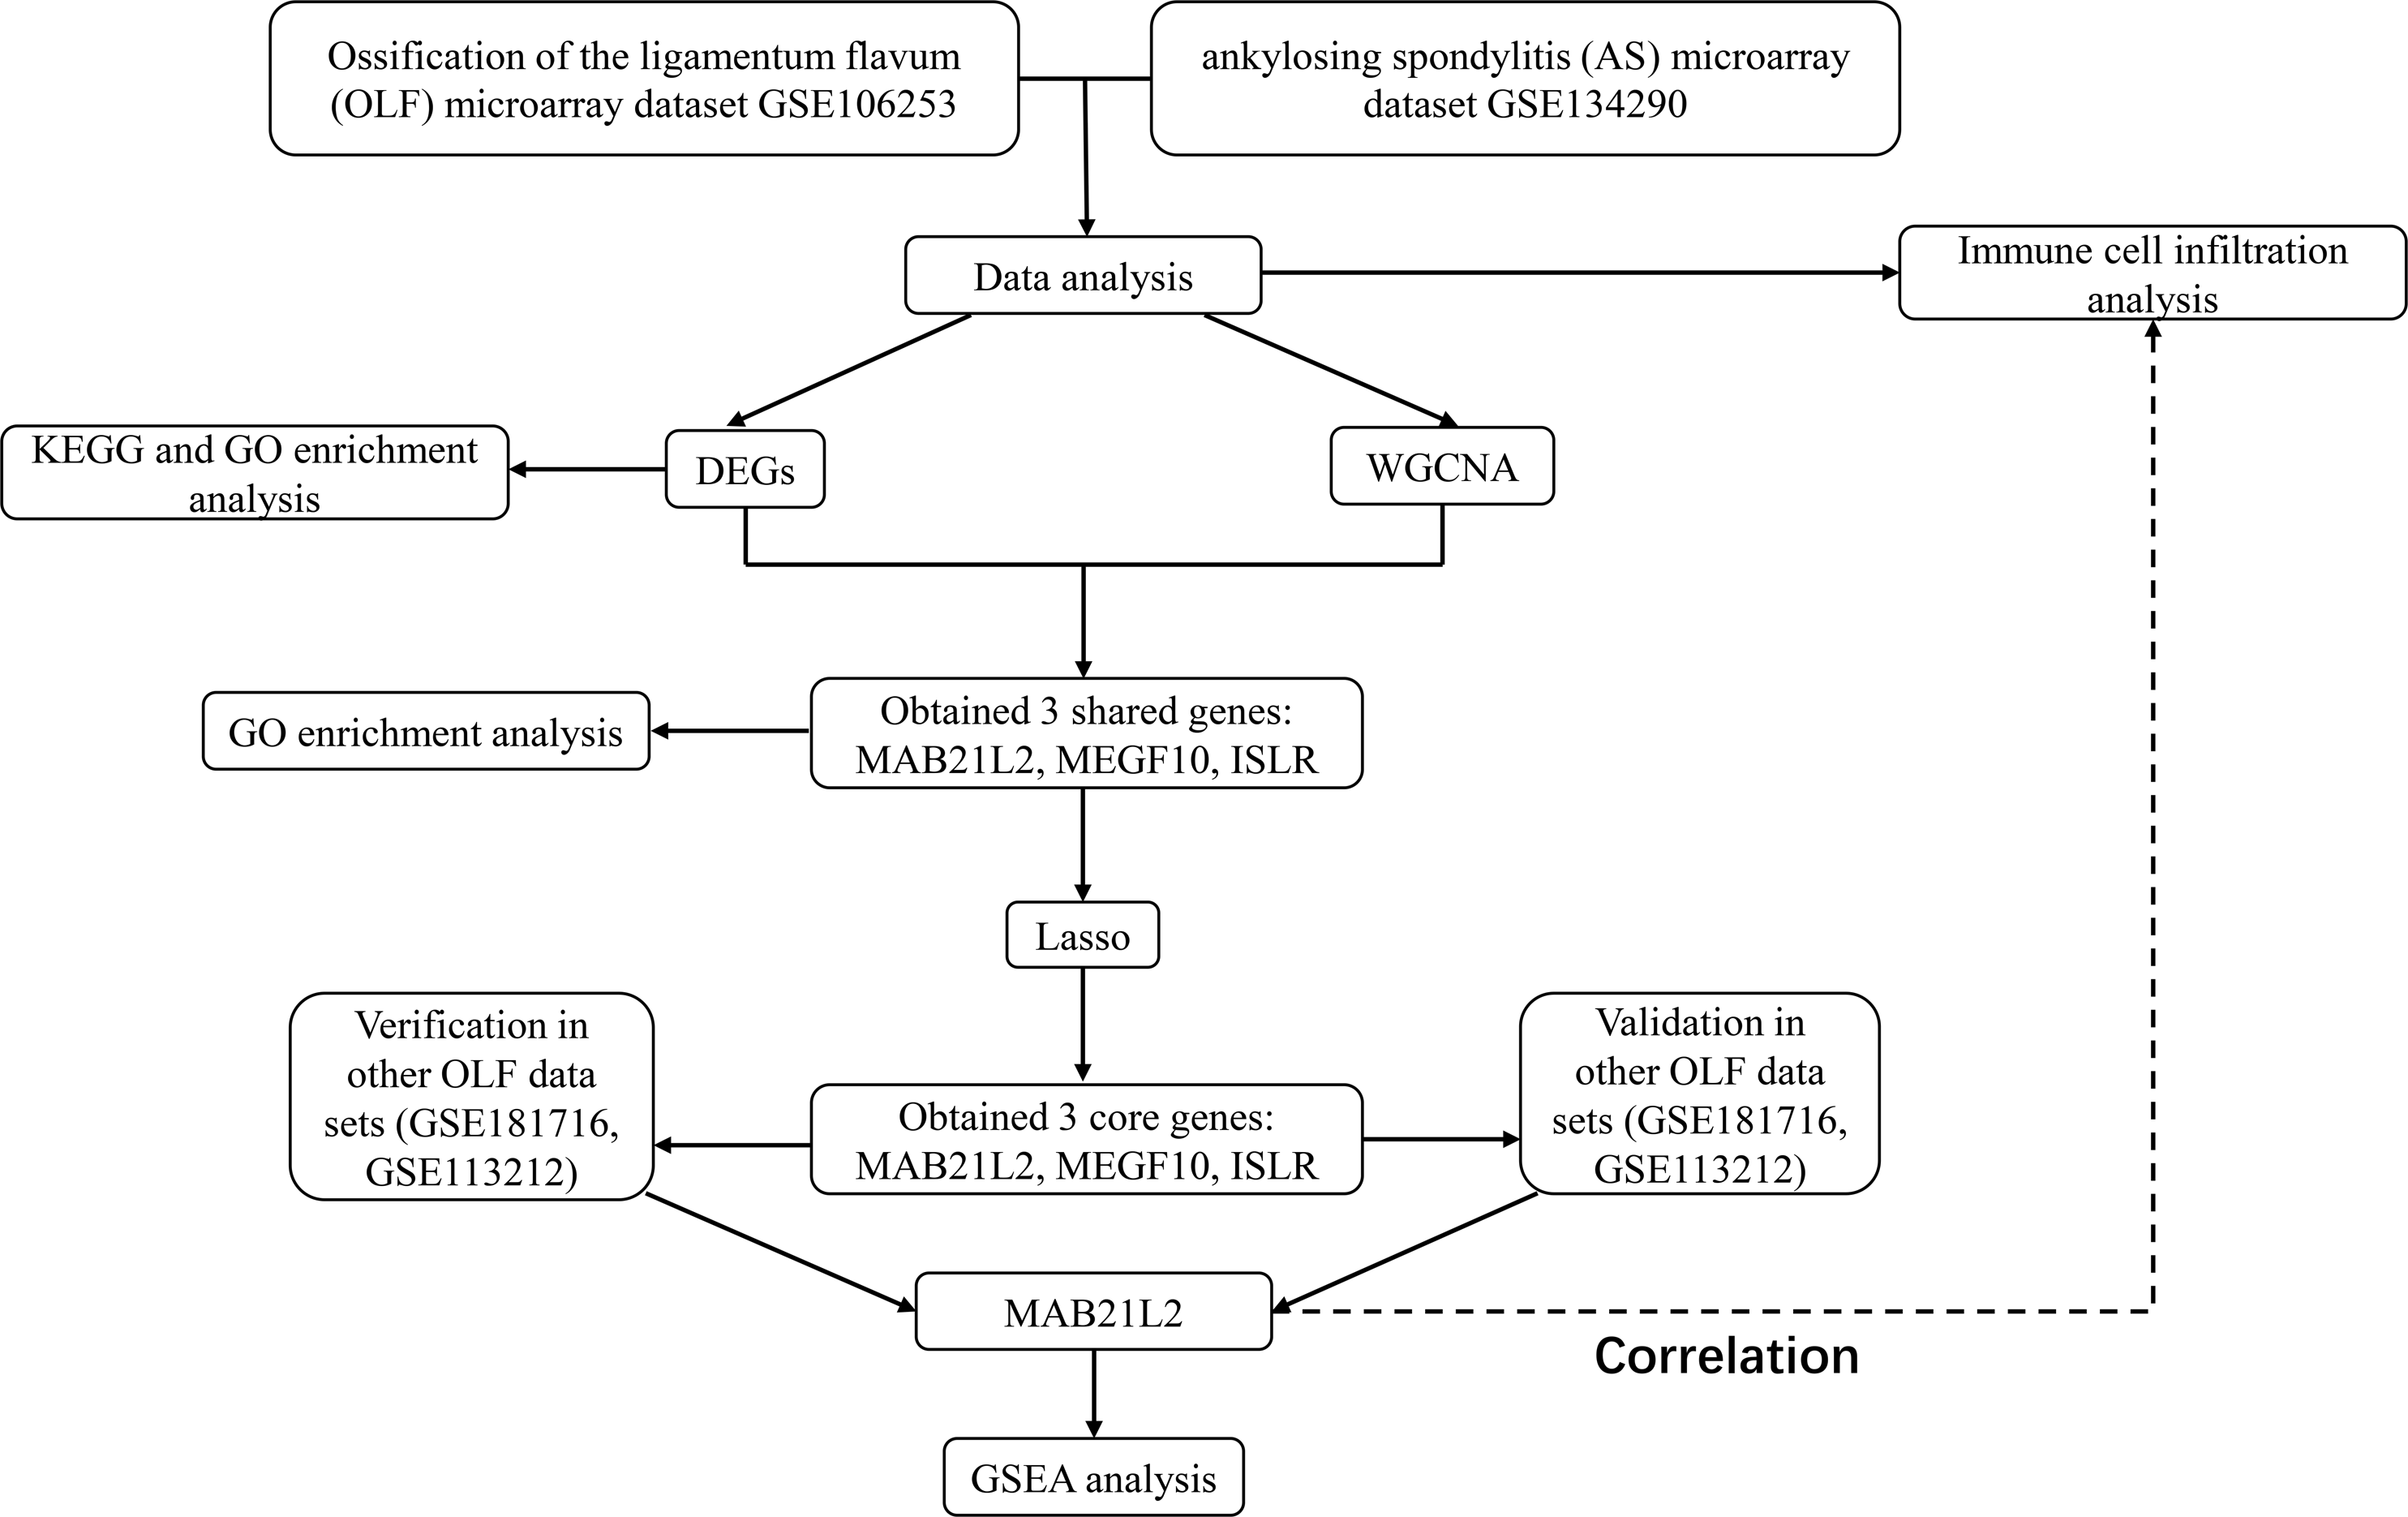
Materials and Methods
Data Collection and Preprocessing
The datasets GSE106253, GSE134290, GSE113212, GSE181716, GSE153310, and GSE73754 were acquired from the Gene Expression Omnibus (GEO) database at https://www.ncbi.nlm.nih.gov/gds/. For external validation, GSE113212, GSE181716, GSE153310, and GSE73754 were employed. The GSE106253 dataset, hosted on the GPL21827 platform, comprised 8 samples, including 4 OLF patients and 4 healthy controls. All individuals were Chinese. The GSE134290 dataset was based on the GPL570 platform. This dataset consisted of MSCs from 6 samples. MSCs from the enthesis (interspinous ligaments) involved in spinal ankylosis from 3 AS patients who had undergone spinal wedge osteotomy (AS MSCs) were isolated. MSCs from 3 non-AS individuals who underwent traumatic surgery at similar sites (control MSCs) were used as controls. All individuals were Taiwanese. The GSE113212 dataset encompassed 5 cases of OLF patients in the experimental group and 5 normal samples in the control group. All individuals were Japanese. The GSE153310 dataset, utilizing the GPL23227 platform, comprised MSCs from 3 AS patients in the experimental group and MSCs from 3 normal samples in the control group. All individuals were Chinese. The GSE73754 dataset included 52 cases of AS patients in the experimental group and 20 normal samples in the control group. All individuals were Canadian.
Differential Genetic Screening
Differentially expressed genes (DEGs) were identified within the GSE106253 and GSE134290 datasets. The limma R package was applied for DEG screening, utilizing a cutoff criterion of an adjusted P value <.05 and |log FC| ≥ 1.
Construction and Module Analysis of Weighted Gene Co-Expression Network
Weighted Gene Co-expression Network Analysis (WGCNA) was conducted using the R.4.0.3 software package. 23 The WGCNA R package was utilized to build co-expression networks, incorporating relevant clinical characteristics for the DEGs associated with OLF and AS. Before commencing the analysis, hierarchical cluster analysis was executed using the hclust function in the R language to identify and eliminate any outlier samples. Subsequently, in accordance with the criteria for constructing a scale-free network, the “pickSoftThreshold” function in the WGCNA software package was employed to determine the appropriate soft power (ranging from 1 to 20) for automated network generation. The outcomes were subject to topological overlap matrix analysis, resulting in the assignment of modules denoted by distinctive colors and their respective module features (ME). Furthermore, Pearson’s correlation test was applied to assess the relationship between ME and clinical features.
Enrichment Analysis
Gene Ontology (GO) enrichment analysis, a widely employed bioinformatics approach, was employed to extract comprehensive insights from extensive gene data. Furthermore, KEGG pathway enrichment analysis, recognized for illuminating biological mechanisms and functions, played a pivotal role. To enhance the visualization of the GO and KEGG pathways, the GO plot program package was enlisted. The GO enrichment analysis encompassed Biological Process (BP), Cellular Component (CC), and Molecular Function (MF). An adjusted P-value of <.05 was considered as the threshold for statistical significance in the enrichment items. Similarly, in the KEGG analysis, an item was deemed statistically significant if it held a P-value of <.05. Additionally, the gene sets and gene expression matrices for OLF and AS underwent analysis via Gene Set Enrichment Analysis (GSEA) to shed light on potential regulatory pathways. GO enrichment analysis, KEGG pathway analysis and GSEA were also performed in R using the “clusterProfiler” package 24 to further investigate the biological roles of DEGs or hub gene.
Candidate Biomarker Expression Levels and Diagnostic Value
In the realm of data analysis, the R software ggplot2 package was harnessed for crafting boxplots that gauged the expression levels of the hub genes (significance at P < .05). To evaluate the efficacy of prospective biomarkers, the Area Under the Curve (AUC) of the Receiver Operating Characteristic (ROC) was employed. This was carried out on datasets GSE113212, GSE181716, GSE153310, and GSE73754, facilitated by the pROC R package. 25
Identification and Validation of Potential Shared Diagnostic Markers
The Lasso method, renowned for its effectiveness in regression analysis, capitalizes on the ℓ1 penalty to attain a sparse solution. 26 In the context of the intersection genes between DEGs and WGCNA, as mentioned earlier, the Lasso method played a pivotal role in selecting the core markers.
Analysis of Immune Infiltrating Cells
The single sample gene set enrichment analysis (ssGSEA) algorithm was employed to estimate the relative composition of various immune infiltrating cells and their functions based on mRNA expression data within immune gene sets. The immunologic features of all samples were evaluated using the ssGSEA technique using the “GSVA” R package. 27 Subsequently, the Wilcoxon test was applied to assess the proportion of immune infiltrating cells, and the outcomes were visually presented using boxplots. Furthermore, Spearman correlation analysis was utilized to evaluate the relationship with MAB21L2.
Results
Identification of DEGs
A total of 1353 differentially expressed genes (DEGs) were discerned between OLF patients and normal controls, comprising 904 upregulated and 449 downregulated DEGs, as illustrated in volcano plots (Figure 2A). The top 40 DEGs among these were visualized in heatmaps (Figure 2B). Furthermore, 91 DEGs were identified when comparing AS and normal controls, with 49 upregulated genes and 42 downregulated genes (Figure 2C). The top 40 DEGs for AS were depicted in heatmaps (Figure 2D). To gain deeper insights into the potential biological alterations associated with these DEGs, KEGG and GO enrichment analyses were conducted. GO results revealed that the DEGs in OLF were predominantly enriched in processes related to ossification and bone morphogenesis (Figure 2E). GO annotation for AS demonstrated that the DEGs were primarily enriched in functions associated with cell adhesion and cell adhesion mediator activity (Figure 2F). Intriguingly, GO and KEGG analysis uncovered a commonality in which both OLF and AS exhibited enrichment in the ECM-receptor interaction and cell adhesion (Figure 2G and H). (A) Volcano plots illustrating DEGs in GSE106253. (B) Heatmap plots visualizing DEGs in GSE134290. (C) Volcano plots displaying DEGs in GSE106253. (D) Heatmap plots depicting DEGs in GSE134290. (E) GO term analysis of DEGs in GSE106253. (F) GO term analysis of DEGs in GSE134290. (G) KEGG analysis of DEGs in GSE106253. (H) KEGG analysis of DEGs in GSE134290.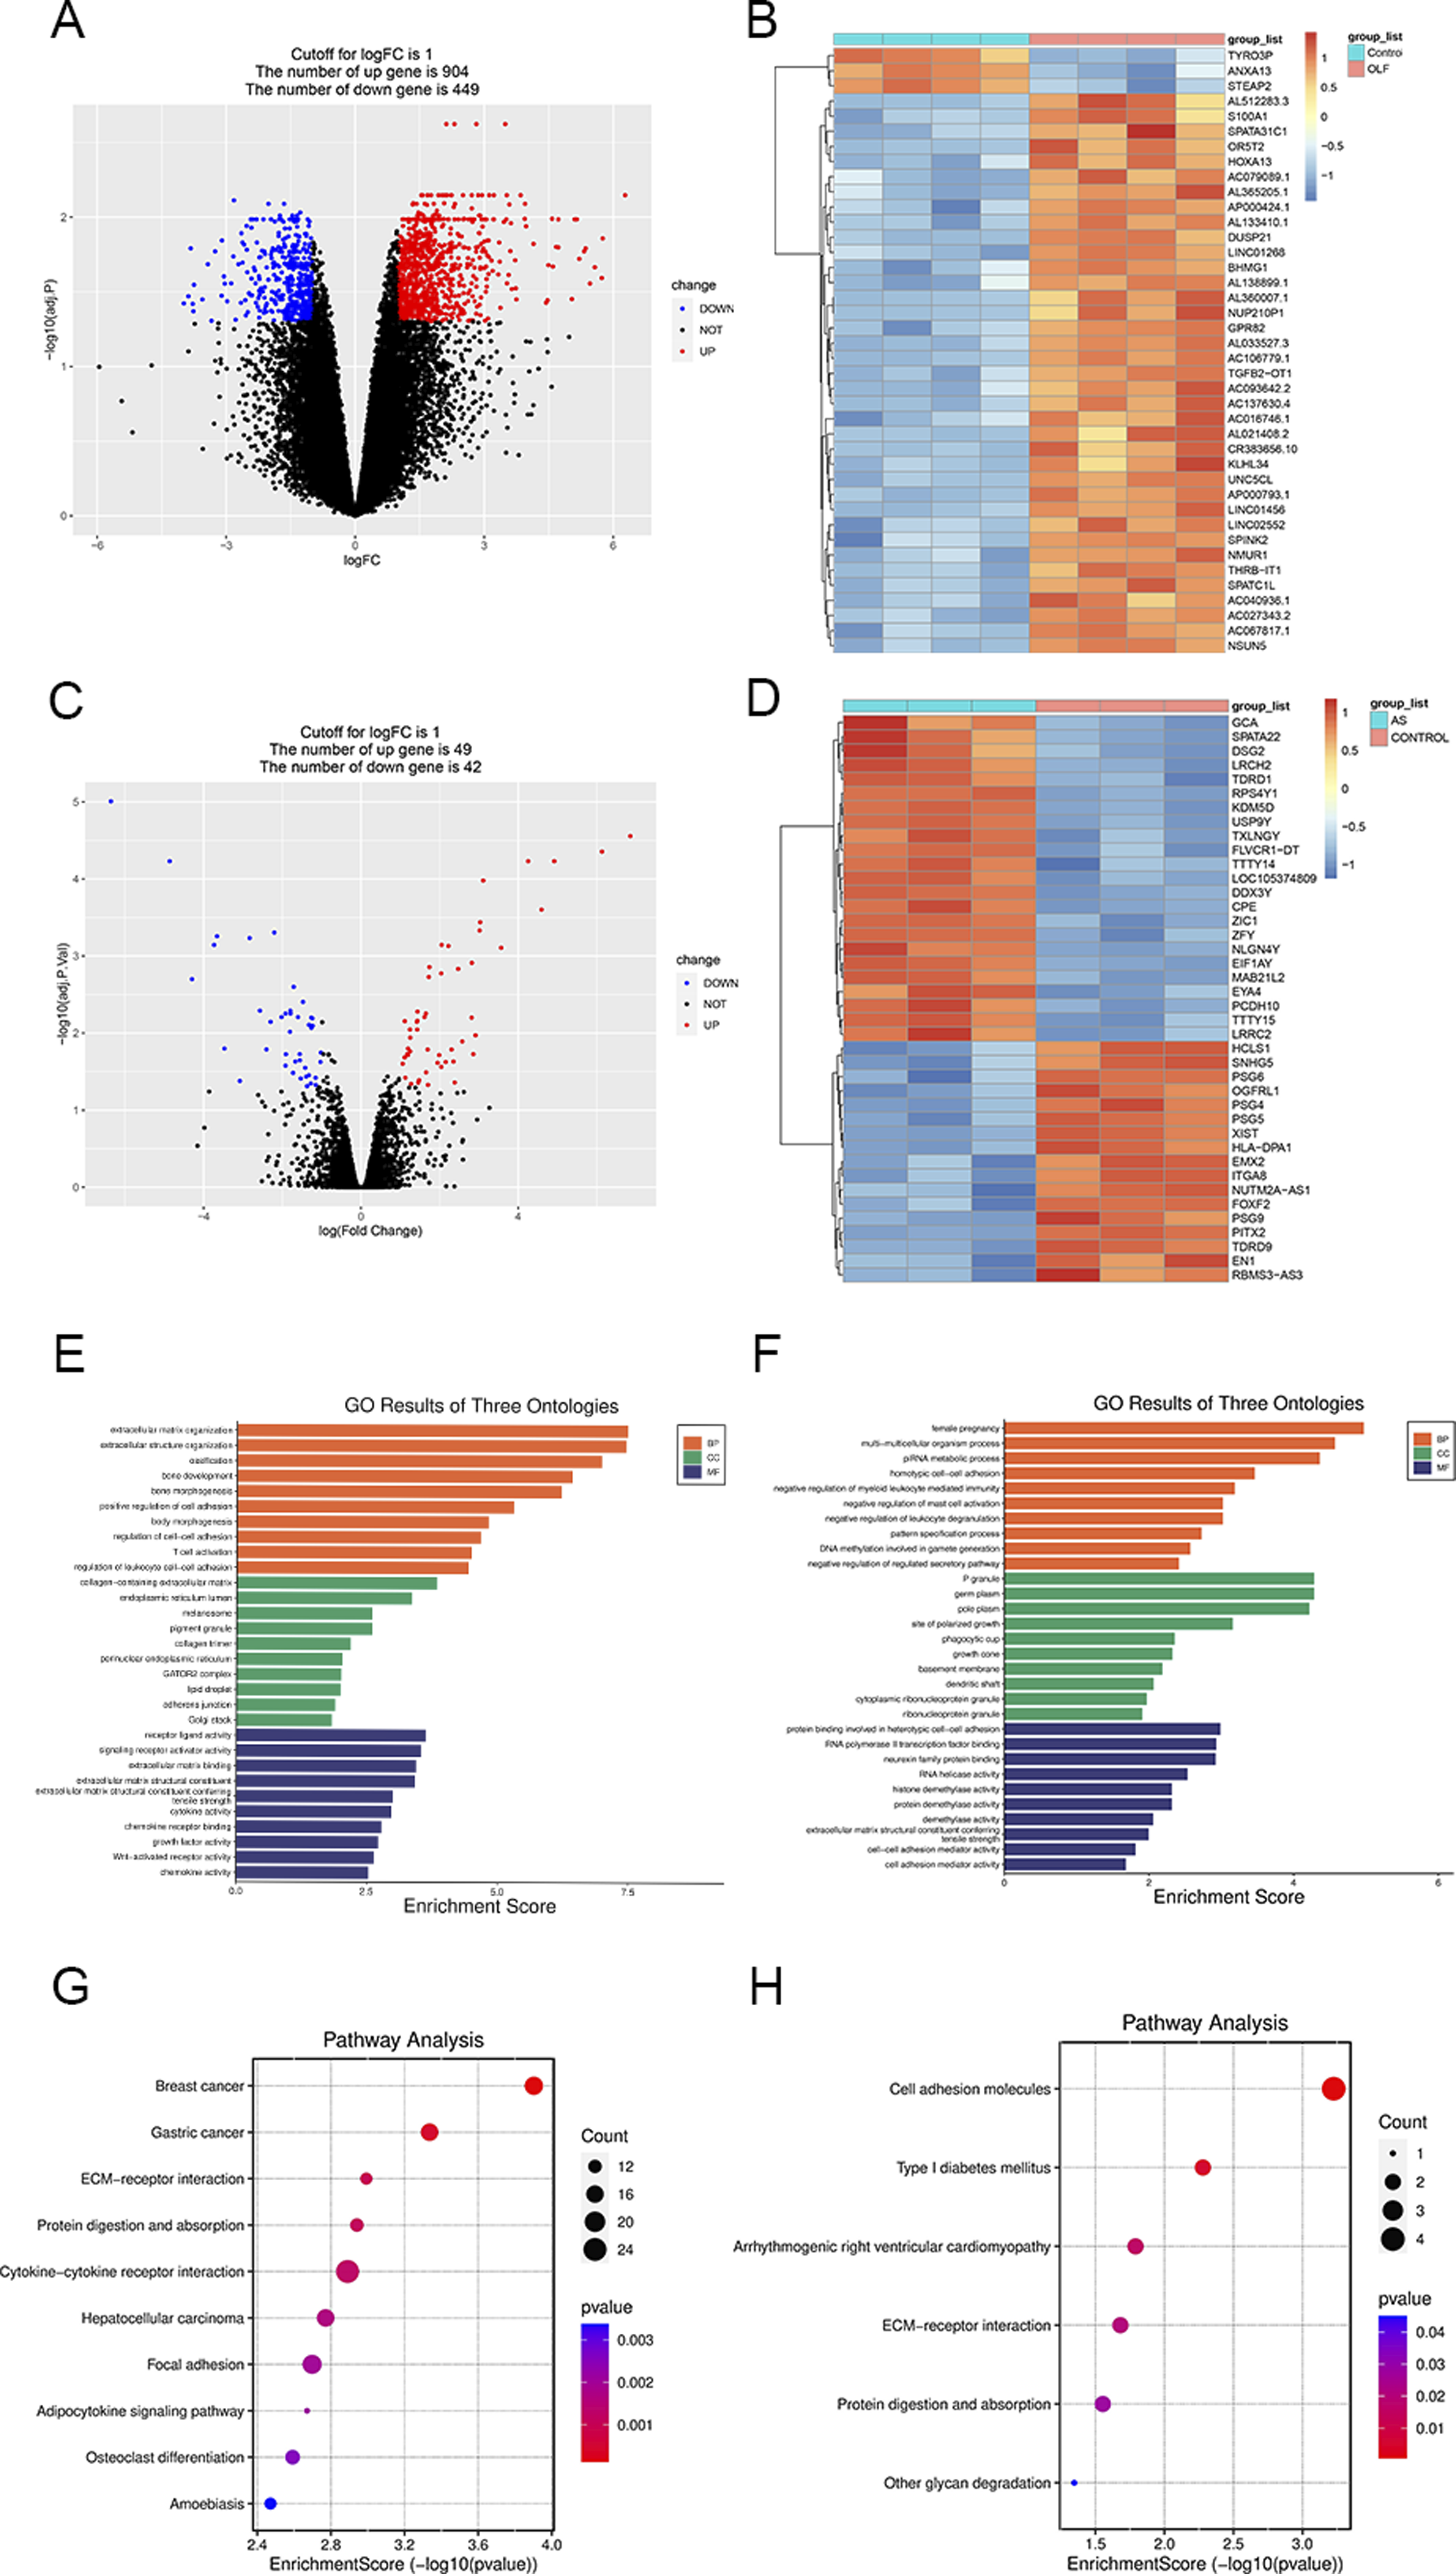
WGCNA Network Construction and Module Identification
WGCNA was utilized to pinpoint clusters of co-expressed genes displaying differential expression patterns in OLF and AS. The correlation between these combined modules and disease characterization was meticulously computed. For the OLF model, a soft threshold power of b = 26 was determined, while in the AS model, the chosen soft threshold power was 7 (Figure 3A and B). Upon amalgamating similar gene modules, eleven distinct modules were discerned in the OLF model, and an additional 13 modules were identified in the AS model (Figure 3C and D). It’s worth noting that the turquoise module exhibited the most robust correlation with OLF incidence (r = .87) (Figure 3C), whereas the brown module exhibited the strongest correlation with AS occurrence (r = −.88) (Figure 3D). (A) Cluster dendrogram representing co-expression in OLF. (B) Cluster dendrogram depicting co-expression in AS. (C) Correlation analysis between modules and clinical traits in OLF. (D) Correlation analysis between modules and clinical traits in AS.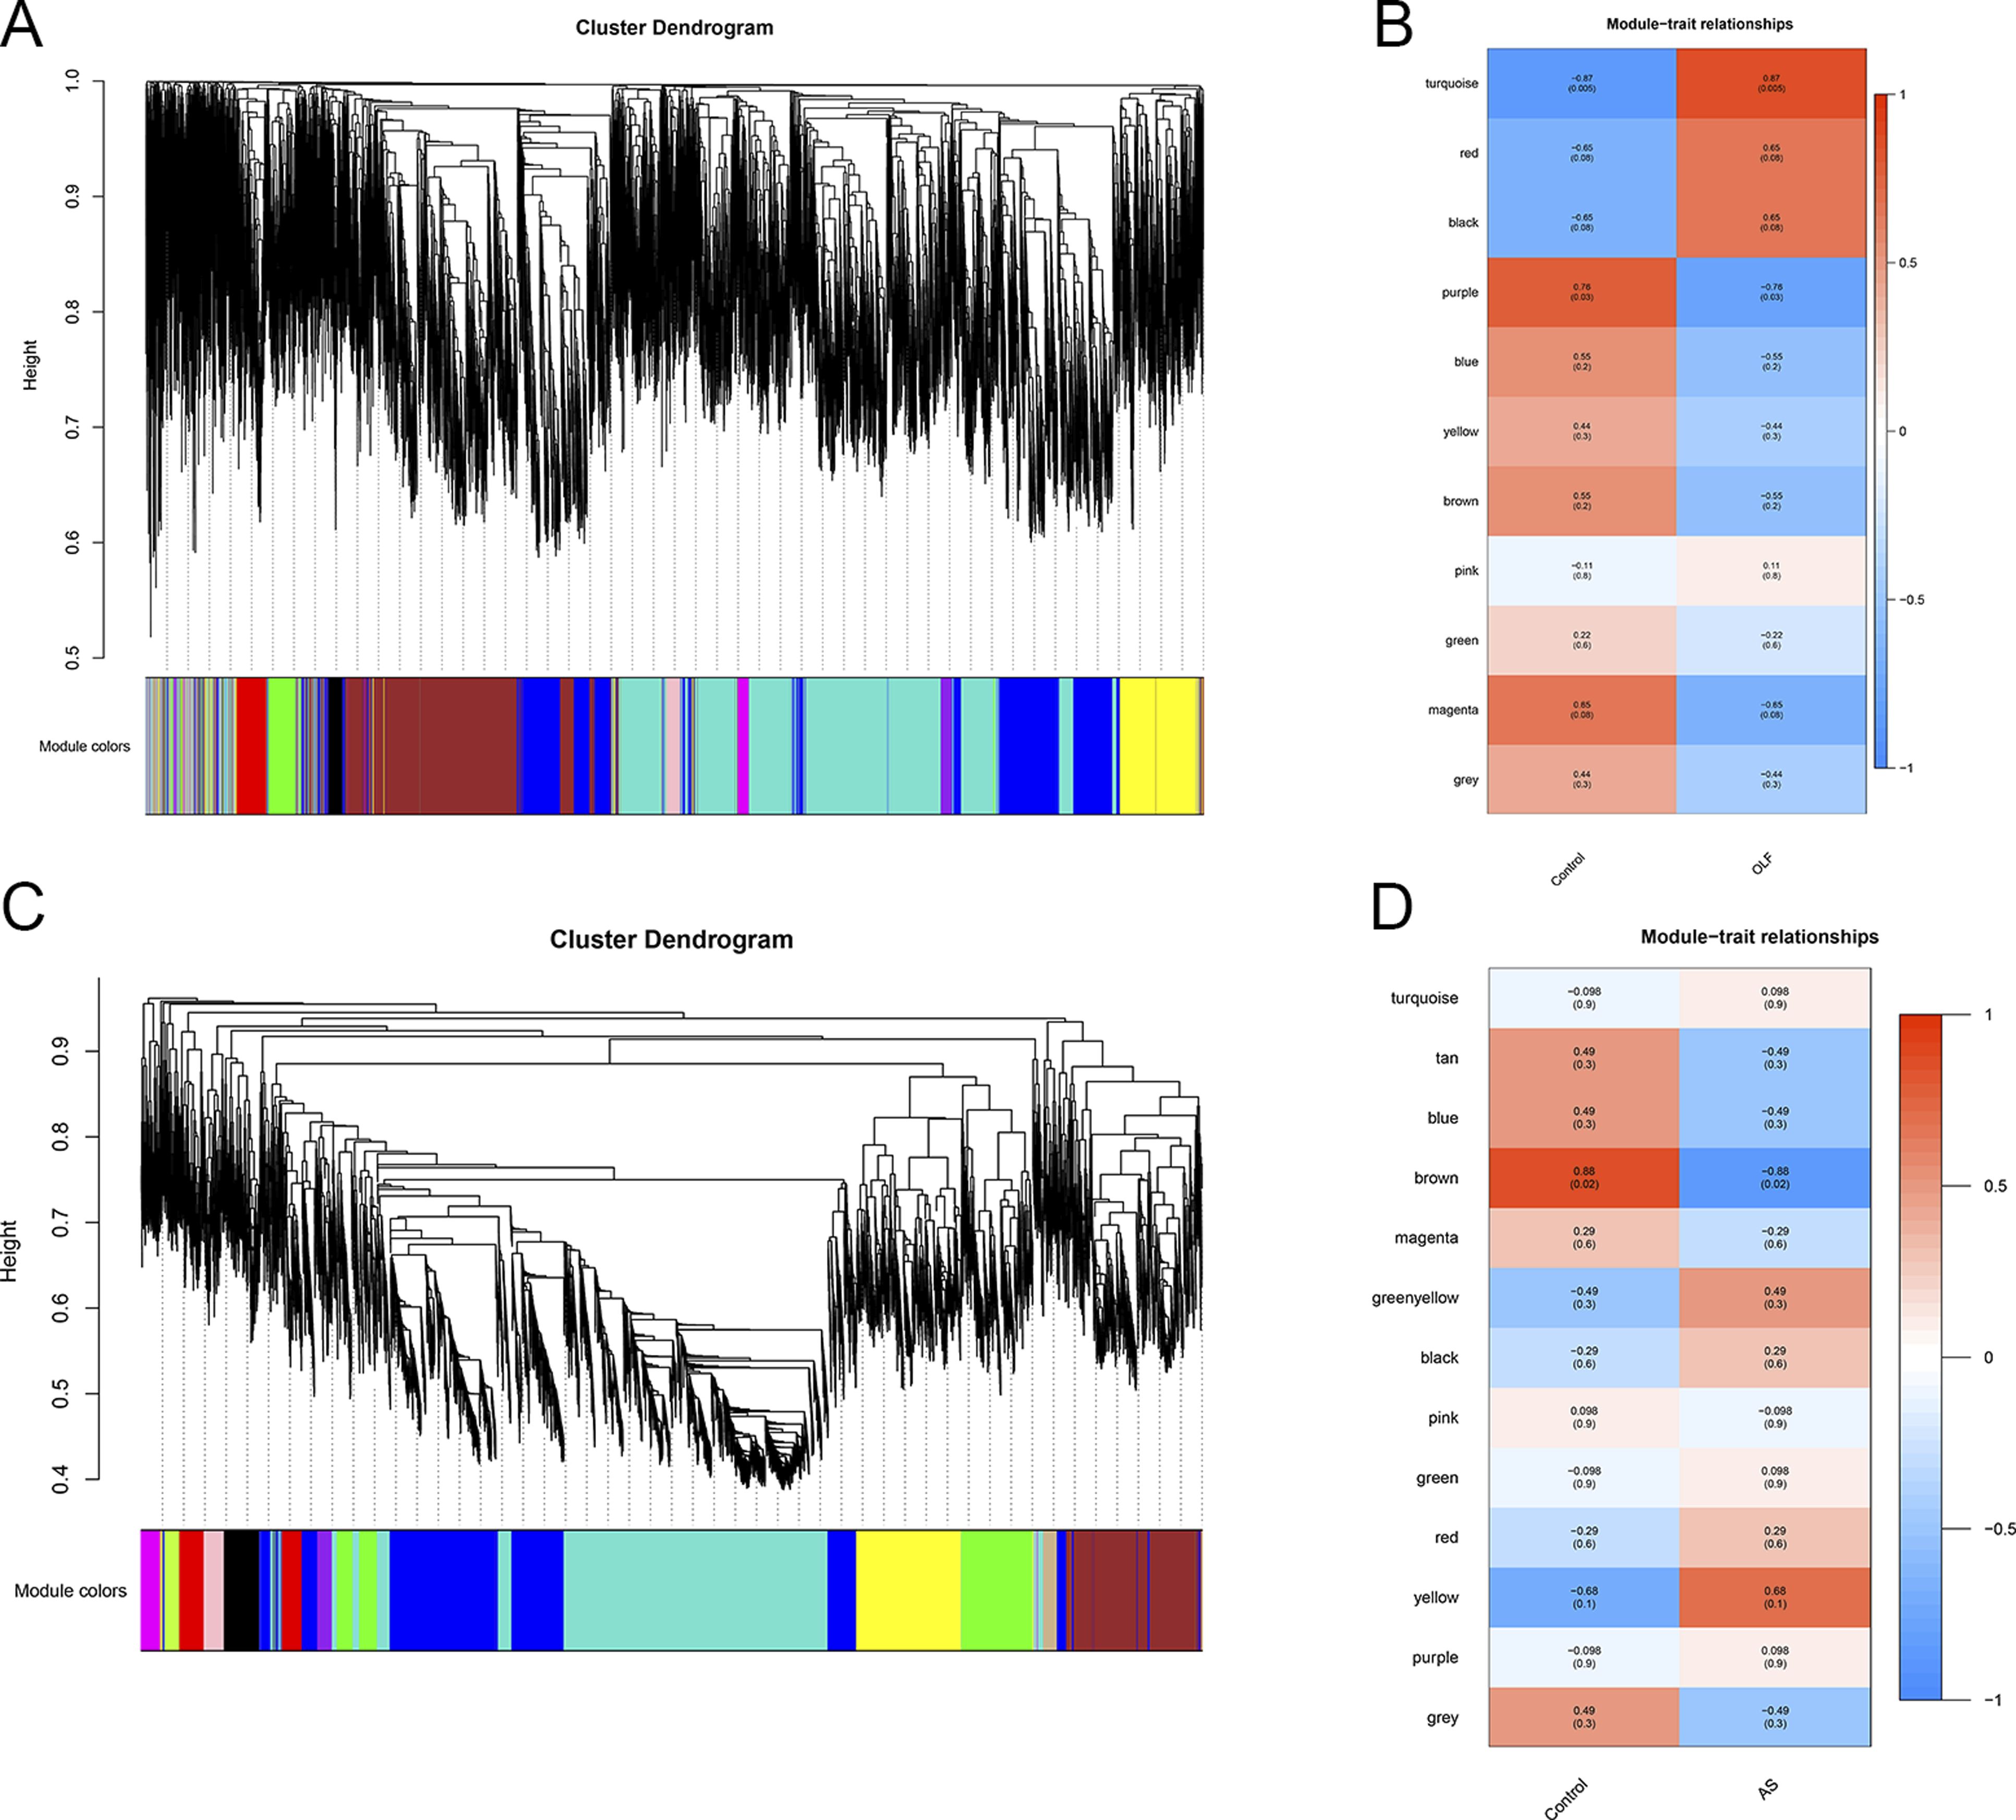
Identification of Shared Genes and Shared Pathways
Three central genes (MAB21L2, MEGF10, ISLR) emerged as a nexus between the genes identified through WGCNA and DEGs, representing potential crosstalk genes linking both maladies (Figure 4A). Furthermore, we conducted GO Biological Processes (GO BPs) enrichment analyses on these 3 core genes to unravel shared regulatory pathways. As depicted in Figure 4B, these central genes are primarily associated with several GO BPs, including positive regulation of myoblast proliferation, myoblast migration, skeletal muscle satellite cell proliferation, skeletal muscle cell proliferation, regulation of myoblast proliferation, and myoblast proliferation. These biological processes are intrinsically linked to muscle development and regeneration. Research has indicated that myogenic stem cells, such as myoblasts, may serve as potential progenitor cells for osteoblasts during ectopic bone differentiation.
28
Therefore, we hypothesize that this group of hub genes may be involved in heterotopic ossification in both OLF and AS. (A) Venn diagram illustrating the convergence and overlap of 3 core genes selected through the intersection of genes identified by WGCNA and DEGs. (B) GO term analysis, with a focus on biological processes, of the 3 core genes.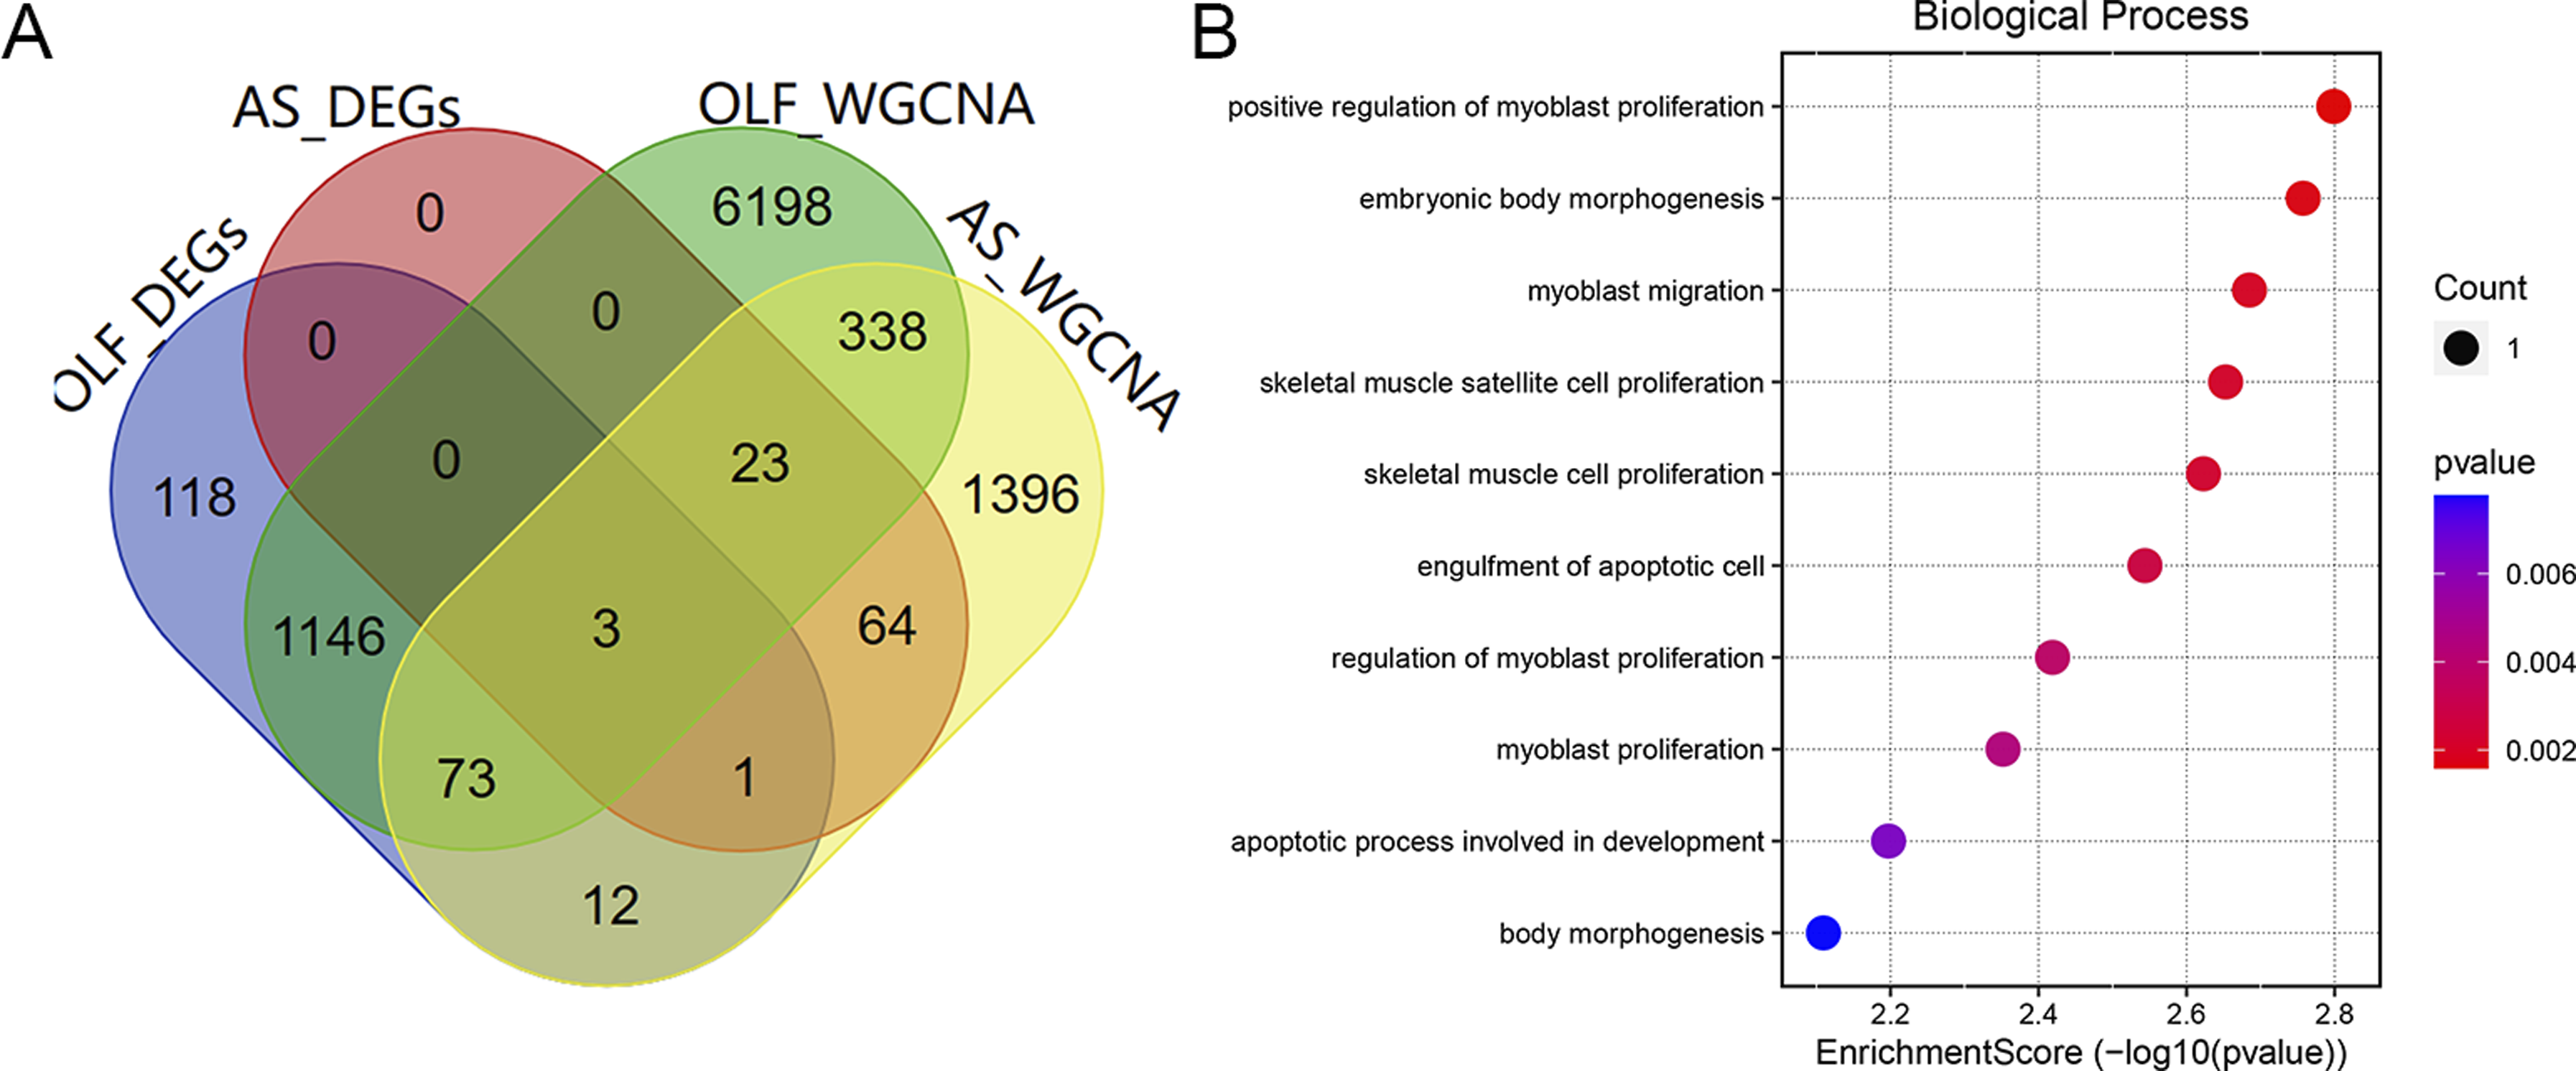
Identification of hub Genes Associated by Lasso Regression
Subsequently, a LASSO regression algorithm was deployed to pinpoint the potential shared diagnostic genes. In GSE106253, the LASSO analysis revealed 3 of the 3 core cross-genes at the most appropriate λ = .000655 (Figure 5A and B). Similarly, in GSE134290, the LASSO analysis identified 3 of the 3 core cross-genes at the most suitable λ = .000674 (Figure 5C and D). Ultimately, this analysis unveiled 3 intersecting genes (MAB21L2, MEGF10, ISLR) as the optimal shared diagnostic biomarkers for OLF and AS (Figure 5E). (A) 10-fold cross-validation utilized to determine the optimal tuning parameter log(lambda) within the GSE106253 database. (B) LASSO coefficient profiles representing the diagnostic genes within the GSE106253 database. (C) 10-fold cross-validation used to identify the most suitable tuning parameter log(lambda) in the GSE134290 database. (D) LASSO coefficient profiles displaying the diagnostic genes in the GSE134290 database. (E) Venn diagram demonstrating the optimal diagnostic biomarkers.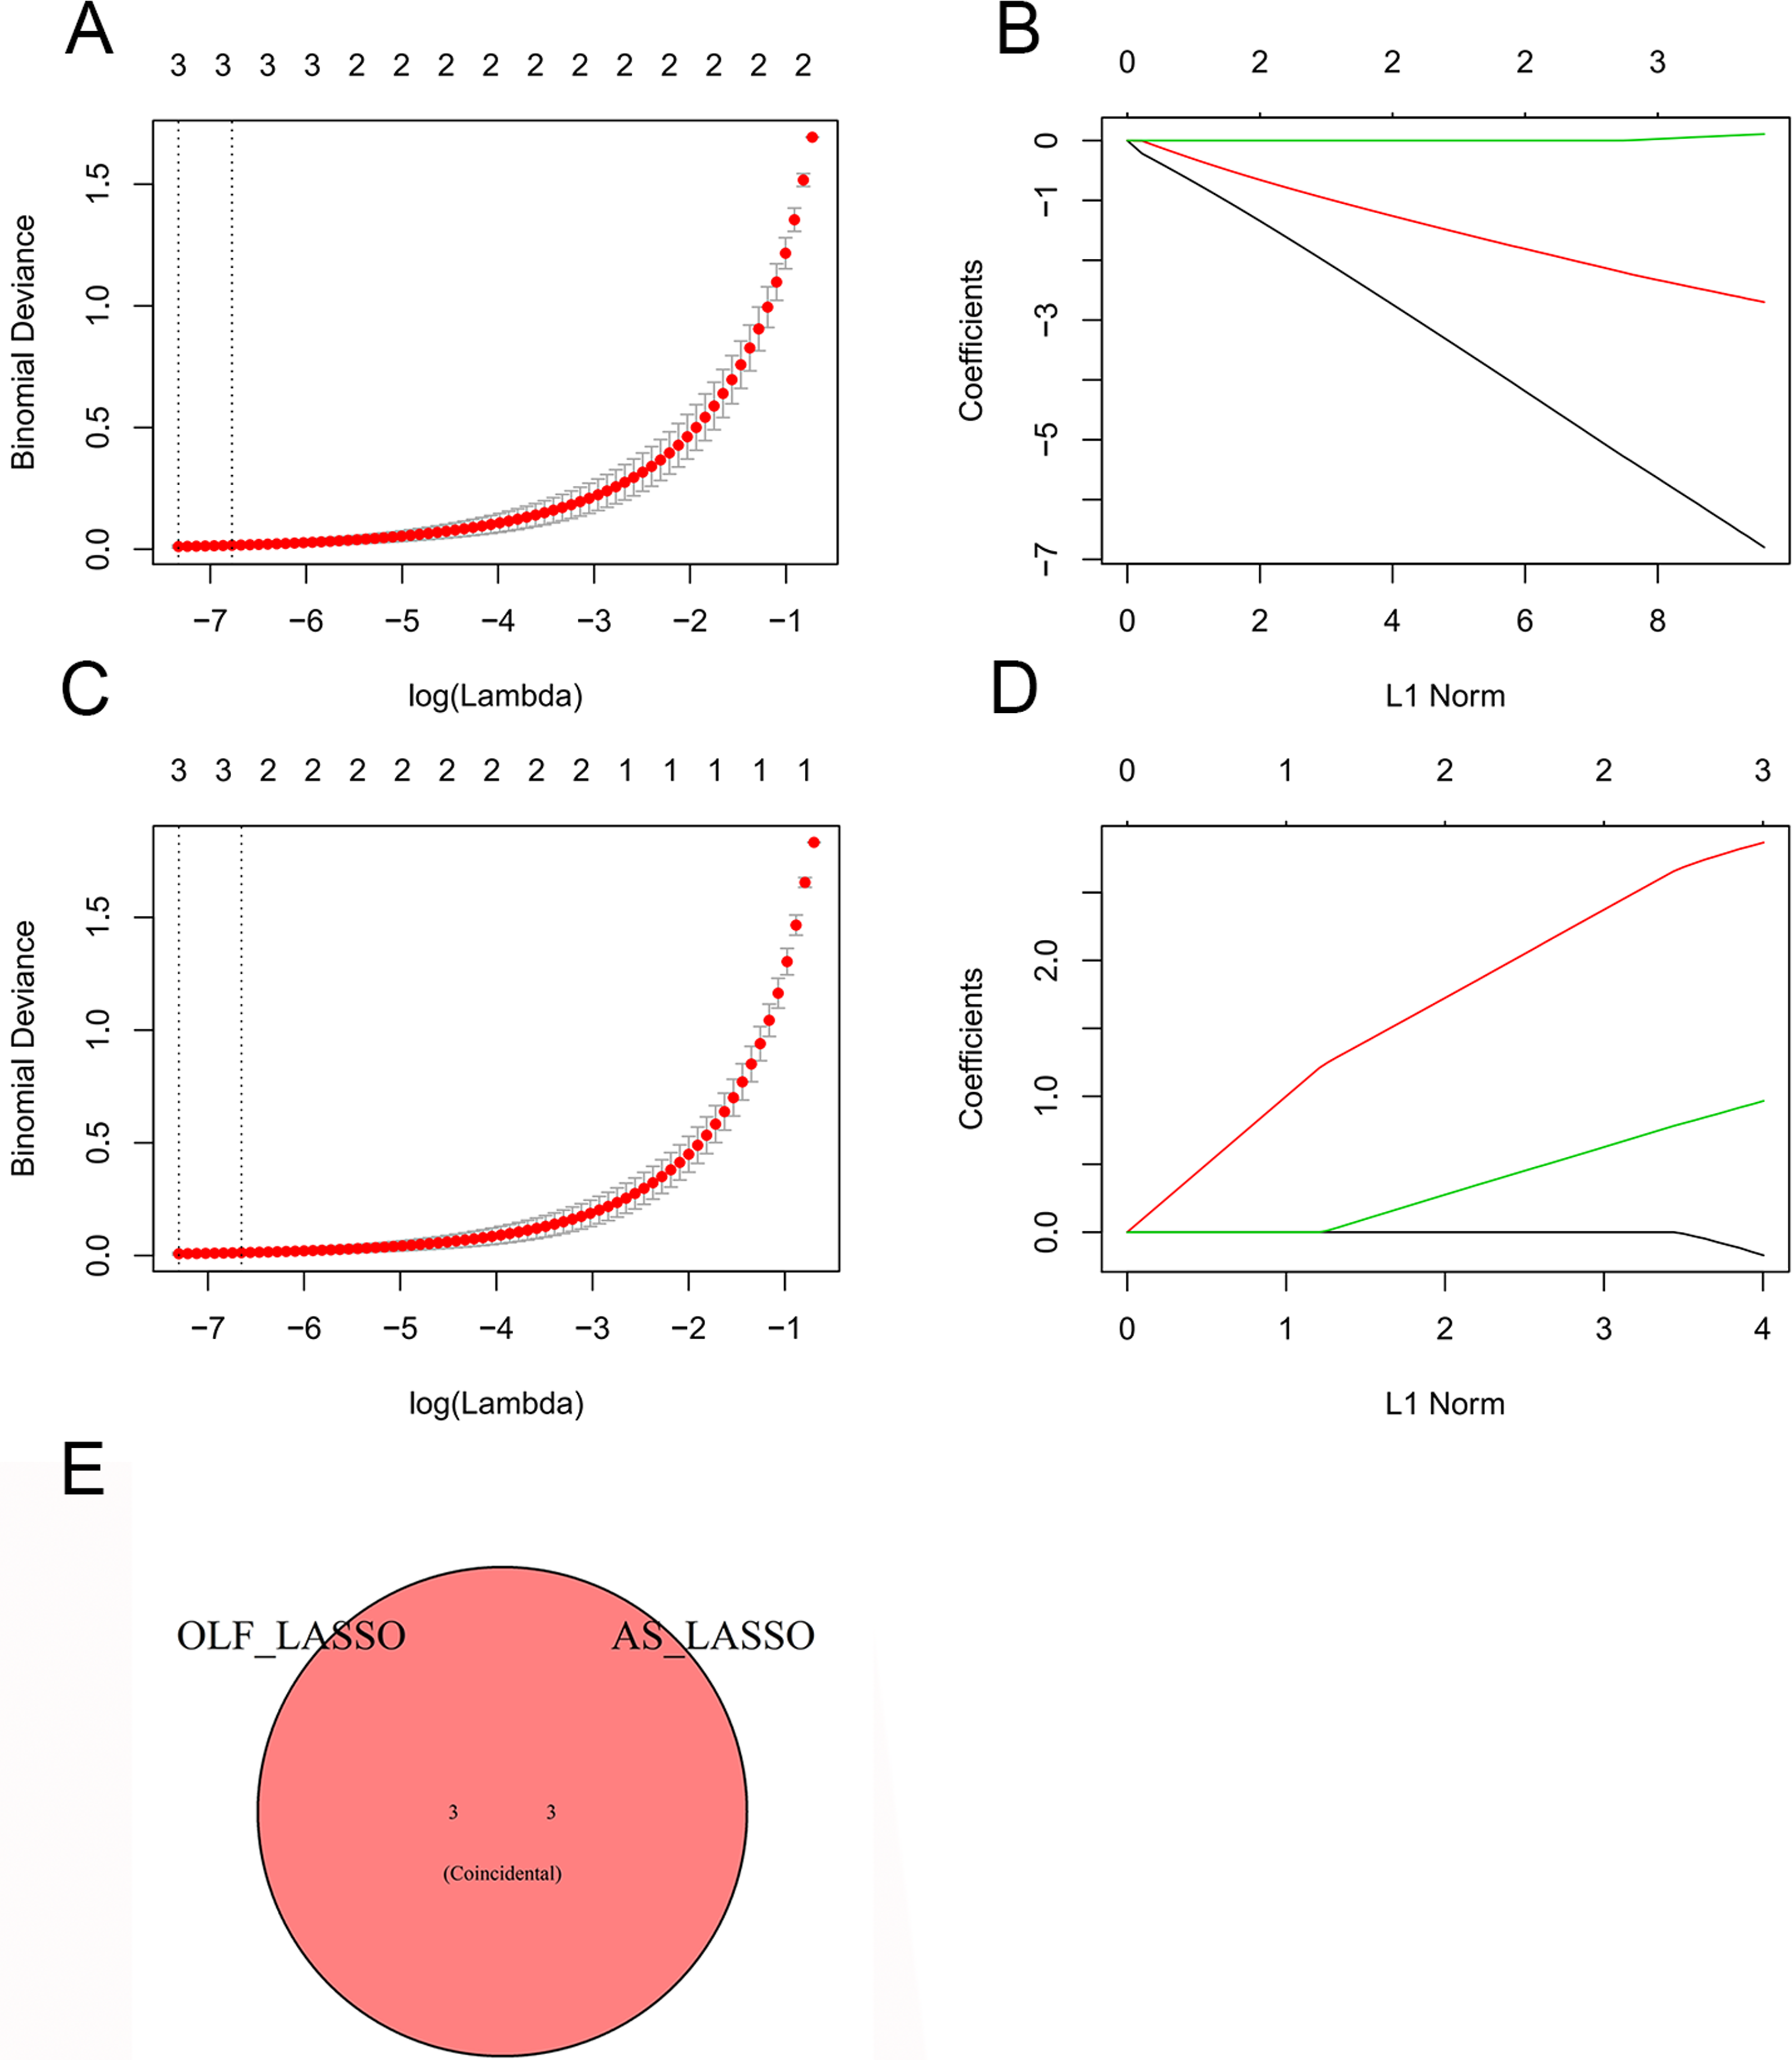
The Validation of the Diagnostic Marker Genes
We assessed the sensitivity and specificity of the candidate biomarkers. Further external validation was conducted to evaluate the diagnostic efficacy of MAB21L2, MEGF10, and ISLR in multiple datasets, including GSE113212, GSE181716, GSE73754, and GSE153310. In the GSE113212 dataset (Figure 6A), these 3 biomarkers exhibited varying diagnostic values: ISLR (AUC = .594), MAB21L2 (AUC = .875), and MEGF10 (AUC = 1.000). In the independent OLF validation set GSE181716, the AUC values for ISLR, MAB21L2, and MEGF10 were .720, .640, and .800, respectively (Figure 6B). In the AS dataset GSE73754 (Figure 6C), MAB21L2 demonstrated a good diagnostic value with an AUC of .633. ISLR and MEGF10, on the other hand, exhibited lower diagnostic values with AUCs of .568 and .579, respectively. Another ROC analysis was performed for GSE153310, where the AUC values for ISLR, MAB21L2, and MEGF10 were .556, 1.000, and .556, respectively (Figure 6D). Ultimately, MAB21L2 emerged as the most promising diagnostic biomarker with stable and robust diagnostic value for both OLF and AS. Interestingly, differential expression analysis revealed that MAB21L2 was significantly overexpressed in AS (Figure 6F) but significantly decreased in OLF (Figure 6E). To further understand the molecular processes affected by MAB21L2, GSEA analysis was conducted. In OLF (Figure 6G and H), the diagnostic gene MAB21L2 was found to be significantly enriched in terms associated with OXIDATIVE PHOSPHORYLATION (NES = −2.04, q-value = .000178). Similarly, in AS, MAB21L2 was enriched in the DNA REPLICATION pathway (NES = 2.632, q-value = .000). (A) ROC curve illustrating the performance of the shared diagnostic genes in GSE113212. (B) ROC curve displaying the performance of the shared diagnostic genes in GSE181716. (C) ROC curve demonstrating the performance of the shared diagnostic genes in GSE73754. (D) ROC curve showcasing the performance of the shared diagnostic genes in GSE153310. (E) Expression profile of MAB21L2 in GSE106253. (F) Expression profile of MAB21L2 in GSE134290. (G) Results of single-gene GSEA analyses for DEGs in GSE106253. (H) Results of single-gene GSEA analyses for DEGs in GSE134290.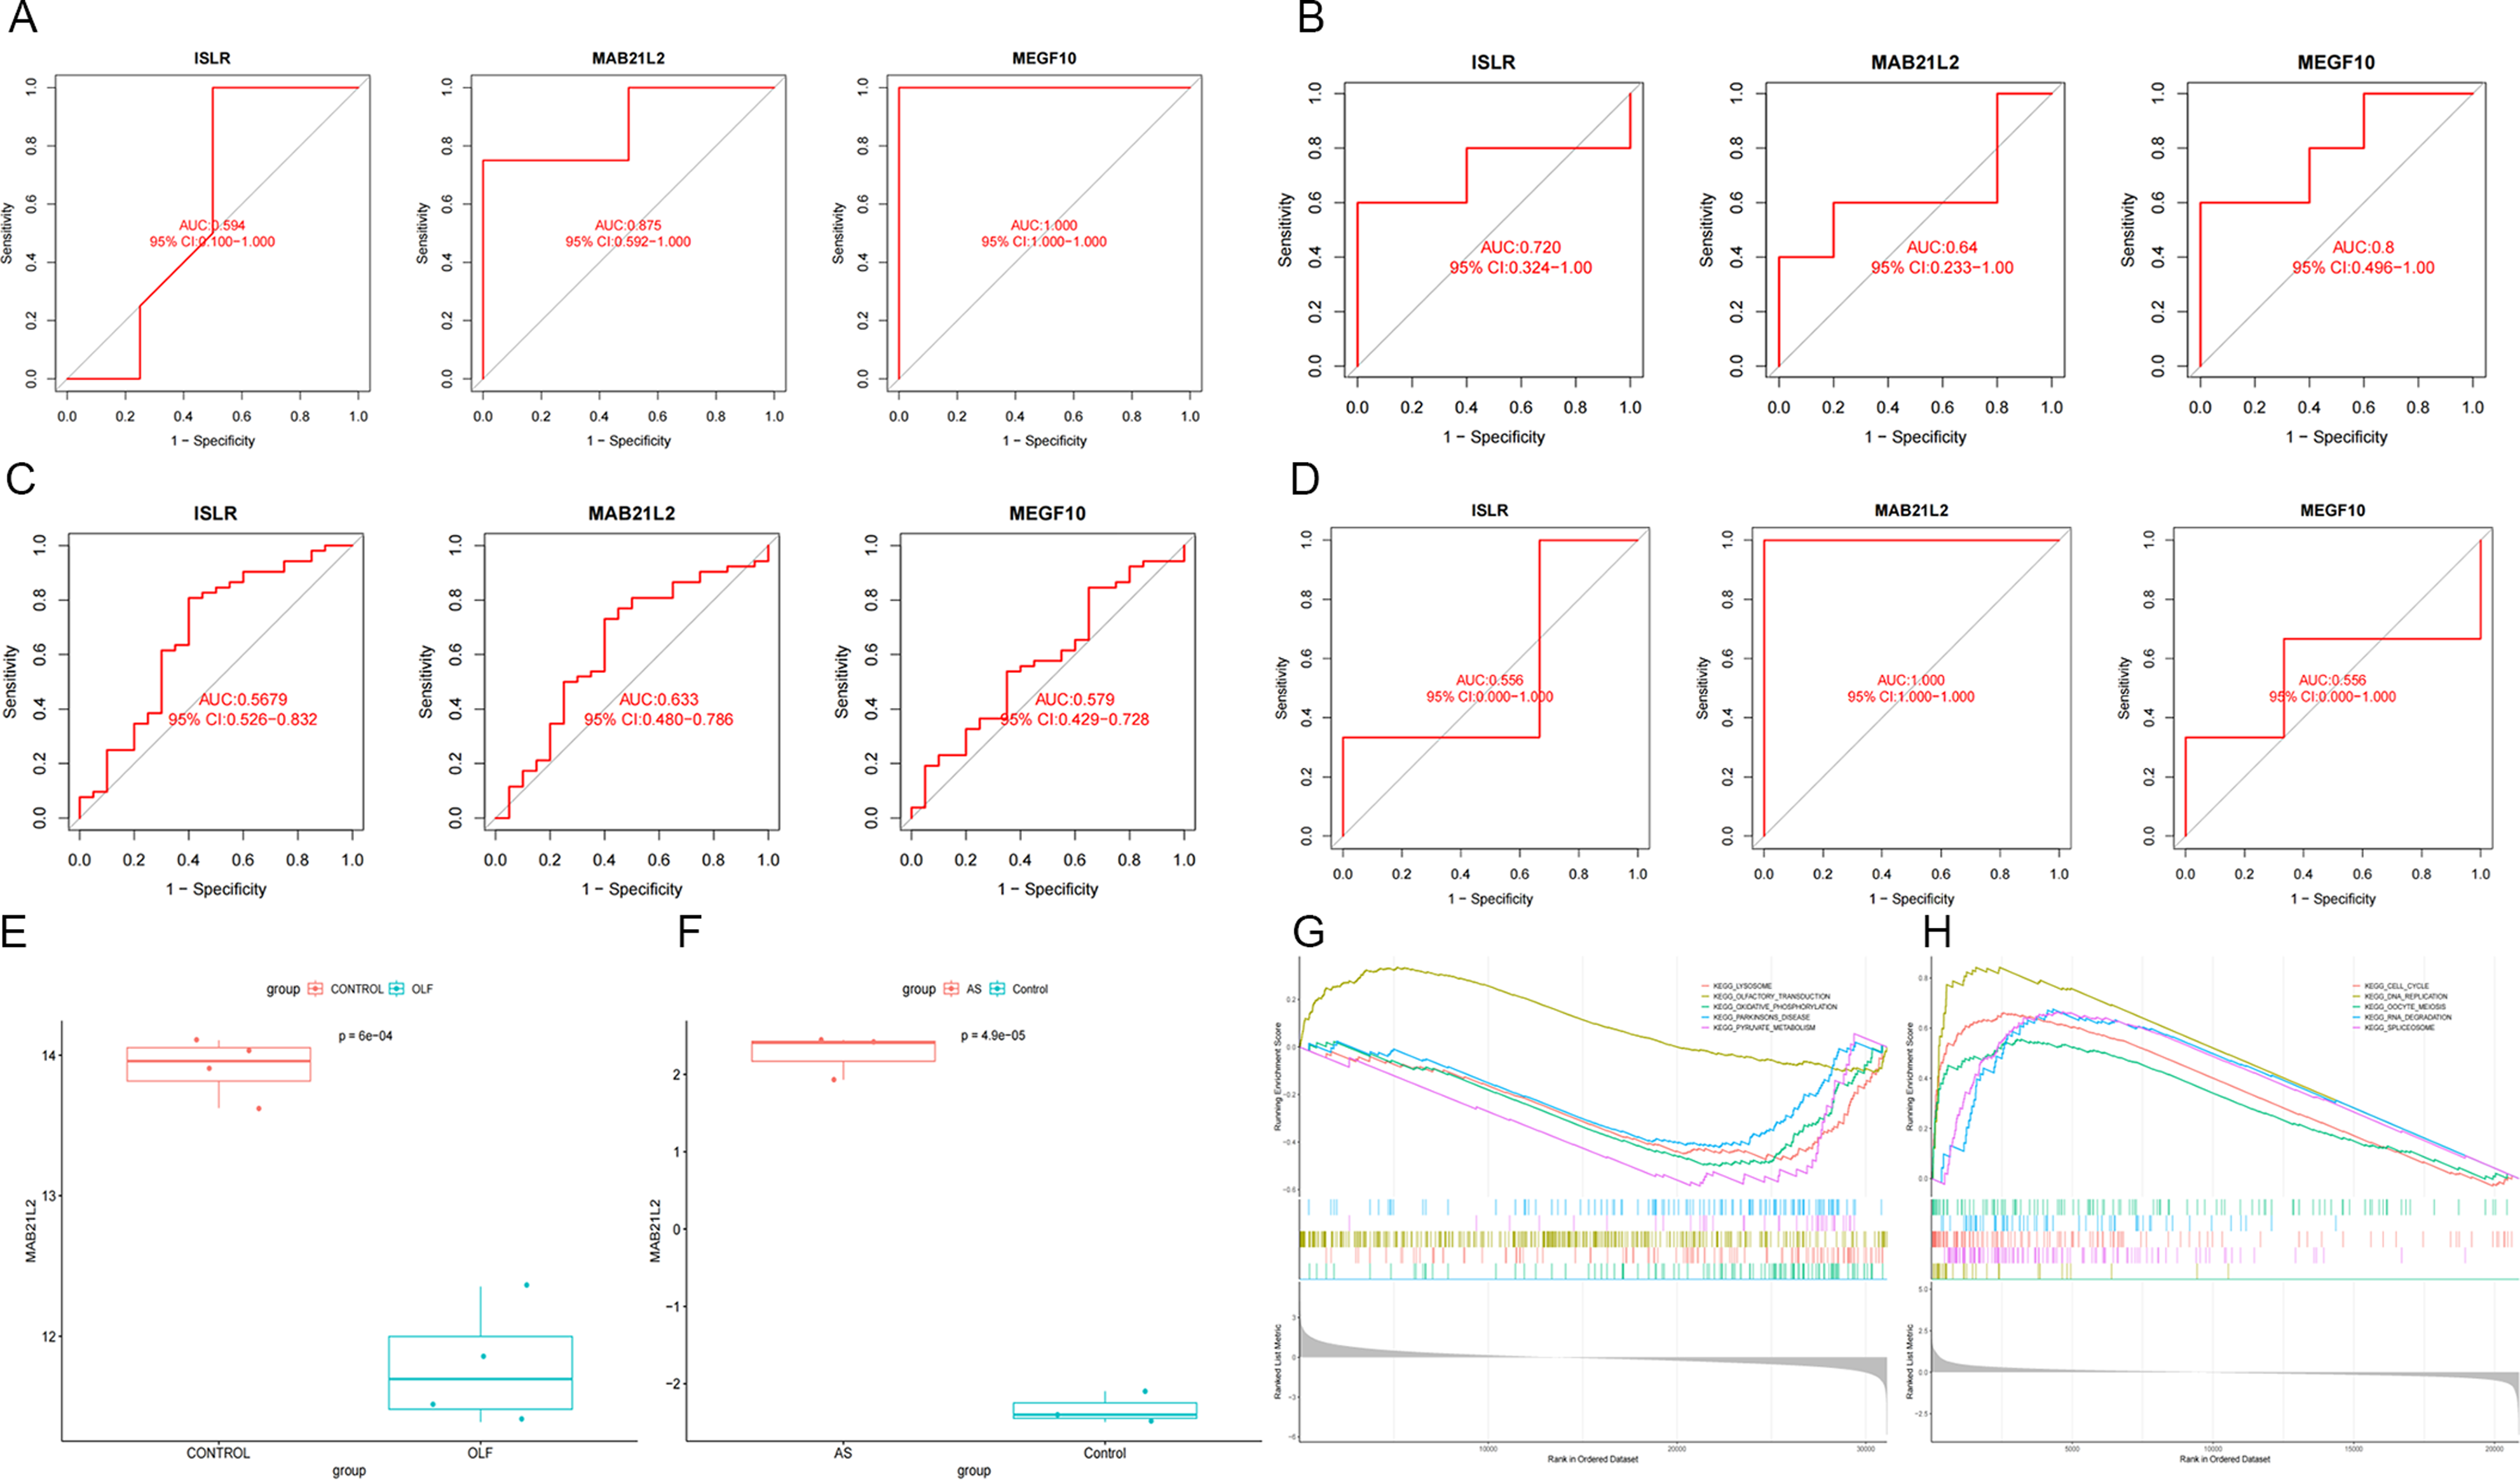
Immune Cell Infiltration and its correlation with Candidate Biomarker
We delved deeper into the variation in immune cell infiltration among different samples. The landscape of immune cell infiltration in OLF and AS was assessed through the ssGSEA algorithm. The Wilcoxon test unveiled significant alterations in 6 immune subsets between OLF and normal samples. These included activated B cells, central memory CD4 T cells, memory B cells, immature dendritic cells, natural killer cells, and plasmacytoid dendritic cells (Figure 7A and B). Additionally, between AS and normal samples, 3 immune subtypes showed significant differences: activated CD8 T cells, T follicular helper cells, and natural killer T cells (Figure 7C and D). Furthermore, our analysis revealed specific correlations between immune subsets and MAB21L2. In OLF samples, 4 immune subsets, namely immature dendritic cells, natural killer cells, plasmacytoid dendritic cells, and central memory CD4 T cells, displayed positive correlations with MAB21L2, while activated CD8 T cells, memory B cells, and activated B cells exhibited negative correlations with MAB21L2 (Figure 7E). In AS samples, MAB21L2 exhibited positive associations with activated CD8 T cells, T follicular helper cells, immature dendritic cells, and natural killer T cells but a negative association with central memory CD8 T cells (Figure 7F). These findings suggest that MAB21L2 may play a role in B cell and T cell immune responses in both OLF and AS. (A) Bar plot and (B) violin plot displaying the distribution of 28 immune cells in OLF. (C) Bar plot and (D) violin plot illustrating the distribution of 28 immune cells in AS. (E) Correlation analysis showing the relationship between immune infiltrating cells and MAB21L2 in OLF. (F) Correlation analysis demonstrating the relationship between immune infiltrating cells and MAB21L2 in AS.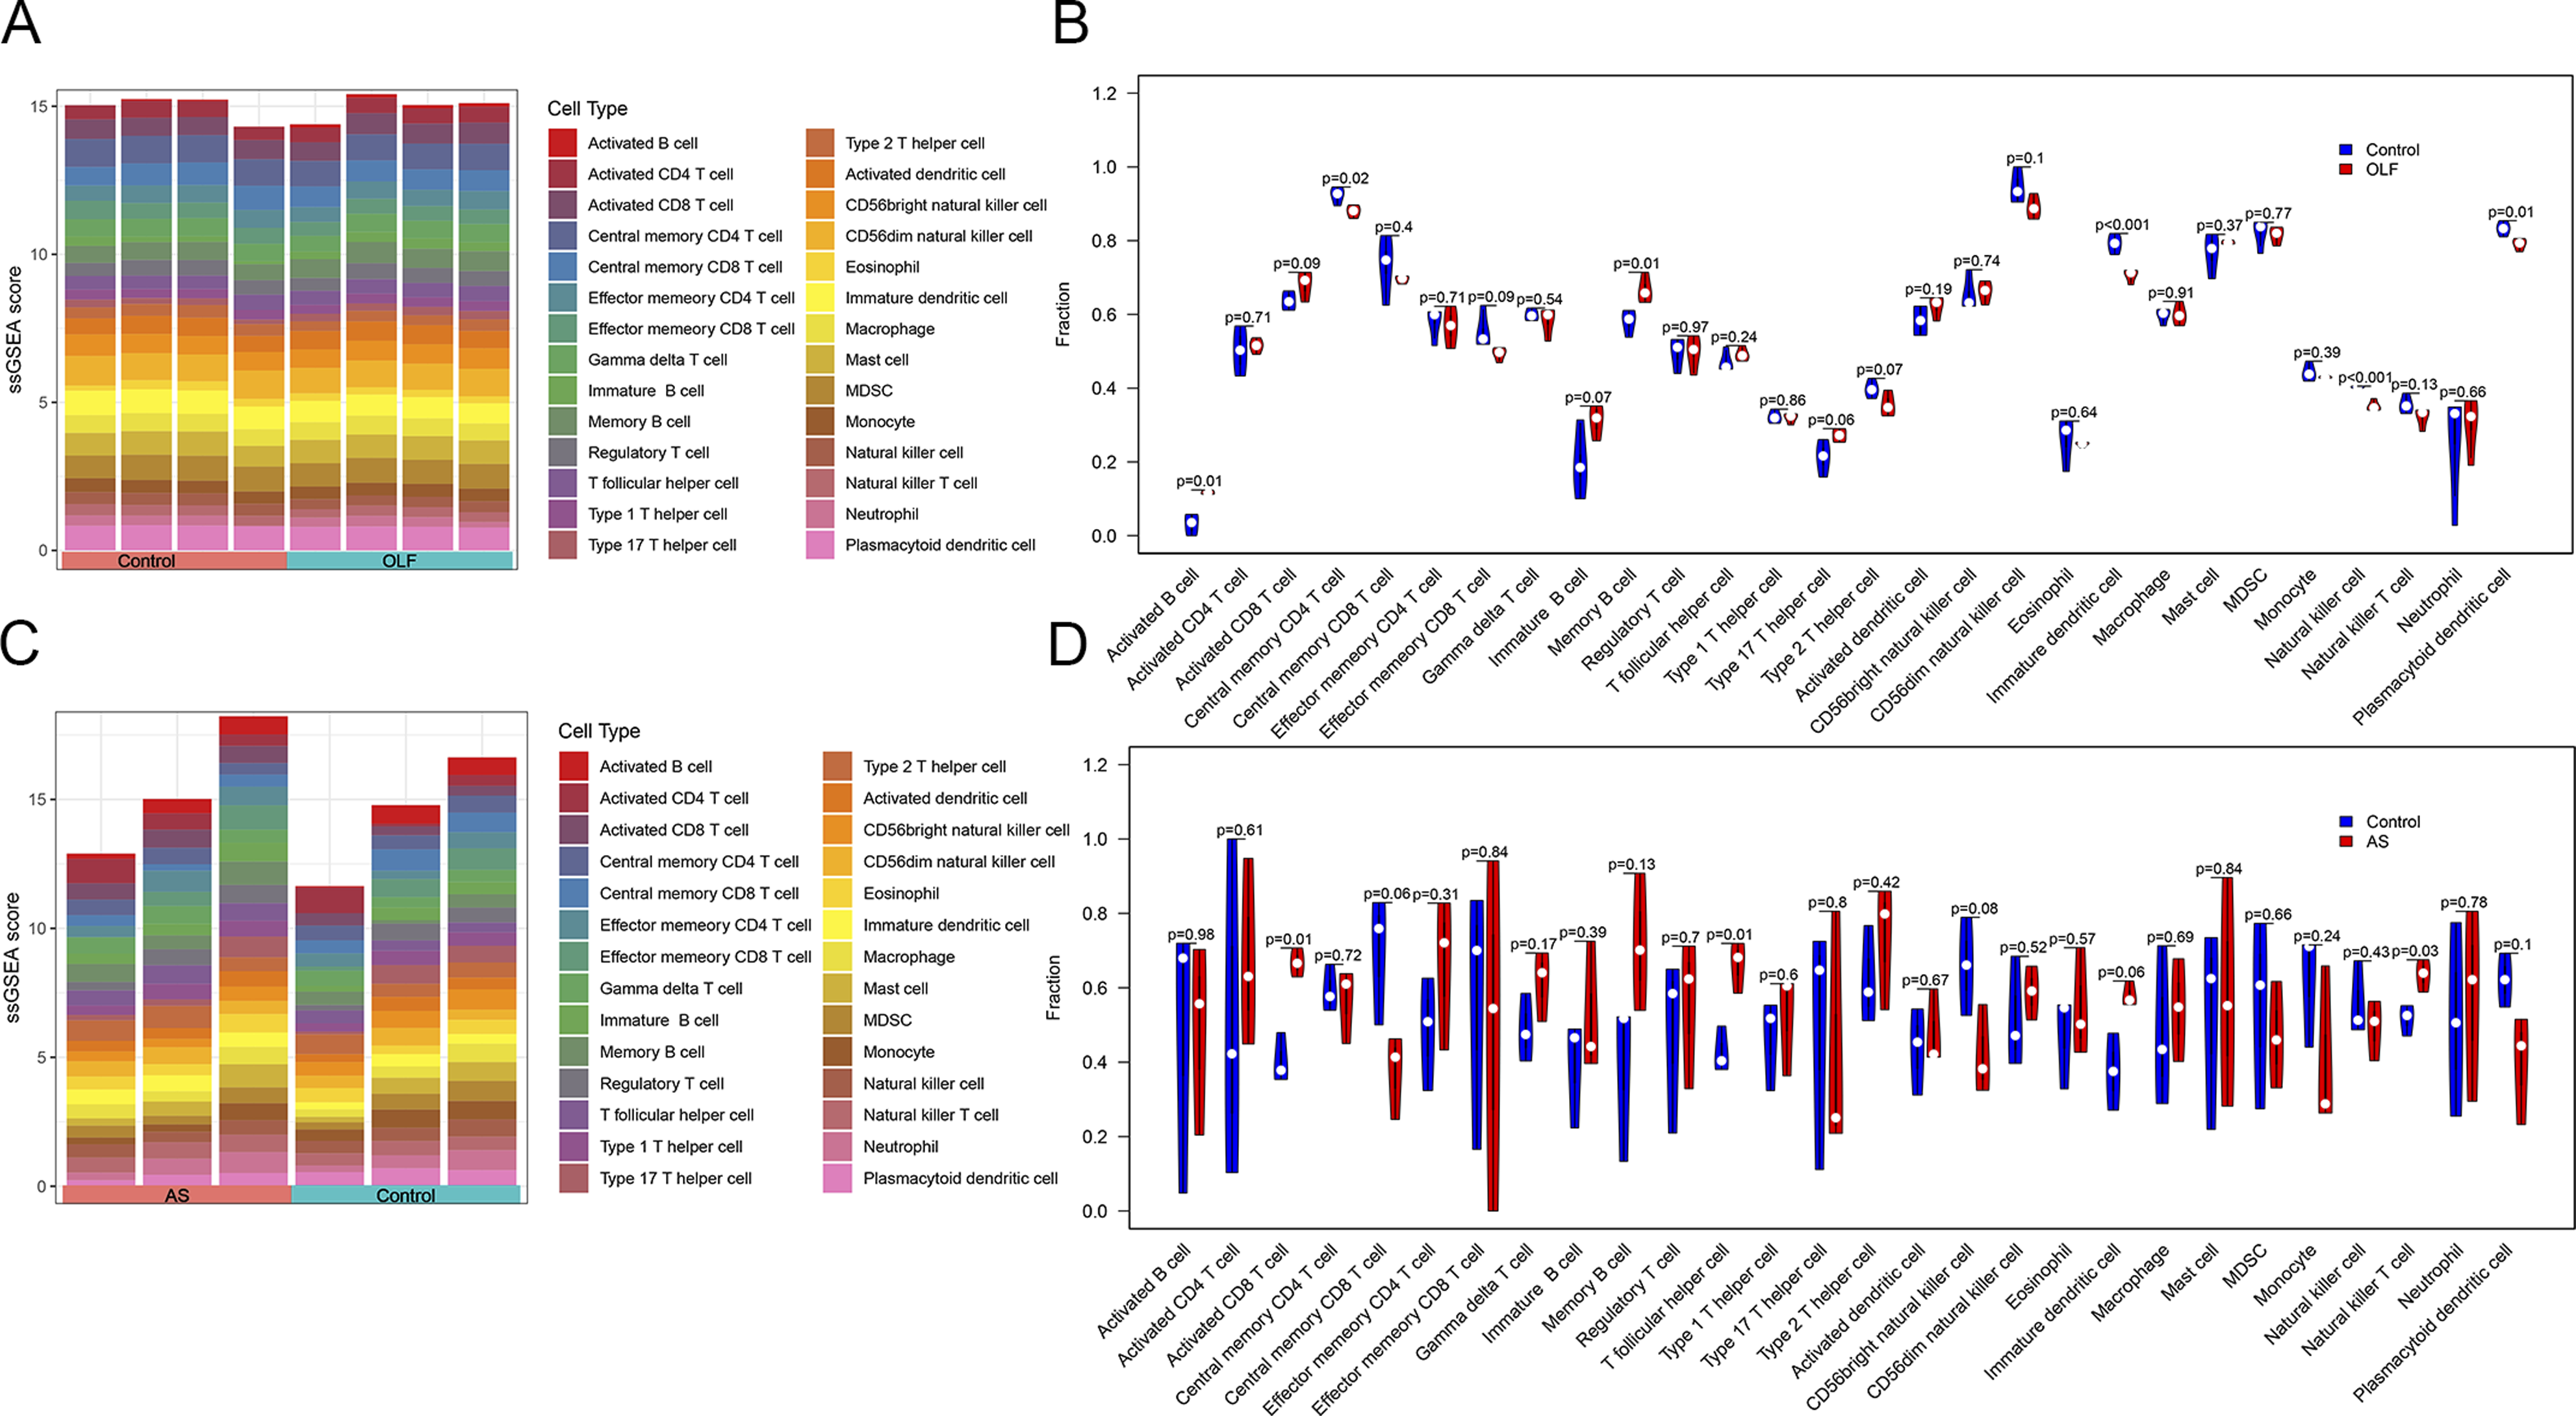
Discussion
Our study represents an integration of transcriptomes from OLF and AS, employing WGCNA for the first time to uncover a shared mechanism between the 2 conditions. This analysis unveiled potential crosstalk genes, common pathways, and associated immune cell interactions. Notably, GO and KEGG analysis uncovered a commonality in which DEGs in both OLF and AS predominantly centered around the ECM-receptor interaction and cell adhesion. The crosstalk between cells and their surrounding ECM and cell-cell adhesion activity play an important role during cartilage development and the establishment of the skeletal framework during endochondral ossification. 29 Specific chemical and mechanical signals are transmitted within the ECM and influence many aspects of cell behavior such as matrix synthesis, migration, proliferation, survival, and differentiation. 30 In addition, mesenchymal cells migrate toward and condense at the sites of future skeletal elements during endochondral ossification. This condensation results in an increased cell density and increased number of cellcell contacts accompanied by the expression of molecules involved in cell-cell adhesion such as N-cadherin.31,32 Through the intersection of key genes identified in the WGCNA modules and DEGs, we pinpointed MAB21L2, MEGF10, and ISLR as the pivotal genes mediating the crosstalk between OLF and AS. Further GO BP (biological process) annotation analysis revealed that these central genes were predominantly enriched in processes related to myoblast proliferation, myoblast migration, skeletal muscle satellite cell proliferation, skeletal muscle cell proliferation. Consequently, we hypothesize that the convergent ectopic ossification pathways observed in OLF and AS could be intricately associated with pathological bone formation in the ligamentum flavum and adjacent muscular tissues at its sites of attachment. Heterotopic ossification is a diverse pathologic process, defined as the formation of extraskeletal bone in muscle and soft tissues. Research has shown that Bone morphogenetic protein (BMP) signaling is intricately involved in the processes leading to heterotopic ossification. 33 The patterns of BMPs and BMP receptors expression in individuals with OLF differ from those with nonossified ligamentum flavum (LF). 34 Notably, in human LF cells, BMP-2 exhibits a significant capacity to elevate the expression of osteogenic traits and incite the formation of osseous nodules. 35 This suggests that BMP might play a role in fostering endochondral ossification at heterotopic ossification sites in OLF. 36 Histologic analysis suggests that active BMP signaling is found in the entheses of patients with peripheral SpA and enthesophyte formation. 37 Furthermore, recent investigations have uncovered that aberrant chondrocytes promoted ectopic new bone formation in ankylosing spondylitis through BMP6/pSmad1/5 signaling. 7 To conclude, it is evident that the BMP signaling pathway is integral to the ectopic ossification processes in OLF and AS. Myoblasts (proliferating satellite cells), a population of muscle stem cells, proliferate, differentiate, and fuse into multinuclear myofibers after myofibers are damaged, allowing damaged muscle to be repaired, 28 and myoblasts are known to originate from muscle satellite cells. 38 While the molecular mechanisms governing their commitment to differentiation remain poorly understood, there is a significant body of research focused on the role of resident stem cells within skeletal muscle in the generation of ectopic bone tissue. Research has indicated that BMP2 appears to have the capability to divert committed myogenic cells away from the myogenic lineage’s differentiation pathway, inducing them to differentiate into the osteogenic lineage. 39 Additionally, studies have revealed that sustained expression of Foxc2 in myogenic cells inhibits muscle generation and alters their lineage commitment towards osteogenic differentiation by inducing the Wnt4 and Bmp4 signaling pathways. 38 Therefore, we hypothesize that these central genes may be associated with the ectopic ossification of myoblasts in OLF and AS.
In our further study, ROC analysis revealed that MAB21L2 exhibited an AUC exceeding .600 for predicting OLF and AS. As such, MAB21L2 emerged as a diagnostic marker with robust predictive capabilities. Remarkably, the results of the differential expression analysis unveiled a significant downregulation in OLF, whereas it exhibited a notable upregulation of MAB21L2 in cases of AS. At present, investigations into the MAB21L2 gene remain sparse in the scholarly literature. However, through a review of existing literature, we have found evidence that MAB21L2 immunoprecipitates in vivo with the BMP4 effector SMAD1. In vitro, it binds to SMAD1 and the SMAD1-SMAD4 complex. This suggests that MAB21L2 may serve as a repressor of BMP-induced transcription. 40 BMPs are a group of growth factors known for their ability to induce bone and cartilage development and are a member of the transforming growth factor-beta (TGF-β) superfamily. Activation of BMP receptors results in the initiation of transcription via either the MAP kinase signaling pathway or the phosphorylation of SMAD1/5/8 proteins.41,42 BMP signaling pathways intricately govern various facets of endochondral bone formation. Studies have provided evidence that inhibitory Smads possess the capability to curtail BMP signaling, thereby modulating BMP-induced impacts on chondrocytes. BMPs are versatile growth factors that play a constructive role in stimulating the proliferation and differentiation of osteoblasts. 43 Furthermore, BMP such as BMP2, BMP4, and BMP9 have been shown to be the primary inducers of heterotopic ossification when injected into the muscle tissue of mice44-46 and are highly expressed in human heterotopic ossification lesions.47,48 Previous studies have found that BMP is strongly expressed in chondrocytes within the calcified areas in most cases of OLF.49-51 Therefore, we speculate that the decreased expression level of MAB21L2 in OLF is associated with the ectopic ossification process in OLF. The pathogenesis of AS is not entirely known, and research suggests that skeletal changes in AS extend beyond the characteristic new bone formation leading to ankylosis, including bone loss. 52 Additionally, studies have confirmed the presence of 3 different forms of ectopic ossification in AS, 53 including endochondral ossification, direct bone formation through osteoblast differentiation, and cartilaginous ossification. Furthermore, different BMP signaling pathways and BMPs may be involved at various stages of AS disease development, 37 potentially leading to differential expression levels of BMP4 during different processes. Therefore, we speculate that the increased expression level of MAB21L2 in AS may be related to these factors.
Further single-gene GSEA shed light on the potential functions of MAB21L2 in OLF and AS. Notably, these functions encompassed lysosome-related signaling and oxidative phosphorylation. These fundamental cellular processes are intricately connected to the phenomenon of ectopic ossification.54-56 Additionally, prior research has indicated the presence of immune responses and inflammatory activities in both OLF and AS, involving a variety of immune cell types. 57 Moreover, local inflammation is believed to play a pivotal role in various phenotypes of ectopic ossification and the bone remodeling process. In this study, we identified differentially expressed immune cells, encompassing both the initial innate immunity and subsequent adaptive immunity, in order to unravel the pathogenesis of OLF and AS. The results of immune infiltration unveiled a higher proportion of T cells in the pathogenesis of both OLF and AS. Prior investigations have documented the emergence and critical contribution of CD4+ and CD8+ T cells in the inflammatory response at human tendon attachment sites. 58 Additional research has highlighted the critical importance of the Notch signaling pathway in both the pathological ossification processes within ligamentum flavum tissues and cells, 59 and in the differentiation and functional modulation of T cells. 60 Furthermore, it is well-established that the immune system exerts strong paracrine effects that predominantly influence cellular activities associated with ossification. This intricate interplay between the skeletal system and the immune system has ushered in a new avenue of research, referred to as osteoimmunology. 61 Nevertheless, the interaction between adaptive immunity and MAB21L2 necessitates further exploration. We found that MAB21L2 had a significant correlation with activated CD8 T cells in both OLF samples and AS samples. BMP4 has been reported to be able to regulate T cell development in the thymus. In vitro experiments have shown that treatment of thymus explants with exogenous BMP4 negatively regulated differentiation of early thymocyte progenitors and the transition from CD4−CD8− cells to CD4+CD8+ cells. 62 As previously mentioned, MAB21L2 acts as a transcriptional inhibitor of BMP4 40 ; hence, we speculate that BMP4 may serve as a pivotal link between MAB21L2 and T cell activities. This will highlight the common pathophysiology at the immune level and may be a key factor in understanding the relationship between OLF and AS. However, the interaction between adaptive immunity and MAB21L2 needs to be further explored.
It’s important to acknowledge certain limitations in this research. Firstly, despite our inclusion of all accessible datasets from the GEO database, the volume of data remains restricted. Further investigation should encompass additional multicenter external datasets and involve extensive experimental studies to delve into the precise molecular mechanisms of the hub genes. Secondly, since MAB21L2 does not possess typical receptor characteristics but is primarily involved in cellular development processes, 63 there are currently no reports in the literature of specific receptor antagonists or agonists for MAB21L2. However, with ongoing research into the role of this gene in ectopic ossification, future studies may explore key downstream effectors or signaling pathways associated with MAB21L2, aiming to develop targeted small molecule inhibitors or agonists. Such approaches could indirectly modulate the biological functions of MAB21L2, thereby offering new therapeutic strategies for the clinical treatment of ectopic ossification. Lastly, the hypothesis articulated here necessitates substantial empirical backing. Future studies should encompass a variety of experimental techniques, including western blotting, immunohistochemistry assays, and quantitative reverse transcription-PCR, to validate our findings. In light of these constraints, this study aspires to offer an initial perspective on shared biomarkers associated with ectopic ossification in spinal ligaments. In forthcoming research, we plan to delve deeper into the alterations in MAB21L2 expression, utilizing relevant in vitro and in vivo experiments to enhance our understanding.
Conclusions
The current research represents the inaugural attempt to employ bioinformatic analysis to scrutinize the shared pathways and genetic diagnostic markers linked to OLF and AS. The findings suggest a conceivable association between the ECM-receptor interaction, cell-cell adhesion, and the pathogenesis of both OLF and AS. Furthermore, MAB21L2 emerges as a potential diagnostic marker for individuals facing the challenges of OLF concurrent with AS. The correlation analysis of immune infiltration implies a close connection between the pathogenesis of OLF and AS and T cells. In essence, this study offers a fresh perspective for delving into the possible mechanisms of AS secondary to OLF.
Footnotes
Authors’ Contributions
Conceptualization, methodology, Y.L. and Y.L.; software, Y.L. and Y.L.; validation, Y.L., Z.G. and J.Z.; data curation, C.W. and Z.G.; writing—original draft preparation, Y.L. and Y.Q.; writing—review and editing, J.Y. and X.L.; visualization, J.Y.; supervision, X.L. All authors have read and agreed to the published version of the manuscript.
Declaration of Conflicting Interests
The author(s) declared no potential conflicts of interest with respect to the research, authorship, and/or publication of this article.
Funding
The author(s) received no financial support for the research, authorship, and/or publication of this article.