
Abstract
Objectives
While the radiographic criteria for diagnosing central lumbar stenosis are well described, criteria for diagnosing neuroforaminal stenosis (NFS) are unclear. Prior research has utilized magnetic resonance imaging (MRI) to characterize neuroforaminal dimensions (NFDs). However, this approach has inherent limitations that can adversely impact measurement accuracy. Existing literature on the use of computed tomography (CT) to investigate normal NFDs is limited. The purpose of the present study was to describe normal lumbar NFDs that would aid in the establishment of objective quantitative criteria for the diagnosis of NFS.
Methods
This study evaluated CT imaging of 494 female and 506 male subjects between 18 and 35 years of age to determine normal NFDs, specifically the sagittal anteroposterior width, craniocaudal height, and area. Statistical analyses were performed to assess differences in NFDs according to variables including sex, height, weight, body mass index, and ethnicity.
Results
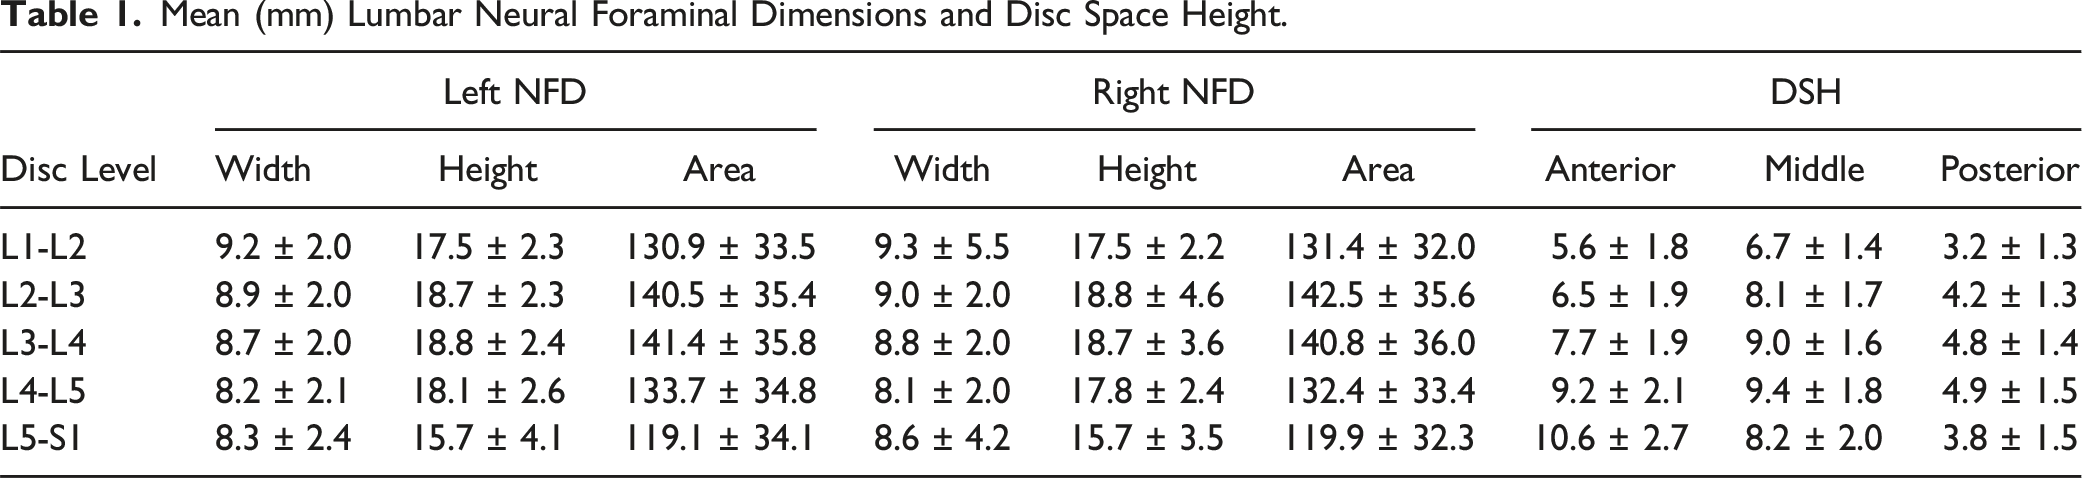
Without differentiating between sides or disc levels, mean NFDs were 8.71 mm for sagittal anteroposterior width, 17.73 mm for craniocaudal height, and 133.26 mm2 for area (n = 10,000 measurements each). Male subjects had larger NFDs than females at multiple levels. Asian and Caucasian subjects had larger NFDs than Hispanic and African American subjects at multiple levels. There were no associations between NFDs and anthropometric factors.
Conclusions
The present study describes normal lumbar NFDs in young, healthy patients. NFDs were influenced by sex and ethnicity but not by anthropometric factors.
Keywords
Introduction
Lumbar stenosis refers to a pathologic process whereby narrowing of the spinal canal leads to compression of neural structures. The term was first described along with its clinical manifestations by Verbiest in 1954. 1 Arnoldi et al. later expanded on the term, creating a classification scheme that not only considered stenosis of the central spinal canal but also stenosis of the lateral recess. 2 Stenosis of the lateral recess or neuroforaminal stenosis (NFS) is worth distinguishing from central canal stenosis, as the two can have notably different pathophysiologic and clinical manifestations. Unlike central canal stenosis, neuroforaminal stenosis causes unilateral radiating pain due to compression of the nerve as it exits the foramen. Degeneration of the intervertebral discs can allow the superior articular process of the inferior vertebra, one of the structures contributing to the border of the lateral recess, to shift anterosuperiorly, diminishing the total area of the foramen. 3 The incidence of NFS has been reported as 8% to 11% and is becoming an increasingly common cause of lumbar radicular symptomatology.3-6 Some studies have suggested that stenosis of the lateral recess may be the cause of pain in up to 60% of patients complaining of lingering discomfort following back surgery. 7 Proper identification of NFS when present is thus imperative in helping mitigate pain in patients being treated for radicular symptoms.
Advanced imaging techniques, such as magnetic resonance imaging (MRI) and computed tomography (CT), are useful in helping clinicians diagnose lumbar stenosis. However, the diagnosis is mostly clinical, relying on information pertaining to each patient’s unique history, presentation, and associated symptomatology. In recent years, there have been many efforts by researchers to provide a definitive set of diagnostic criteria for assessing central lumbar stenosis. 8 On the other hand, data on neuroforaminal dimensions (NFDs) is much sparser and most clinicians continue to describe NFS subjectively.
Harianja et al. recently described normal lumbar NFDs in 600 patients without spinal pathology. 9 The purpose of the current study was to conduct a follow-up analysis using an expanded 1,000-individual study population that better reflects a diverse range of ethnic groups. Like the prior analysis, we measured the height, width, and area of lumbar neural foramina in young, skeletally mature individuals without back pain or spinal pathology. Because this study was conducted using a larger study population, our data may further aid in the establishment of normal NFDs. Furthermore, our data can provide nuanced insight into associations between lumbar NFDs and sex, ethnicity, and body mass index (BMI).
Methods
This study received approval (#5230005) from the Loma Linda University Institutional Review Board. Patient consent was not required due to the nature of this retrospective, radiographic study. Following approval, we evaluated the medical and radiographic records of patients between 18 and 35 years of age who received an abdomen and pelvis, or lumbar CT (GE Discovery 750 HD 64 slice CT Scanner) between February of 2018 and March of 2023. The charts of all patients considered for inclusion within this study were reviewed in a systematic, consecutive manner corresponding to the chronological sequence in which their imaging was completed. To establish an equal number of male and female patients, the charts of male and female candidates were filtered by sex and reviewed in an alternating manner. Those with a history of degenerative disc disease, scoliosis (defined as a coronal deformity greater than 10 degrees), congenital lumbar stenosis (CLS), spondylolisthesis, spinal trauma, neoplasm, existing spinal hardware, had CT imaging performed due to back pain, or previous spinal surgery were excluded from this study. A patient was identified as having CLS if any of their L2-L5 pedicle lengths were smaller than the thresholds described by Singh et al. in their prospective study of CLS. 10
All images were reviewed and measured using the IMPAX6 (Agfa-Gavaert, Mortsel, Belgium) picture archiving and communication system with a window designation of 2,000 Hounsfield Unit and a level designation of 500 Hounsfield Unit. All measurements were performed by medical students trained by a board-certified neuroradiologist to measure anterior, middle, and posterior disc space height and L1-S1 neuroforaminal dimensions, defined as the following: sagittal anteroposterior (AP) width, foraminal height, and neuroforaminal area.
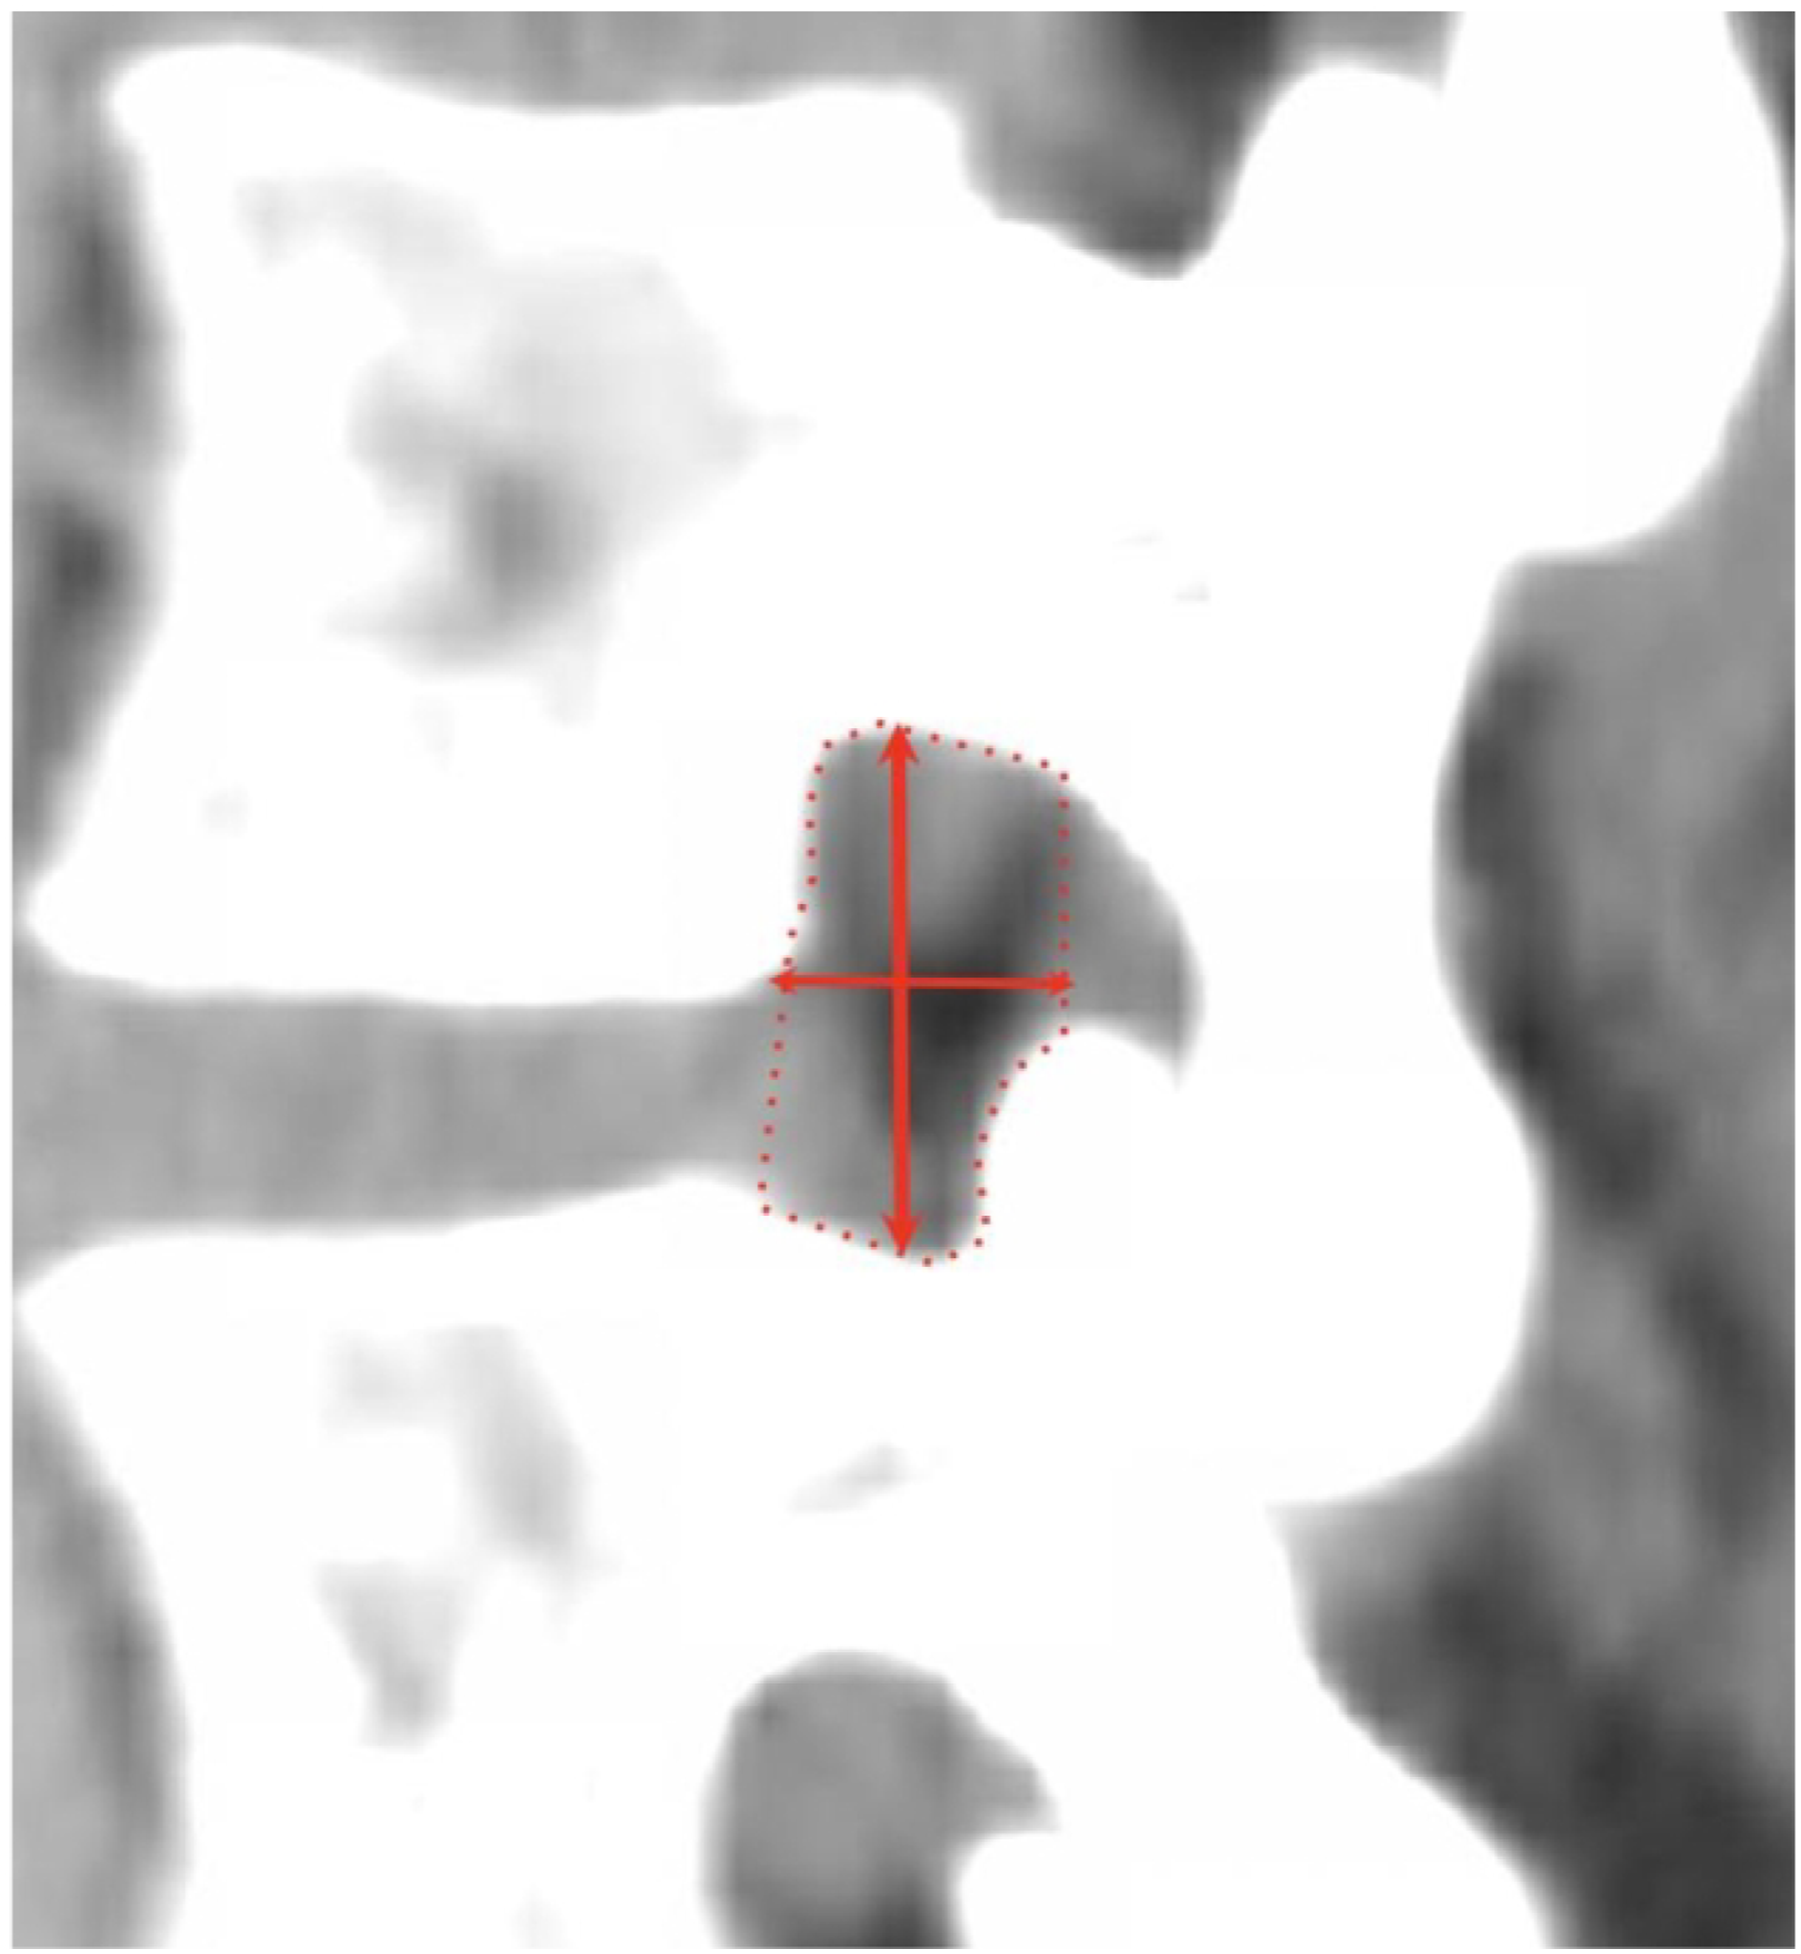
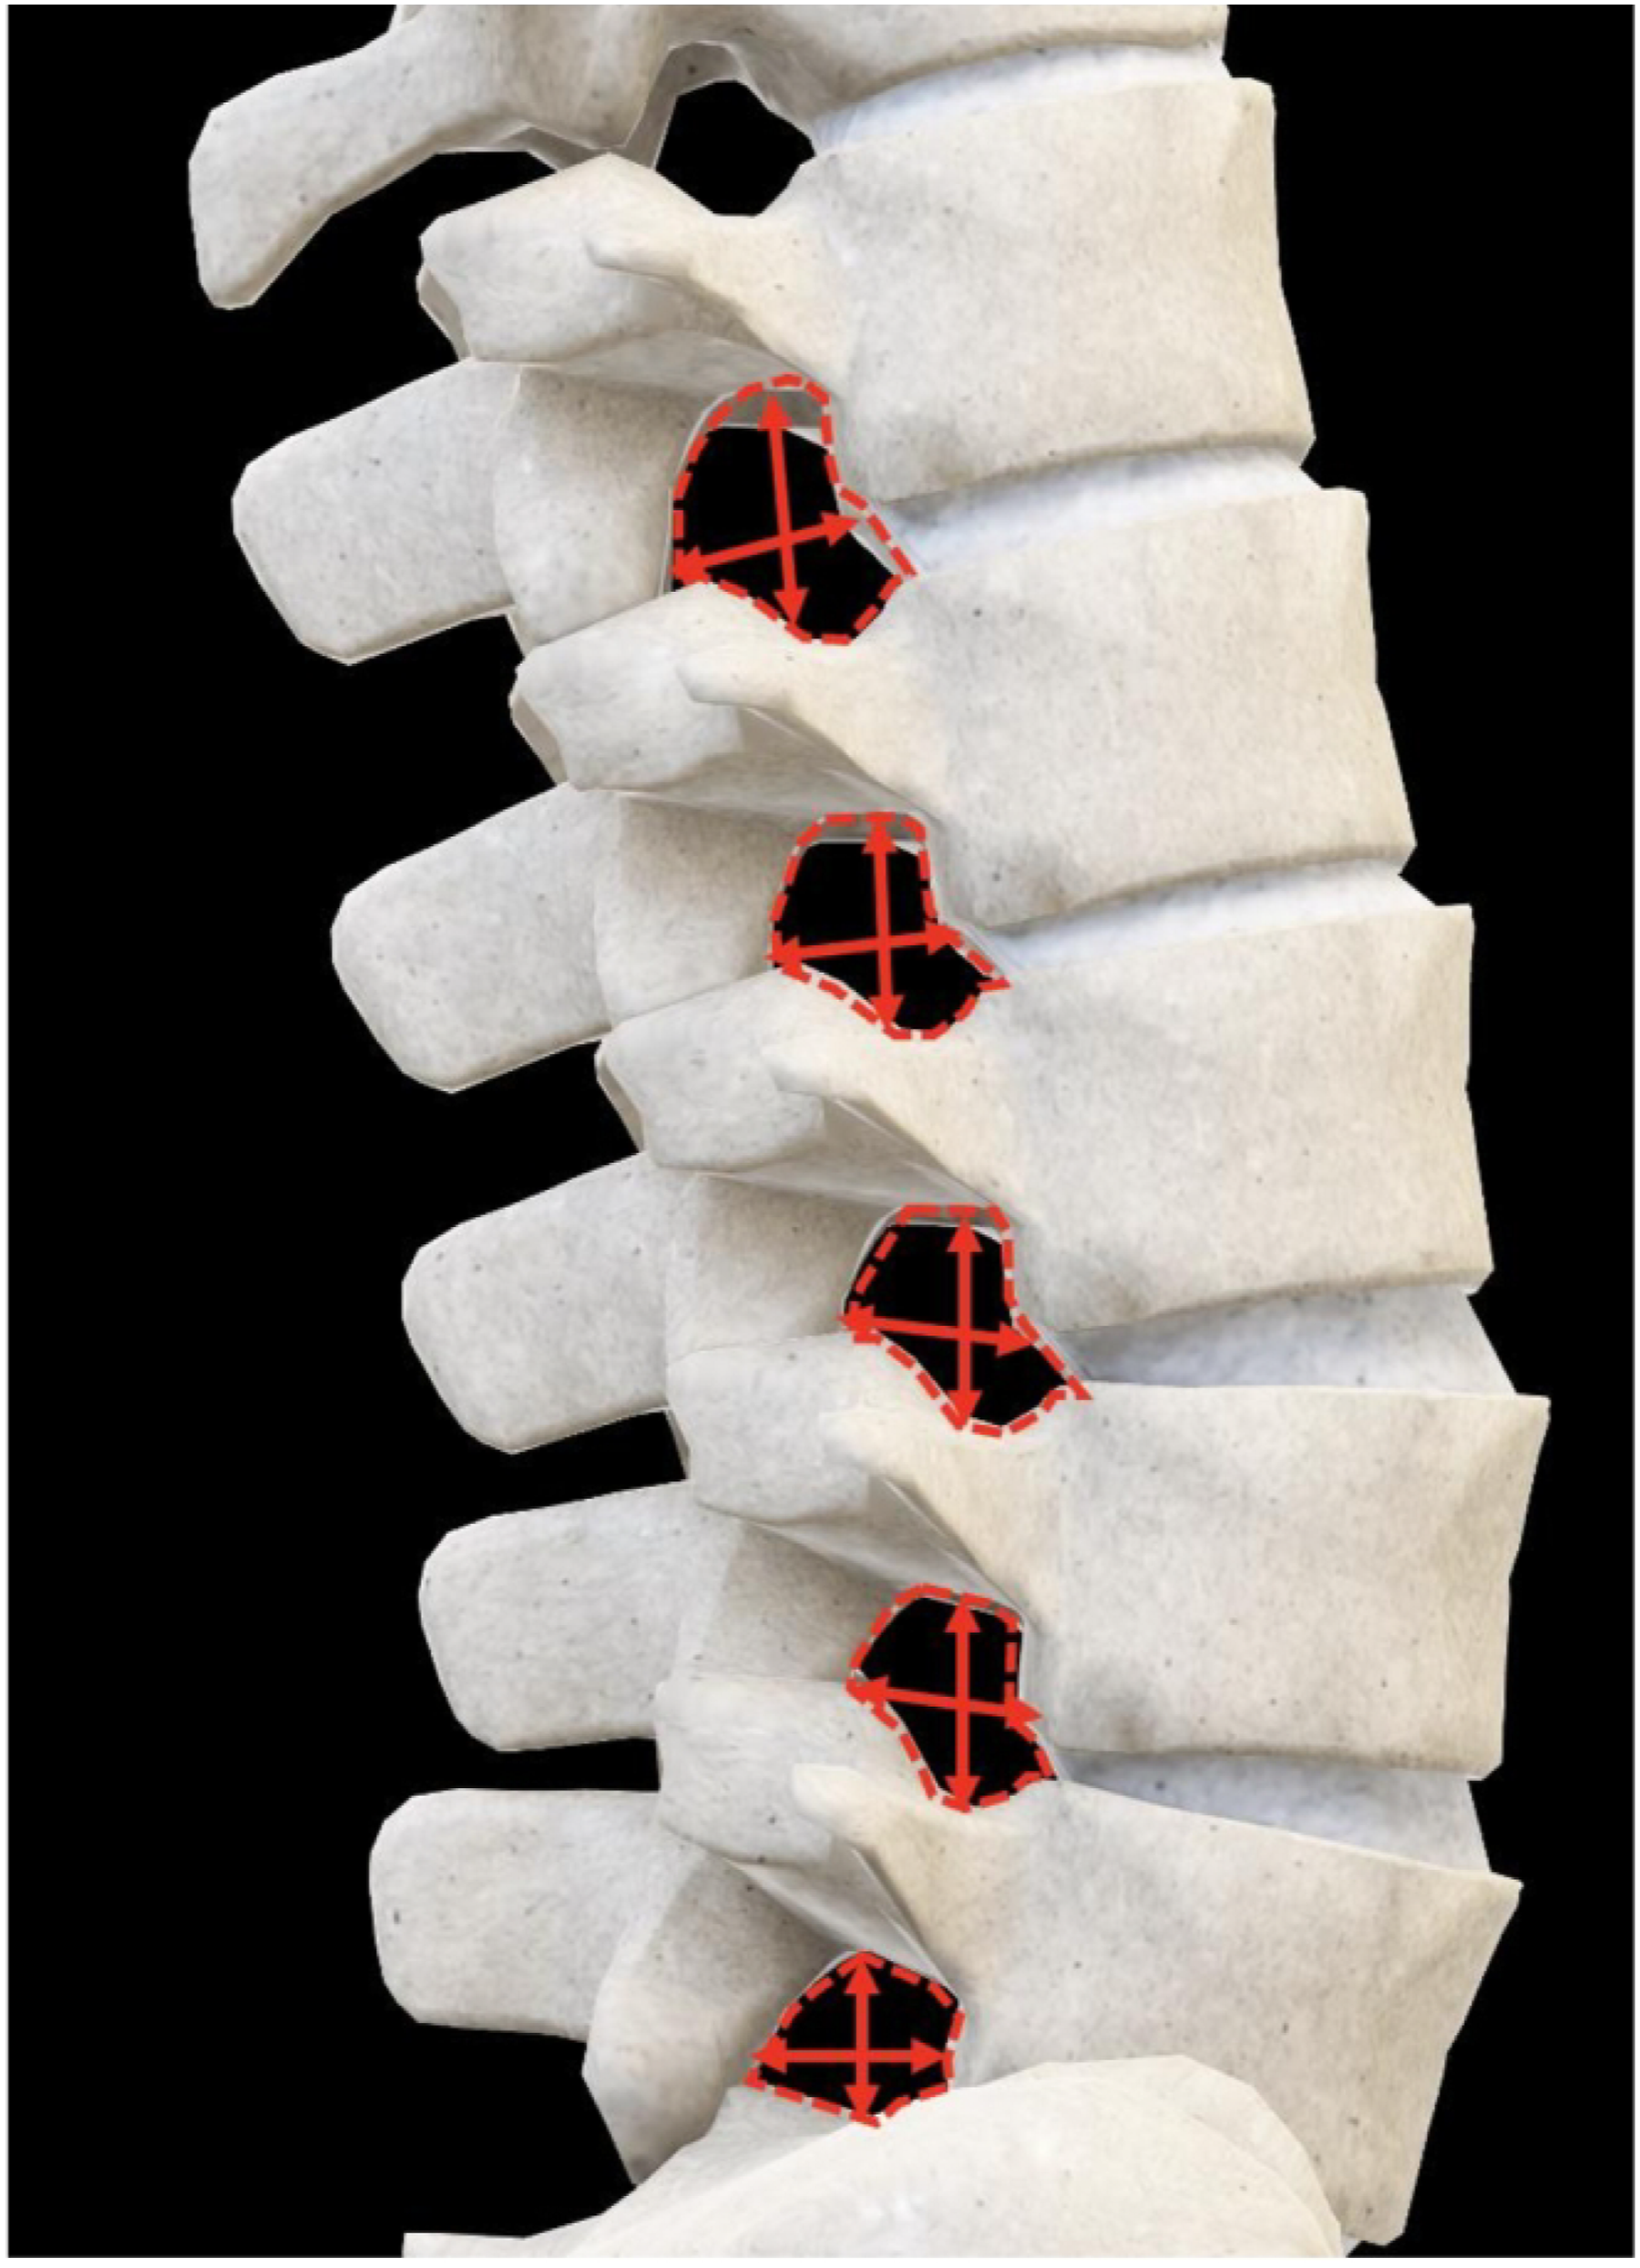
Anterior and posterior disc space heights were obtained from the sagittal view in millimeters (mm) and were measured as the shortest distances between the planes of the anterior and posterior endplates (see Figure 1). Middle DSH was measured at the center of each interspace. Sagittal AP width was defined as the maximal distance between the superior vertebral body posterior margin and the inferior articular facet anterior margin. Foraminal height was defined as the maximum distance between the inferior notch of the pedicle of the superior vertebral body and the superior notch of the pedicle of the inferior vertebral body. Area of the neuroforamen was measured from the sagittal view using IMPAX6 tracing freeform tool. Figure 2 illustrates the measurement technique of all neuroforaminal dimensions. Figure 3 provides a three-dimensional representation of the neuroforaminal dimensions. Patient demographic and anthropometric characteristics—sex, race, ethnicity, age, body mass index (BMI), height, and weight—were also collected, with all data collection performed using Microsoft Excel version 16.58 (Microsoft Corporation, 2022, Redmond, WA, USA). Three-dimensional representation of disc space height measurements. Sagittal measurements of neuroforaminal dimensions. Three-dimensional representation of neuroforaminal measurements.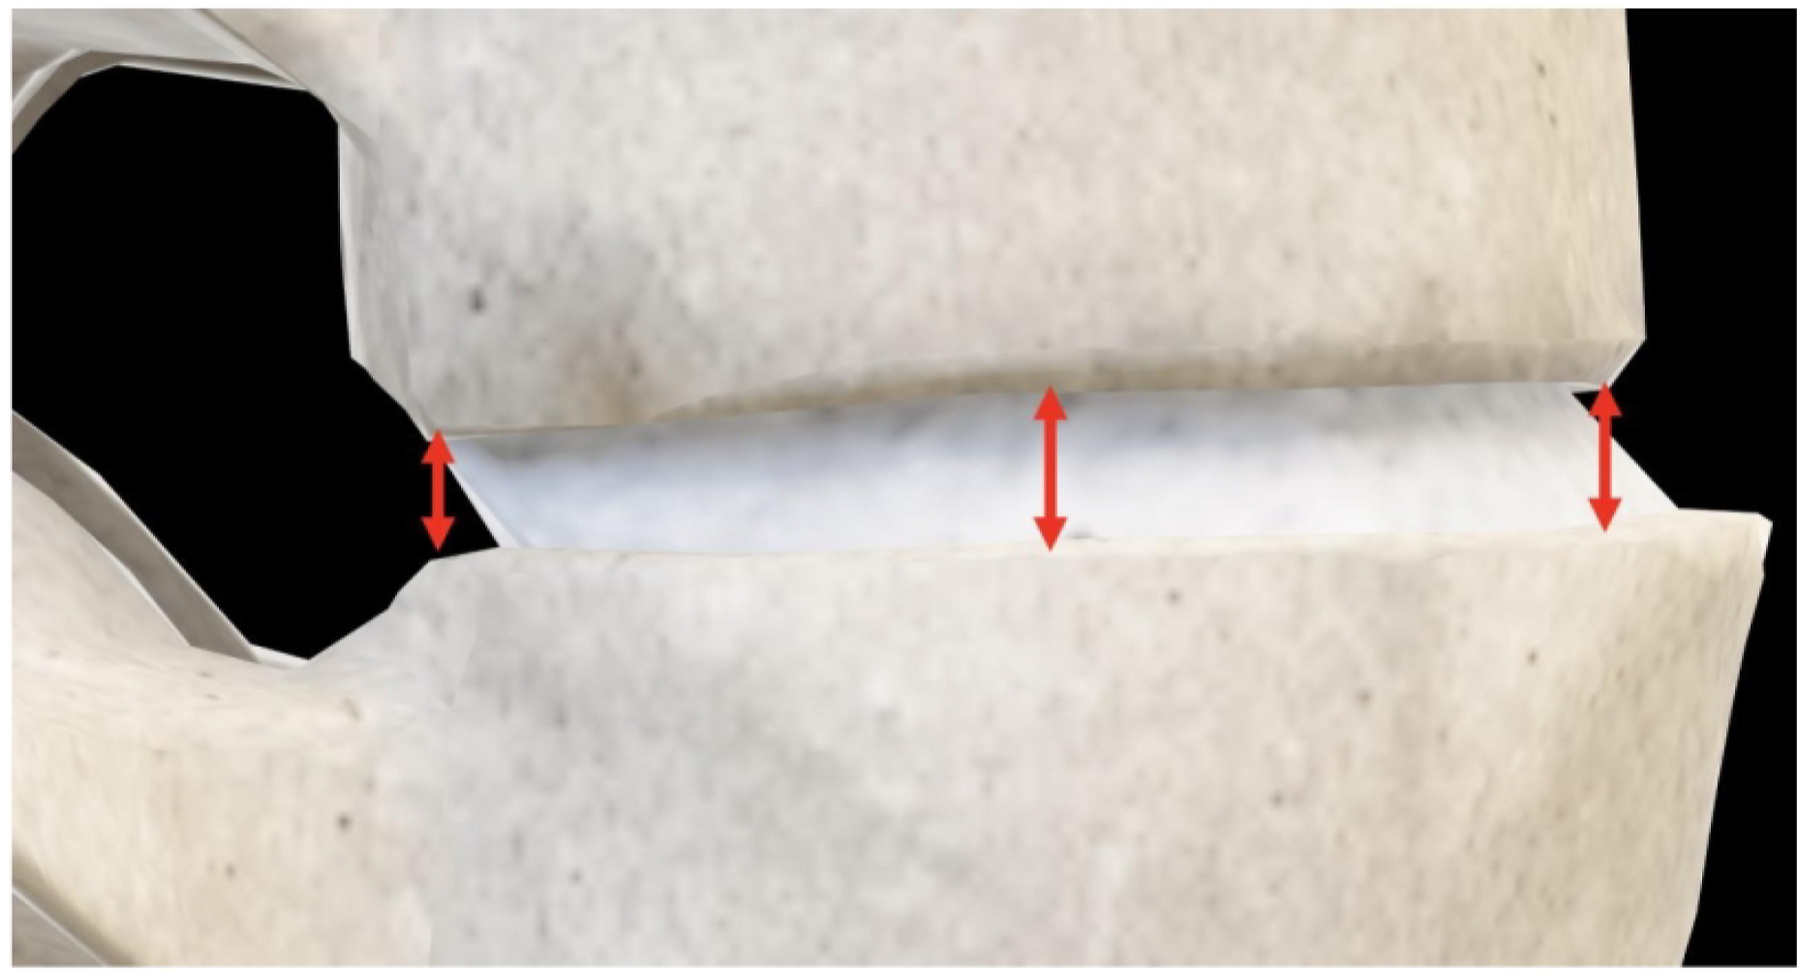
Statistical Analyses
All statistical analyses were performed using SPSS version 28 (IBM Corporation, 2021, Armonk, NY, USA) with an alpha setting of .05 used to denote statistical significance. Levene’s homogeneity of variance test and regression residual plots were employed to assess homoscedasticity. Kolmogorov-Smirnov tests and Q-Q plots were used to assess normality of data distribution. 11 Correlation coefficients were classified as weak, moderate, and strong corresponding to value ranges of 0-.4, .4-.7, and .7-1, respectively. 12 The intraclass correlation coefficient (ICC) for absolute agreement in a 2-way mixed model was used to analyze interrater reliability.13,14 Reviewers were medical students trained by a board-certified neuroradiologist to measure anterior, middle, and posterior disc space height and bilaterally measure L1-S1 NFDs consisting of the sagittal anteroposterior width, foraminal height, and neuroforaminal area. There was a total of six reviewers, and each CT scan was measured by one reviewer, except that measurements of anteroposterior width, foraminal height, and neuroforaminal area for the first 200 subjects were performed by two students to assess the ICC. ICC values of <.40, .40 to .59, .60 to .74, and >.74 were characterized as poor, fair, good, and excellent, respectively.13,15 After evaluating the reliability of the measurements performed on the first 200 patients, the ICC was found to be excellent at .892 with a 95% confidence interval of .877 to .912. The remaining measurements were reviewed by one reviewer per CT scan. To assess associations among radiographic, demographic, and anthropometric variables, stepwise-, backward-, and forward-method multivariate linear regression models with zero-order and partial correlations were analyzed. Sex differences in measurements were analyzed using independent-sample t-tests after the Levene’s test demonstrated equality of variance. Racial and ethnic measurement differences were assessed using 1-way analysis of variance (ANOVA) with post-hoc Bonferroni and Tukey corrections. Measurement differences between disc levels and between left and right-sided measurements were analyzed using paired-sample t-tests and ANOVA.
Power Analyses
To assess for sufficient sample size, nondirectional partial correlation power analysis was conducted with a sample size of 1,000, specified parameters of .05 for alpha, a null value of zero, a partial correlation parameter of .300, and an assumed number of 4 variables to be partialled out. Power analysis determined an achieved power of 100%. Similarly, a univariate linear regression power analysis estimating the power of type III F-test was conducted with a sample size of 1,000, an alpha of .05, a population multiple partial correlation of .300, 6 total predictors, and 4 test predictors, with an achieved power of 100%. Finally, one-way ANOVA power analysis was conducted with specified parameters of .05 for alpha, an assumed standard deviation of 1.0, and sample groups of 464, 305, 119, and 112 (corresponding to the ethnic subgroups of our study), with a similar observed power of 100%.
Results
Subject Characteristics
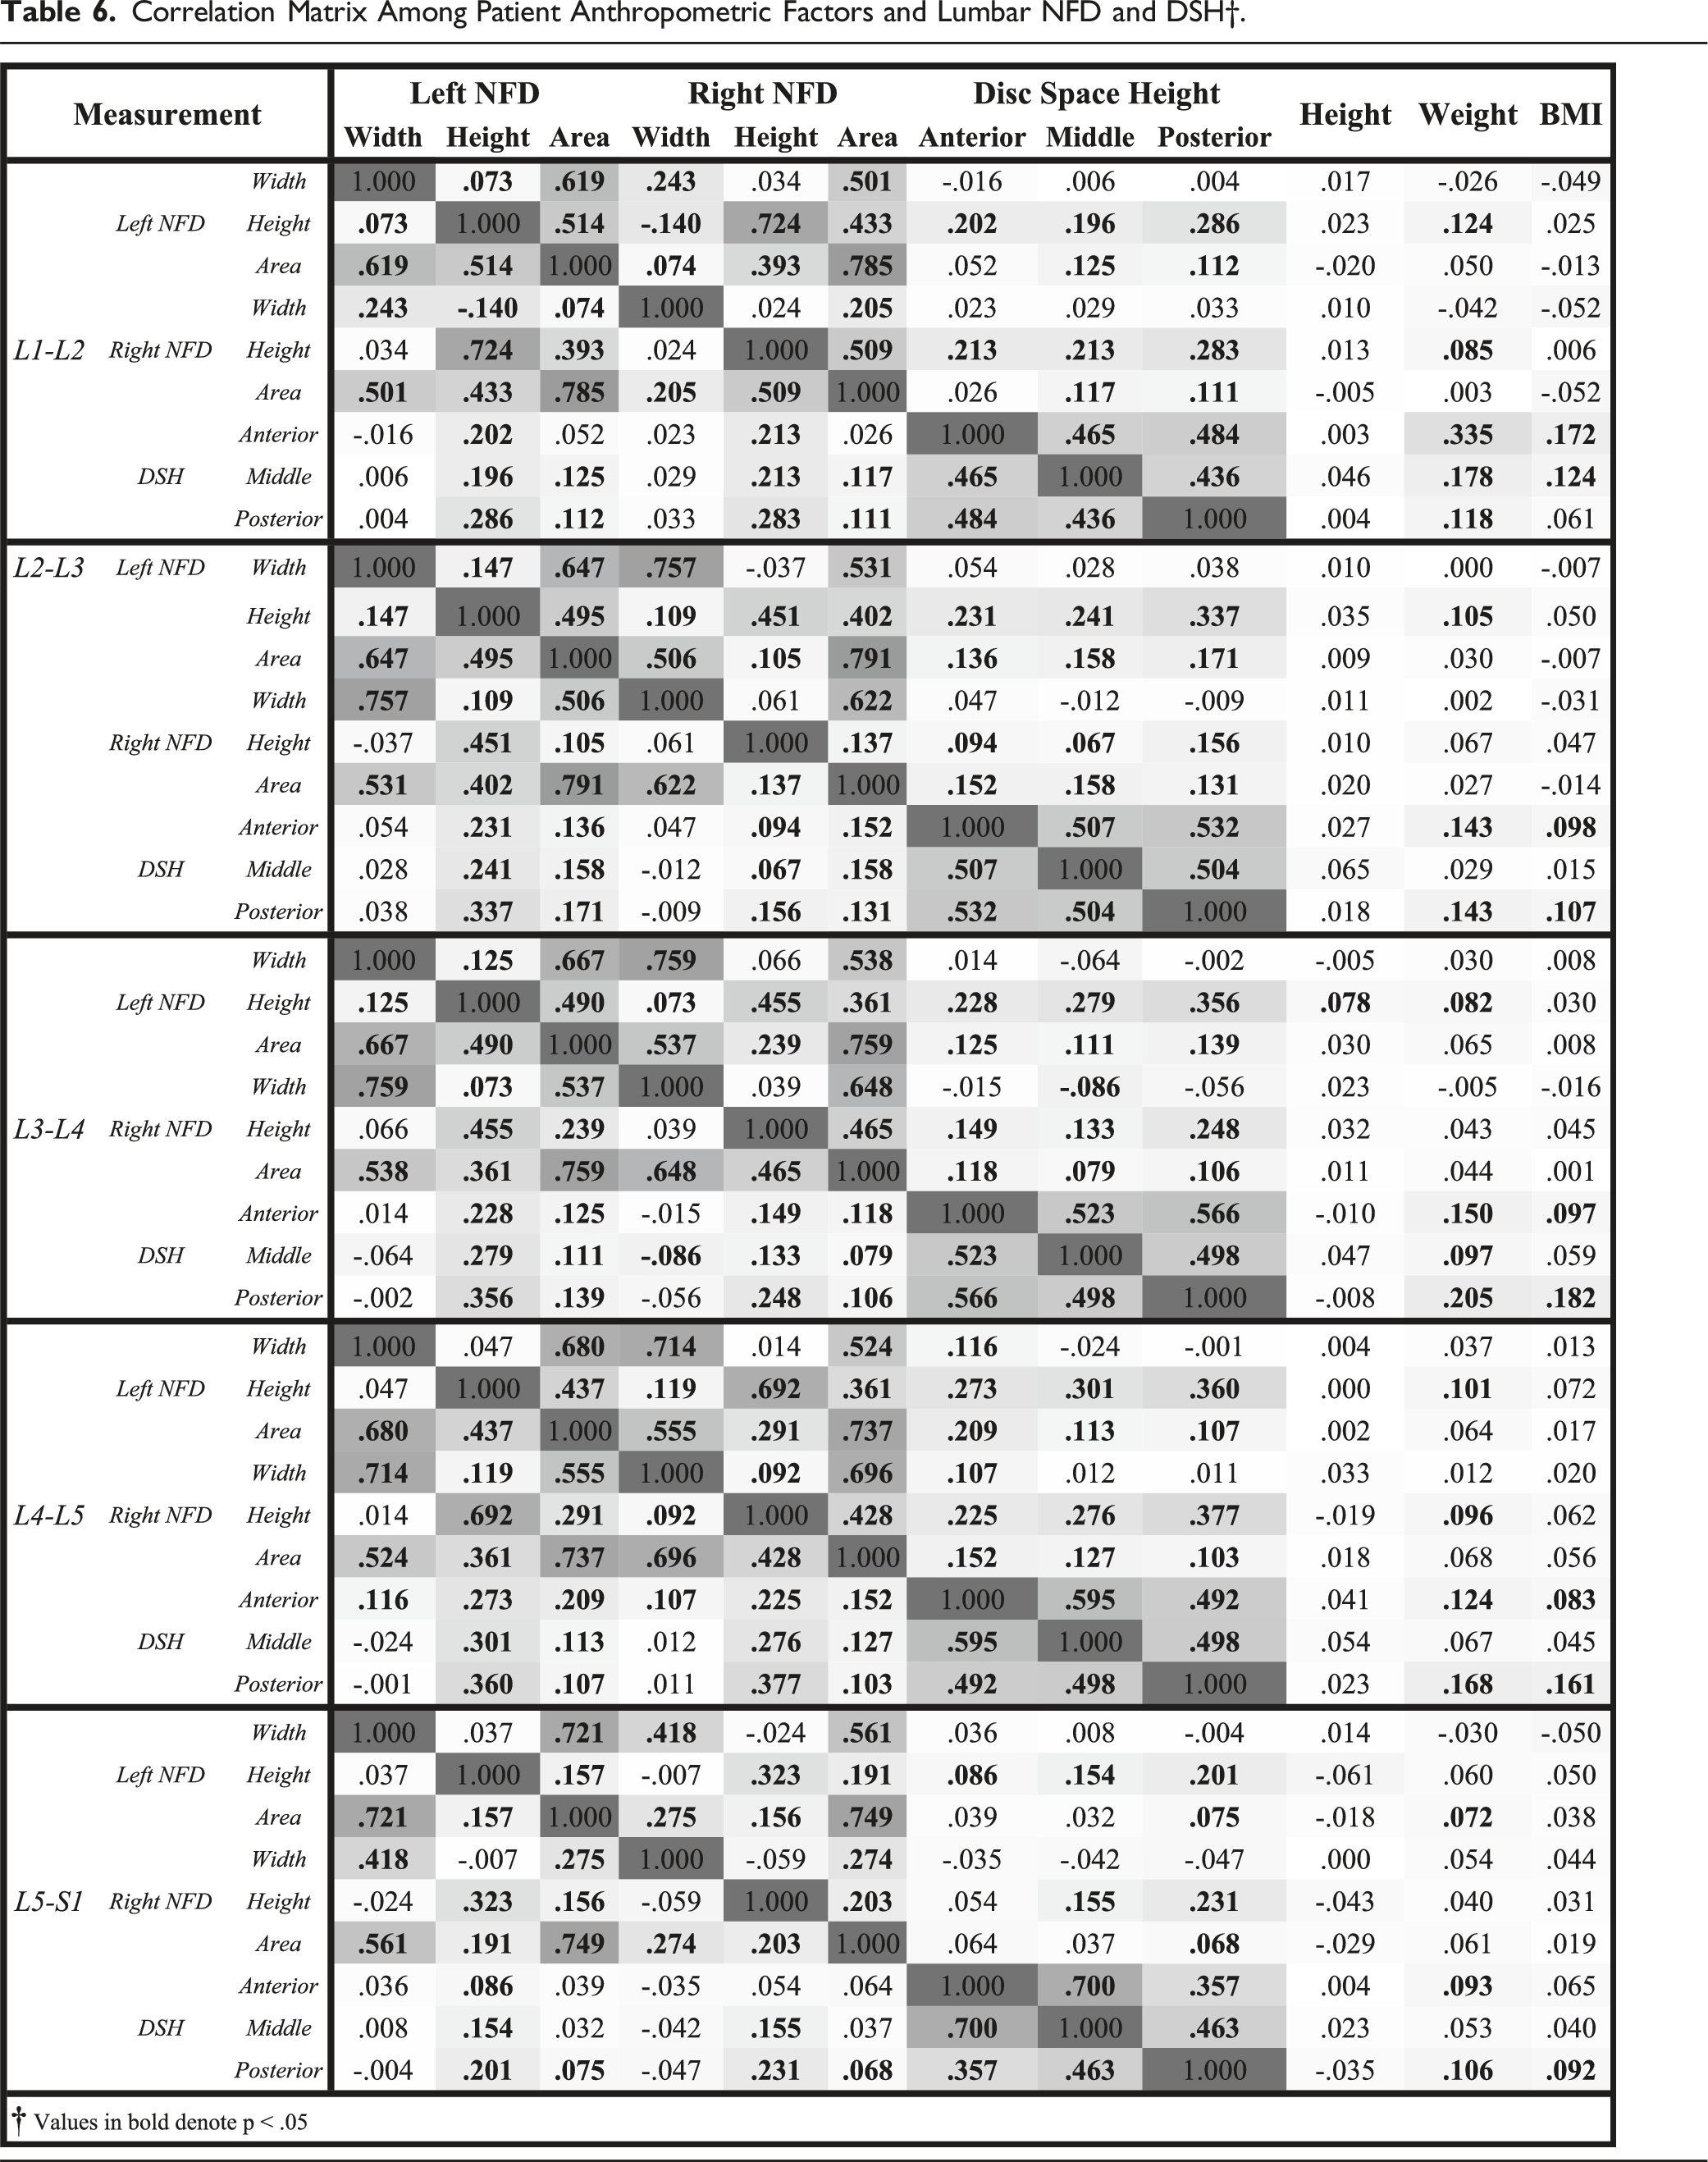
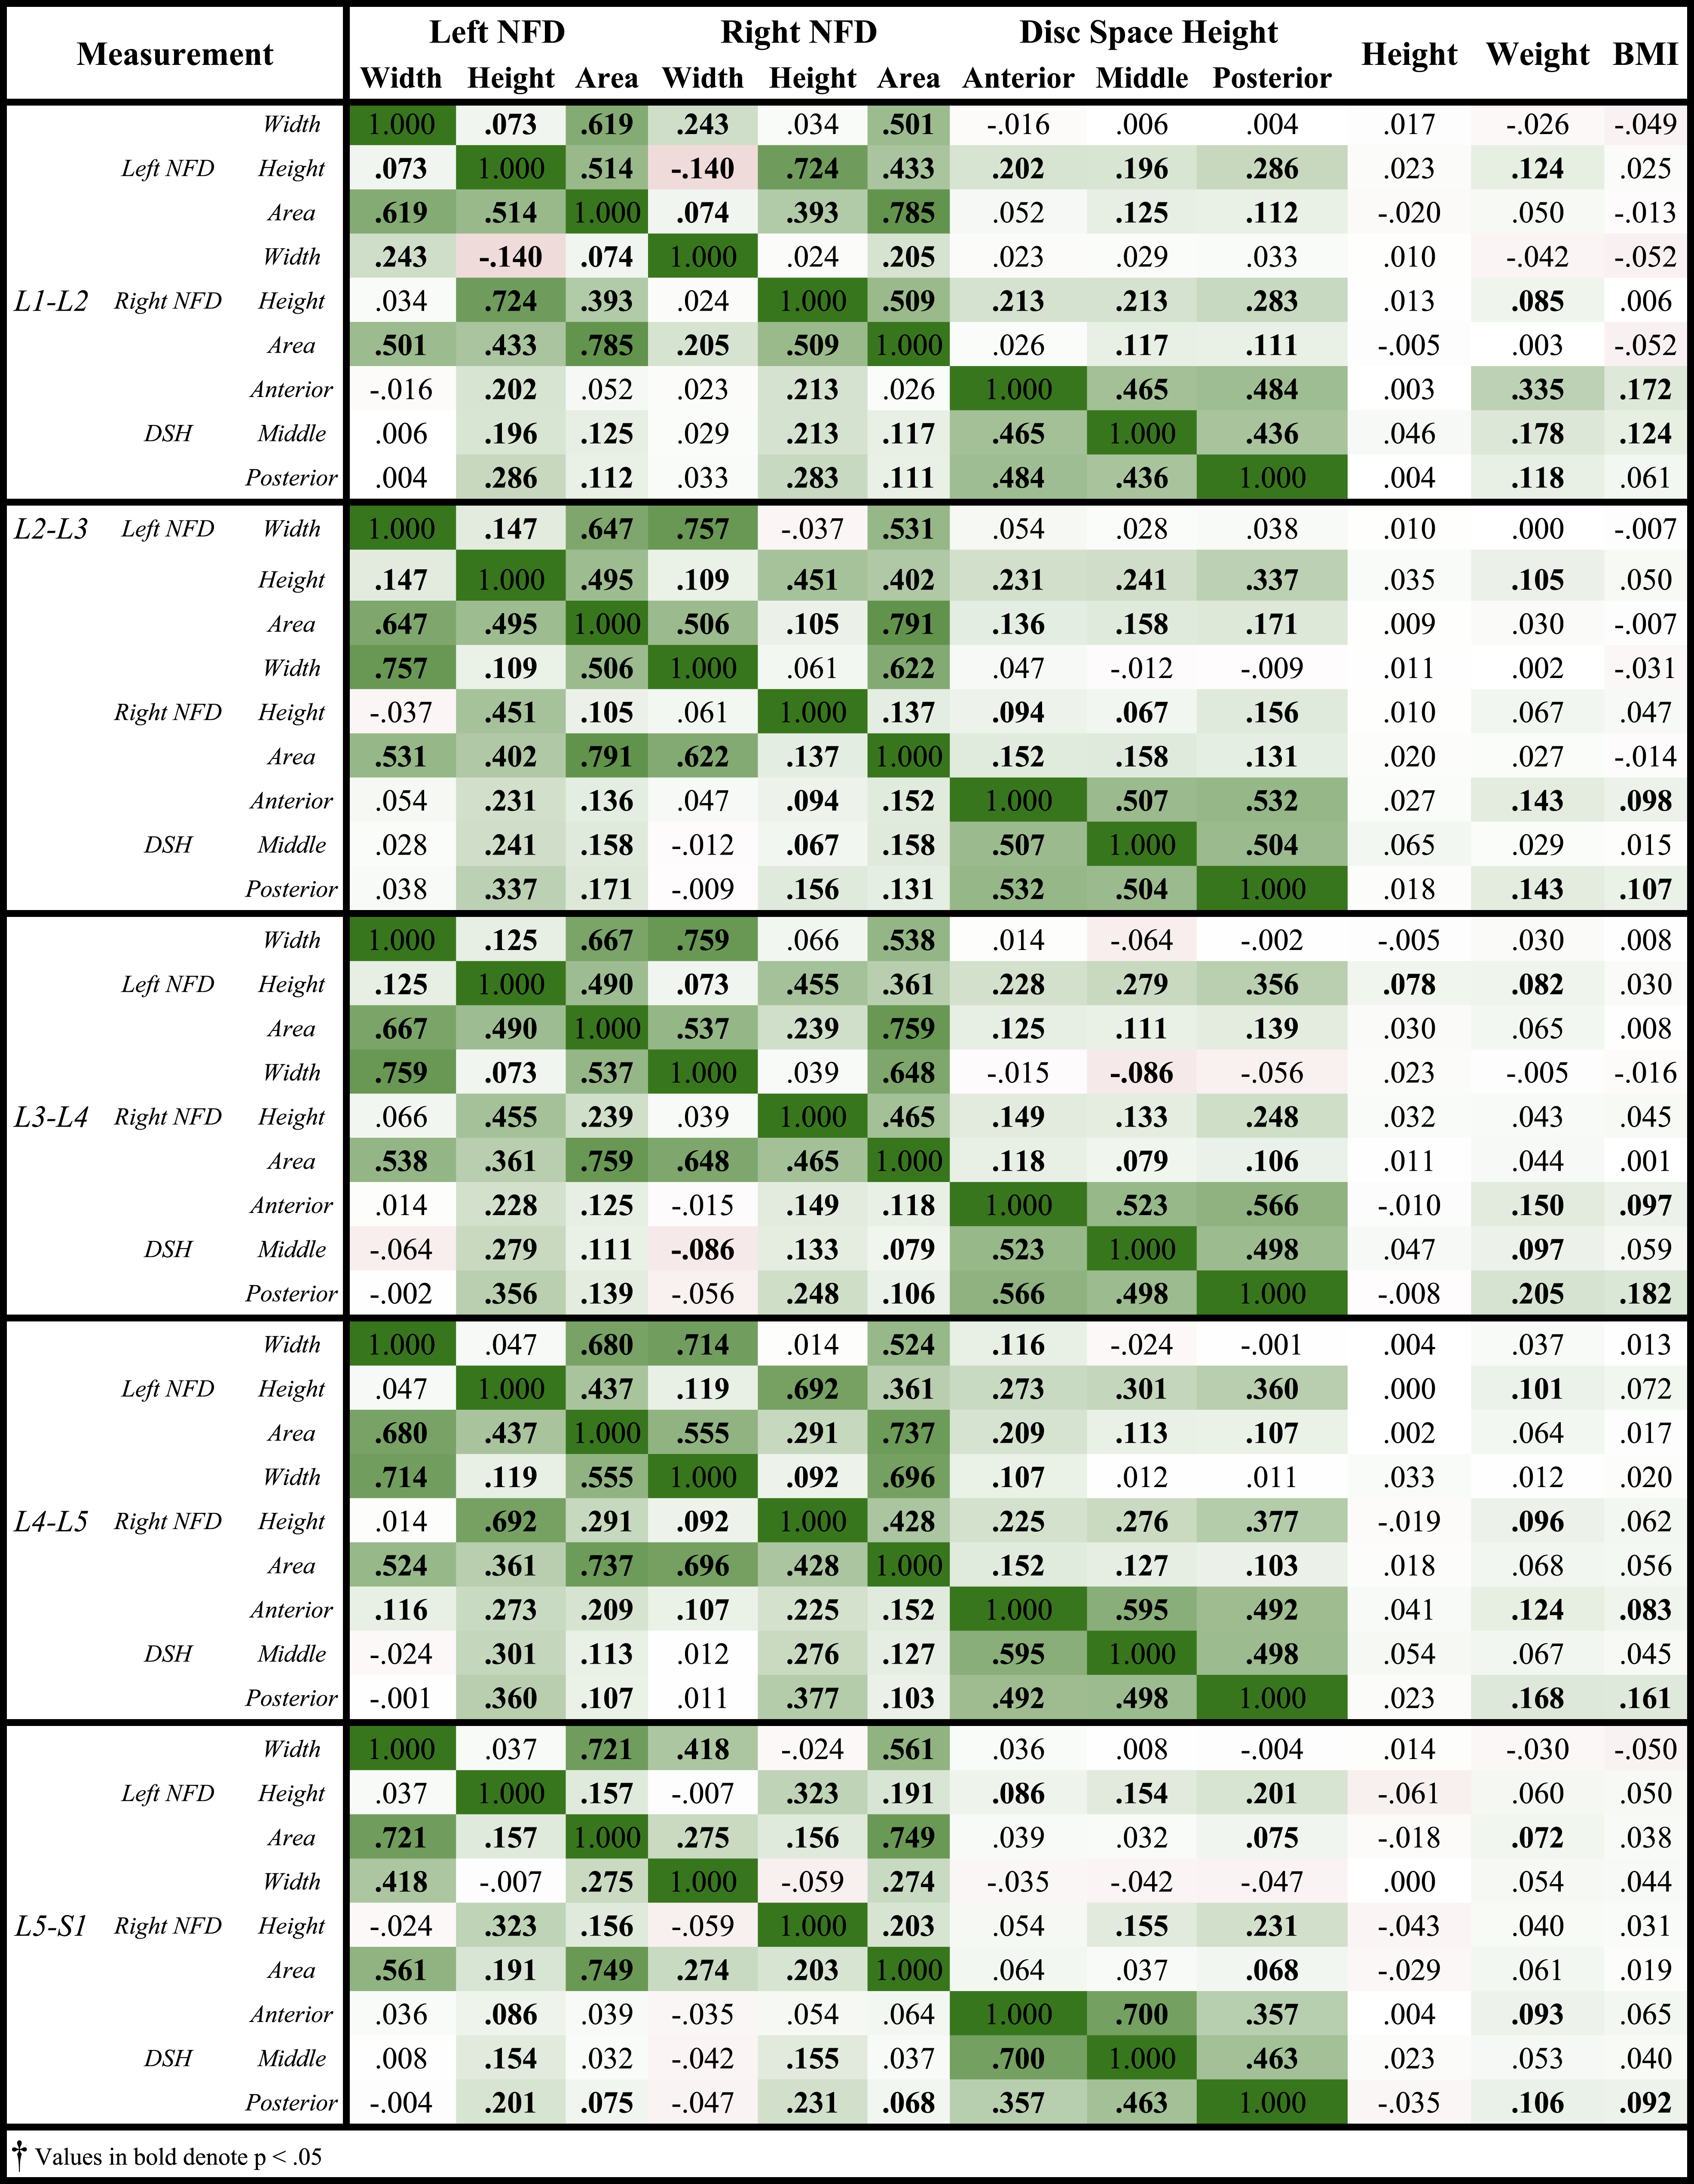
494 female patients and 506 males were analyzed in this study. Mean age was 27.9 years, with a range of 18 to 35 years. Mean height was 1.62 ± .12 meters, with a range of 1.21 to 1.94 meters. Mean weight was 80.51 ± 23.74 kilograms, with a range of 35.53 to 209.99 kg. Mean patient BMI was 28.24 ± 7.7 kg/m2, with a range of 15.47 to 63.27 kg/m2. The Pearson correlations and regression modeling revealed no moderate or strong correlations between NFDs and anthropometric variables for any level in the L1-S1 region. Table 6 reports Pearson correlations for NFDs and anthropometric factors. Supplementary Tables 1-5 report regression modeling for NFDs from L1-S1, respectively. For Supplementary Tables 1-5, R2 represents the coefficient of determination, a measure of how effective all the variables from the study are at predicting each of the six variables listed in the first column. R2 values of less than .4 suggest that the model is not effective at approximating the predicted values.
Neuroforaminal Dimensions
Mean (mm) Lumbar Neural Foraminal Dimensions and Disc Space Height.
Sex Differences
Differences in NFD and DSH Measurements Based on Patient Sex.
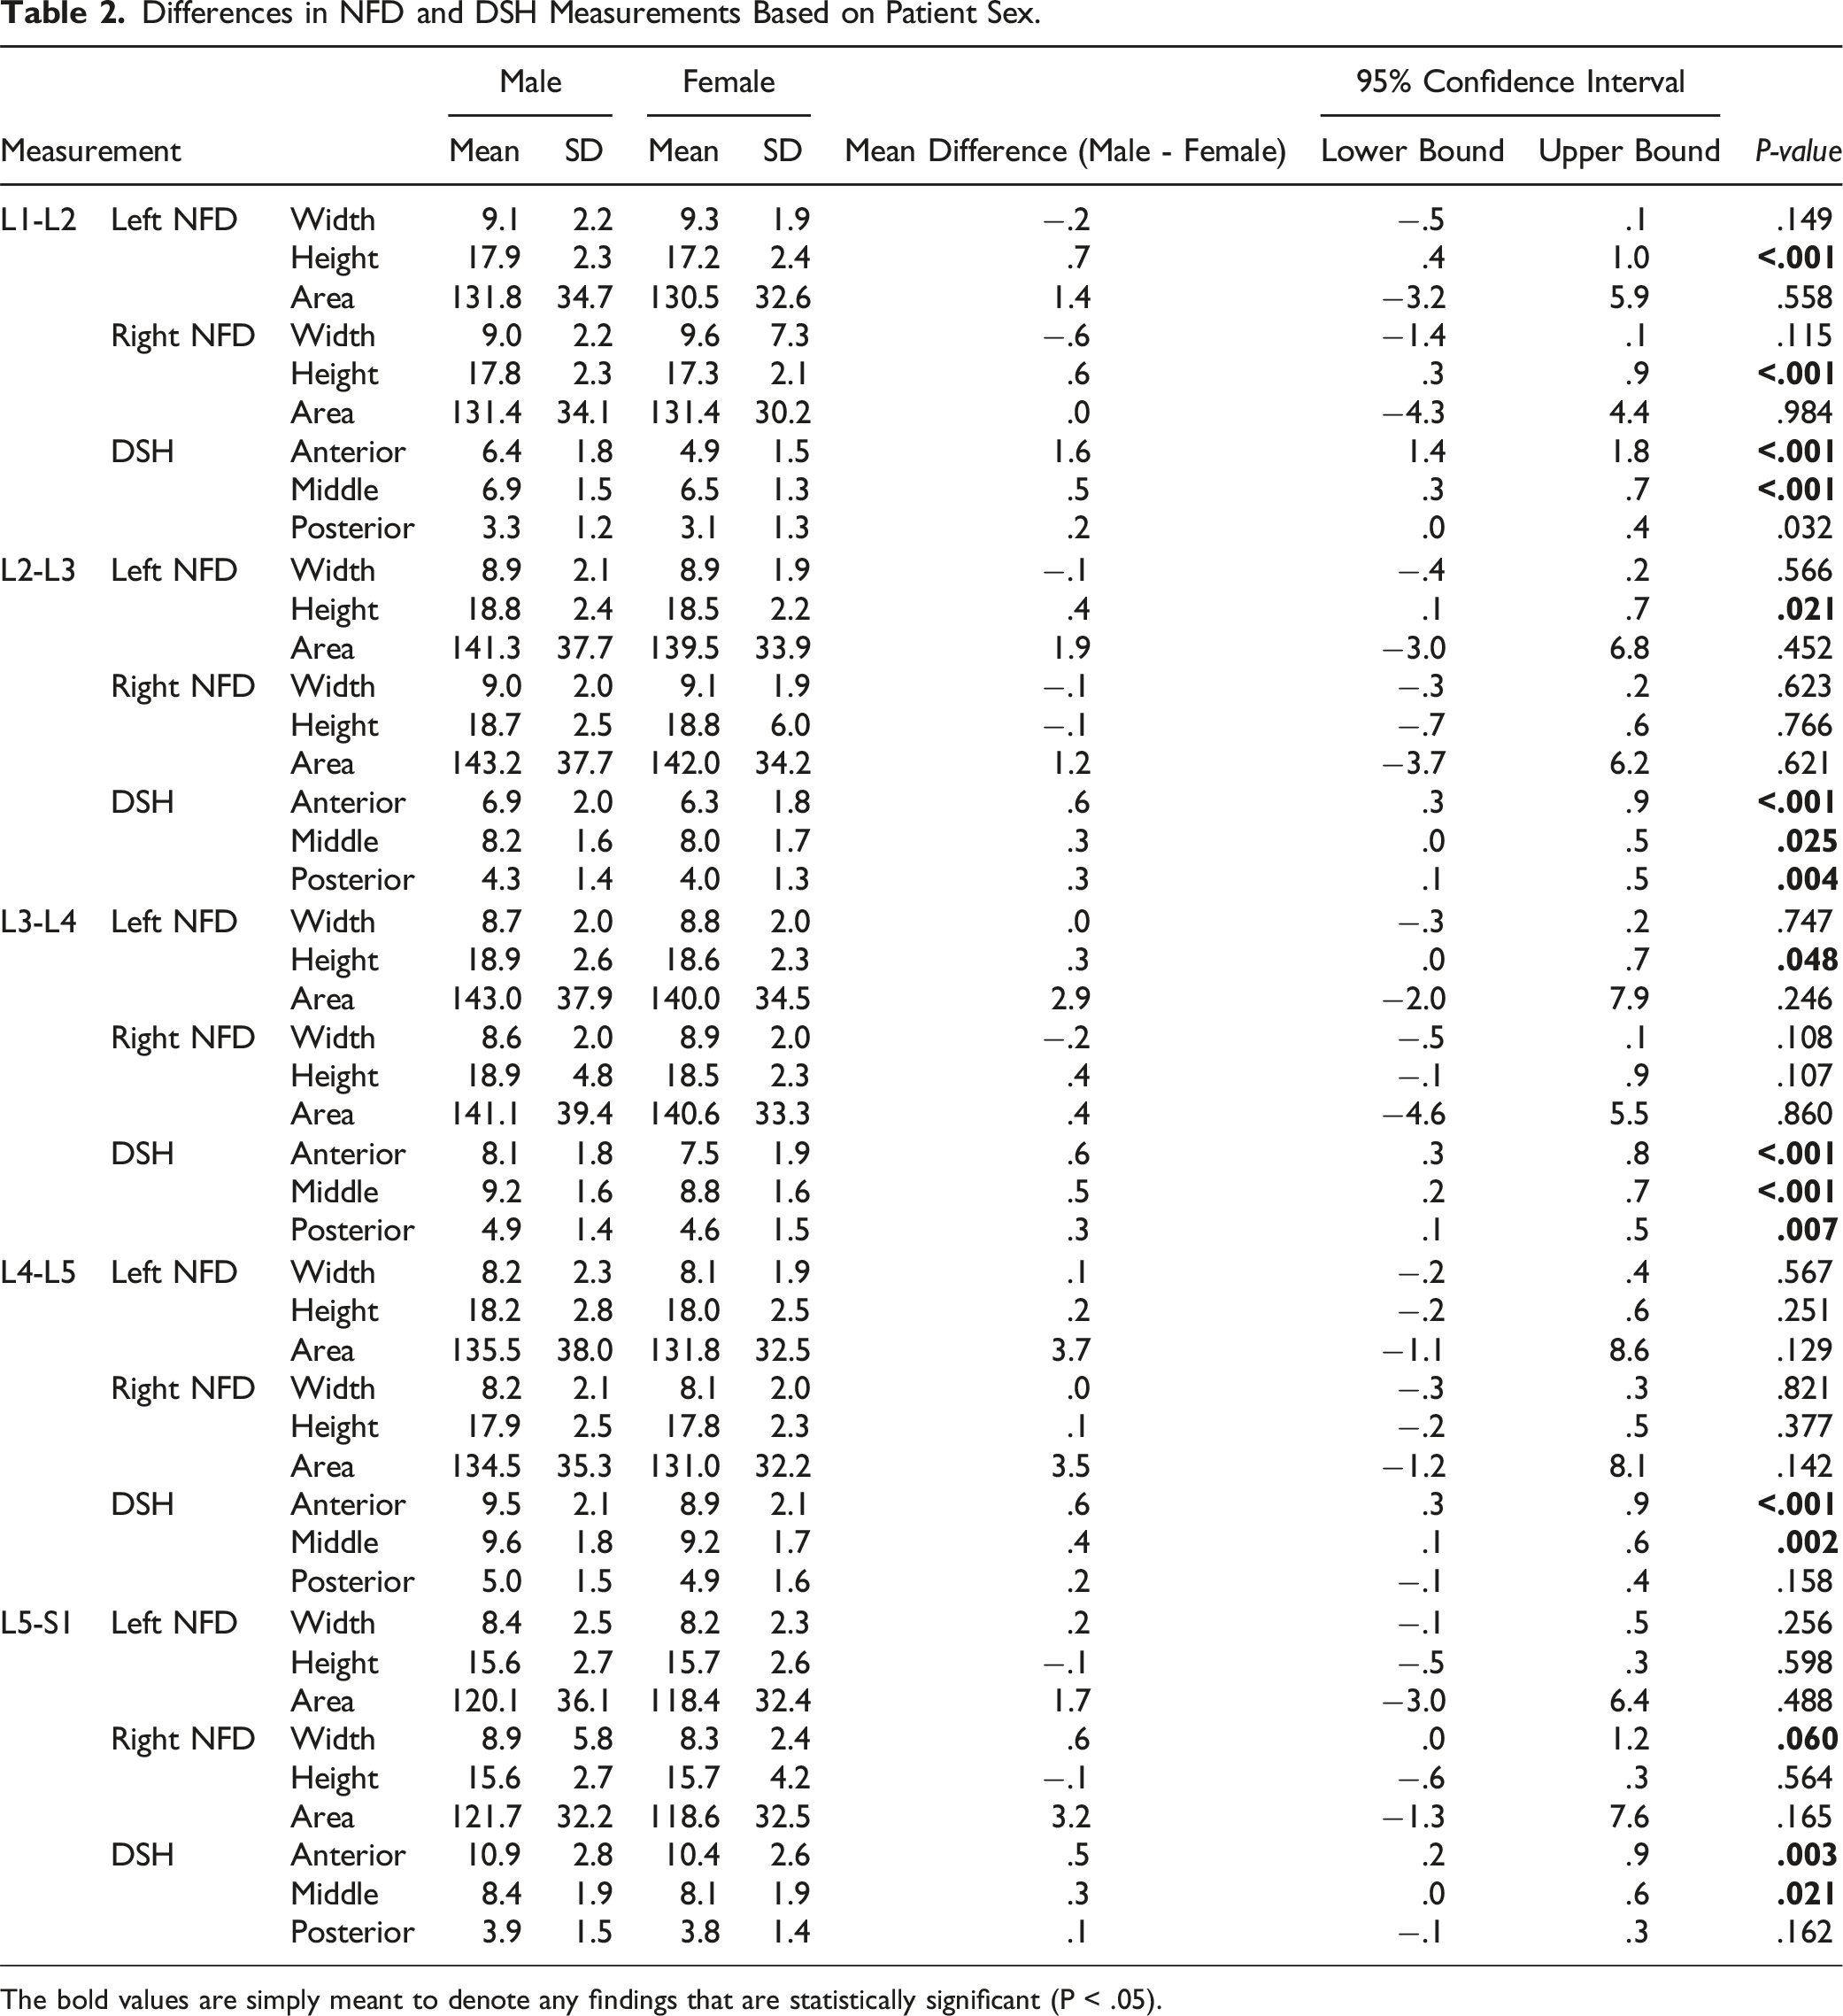
The bold values are simply meant to denote any findings that are statistically significant (P < .05).
Ethnic and Racial Differences
Differences in NFD and DSH Measurements Based on Patient Race and Ethnicity.
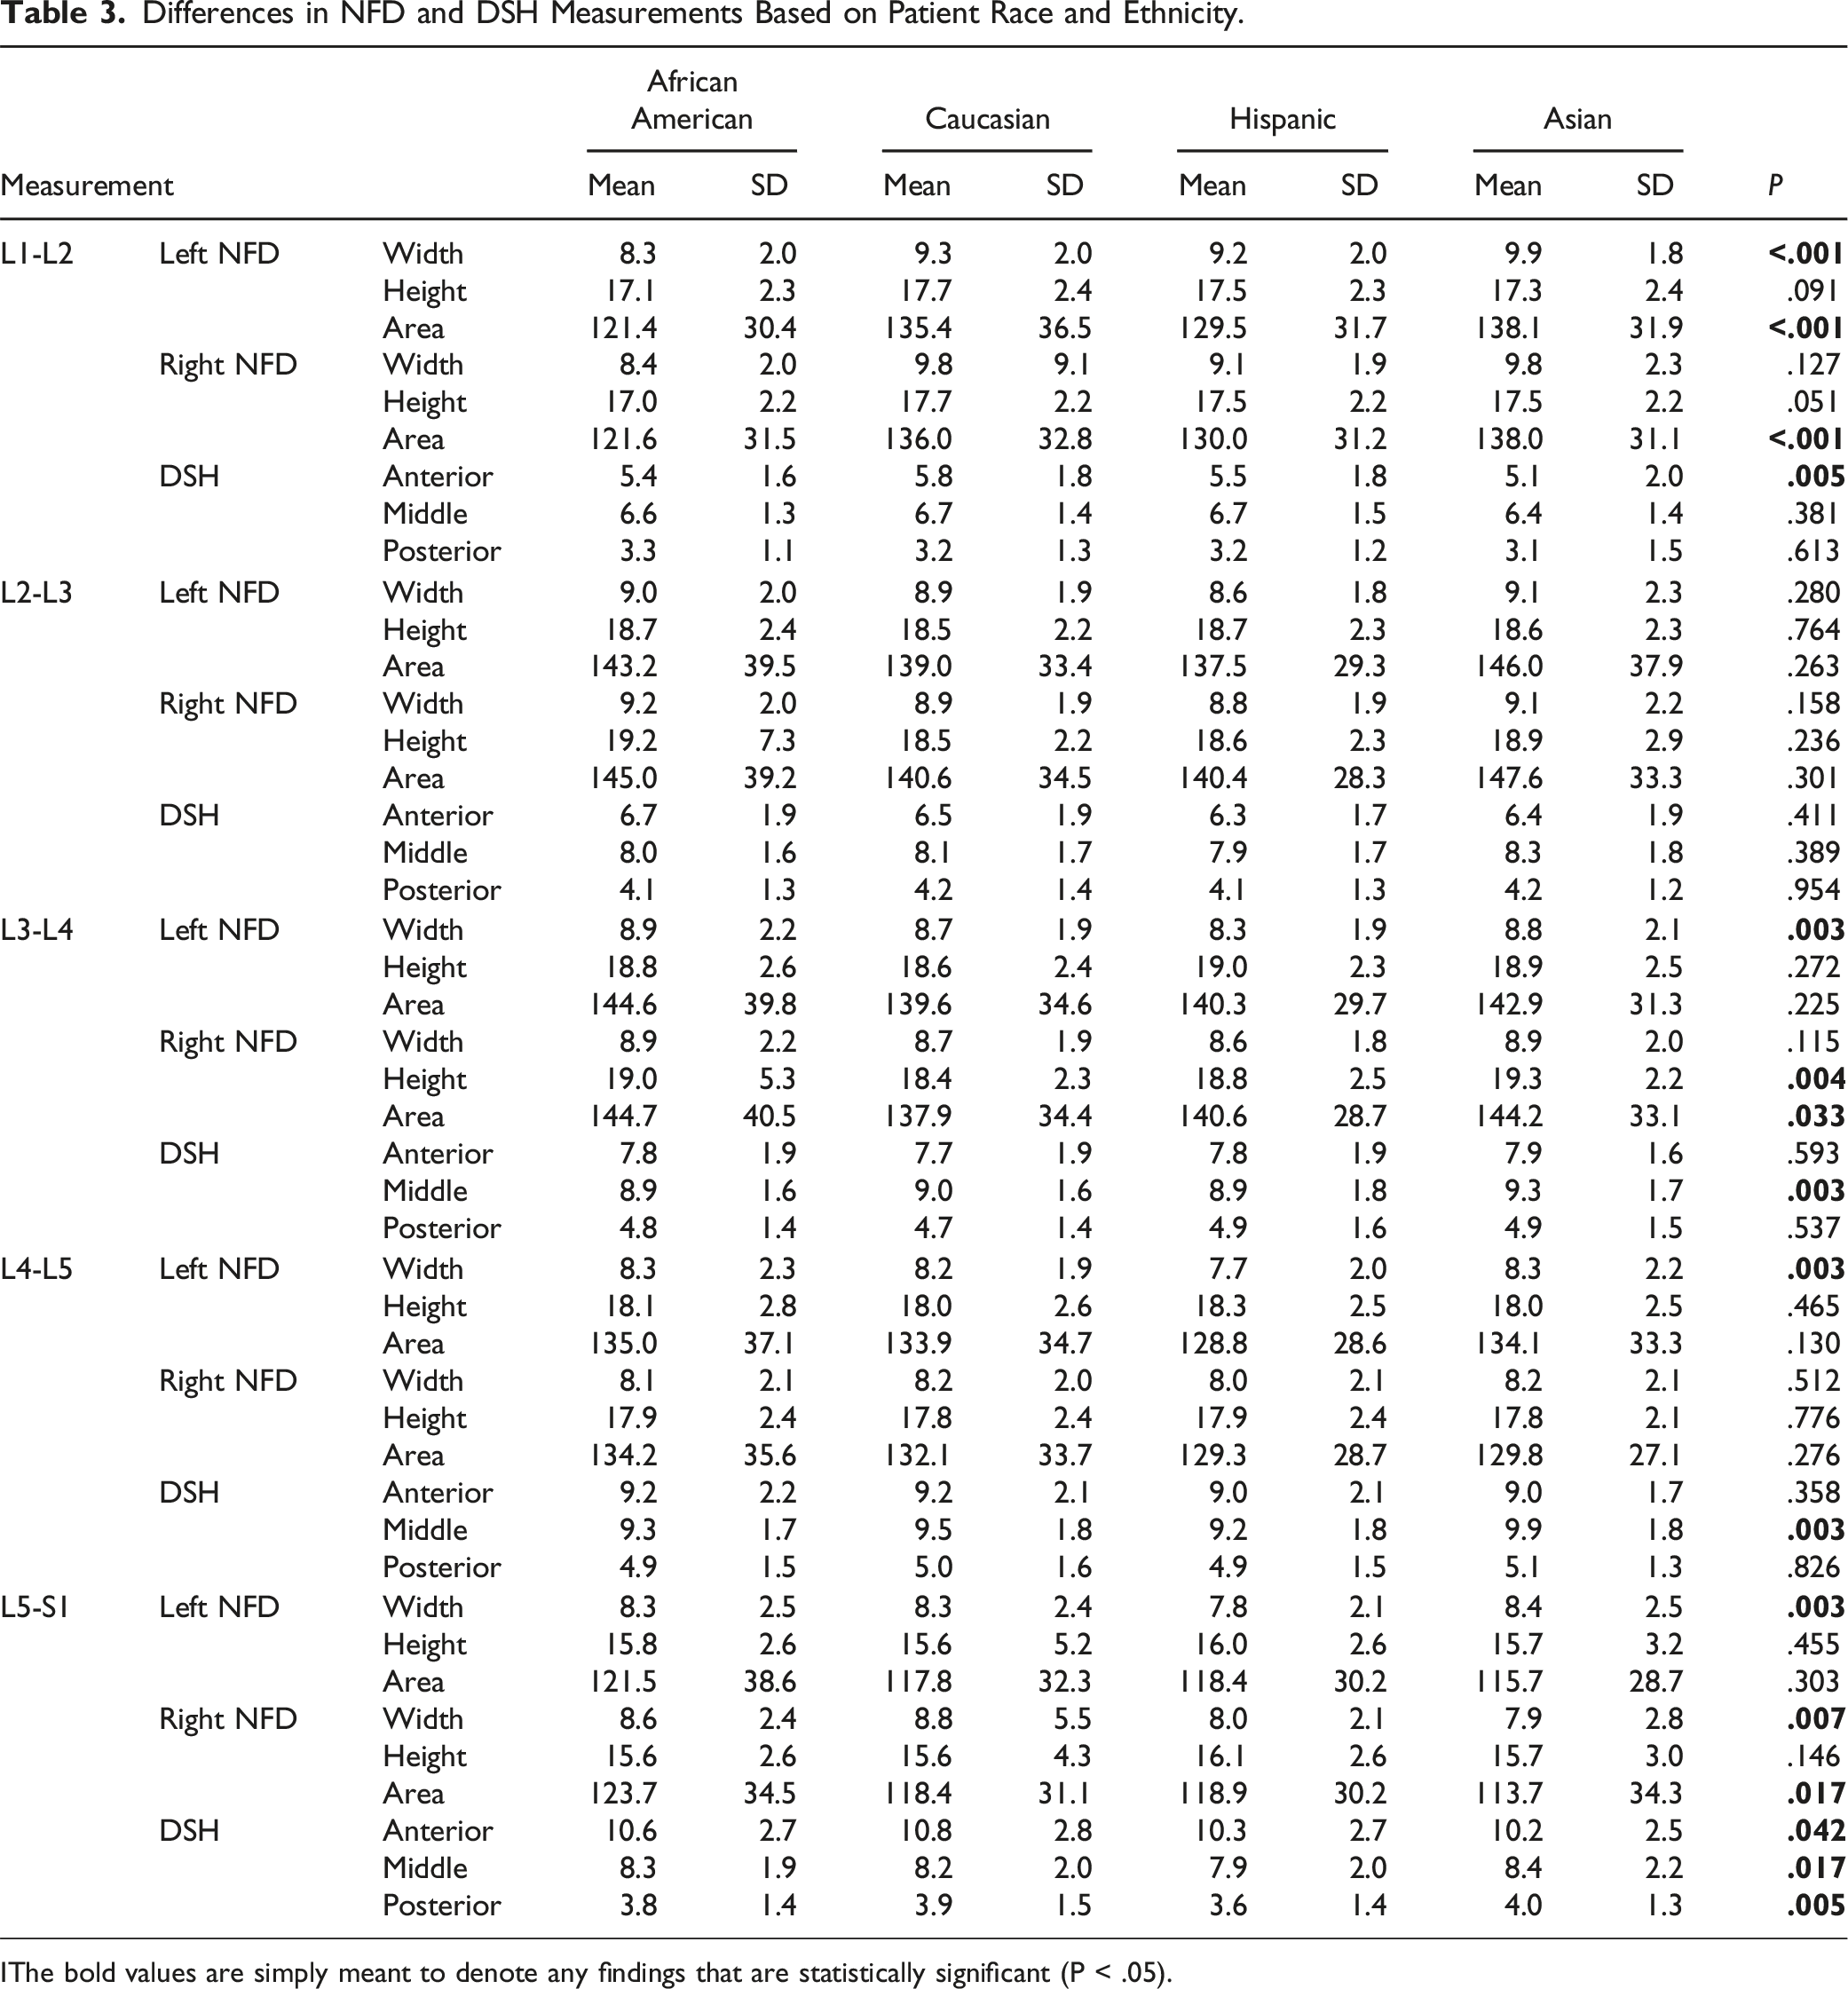
IThe bold values are simply meant to denote any findings that are statistically significant (P < .05).
Mean Differences in NFD and DSH Measurements Among African American, Caucasian, Hispanic, and Asian Cohorts.
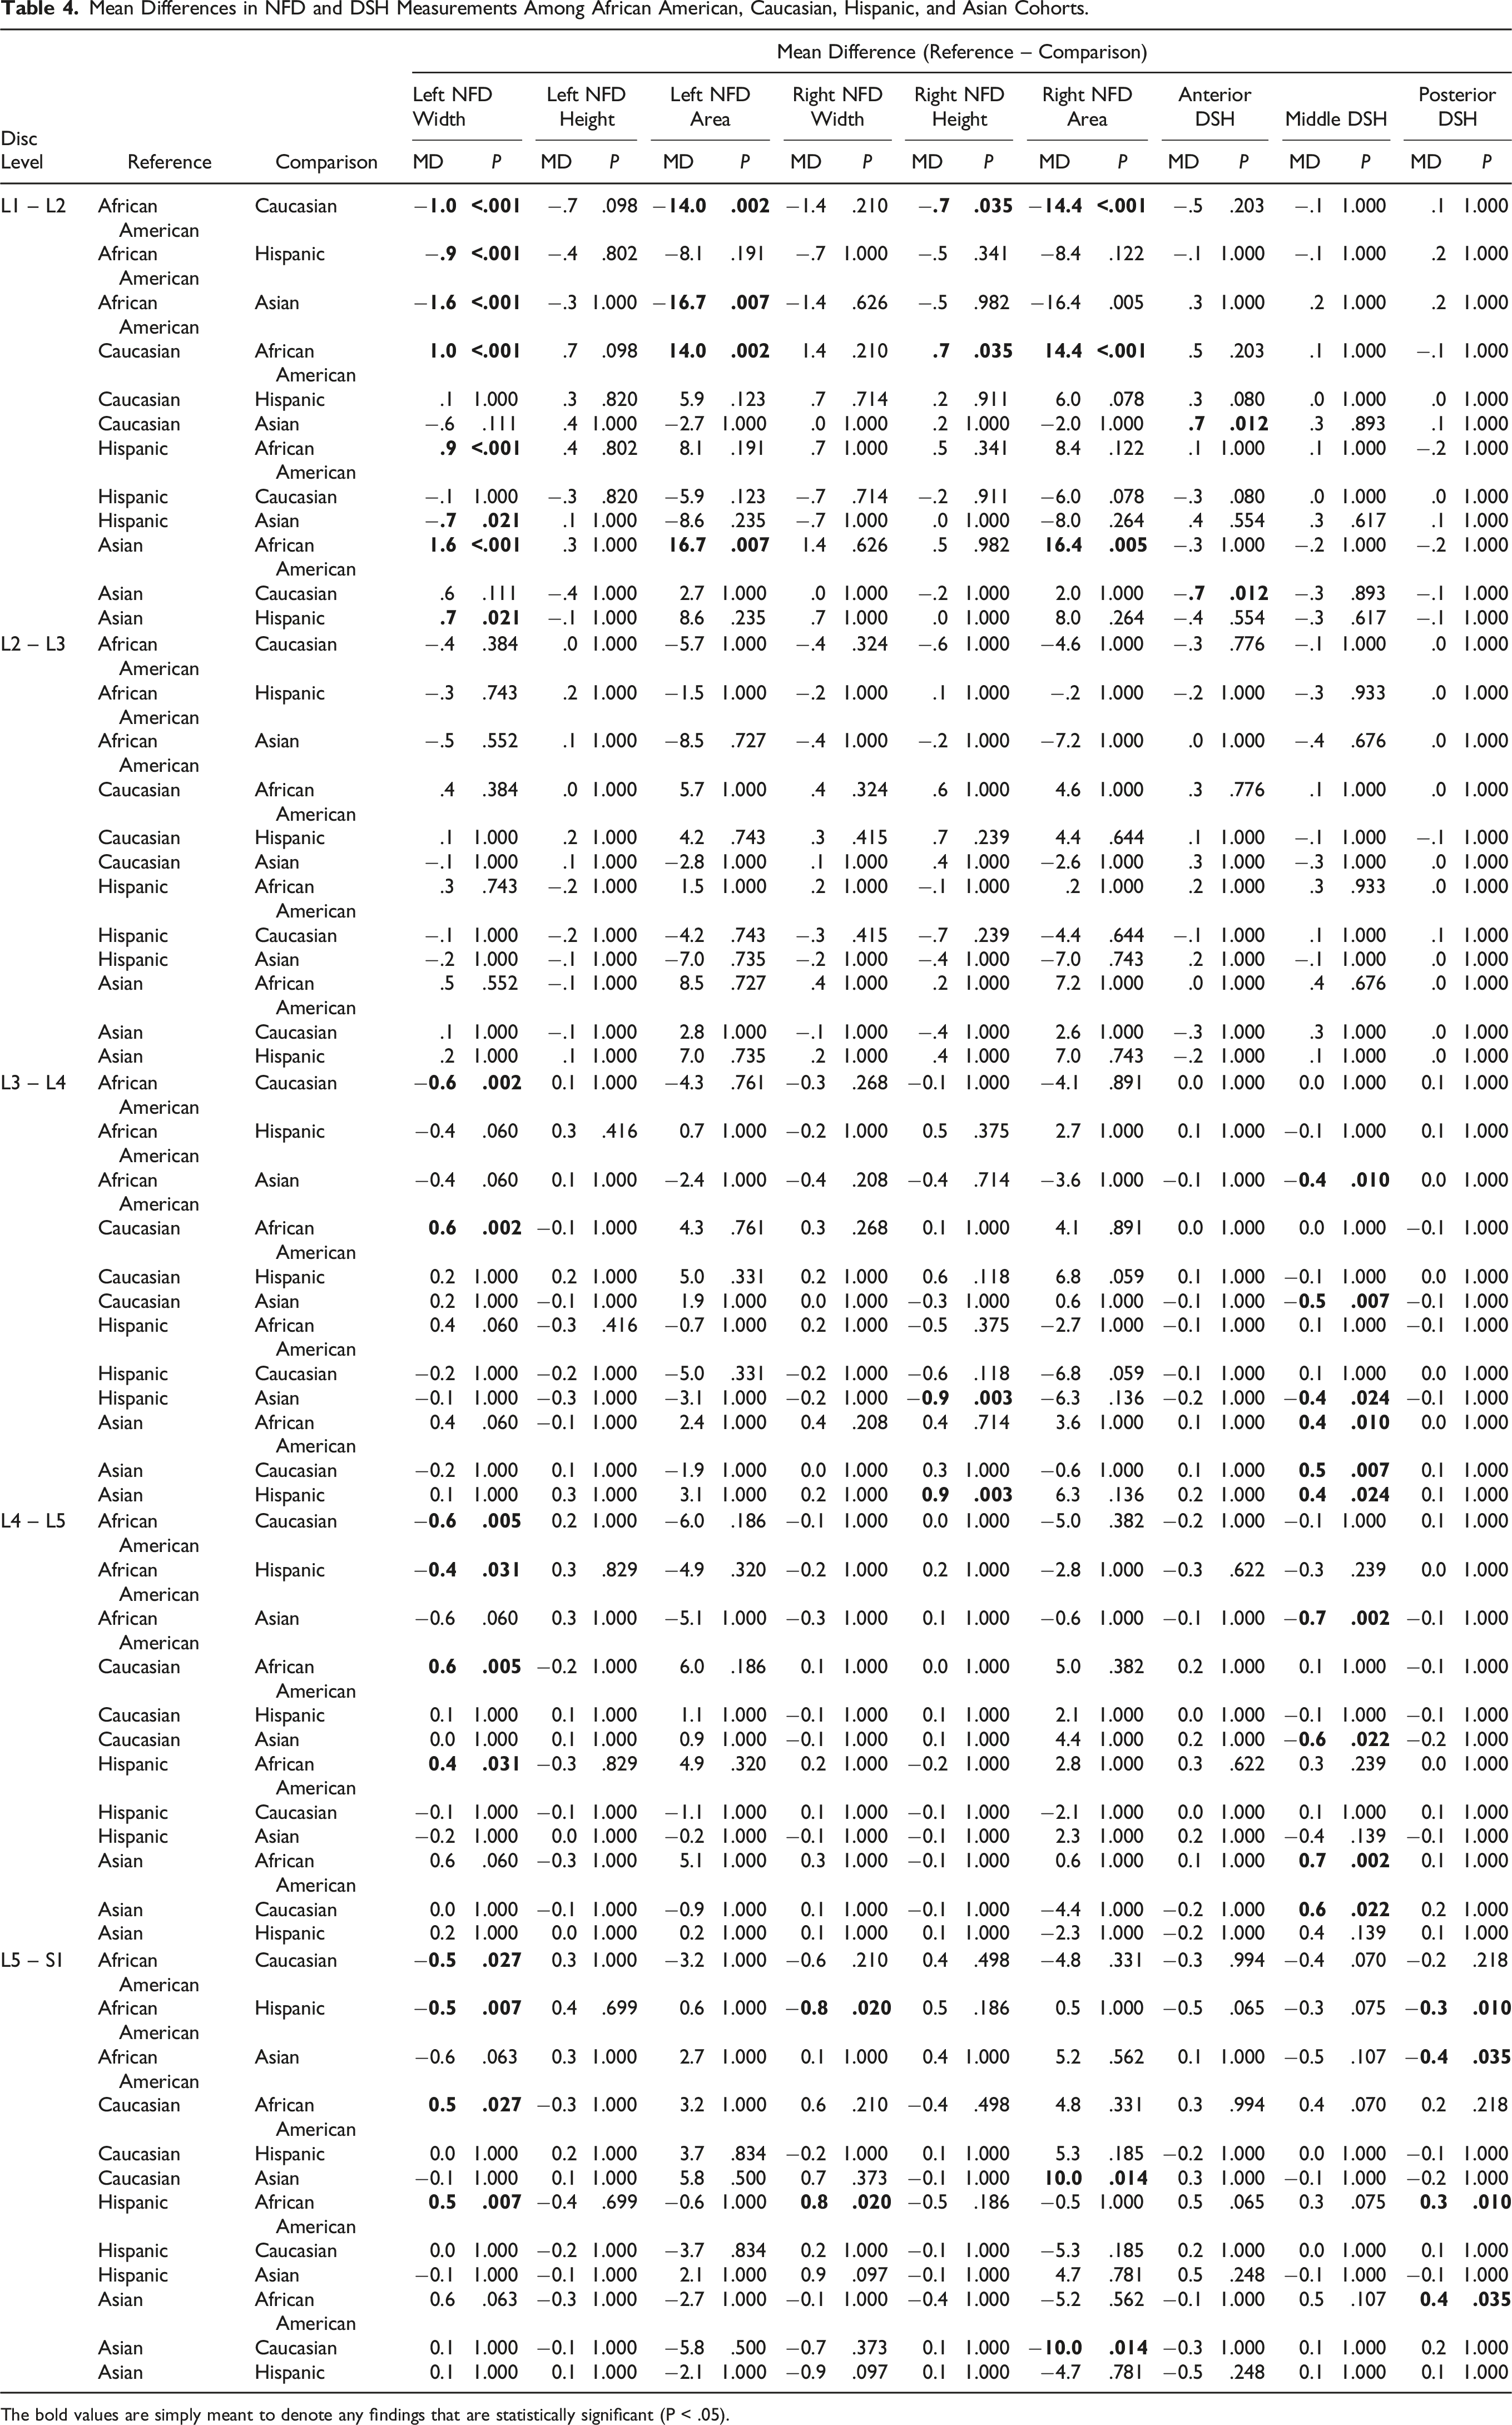
The bold values are simply meant to denote any findings that are statistically significant (P < .05).
Left vs Right Sides
Comparison of Left- Versus Right-Sided Lumbar NFD Measurements From L1-S1.
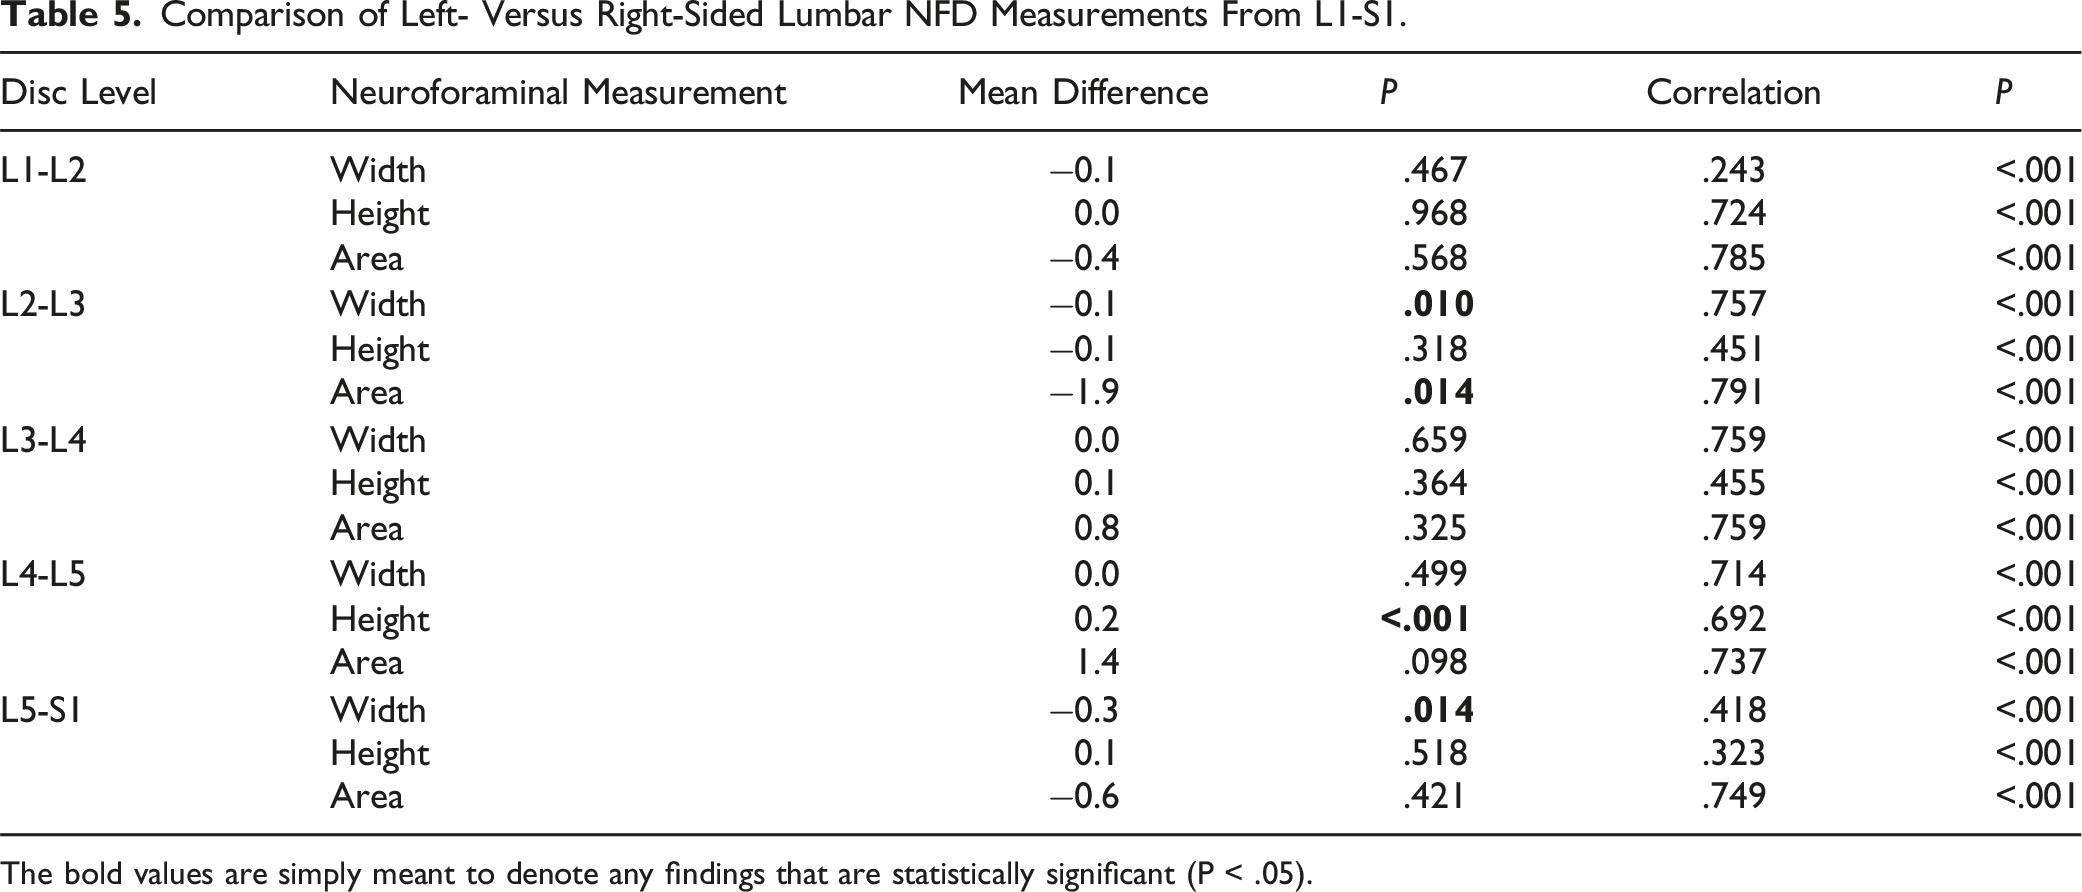
The bold values are simply meant to denote any findings that are statistically significant (P < .05).
Midsagittal Disc Space Height
Correlation Matrix Among Patient Anthropometric Factors and Lumbar NFD and DSH†.
Discussion
Data describing normal NFDs within the lumbar spine are sparse. Likewise, little research has gone into quantifying NFDs in patients with foraminal stenosis, forcing clinicians to rely on subjective criteria when assessing the patency of neuroforamina. Lee et al. put forth a grading scale for lumbar foraminal stenosis that is based on the degree of fat obliteration around the nerve. 16 However, that system is largely subjective in nature, as it relies on morphologic appearance rather than quantitative values. Harianja et al. recently described normal NFDs in 600 young, healthy patients. The current study provides a follow-up analysis using a substantially larger cohort of patients and may further aid in the creation of an objective grading system for lumbar NFS.
The present study utilized a subject population with several advantages over those of prior studies. Compared to the recent analysis by Harianja et al., African Americans and Asians comprised a greater proportion of the individuals included in this study. Thus, the subject population served to better reflect the diversity of the United States population and may lend in increasing the generalizability of the previous findings. Additionally, the subject population was expanded to include 1,000 individuals, representing a 67% increase in size when compared to the previous analysis by Harianja et al. 9 The number of patients included in our cohort exceeds that of other studies, as well. Both Senoo et al. and Cramer et al. conducted similar studies to ours, using imaging modalities to assess lumbar NFDs.17,18 However, their work was based on much smaller sample sizes. Senoo et al. studied 590 foramina in 59 patients, and Cramer et al. studied 950 foramina in 95 patients. In contrast, our study analyzed 10,000 foramina in 1,000 subjects, generating a total of 40,000 individual measurements (4 NFDs per foramen).
The present study used CT rather than MRI as the primary imaging modality. MRI is accepted by most as the gold standard for perioperative planning in spine surgery and has been the modality of choice in most studies describing lumbar NFDs up to now. The anatomic boundaries of the intervertebral foramen include the adjacent vertebral pedicles superiorly and inferiorly, the intervertebral disc anteriorly, and the ligamentum flavum and articular facets posteriorly. 3 Because two of these structures are non-bony, some have argued that CT is unable to fully account for pathology affecting the foramen, such as disc herniation or ligamentous hypertrophy. However, our study population consisted mostly of young healthy individuals, and thus these factors are less likely to play a confounding role. For our purposes, CT was useful in assessing the osseous anatomy of the foraminal boundaries, providing clear images with high contrast across a large number of patients. The use of CT also limited the possibility of images being distorted by poorly defined structures like perineural fat or ligaments, neither of which are detected by this modality.
Given that MRI is so widely used, it is worth noting that the measurements derived from the present study may be applicable to this imaging modality as well as to CT. When comparing baseline measurements of renal tumor size, Khan et al. found that there was no significant difference between patients receiving MRI and those receiving CT. 19 We therefore propose that the NFDs derived from this study may be applied to either imaging modality.
We did not find any significant associations between NFDs and patient height, weight, or BMI. These findings are inconsistent with those of Gaonkar et al. and Cramer et al., both of whom found a positive correlation between NFDs and patient height.18,20 While it is difficult to account for this discrepancy, both other studies included patient cohorts with notably different characteristics than ours, and that may have played a contributing role. The cohort analyzed by Cramer et al. included patients 14 to 84 years old, whereas the cohort analyzed in our study only included patients 18 to 35 years old. With this narrower age range, our cohort likely exhibited less variability with respect to anthropometric factors, and that may have led to the difference in findings.
Without differentiating between sides or disc levels, mean NFDs were 8.71 mm for sagittal anteroposterior width, 17.73 mm for craniocaudal height, and 133.26 mm2 for area (n = 10,000 measurements each). These values are very close to those reported in previous studies. Both Senoo et al. and Yan et al. described neuroforaminal height and width. Senoo et al. found a height and width of 17 and 6 mm, respectively, and Yan et al. found a height and width of 11 to 23 mm and 8 to 10 mm, respectively.17,21-23 In regard to neuroforaminal area, Stephens et al. found an area ranging from 40 to 160 mm2. 24 However, the study by Stephens et al. only included 25 subjects. The larger subject population used in our study allowed us to report a more generalizable neuroforaminal area.
With regard to sex, our study found that males demonstrated significantly larger craniocaudal measurements than females at the L1-L4 levels on the left side and at the L1-L2 level only on the right side (P < .05). Cramer et al. found similar differences between males and females but dismissed such findings as clinically insignificant on the basis of the differences all being less than .5 mm. 18 Smith et al. also found that there were no clinically significant differences between NFDs in males versus females. 25 Likewise, our study found sex differences of less than 1 mm, which are considered clinically unimportant.
To our knowledge, no previous studies aside from the study by Harianja et al. have analyzed differences in NFDs with regard to ethnicity. The prior analysis by Harianja et al. found that Asians and Caucasians tended to have larger NFDs than Hispanics and African Americans. 9 The present study detected a similar trend, with height being the only exception. For height, Caucasians and Hispanics exhibited the largest measurements, followed by Asians and African Americans. This novel finding may be due to the difference in study populations included in the previous and current studies. The study population utilized in the present study contained higher proportions of both Asians and African Americans, in addition to having 400 more patients.
Our study found significant differences in NFDs between the left and right sides at L2-L3, L4-L5, and L5-S1 (P = .010, P < .001, and P = .014). But according to the criteria put forth by Cramer et al., these differences were deemed clinically unimportant. Similarly, Cramer et al. did not find any differences in NFDs between the left and right sides that were of clinical importance. 18 On the basis of this, they argued that it is reasonable to assume that opposite-sided foramina at the same level are roughly equal when diagnosing stenosis. Nevertheless, such assumptions should be made with caution, as our results suggest that dimensions on both sides are not always closely approximated to one another.
There are several important limitations to acknowledge in the current study. First, it is important to recognize that there is a lack of substantial scientific evidence supporting a direct association between symptomatology and measurements obtained from spinal imaging.25,26 Consequently, there exists a potential uncertainty regarding the utility of the measurements from this study in guiding clinical judgment. Second, our study needs to be interpreted in proper context, namely, that it focuses on establishing normative bony foramina. Hence, the findings are limited in certain clinical settings given that symptomatic compression of the nerve often arises due to discoligamentous factors. 27 Third, our imaging data were exclusively collected from individuals in the supine position. It is well-documented that body posture can influence NFDs, and had the imaging been conducted in an upright, weight-bearing position where the spine experiences axial loading, the CT measurements may have varied. Future investigations should consider this limitation and analyze NFDs across a range of body positions, including those involving increased axial loading conditions.
Lastly, it’s worth noting that the current study does not encompass symptomatic patients. Our research group intends to expand on this work by studying individuals over 35 years of age who exhibit symptoms such as back pain or radicular symptoms. This effort will aim to establish objective parameters for diagnosing NFS.
Conclusion
Overall (without differentiating between sides or disc levels), NFDs averaged 8.71 mm for sagittal anteroposterior width, 17.73 mm for craniocaudal height, and 133.26 mm2 for area (n = 10,000 measurements each). In comparing NFDs with respect to sex, males demonstrated larger heights at multiple levels on the left side and at one level on the right side. In comparing NFDs with respect to ethnicity, Asians and Caucasians tended to have larger NFDs than Hispanics and African Americans, with height being the only exception.
Supplemental Material
Supplemental Material - Anatomic Assessment of L1-S1 Neuroforaminal Dimensions Using Computed Tomography in 1,000 Patients: A Follow-Up Study
Supplemental Material for Anatomic Assessment of L1-S1 Neuroforaminal Dimensions Using Computed Tomography in 1000 Patients: A Follow-Up Study by Kai Nguyen, Jacob Razzouk, Zachary Brandt, Patricia Carlson, Ethan Vyhmeister, Alex Bouterse, Nathaniel Wycliffe, Wayne Cheng, and Olumide Danisa in Global Spine Journal.
Footnotes
Declaration of Conflicting Interests
The author(s) declared no potential conflicts of interest with respect to the research, authorship, and/or publication of this article.
Funding
The author(s) received no financial support for the research, authorship, and/or publication of this article.
Supplemental Material
Supplemental material for this article is available online.
References
Supplementary Material
Please find the following supplemental material available below.
For Open Access articles published under a Creative Commons License, all supplemental material carries the same license as the article it is associated with.
For non-Open Access articles published, all supplemental material carries a non-exclusive license, and permission requests for re-use of supplemental material or any part of supplemental material shall be sent directly to the copyright owner as specified in the copyright notice associated with the article.