
Abstract
Study Design
Retrospective Cohort Study.
Objectives
This study aimed to develop survival prediction models for spinal Ewing’s sarcoma (EWS) based on machine learning (ML).
Methods
We extracted the SEER registry’s clinical data of EWS diagnosed between 1975 and 2016. Three feature selection methods extracted clinical features. Four ML algorithms (Cox, random survival forest (RSF), CoxBoost, DeepCox) were trained to predict the overall survival (OS) and cancer-specific survival (CSS) of spinal EWS. The concordance index (C-index), integrated Brier score (IBS) and mean area under the curves (AUC) were used to assess the prediction performance of different ML models. The top initial ML models with best performance from each evaluation index (C-index, IBS and mean AUC) were finally stacked to ensemble models which were compared with the traditional TNM stage model by 3-/5-/10-year Receiver Operating Characteristic (ROC) curves and Decision Curve Analysis (DCA).
Results
A total of 741 patients with spinal EWS were identified. C-index, IBS and mean AUC for the final ensemble ML model in predicting OS were .693/0.158/0.829 during independent testing, while .719/0.171/0.819 in predicting CSS. The ensemble ML model also achieved an AUC of .705/0.747/0.851 for predicting 3-/5-/10-year OS during independent testing, while .734/0.779/0.830 for predicting 3-/5-/10-year CSS, both of which outperformed the traditional TNM stage. DCA curves also showed the advantages of the ensemble models over the traditional TNM stage.
Conclusion
ML was an effective and promising technique in predicting survival of spinal EWS, and the ensemble models were superior to the traditional TNM stage model.
Introduction
Malignant primary bone tumors are rare diseases, 1 and the spine is a typical region that may be tricky for Surgery because of the surrounding vessels and nerves. These tumors are highly aggressive with an unfavorable prognosis, of which spinal Ewing’s sarcoma (EWS) presents a great challenge for clinicians. 2 Malignant spinal cord compression may cause neurological disability (up to 5% of all patients with cancer), an important and dangerous complication for patients with spinal EWS. 3 Local management strategies generally include palliative radiotherapy or posterior surgical decompression with or without instrumentation or total en bloc spondylectomy. Thus, clinicians must choose the appropriate treatment to maximize the patient's survival. Therefore, accurate prediction of patient survival outcome is of great significance for treating and understanding the disease. Usually, clinicians may adopt proportional hazard models to estimate the survival of cancer patients. 4 However, these models rely on linearity assumptions and fail to integrate the non-linear features, which is more common in a real-life setting. 5
Recently, machine learning (ML) has been increasingly popular in survival prediction 6 because of its powerful capacity to integrate the features with non-linear relationships. Several ML algorithms have been adopted to predict the survival of cancer patients, and their prediction accuracy was encouraging. 7 Therefore, ML-based prediction models are expected to accurately predict the prognosis of rare diseases like spinal Ewing’s sarcoma. However, there is no ML-based model for spinal Ewing’s sarcoma survival prediction. The study aims to develop survival prediction models for spinal Ewing’s sarcoma based on common ML algorithms.
Methods
Sources of Databases
The Surveillance, Epidemiology and End Results (SEER) Program of the National Cancer Institute (NCI) is authoritative information on cancer incidence and survival in the United States. Currently, the program collects and publishes cancer incidence and survival data from population-based cancer registries covering approximately 34.6 percent of the U.S. population. The database contains basic information (age, race, gender, etc.), the diagnosis and treatment of the tumor (tumor size, grade, surgery, etc.) and other information (marital status, insurance, etc). Ethical approval was not required for this study because the SEER database is free of any sensitive patient information or identifiers.
Study Criteria
For the purposes of this analysis, we selected the research data from 1975-2016. Based on the International Classification of Disease for Oncology, version 3(ICD-O-3), we searched the SEER database to identify all registered cases of Ewing’s sarcoma (ICD-O-3 code 9260). At the same time, the primary site of the tumor was set in the vertebral column (ICD-O-3 code 412) and pelvis (ICD-O-3 code 414). This study followed the Strengthening the Reporting of Observational Studies in Epidemiology (STROBE) reporting guideline.
Data Preprocessing
All potential features of patients (including marital status, race, gender, age, overall survival status, cancer-specific survival status, survival time, tumor size, tumor extension, lymph metastasis, distant metastasis, the surgery type, and tumor grade etc.) were selected for further analyses. The primary outcome of interest was overall survival (OS) and cancer-specific survival (CSS). Only cases that have been histologically confirmed and active follow-up were included in our study. Cases with SEER cause-specific death classification for patients in “missing/unknown COD” or “N/A not first tumor” were also excluded.
Surgery of primary site is coded according to the SEER Program Code Manual using source documents. Our study’s subsequent surgical procedures were separated into 6 categories: Amputation; Biopsy; Local excision; No Surgery; Radical excision and Surgery, NOS. Radiotherapy was reclassified as yes and none/unknown. Reason no cancer-directed Surgery (Cancer directed Surgery) was reclassified as Surgery performed and Not performed. Marital status was reclassified as yes and no. Insurance was reclassified as yes and no.
Different methods of imputation processed missing data according to the variable type of features. Predictive mean matching, logistic regression and polynomial regression were used for continuous, binary and categorical features. 8 Predictive mean matching is a semi-parametric method which restricts the imputations to the observed values. Logistic regression and polynomial regression are the default methods for missing value imputation of binary and categorical features in “mice” package in R language, which is a general purpose package for multivariate imputation in ML tasks.
Feature Selection and Training
All included data went through 3 feature selection methods, namely Cox, random survival forest (RSF) and CoxBoost. For Cox feature selection, a univariate Cox regression and then a multivariate Cox regression performed to assess the factors associated with survival. P values <.05 were retained for following algorithms developed. Magnitude of statistical significance was expressed with hazard ratios (HR) and 95% confidence intervals (CI). For RSF, we implemented a feature-importance ranking algorithm based on random survival forest model to output the significant features. For CoxBoost, we developed a likelihood-based boosting model to output the variables whose P value < .05 to estimate the associated features of survival.
We split the data into training and testing sets (training: testing = 9: 1), and all training data went through 5-fold cross-validation. Four ML algorithms (Cox, RSF, CoxBoost, DeepCox) were trained to predict the overall survival (OS) and cancer-specific survival (CSS) of spinal Ewing’s sarcoma. The Cox model is a semi-parametric model for survival analysis. It measures the impact of the covariates and assumes that the log-hazard of every patient is a linear combination of the patient's features. 9 RSF is a popular non-linear ML model for survival analysis. 10 By tree structures based on random forests, it can generate ensemble estimates for the cumulative hazard function. CoxBoost is a semi-parametric survival model which is designed to handle high-dimensional datasets by fitting the Cox models with likelihood-based boosting for a single endpoint or competing risks. 11 DeepSurv is a multi-layer perception-feed forward network whose output layer is a Cox regression, predicting a patient’s risk of death and parameterized by the weights of the network.
The concordance index (C-index), integrated Brier score (IBS) and mean area under the curves (AUC) were used to assess the prediction performance of different ML initial models. C-index can be interpreted as the concordance probability between the observed and the predicted survival. Higher C-index indicates better performance of the prediction model. IBS is also known as prediction error rate, and lower IBS indicates better prediction performance. Mean AUC defines as the integral of the time-dependent AUC curves over the survival time (T) divided by the interval of the integral.
The top ML initial models with best performance from each evaluation index (C-index, IBS and mean AUC) during independent testing were selected and further stacked as the final ensemble model, which was compared with the traditional TNM stage model by 3-/5-/10-year Receiver Operating Characteristic (ROC) curves and Decision Curve Analysis (DCA). Codes about the ensemble model were available from https://github.com/Huatsing-Lau/Spinal-EWS-Surv. All data processing was conducted on Python (version 3.6). Two-tailed P values of <.05 were considered significant.
Results
Patient Demographics
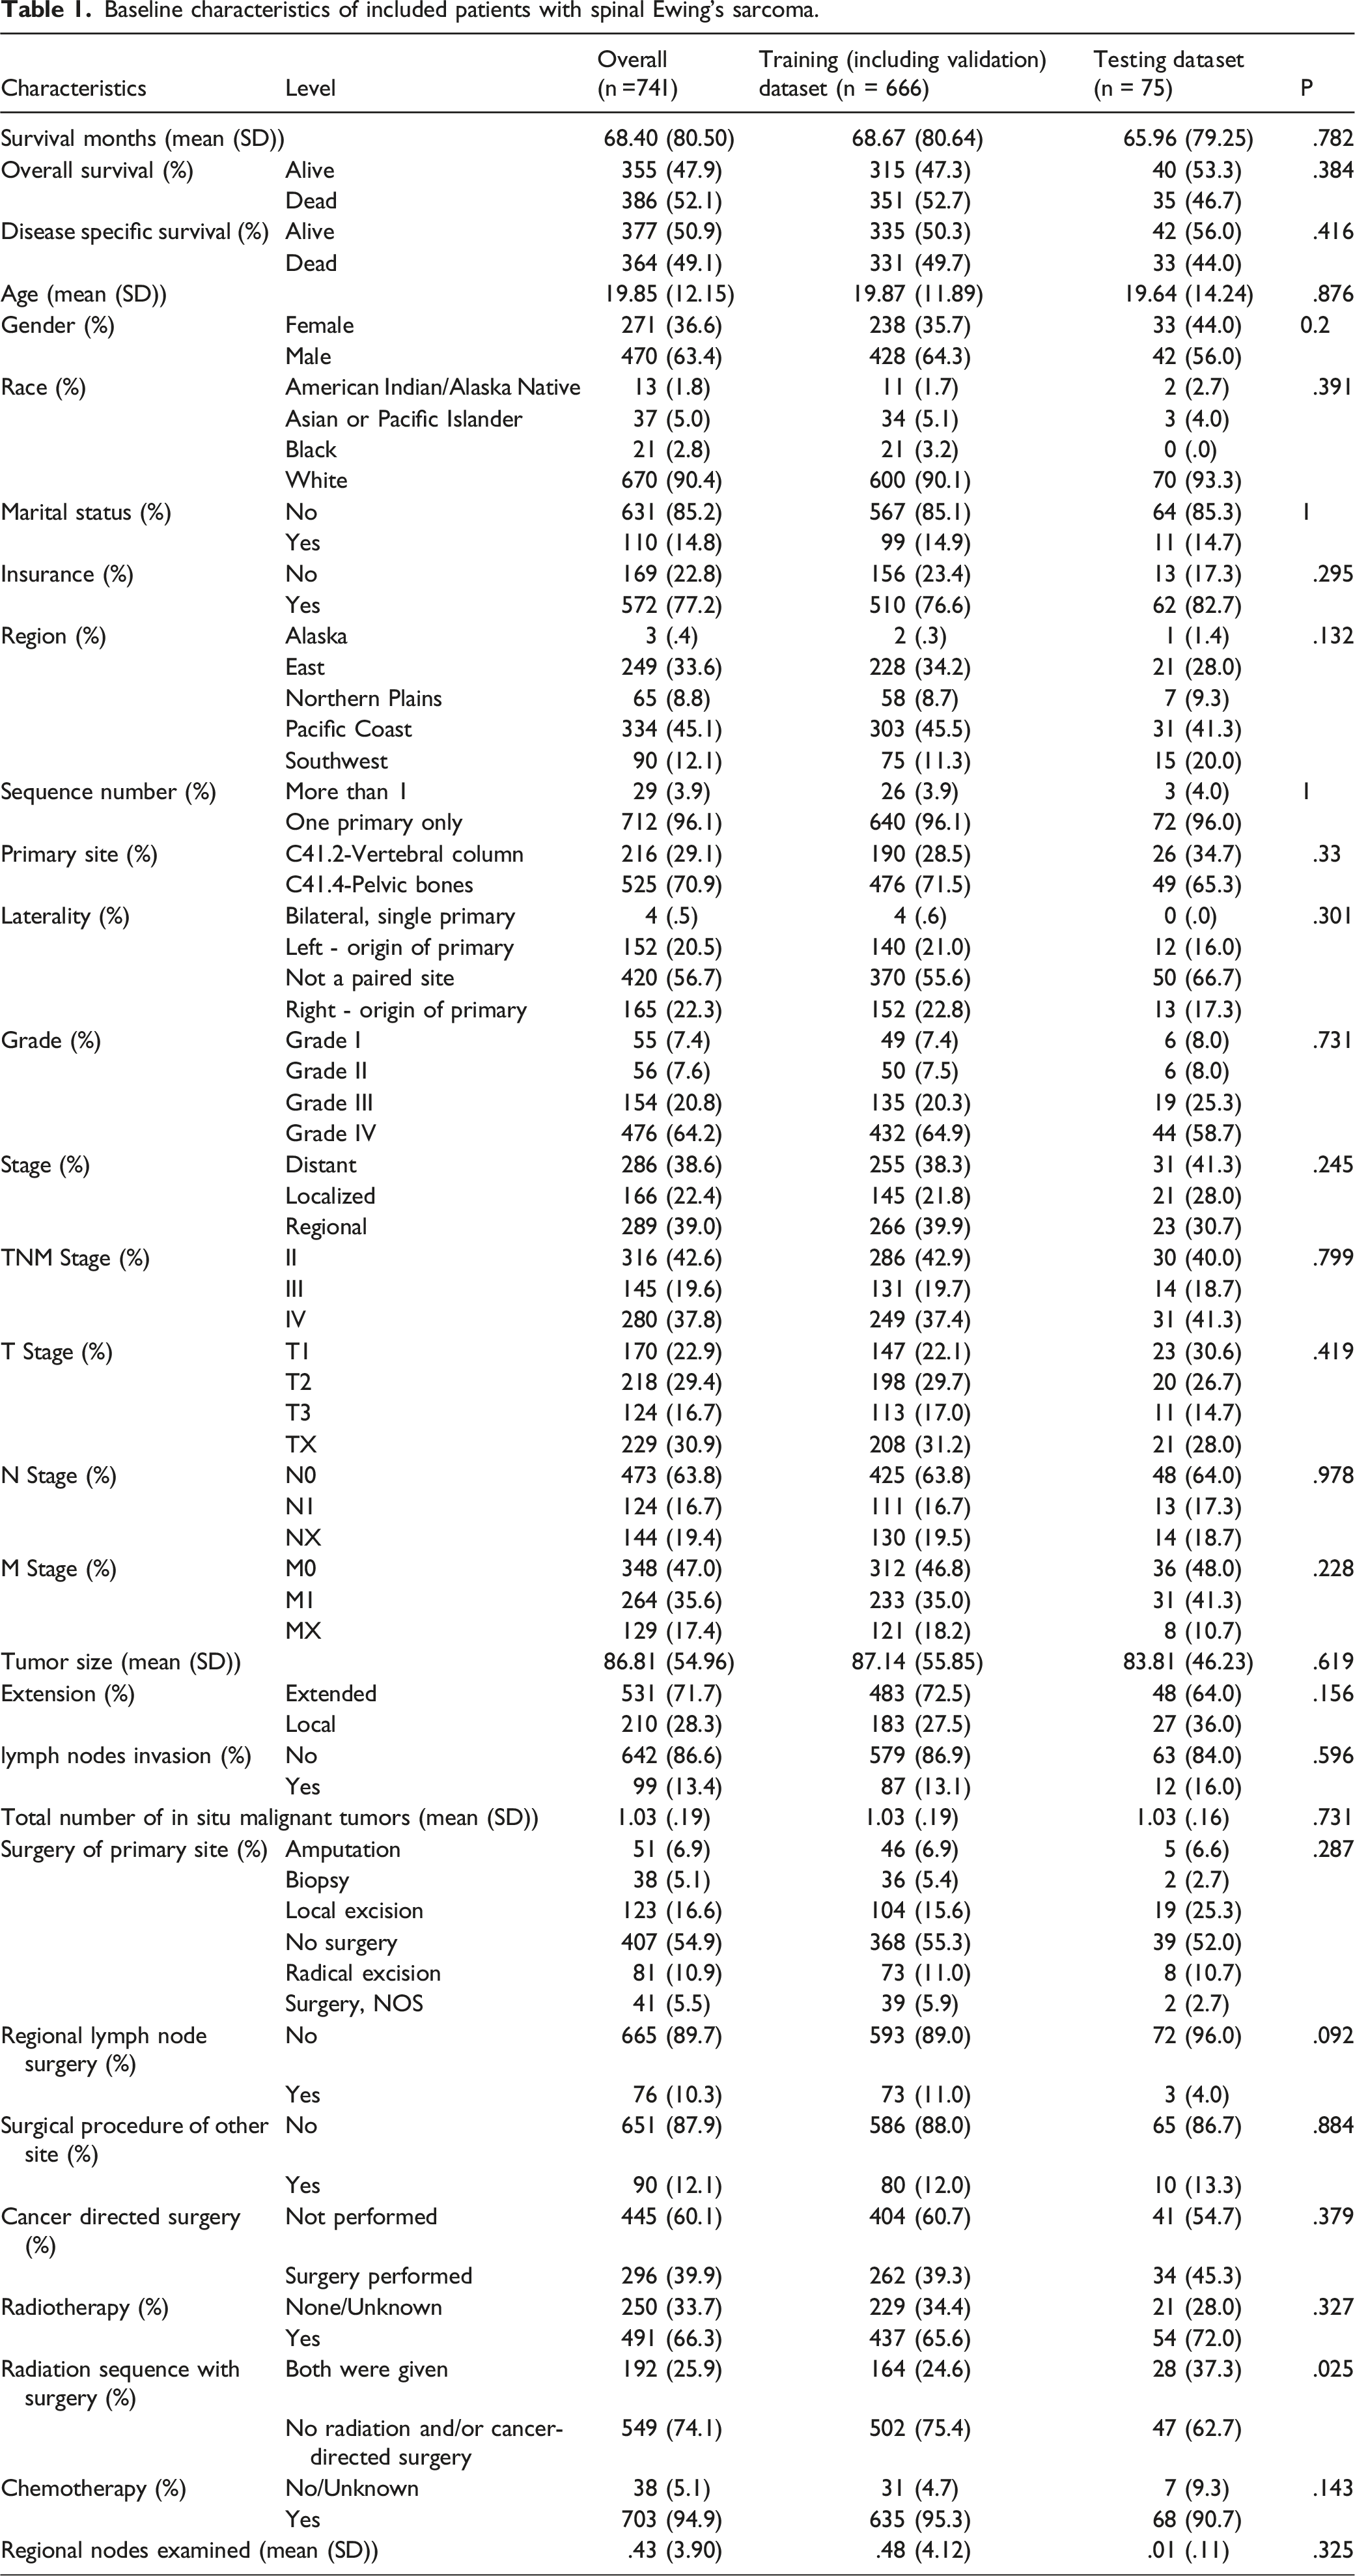
In total, 741 patients with spinal Ewing’s sarcoma were identified. Workflow of data selecting was delineated in Figure 1. The average age of patients was 19.85±12.15 (SD) years, 470 (63.4%) were male, and the majority of patients (85.3%) were unmarried. The stage of cancers was localized (n = 156, 21.1%), regional (n = 297, 40.1%), and distant (n = 288, 38.9%). The survival months was 68.40±80.50 (SD) months, and 355 (47.9%) patients were still alive at the last follow-up time for OS while 377(50.9%) for CSS (Table 1). There were missing data in several variables including race, marital status, insurance, laterality, grade, stage, TNM stage, T stage, N stage, M stage, tumor size, extension, lymph nodes invasion, surgery of primary site, etc. The percentage of missing values were shown in Supplementary table 1, range from 0 to 76.4%. Workflow of the study. Baseline characteristics of included patients with spinal Ewing’s sarcoma.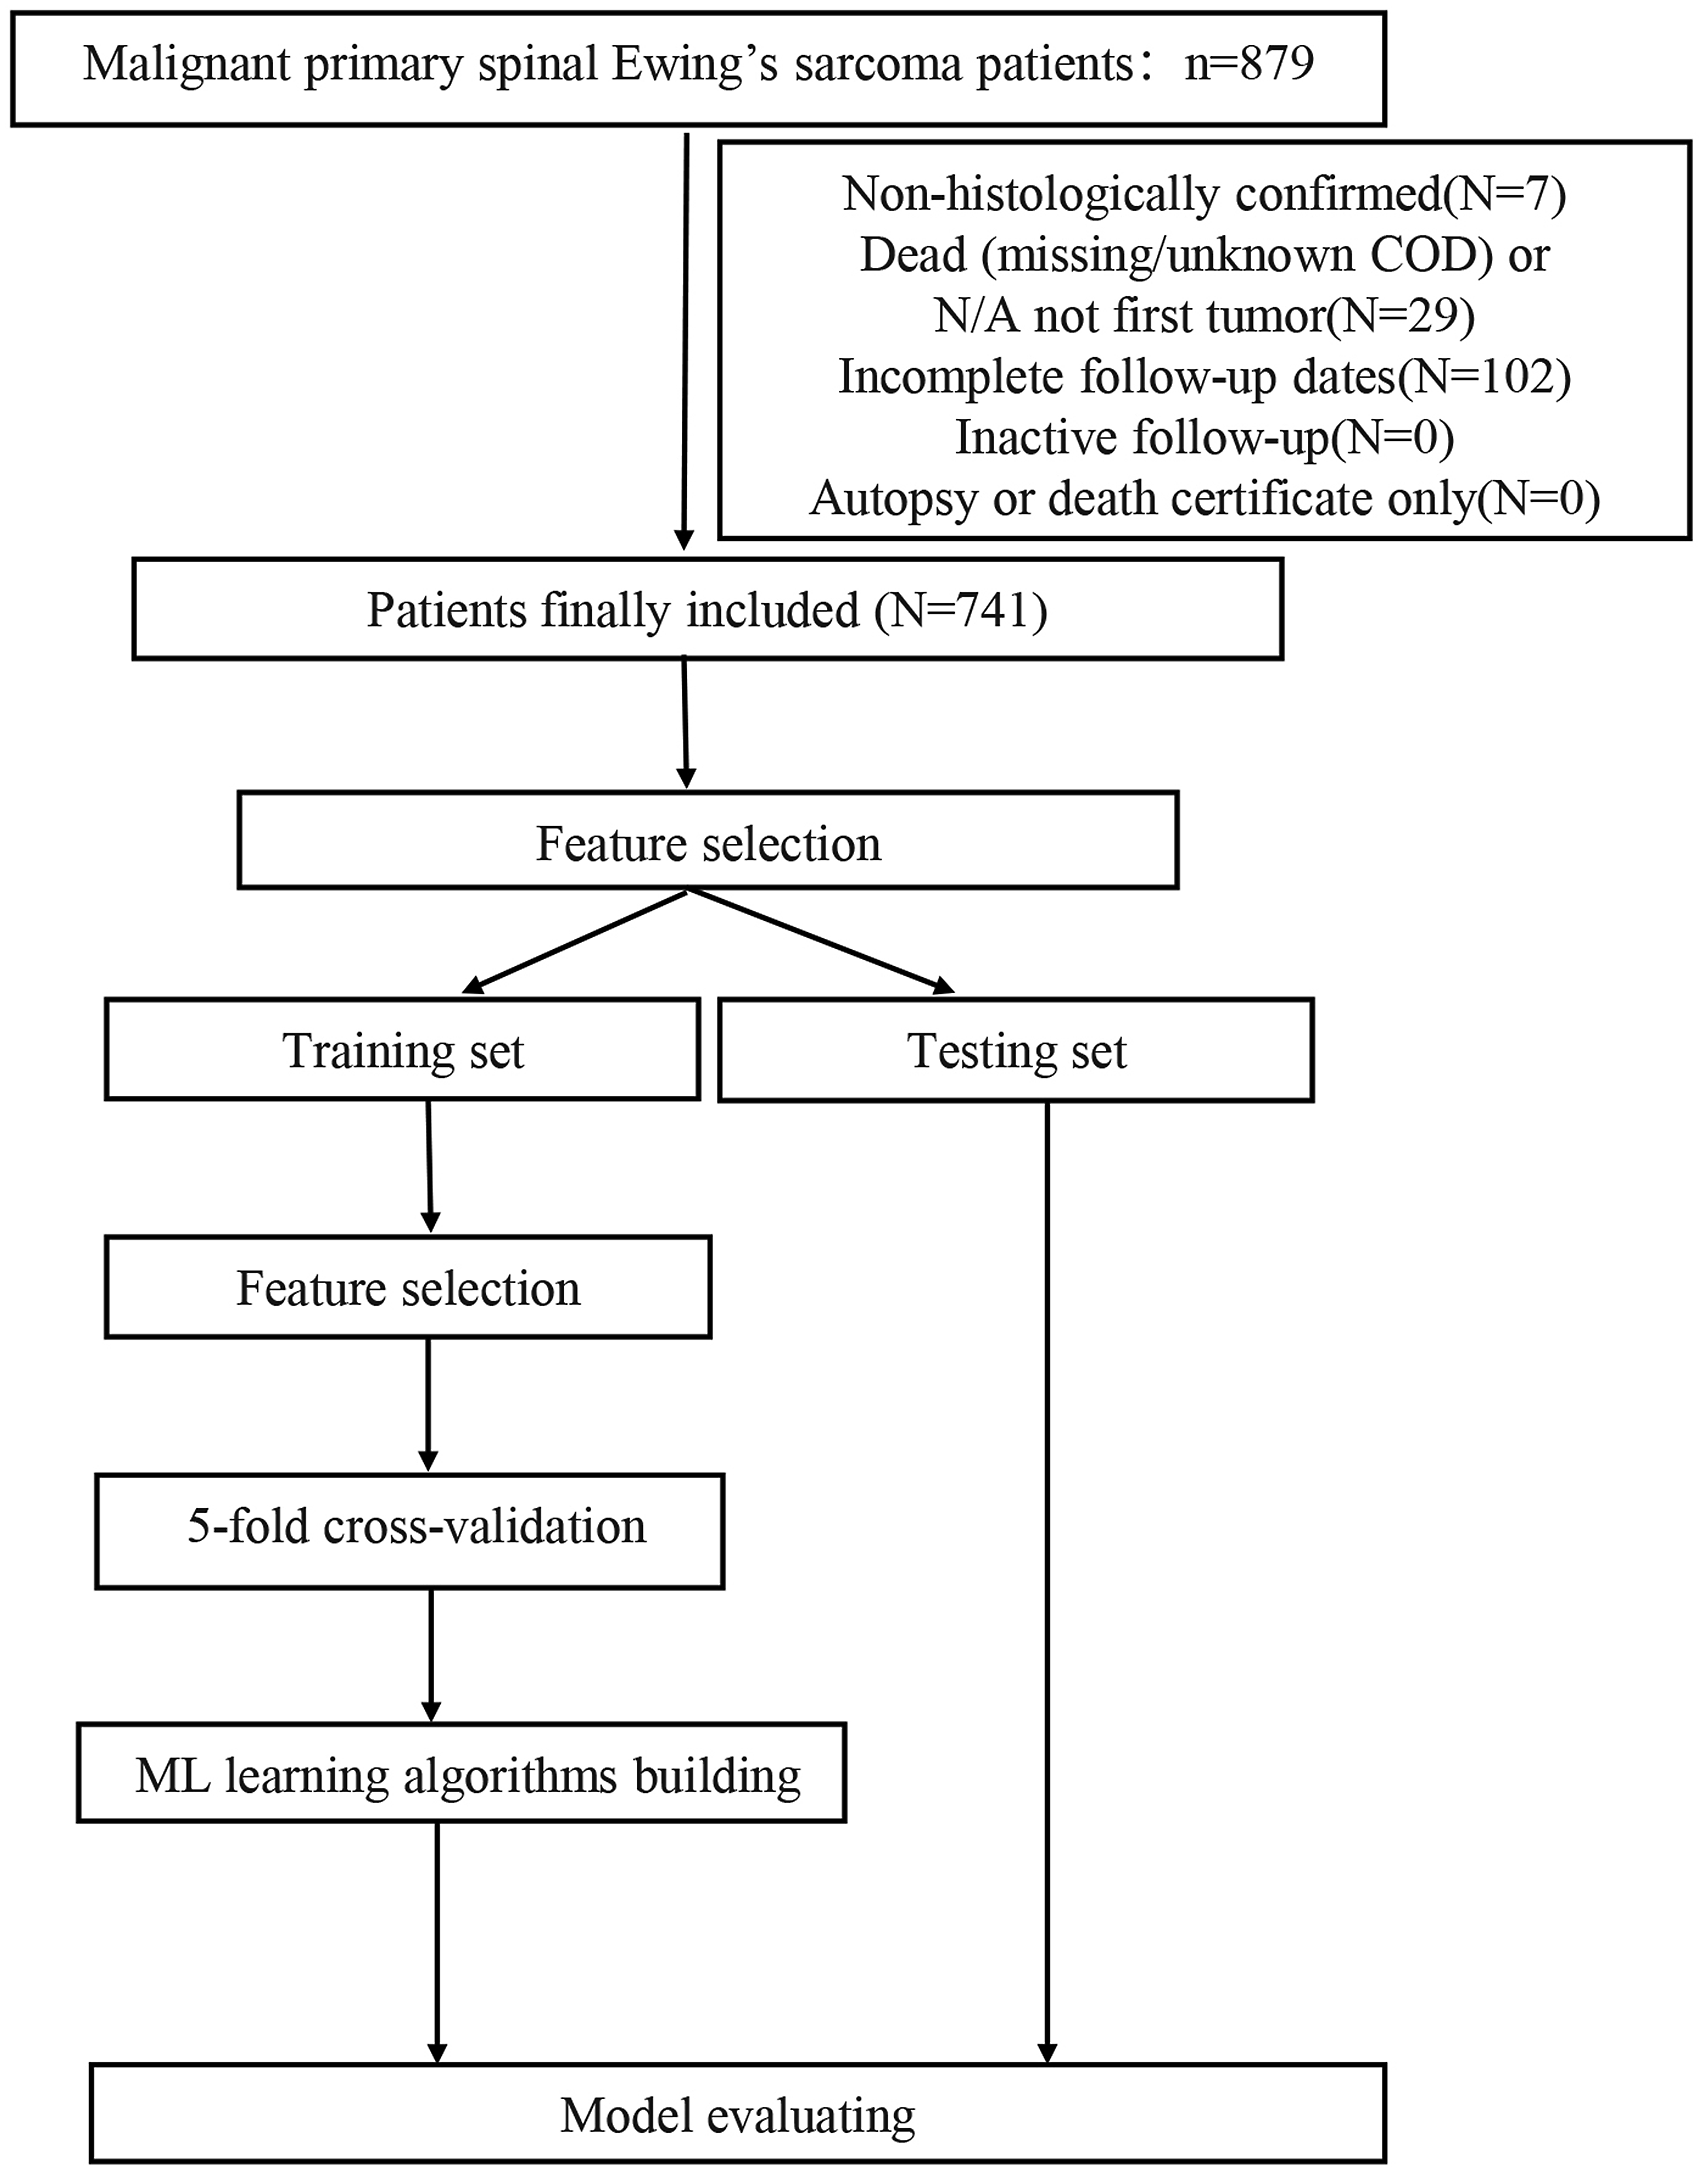
Feature Selections
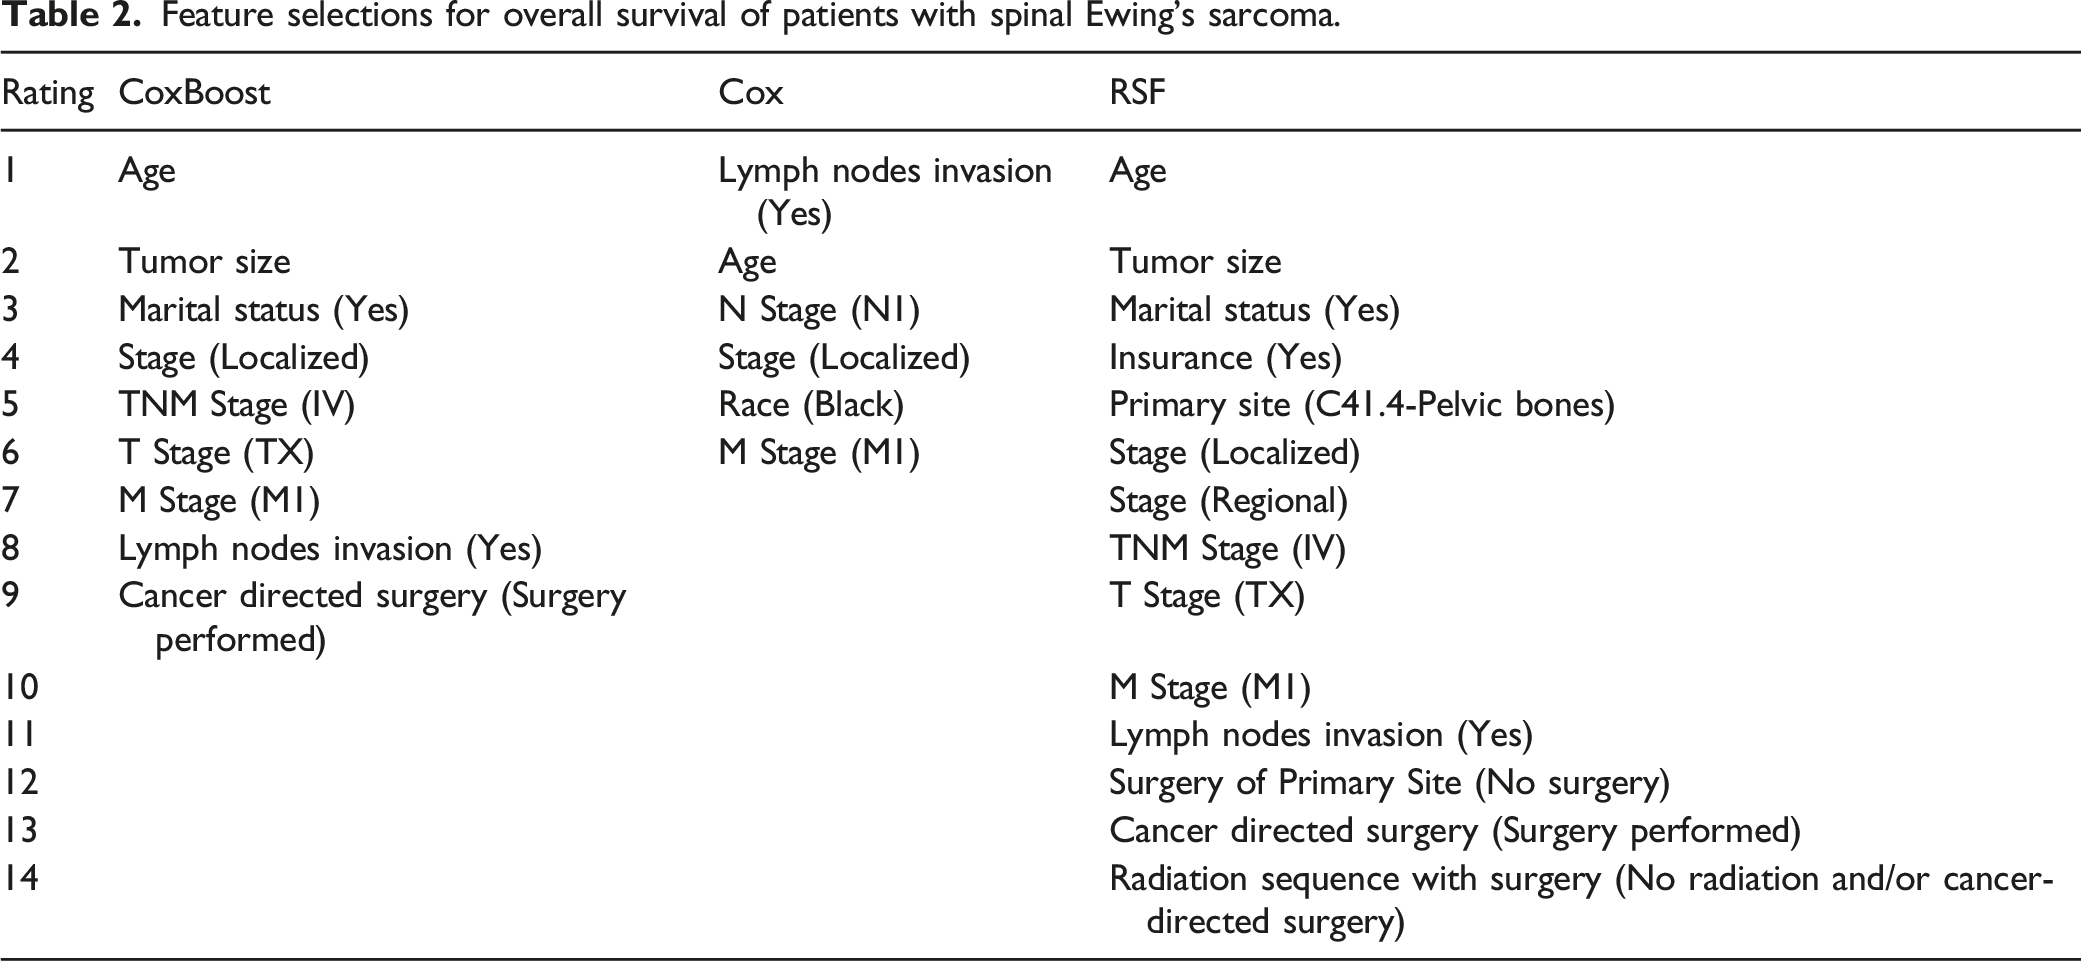
Feature selections for overall survival of patients with spinal Ewing’s sarcoma.
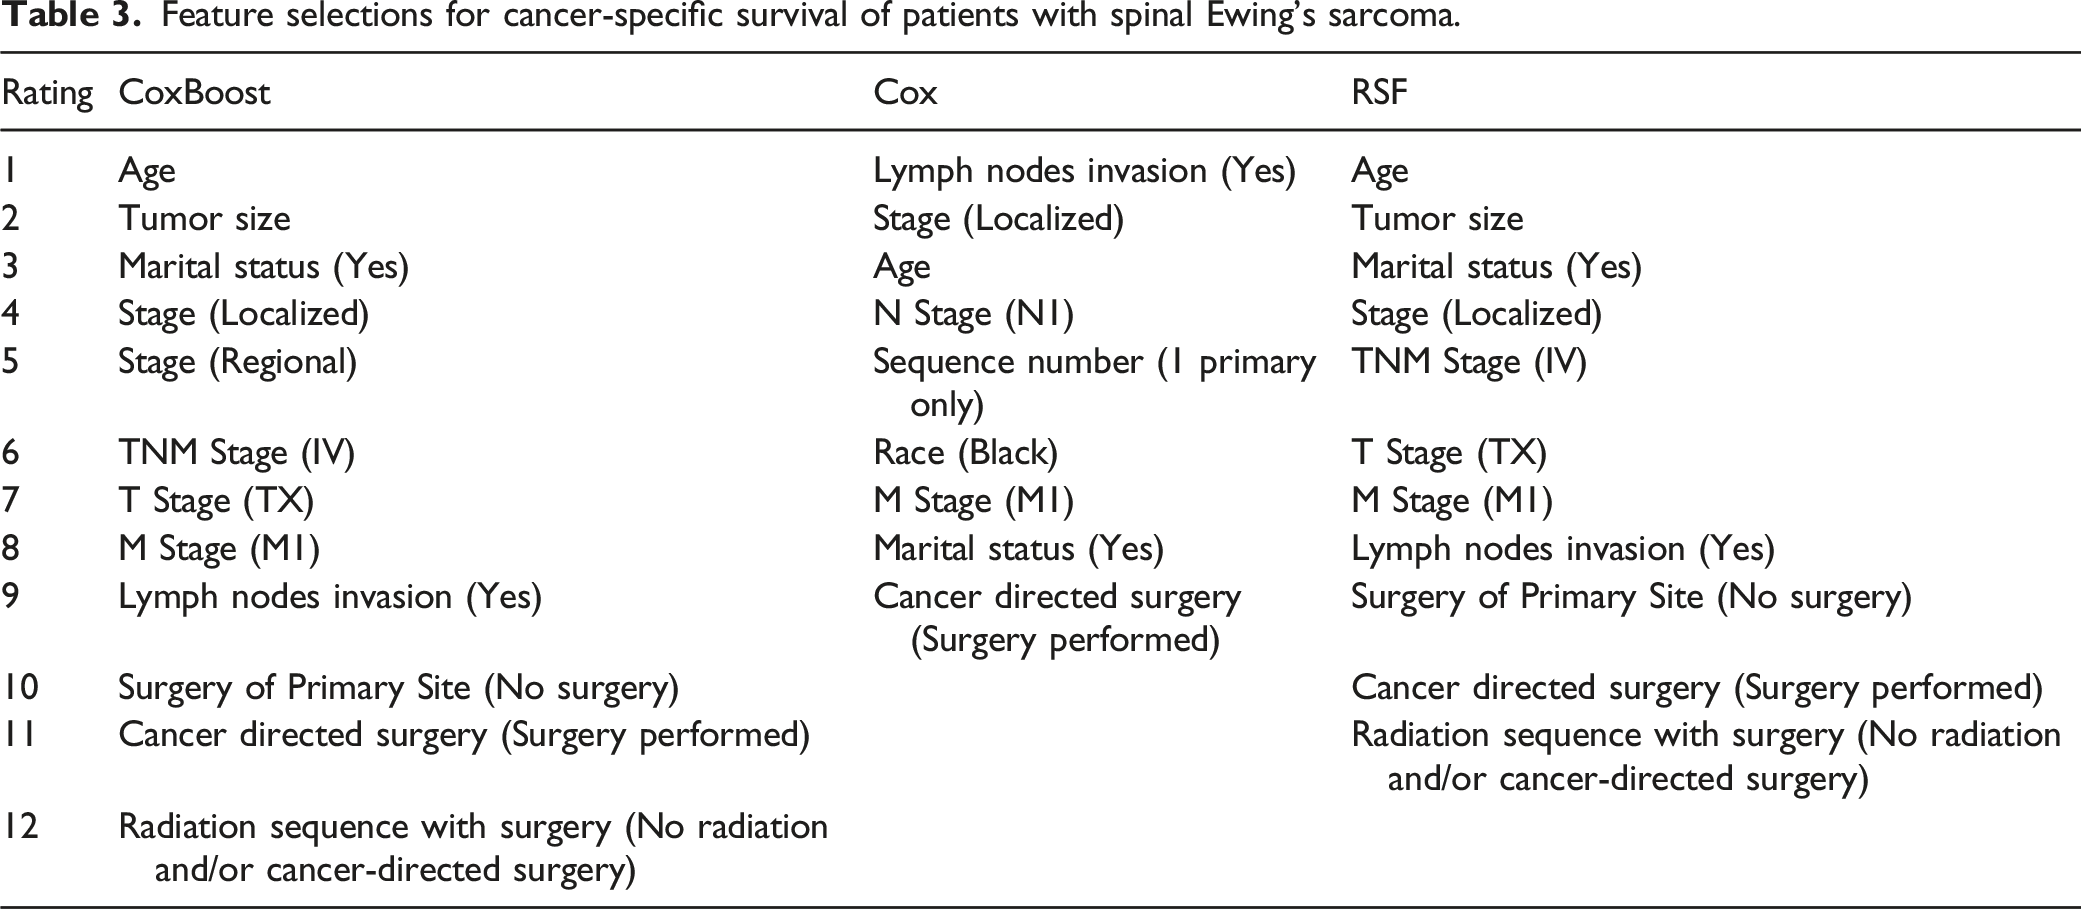
Feature selections for cancer-specific survival of patients with spinal Ewing’s sarcoma.
Predicting OS
ML models performed well in predicting OS (Figure 2A-F). The top ML models during independent testing were CoxBoost with Cox feature selection method, Cox with Cox feature selection method and Cox with Cox feature selection method. When CoxBoost model was combined with feature selection of Cox, the average C-index was better (.689 and .714) during 5-fold cross validation and independent testing for OS; the IBS were .197 and .196, the mean AUC were .771 and .811 for training and testing respectively. When Cox model was combined with feature selection of Cox, the average C-index was better (.689 and .685) during 5-fold cross validation and independent testing for OS; the IBS were .167 and .157, the mean AUC were .805 and .820 for training and testing respectively. Model evaluation for overall survival (OS). (A-F) Evaluation of different machine-learning (ML) models with 3 feature selection methods. (A) Concordance index (C-index) on training dataset; (B) Integrated Brier score (IBS) on training dataset; (C) Mean area under the curves (AUC) on training dataset; (D) C-index on testing dataset; (E) IBS on testing dataset; (F) Mean AUC on testing dataset. (G-H) Comparison of the ensemble ML model with the traditional TNM stage model. (G) The C-index, IBS and mean AUC on training dataset; (H) The C-index, IBS and mean AUC on testing dataset. (I) Venn diagram of features selected by 3 different selection methods.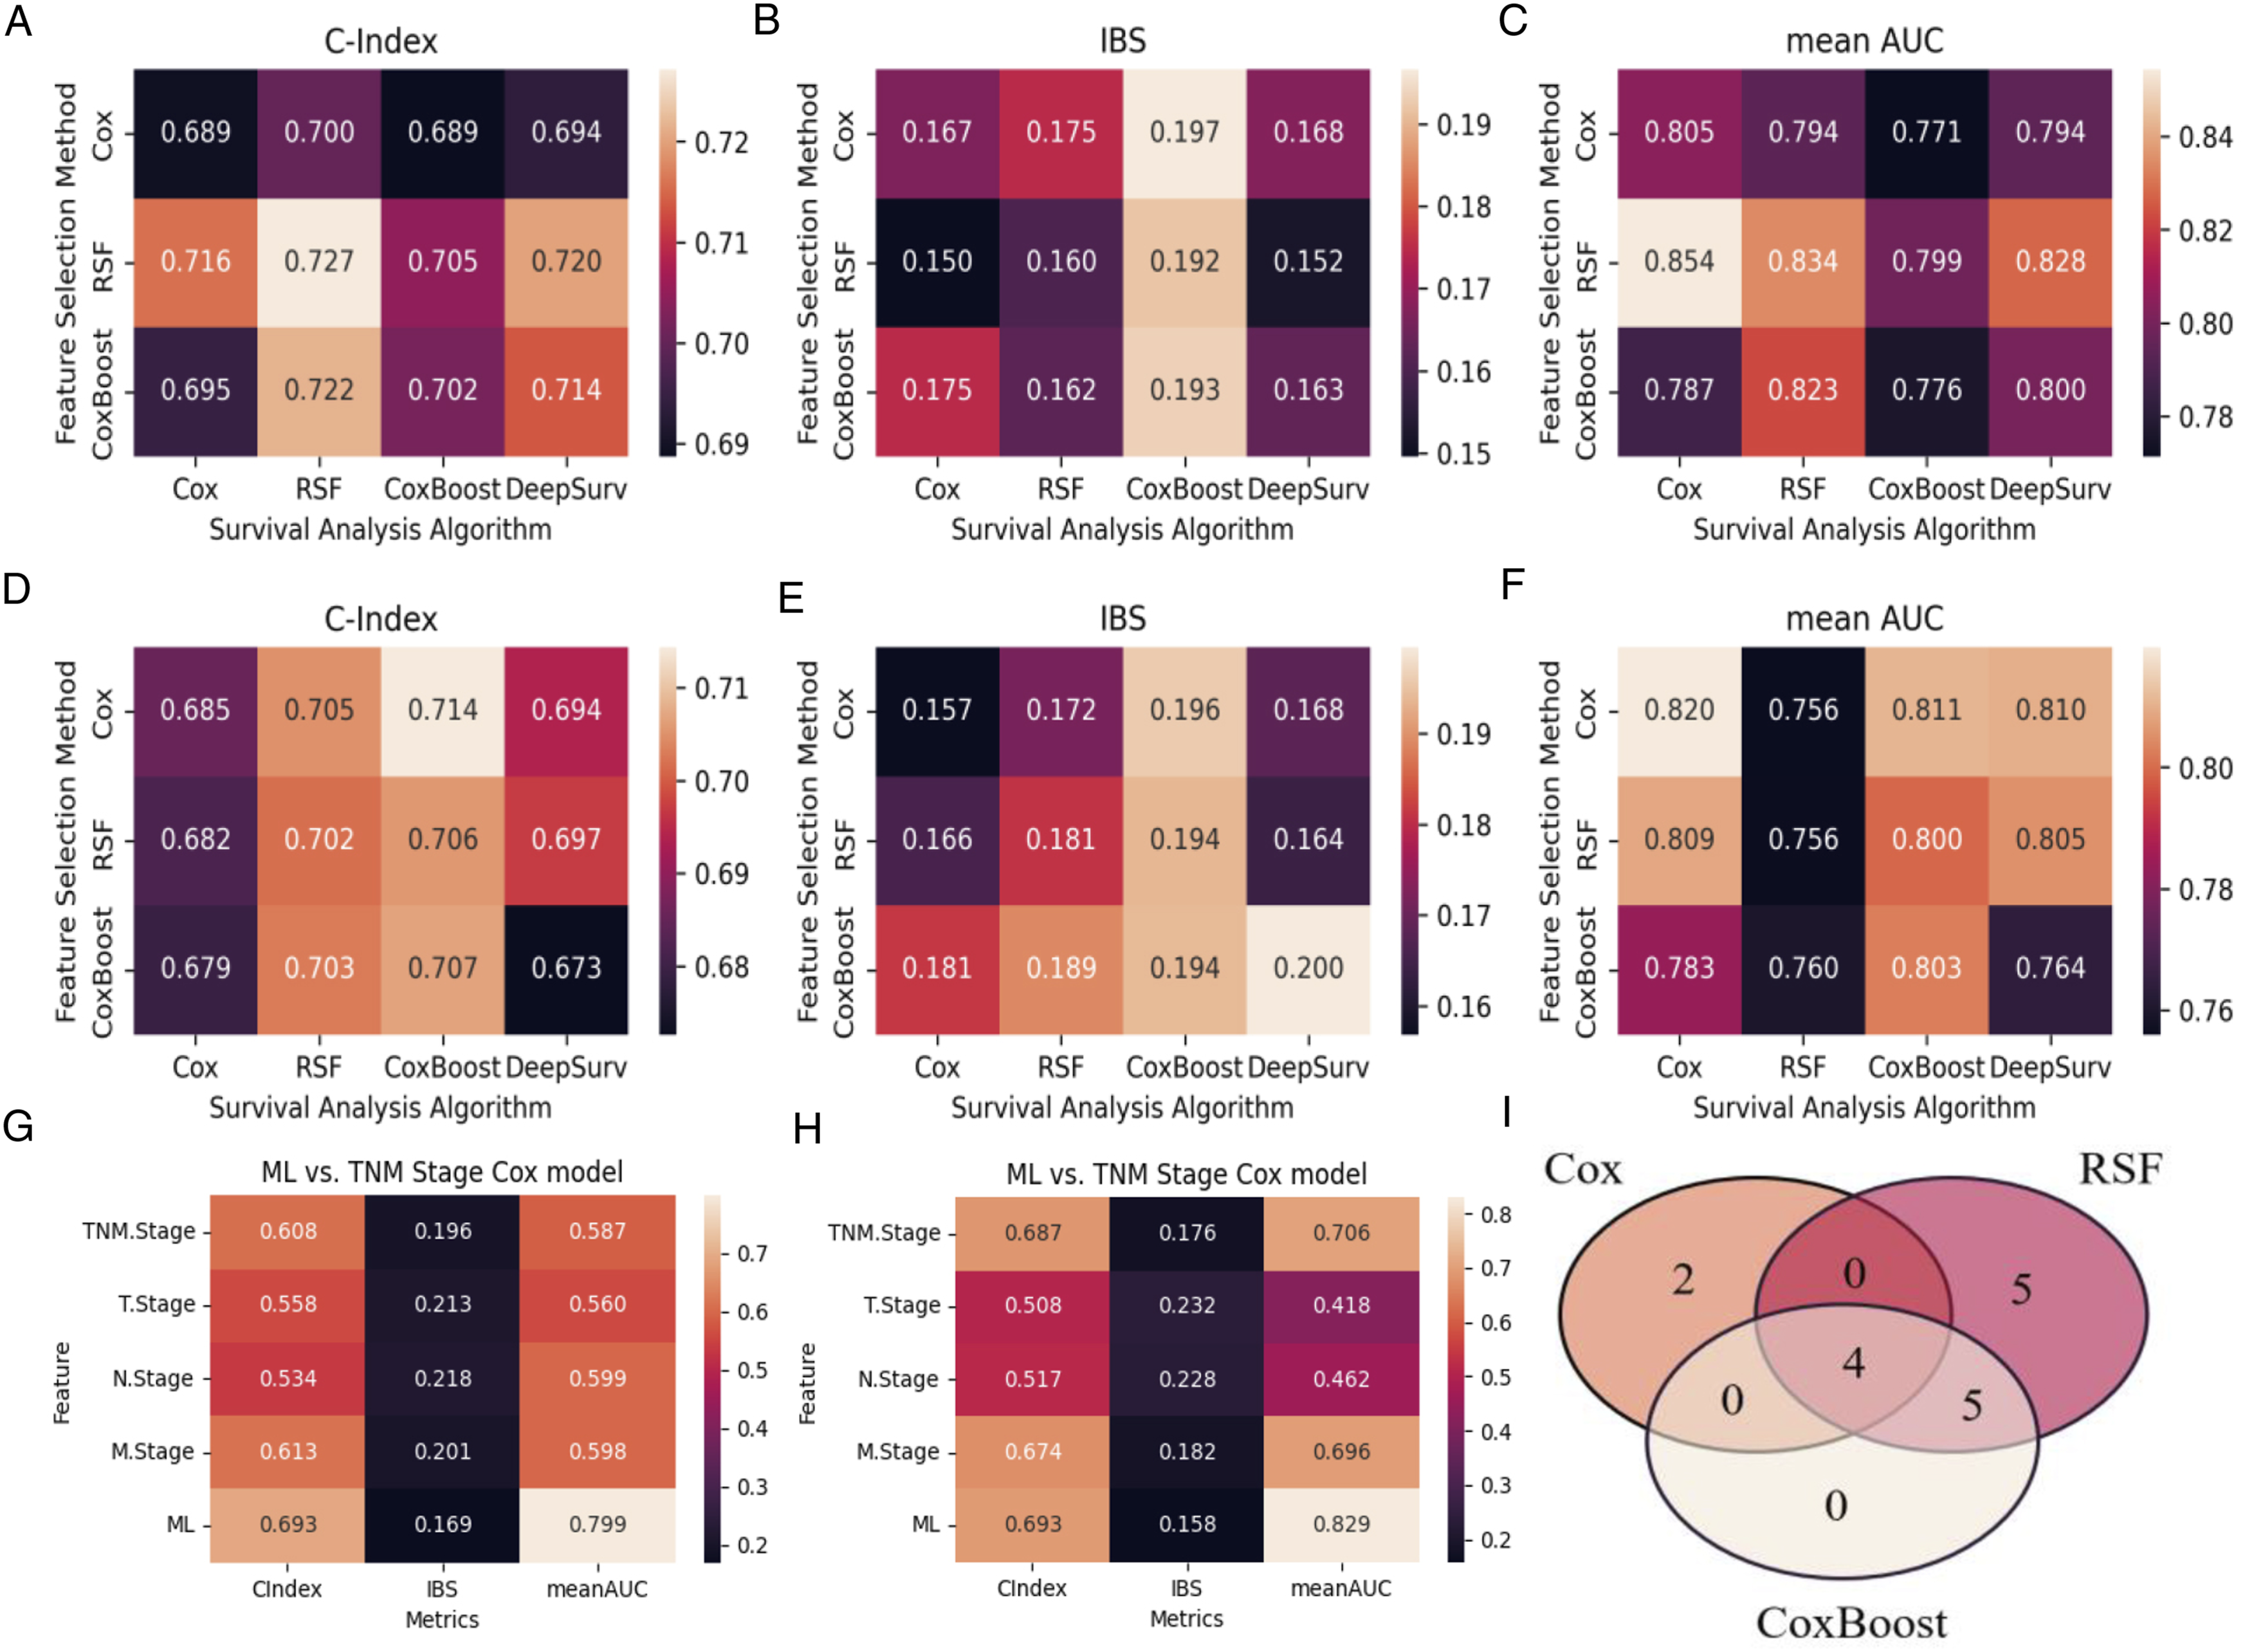
The final ensemble ML model performed better than the traditional TNM stage model with the C-index, IBS and mean AUC of .693/0.169/0.799 and .693/0.158/0.829 during cross-validation and independent testing (Figure 2G-H). The ensemble ML model also achieved an AUC of .740/0.771/0.814 for predicting 3-/5-/10-year OS during cross-validation and .705/0.747/0.851 during independent testing, which were superior to that of the traditional TNM stage model (Figure 3A-C, G-I). DCA curves also showed the merits of the ensemble model, compared to the traditional TNM stage model (Figure 3D-F, 3J-L). Model evaluation for overall survival (OS). (A-C) 3-, 5- and 10-year Area Under the Curve (AUC) for Receiver Operating Characteristic (ROC) curves of the ensemble ML model compared with the traditional TNM stage model on training dataset. (D-F) 3-, 5- and 10-year Decision Curve Analysis (DCA) curves of the ensemble ML model compared with the traditional TNM stage model on training dataset. (G-I) 3-, 5- and 10-year AUC for ROC curves of the ensemble ML model compared with the traditional TNM stage model on testing dataset. (J-L) 3-, 5- and 10-year DCA curves of the ensemble ML model compared with the traditional TNM stage model on testing dataset.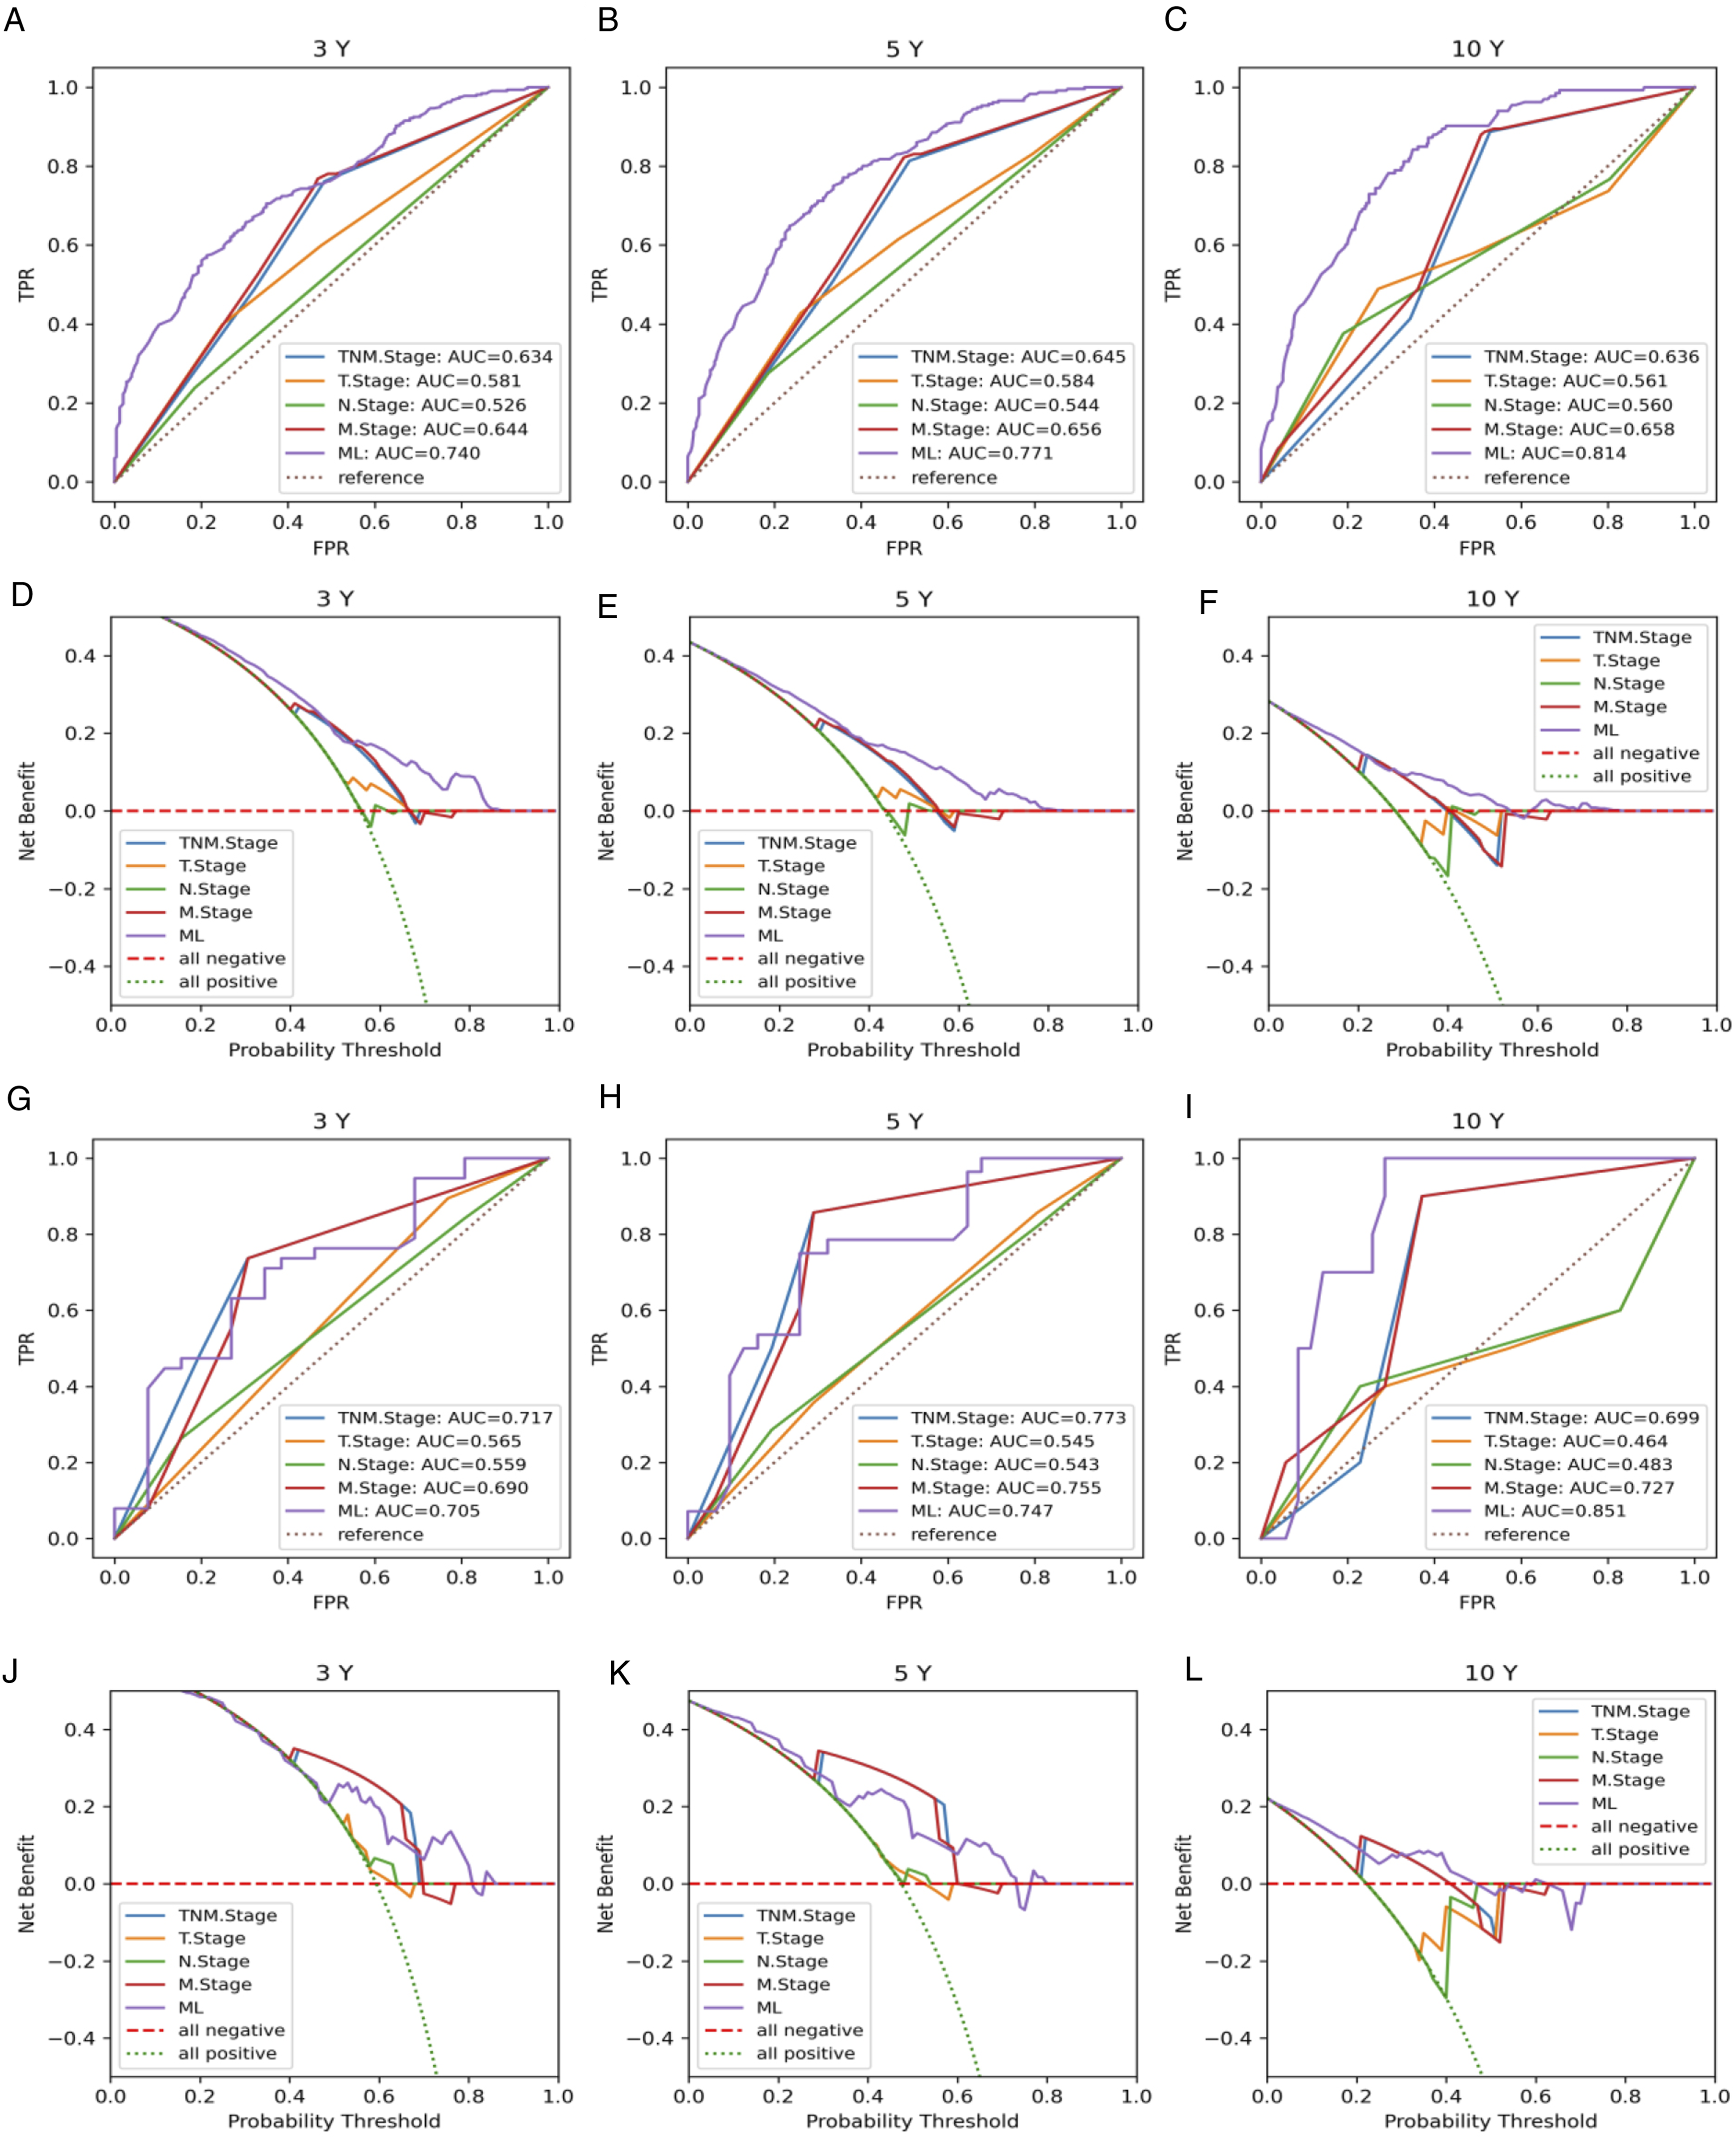
Predicting CSS
ML models performed well in predicting CSS (Figure 4A-F). The top ML models during independent testing were CoxBoost with CoxBoost feature selection method, RSF with Cox feature selection method and CoxBoost with Cox feature selection method. When CoxBoost model was combined with feature selection of CoxBoost, the average C-index was better (.702 and .725) during 5-fold cross validation and independent testing for OS; the IBS were .203 and .203, the mean AUC were .805 and .798 for training and testing respectively. When RSF model was combined with feature selection of Cox, the average C-index was better (.702 and .704) during 5-fold cross validation and independent testing for OS; the IBS were .184 and .161, the mean AUC were .787 and .769 for training and testing respectively. When CoxBoost model was combined with feature selection of Cox, the average C-index was better (.697 and .713) during 5-fold cross validation and independent testing for OS; the IBS were .205 and .203, the mean AUC were .800 and .814 for training and testing respectively. Model evaluation for cancer-specific survival (CSS). (A-F) Evaluation of different machine-learning (ML) models with 3 feature selection methods. (A) Concordance index (C-index) on training dataset; (B) Integrated Brier score (IBS) on training dataset; (C) Mean area under the curves (AUC) on training dataset; (D) C-index on testing dataset; (E) IBS on testing dataset; (F) Mean AUC on testing dataset. (G-H) Comparison of the ensemble ML model with the traditional TNM stage model. (G) The C-index, IBS and mean AUC on training dataset; (H) The C-index, IBS and mean AUC on testing dataset. (I) Venn diagram of features selected by 3 different selection methods.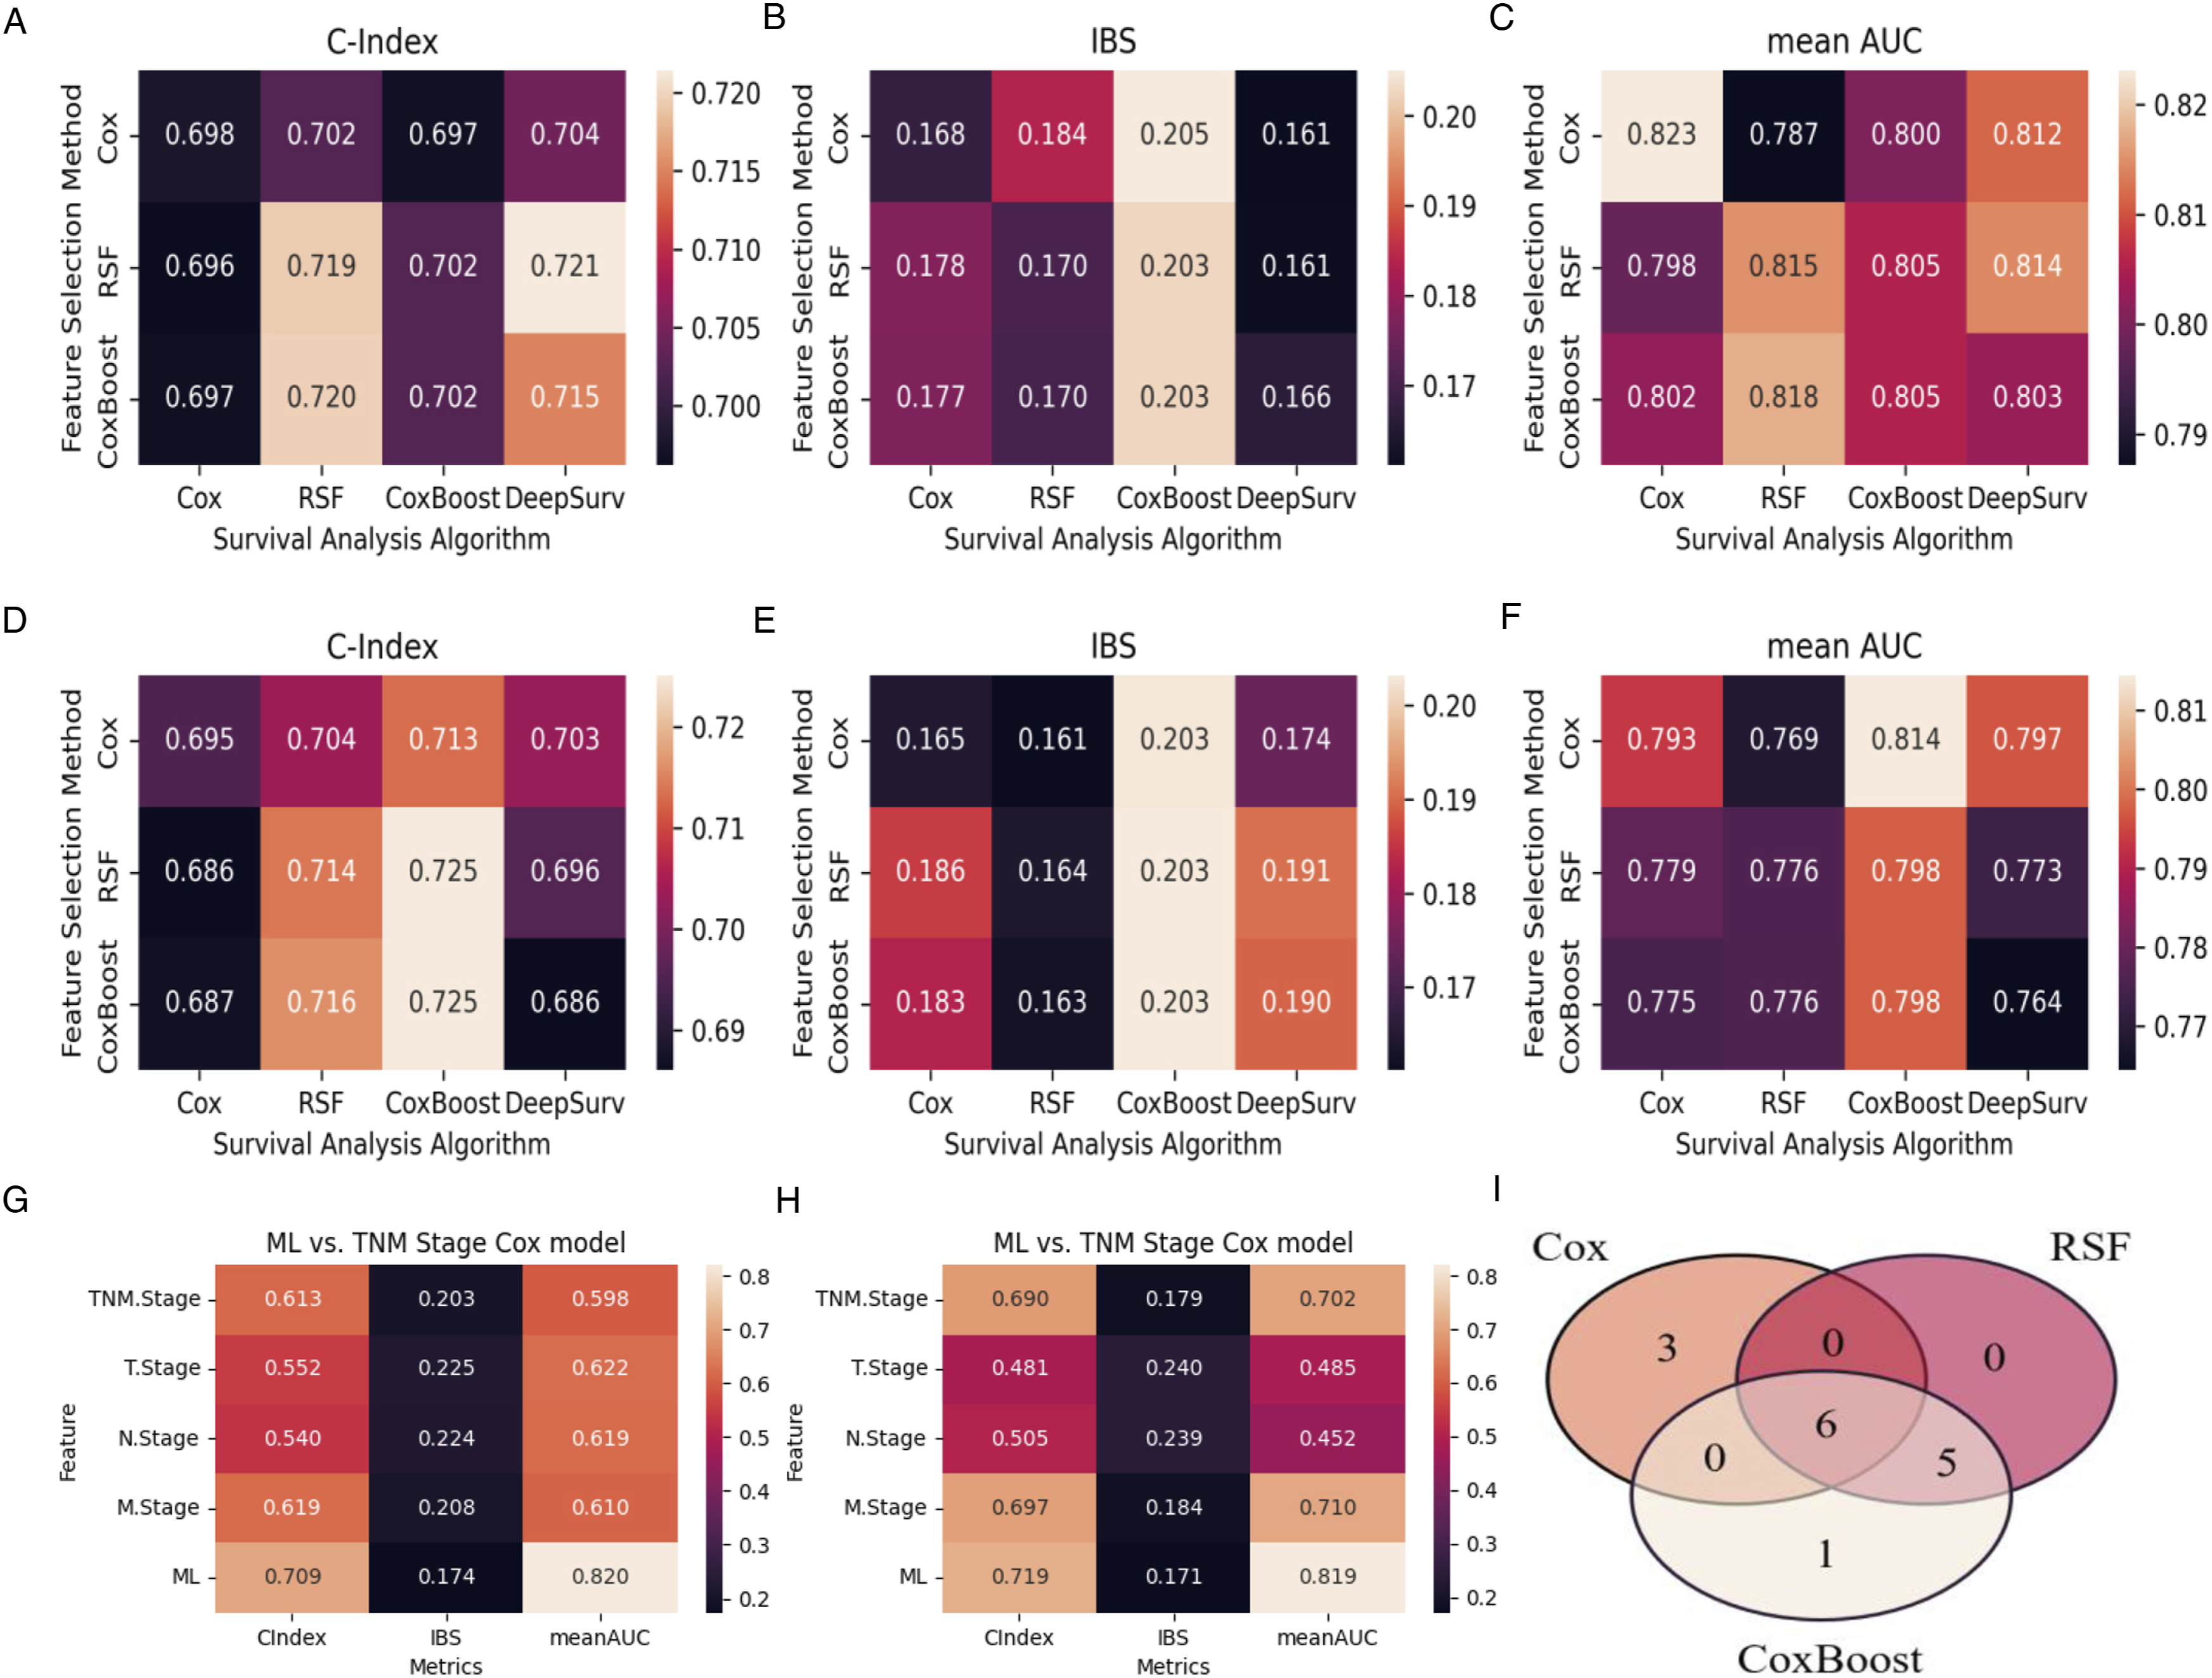
The final ensemble ML model performed better than the traditional TNM stage model with the C-index, IBS and mean AUC of .709/0.174/0.820 and .719/0.171/0.819 during cross-validation and independent testing (Figure 4G-H). The ensemble ML model also achieved an AUC of .762/0.783/0.820 for predicting 3-/5-/10-year CSS during cross-validation and .734/0.779/0.830 during independent testing, which were superior to that of the traditional TNM stage model (Figure 5A-C, 5G-I). DCA curves also showed the merits of the ensemble model, compared to the traditional TNM stage model (Figure 5D-F, 5J-L). Model evaluation for cancer-specific survival (CSS). (A-C) 3-, 5- and 10-year Area Under the Curve (AUC) for Receiver Operating Characteristic (ROC) curves of the ensemble ML model compared with the traditional TNM stage model on training dataset. (D-F) 3-, 5- and 10-year Decision Curve Analysis (DCA) curves of the ensemble ML model compared with the traditional TNM stage model on training dataset. (G-I) 3-, 5- and 10-year AUC for ROC curves of the ensemble ML model compared with the traditional TNM stage model on testing dataset. (J-L) 3-, 5- and 10-year DCA curves of the ensemble ML model compared with the traditional TNM stage model on testing dataset.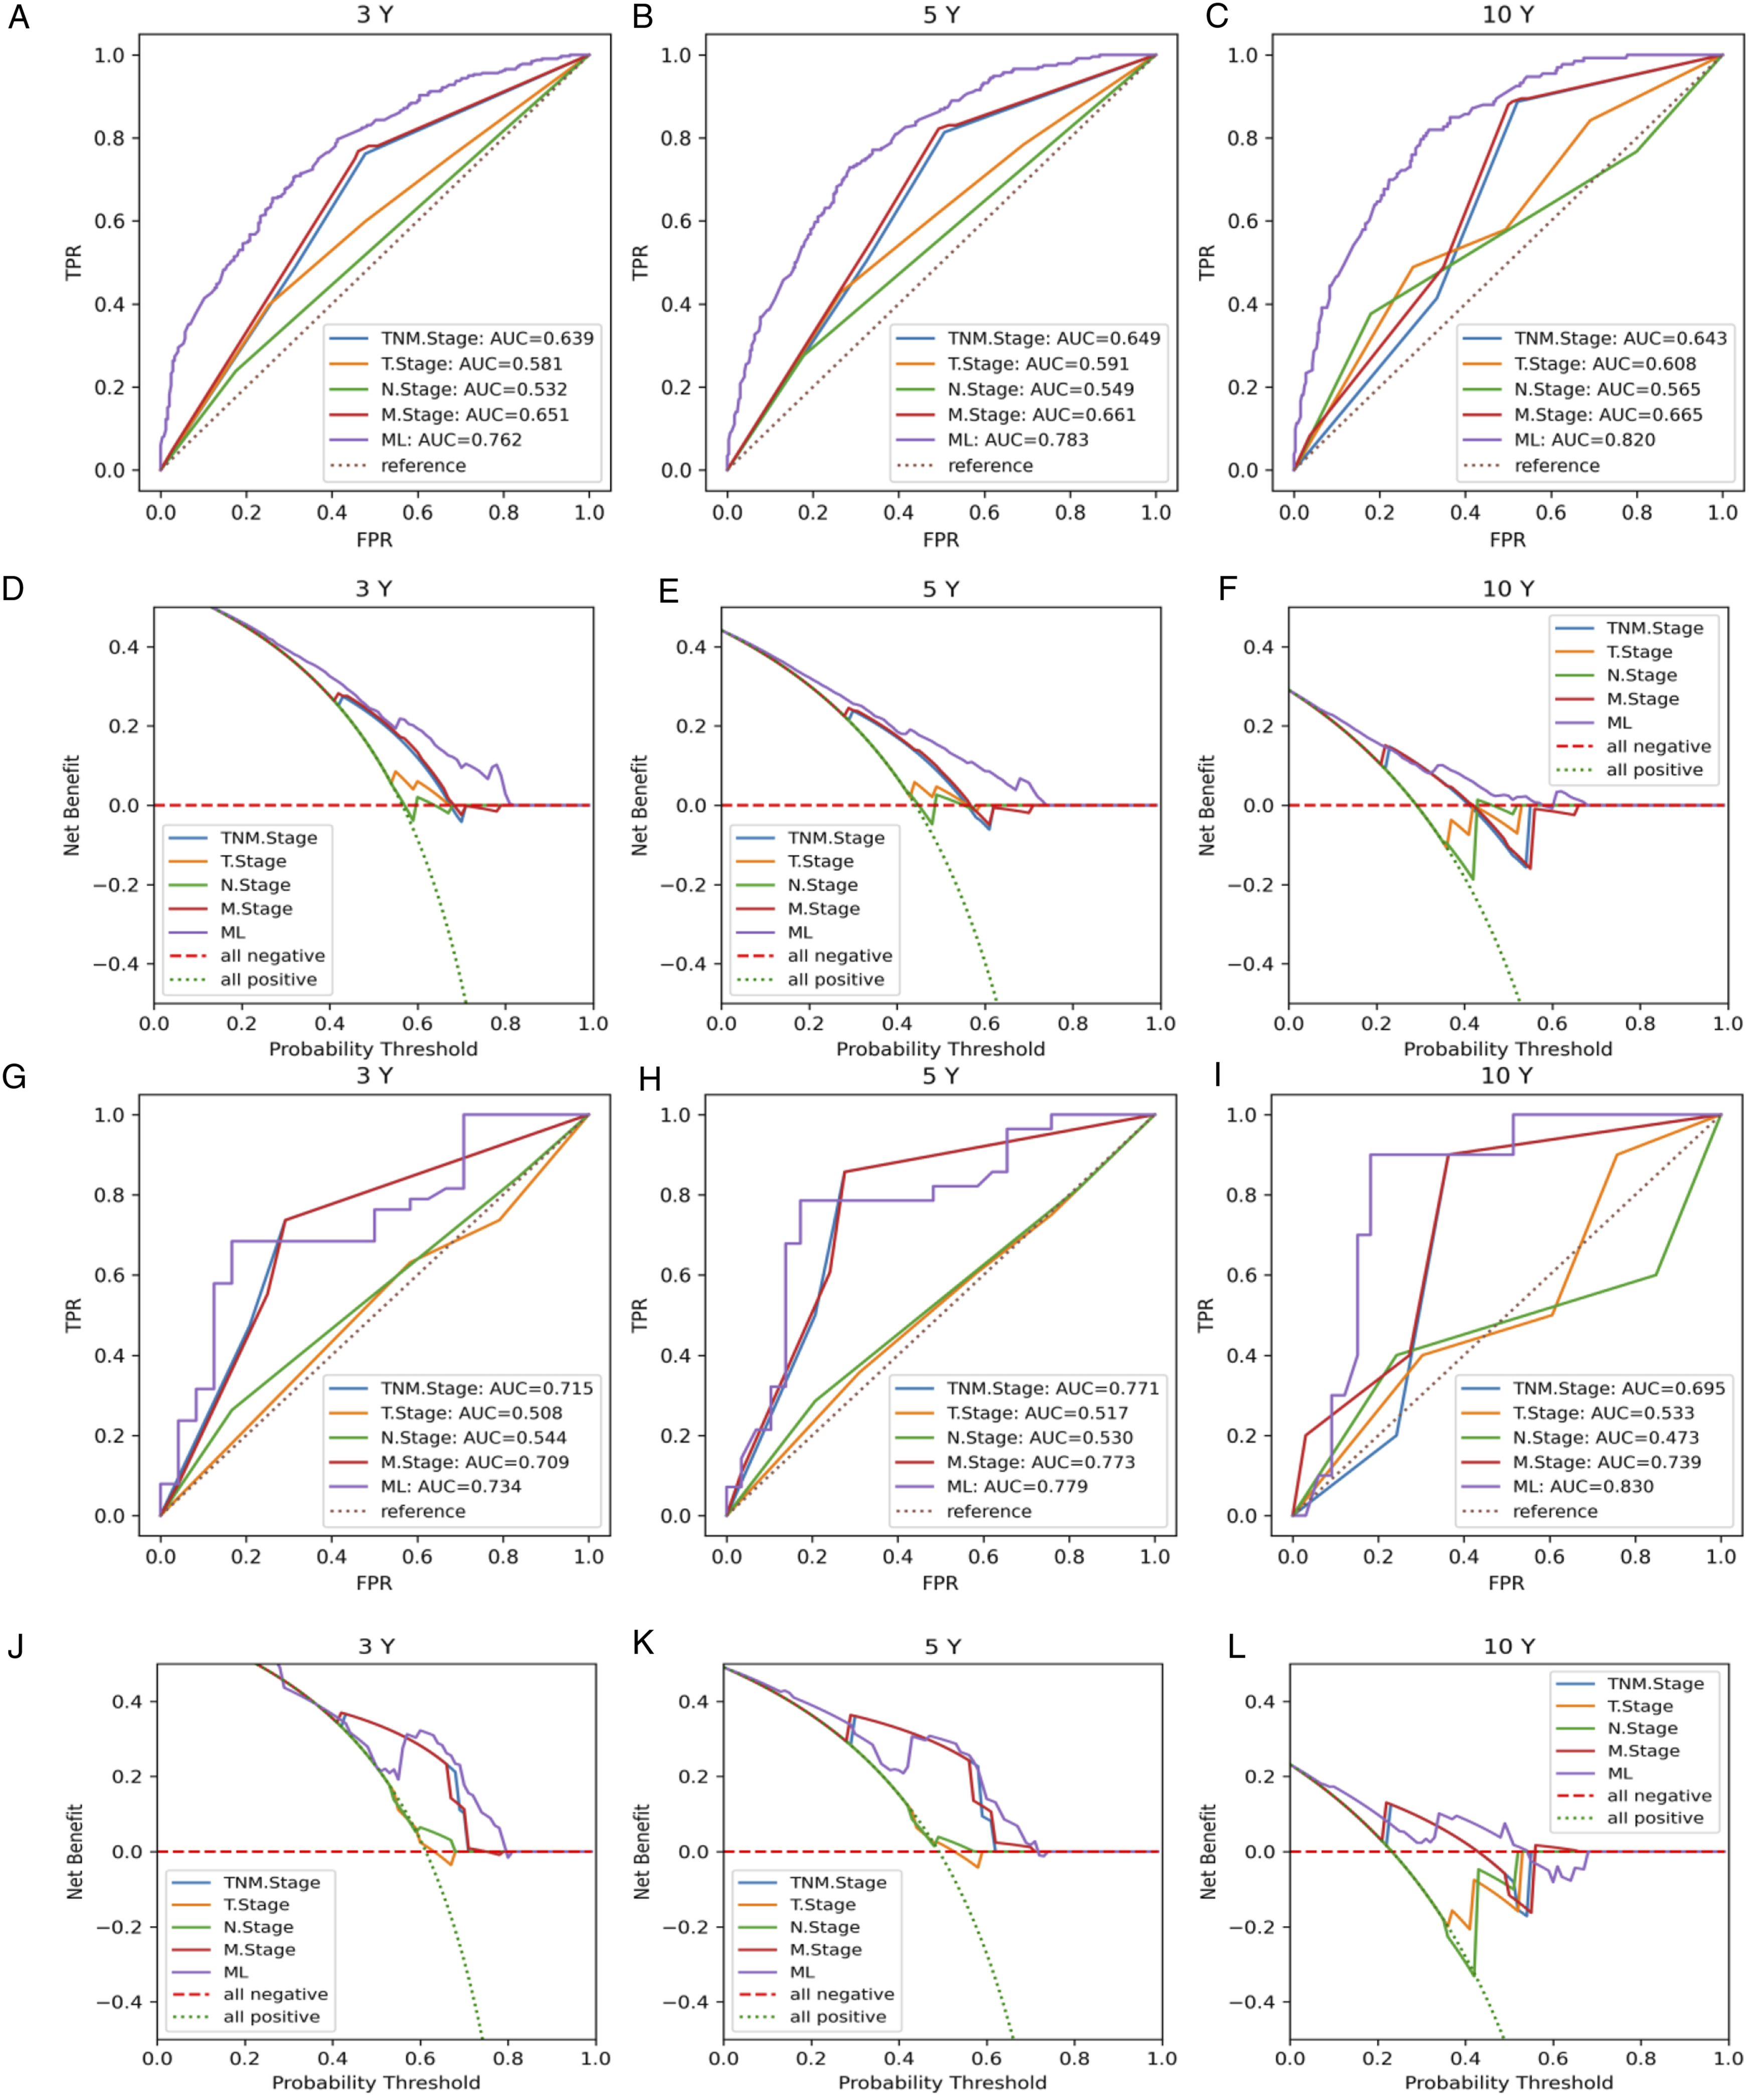
Discussion
The current study demonstrated that ML models could effectively predict the OS and the CSS of Ewing’s sarcoma. And our ensemble models were also verified to be superior to the traditional TNM stage model. To the best of our knowledge, this could be the first ML model for predicting survival of spinal Ewing’s sarcoma.
Ewing's sarcoma commonly grows at metaphyseal bones, but they may also present at the spine especially the sacrum. Only about 8% of all EWS cases originate from the spinal region. Spinal lesions can be primary or metastatic. Moreover, spinal EWS presenting with spinal cord compression have a very low incidence, and only 69 cases were reported in the literature till 2018. 12 The management of Ewing's sarcoma is challenging, and surgery combined with chemotherapy and radiotherapy is usually recommended to manage the progression of neurological deficits. However, there is no global uniform treatment standard for Ewing's sarcoma due to its rarity and insufficient experience collected. Only a few studies13–15 reported the clinical outcomes of spinal Ewing’s sarcoma based on the data from their own institutions. However, the SEER database has a large number of rare cancer patients with clinical data including demographics, therapeutic and outcomes. Thus, many previous studies have analyzed the survival of spinal Ewing’s sarcoma based on the clinical data from the SEER database.16–19 However, these studies only used conventional statistical analysis to find the correlated prognostic factors, and they failed to predict a patient-specific outcome, which was very important for clinicians in communicating with cancer patients and their families.
In this big-data era, large amounts of medical record information especially the cancer data generated everyday in our daily life. However, the accurate prediction of the OS and CSS is still 1 of the most interesting and challenging tasks for doctors. With the stronger ability to handle the large volumes and high dimensions of data compared to conventional statistical methods, ML methods have become a popular tool for medical researchers. 6 As it’s reported, the accuracy of cancer prediction outcomes in cancerous conditions has improved by 15%-20% in 2014, with the application of ML techniques. 20 With the construction of more public databases and the improvement of ML algorithms, ML methods will be a promising tool for inference in the cancer domain for clinical management and treatment decisions.
The prognosis of cancer is correlated with multidimensional factors, so the conventional linear statistical models may not present reliable performance in predicting survivals.5,21 In order to develop non-linear prediction models, many researchers have adopted several ML algorithms to predict cancer prognosis.22,23 Karhade et al 24 developed prediction models for 5-year survival of spinal chordoma based on several ML algorithms, and they found the Bayes Point Machine achieved the best performance. Ryu et al 25 predicted the survivals of patients with spinal and pelvic chondrosarcoma using Deep survival neural networks, and the prediction performance was promising (mean AUC was .85). Ryu et al 26 also developed ML models to predict the survival of spinal ependymomas based on the SEER database, and the ML model achieved an AUC of .74 for predicting a 5-year OS of spinal ependymoma and an AUC of .81 for predicting a 10-year OS. However, these studies all defined the survival outcome as a classification issue for developing ML models. Not many studies developed ML models to predict the survival outcomes with time information. 5
In the current study, all ML models were trained with different feature packs and went through 5-fold cross validation. We made different combinations of 3 feature extraction methods and 4 ML algorithms in order to identify the optimal model with the best performance of survival prediction. For feature selection, we had found several features which had been well-recognized significant prognostic factors in spinal Ewing’s sarcoma. Arshi et al 2 reported that age, race and tumor size were independent predictors for OS in patients with spinal Ewing’s sarcoma, and age, tumor size were independent features for CSS. Similarly, Chen et al 27 revealed that age, race, tumor stage, and surgery were the independent risk factors for OS prognosis of pelvic Ewing’s sarcoma. Furthermore, David et al 28 conducted an epidemiologic and survival trends in adult primary bone tumors of the spine and found government insurance, tumor size >5 cm, high tumor grade to be associated with worse overall survival of spinal tumors. They also found that surgical resection and chemotherapy were associated with improved survival for spinal Ewing’s sarcoma. However, other features were identified as significant prognosticators in this study through our ML-based feature selection methods. With RSF of feature selection, “Marital status (Yes)” and “lymph nodes invasion (Yes)” were predictors for both OS and CSS. With CoxBoost of feature selection, “Marital status (Yes)” and “lymph nodes invasion (Yes)” were predictors for OS and CSS. This may highlight the ability of advanced feature selection methods based on ML algorithms like CoxBoost and RSF to explore features which may have a non-linear relationship in patients’ survival outcomes.5,21 For survival prediction, it turned out that most ML models have similar accuracy in survival prediction of spinal Ewing’s sarcoma, which was similar to a previous study. 7 Thus, we further applied an ensemble algorithm to stacked the top ML models during independent testing as our final model, which were demonstrated to be superior to the traditional TNM stage model. Nevertheless, DeepSurv algorithm seemed to show no advantage to other algorithms. It seems that ML methods also have their limitations for usually their predictions might be hard to interpret, which is considered as an uninterpretable black-box.5,7 Thus, maybe more feature selection methods and more ML algorithms were needed in the future to validate our findings.
As for the great scale and wide coverage for the SEER database collection, it’s definitely suited for the study of rare tumors such as spinal EWS. However, the SEER database provides limited information on tumor genetic profile and bio-molecular markers, 29 which usually play a highly relevant role in the OS and CSS of tumors. These biomarker or genetic information relies on the improvements and completeness of the SEER data collection. 30 Another limitation of the current research is the limited amount of data, which makes it challenging to train ML algorithms in our experiments. We have selected the latest and most comprehensive data from the SEER dataset to collect as much of the latest data as possible. However, we did not have external dataset to test the generalization of the optimal model, and new data may be needed to conduct further validations. What’s more, as the limited amount and large time span of our data, evolution of treatment modality over decades may lead to possible observation biases between patients. However, ML techniques showed satisfactory results in analyzing such heterogeneous and complex data with missing values. 26 While we are actively working on the further validation of ML models, we encourage more researchers to share their own data. We hope the validated model could be presented online as a prediction tool for spinal EWS in the future.
Conclusion
ML was an effective and promising technique in predicting survival of spinal Ewing’s sarcoma, and the ensemble models were demonstrated to be superior to the traditional TNM stage model. More feature selection methods and more ML algorithms were needed in the future to validate our findings.
Supplemental Material
Supplemental Material - Machine Learning Predict Survivals of Spinal and Pelvic Ewing’s Sarcoma with the SEER Database
Supplemental Material for Machine Learning Predict Survivals of Spinal and Pelvic Ewing’s Sarcoma with the SEER Database by Guoxin Fan, Sheng Yang, Jiaqi Qin, Longfei Huang, Yufeng Li, Huaqing Liu, Xiang Liao in Global Spine Journal
Footnotes
Acknowledgments
The authors thank the SEER database for the availability of the data. We also thank the colleagues (J.Z., X.L., C.F.) who provided assistances in the prior work.
Declaration of Conflicting Interests
The author(s) declared the following potential conflicts of interest with respect to the research, authorship, and/or publication of this article: The authors declare that the research was conducted in the absence of any commercial or financial relationships that could be construed as a potential conflict of interest.
Funding
The author(s) disclosed receipt of the following financial support for the research, authorship, and/or publication of this article: Guangdong Basic and Applied Basic Research Foundation (2019A1515111171) and National Natural Science Foundation of China (82102640) were received in support of this work. The funders had no role in study design, data collection, data analysis, interpretation, writing of this report and in the decision to submit the paper for publication.
Supplemental Material
Supplemental material for this article is available online.
References
Supplementary Material
Please find the following supplemental material available below.
For Open Access articles published under a Creative Commons License, all supplemental material carries the same license as the article it is associated with.
For non-Open Access articles published, all supplemental material carries a non-exclusive license, and permission requests for re-use of supplemental material or any part of supplemental material shall be sent directly to the copyright owner as specified in the copyright notice associated with the article.