
Abstract
Study Design
Retrospective radiological study.
Objectives
Physical examination reveals sciatic scoliotic list (SSL) in some patients with lumbar disc herniation (LDH). We aimed to evaluate the coronal and sagittal parameters of the SSL curve, describe their characteristics, and establish a new classification system.
Methods
We retrospectively reviewed 230 patients (SSL group = 96; non-SSL group = 134) diagnosed with single-segment LDH from January 2018 to December 2020. The control group comprised 70 healthy volunteers. Radiographic parameters were compared between the groups.
Results
In the SSL group, the Cobb’s angle was 12.5 ± 5.3° (4.2-31.2), trunk shift 26.2 ± 17.9 mm (.0-88.2 mm), and apical vertebral translation 31.7 ± 16.0 mm (1.18-8.58 mm). Further, 62.5% of patients had L4/5 disc herniation, 76.0% had disc herniation at the convex side of the lumbosacral scoliosis, and 81.3% had disc herniation at the opposite side of the trunk shift. Compared to the control group, lumbar lordosis and thoracic kyphosis decreased, pelvic tilt increased, and the sagittal vertical axis moved forward in the other patients. The sagittal imbalance in the SSL group exacerbated. Using the positional relationship between vertebrae and the central sacral vertical line (CSVL), we identified two main SSL patterns with which 95.8% of the patients were defined as Type 1.
Conclusions
The SSL curve is characterized by a long thoracic or thoracolumbar curve, with a relatively straight sagittal profile and little rotation. Further, the lumbar and thoracic vertebrae shifts are on the same side as the CSVL. These features of the SSL curve differentiate it from other types of structural scoliosis.
Keywords
Background
Lumbar disc herniation (LDH) is a common disease, affecting 1-5% of the population annually. 1 The typical symptoms of a herniated disc are low back pain and sciatica. Diagnostic features observed during physical examination may include positive straight leg raising test, impaired tendon reflexes, muscle weakness, sensory deficit, and scoliosis. 2 Sciatic scoliotic list (SSL),3,4 also called sciatic scoliosis,4-6 trunk list, 7 or trunk shift, 8 was reported in 13.2-17.7% of adult patients with LDH.5,6,9 Although the exact mechanism of SSL was unclear, the possible reason was that the change of posture could alleviate nerve root irritation. Some authors have reported that sciatic scoliotic in adults is mostly associated with a short lumbosacral curve accompanied by a long thoracic or thoracolumbar curve, in addition to a relatively straight sagittal profile.5,6,8 However, to our knowledge, existing studies on sciatic scoliotic included a few cases and there was no classification of the coronal curve. The present study focuses on the radiological characteristics of the coronal curve in sciatic scoliotic and attempts to establish a new classification system for the coronal curve in SSL.
Methods
Study Participants
We retrospectively reviewed patients diagnosed with LDH who underwent endoscopic discectomy in our hospital between January 2018 and December 2020. The inclusion criteria were (1) age, 18 to 50 years; (2) single-level disc herniation located at either L4-L5 or L5-S1, confirmed by magnetic resonance imaging; (3) symptoms and signs, including lower back pain, unilateral radiculopathy, and positive straight leg-raise test; and (4) availability of preoperative full-length spine radiography results. The exclusion criteria were (1) congenital or idiopathic scoliosis; (2) history of spinal trauma; (3) infection, tumor, metabolic bone disease, or neuromuscular disease; and (4) unequal leg length. The control group included healthy adults who underwent routine physical examination in our hospital. This study was approved by the Ethics Committee of Peking University First Hospital (No. 2021-638). Written informed consent was obtained from all participants. All methods were performed in accordance with relevant guidelines and regulations.
Radiographic Assessment
Coronal and sagittal curve features were evaluated on a full-length spine radiograph. Surgimap 2.0 software (Medicrea, New York) was used to measure radiographic parameters. Scoliosis of the curvature was measured by the Cobb method. Trunk shift (TS) was defined as the horizontal distance between the central sacral vertical line (CSVL) and the C7 plumb line (C7PL). In addition, C7PL shift to the left of the CSVL was defined as a negative balance, and C7PL shift to the right was defined as a positive balance. The apical vertebra (only thoracic and lumbar vertebrae) was the most laterally deviated vertebra from the CSVL. Apical vertebral translation (AVT) was defined as the horizontal distance between the center of the apical vertebra and the CSVL. Apical vertebral rotation (AVR) was assessed using the Nash-Moe grading system. Cobb’s angle (CA) ≥ 10° or AVT ≥2.0 cm was considered to indicate SSL. Sagittal parameters such as pelvic incidence (PI), pelvic tilt (PT), sacral slope (SS), lumbar lordosis (LL), thoracic kyphosis (TK), thoracolumbar kyphosis (TLK), and sagittal vertical axis (SVA) were also measured.
Data and Statistical Analysis
Statistical analyses were performed using SPSS26.0 (IBM, Armonk, NY, USA). Normally distributed variables were analyzed with the Kolmogorov-Smirnov test. Descriptive data are presented as mean, standard deviation, frequency, and percentage values. The independent-samples T test was used for between-group comparison of normally distributed variables. The Mann-Whitney U test was used for between-group comparison of non-normally distributed variables. The chi-square test was used to evaluate differences in categorical variables. P values <.05 were considered statistically significant.
Results
General Patient Information.
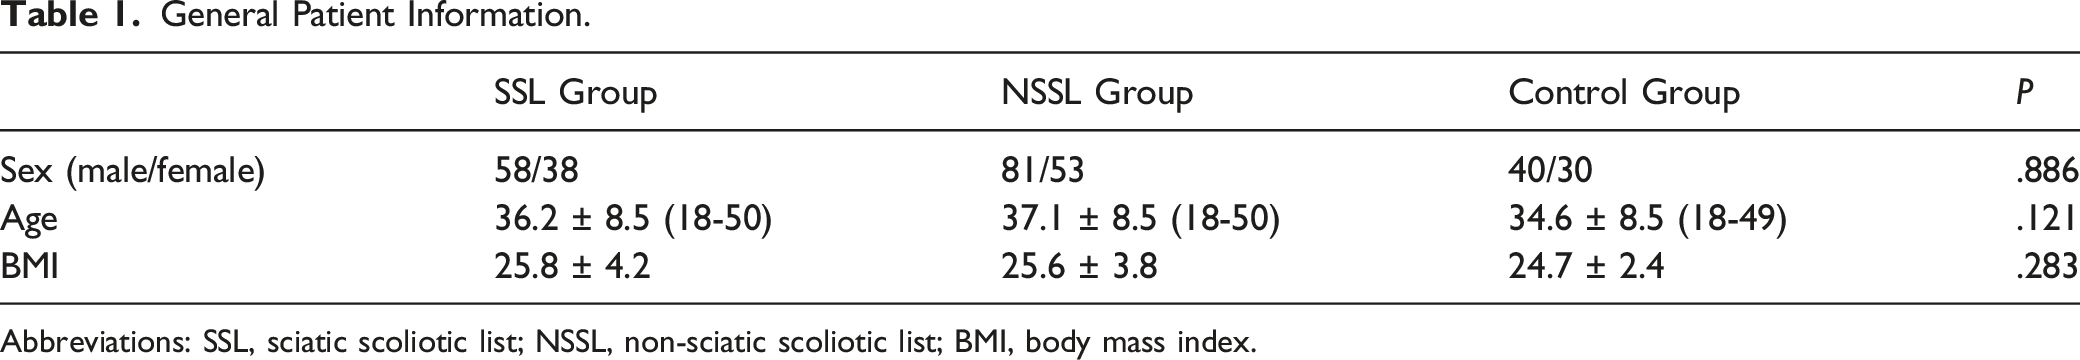
Abbreviations: SSL, sciatic scoliotic list; NSSL, non-sciatic scoliotic list; BMI, body mass index.
Comparison of Signs and Symptoms Between the Sciatic Scoliotic List and Non-Sciatic Scoliotic List Groups.
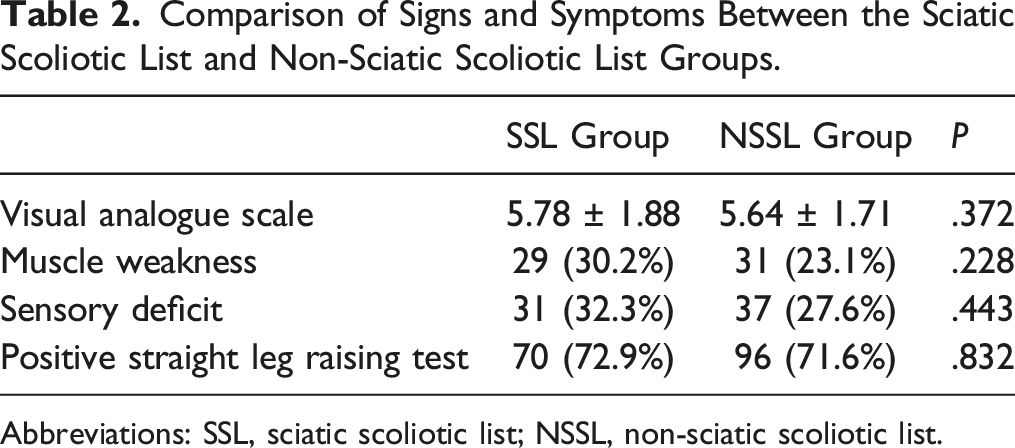
Abbreviations: SSL, sciatic scoliotic list; NSSL, non-sciatic scoliotic list.
In the SSL group, the CA was 12.5° ± 5.3° (4.2°-31.2°), TS was 26.2 ± 17.9 mm (.0-88.2 mm), and AVT was 31.7 ± 16.0 mm (1.18-8.58 mm). In 46 patients, the apical vertebra was T1, and in the other patients, it was T5–L2. The distribution of apical vertebrae is shown in Figure 1. According to the Nash-Moe grading of vertebral rotation, 71 cases (74.0%) of apical vertebrae were grade 0, 22 cases were grade 1, and 3 cases were grade 2, showing that the apical vertebrae had a neutral position or very small rotation. Distribution of apical vertebra at T5–L2.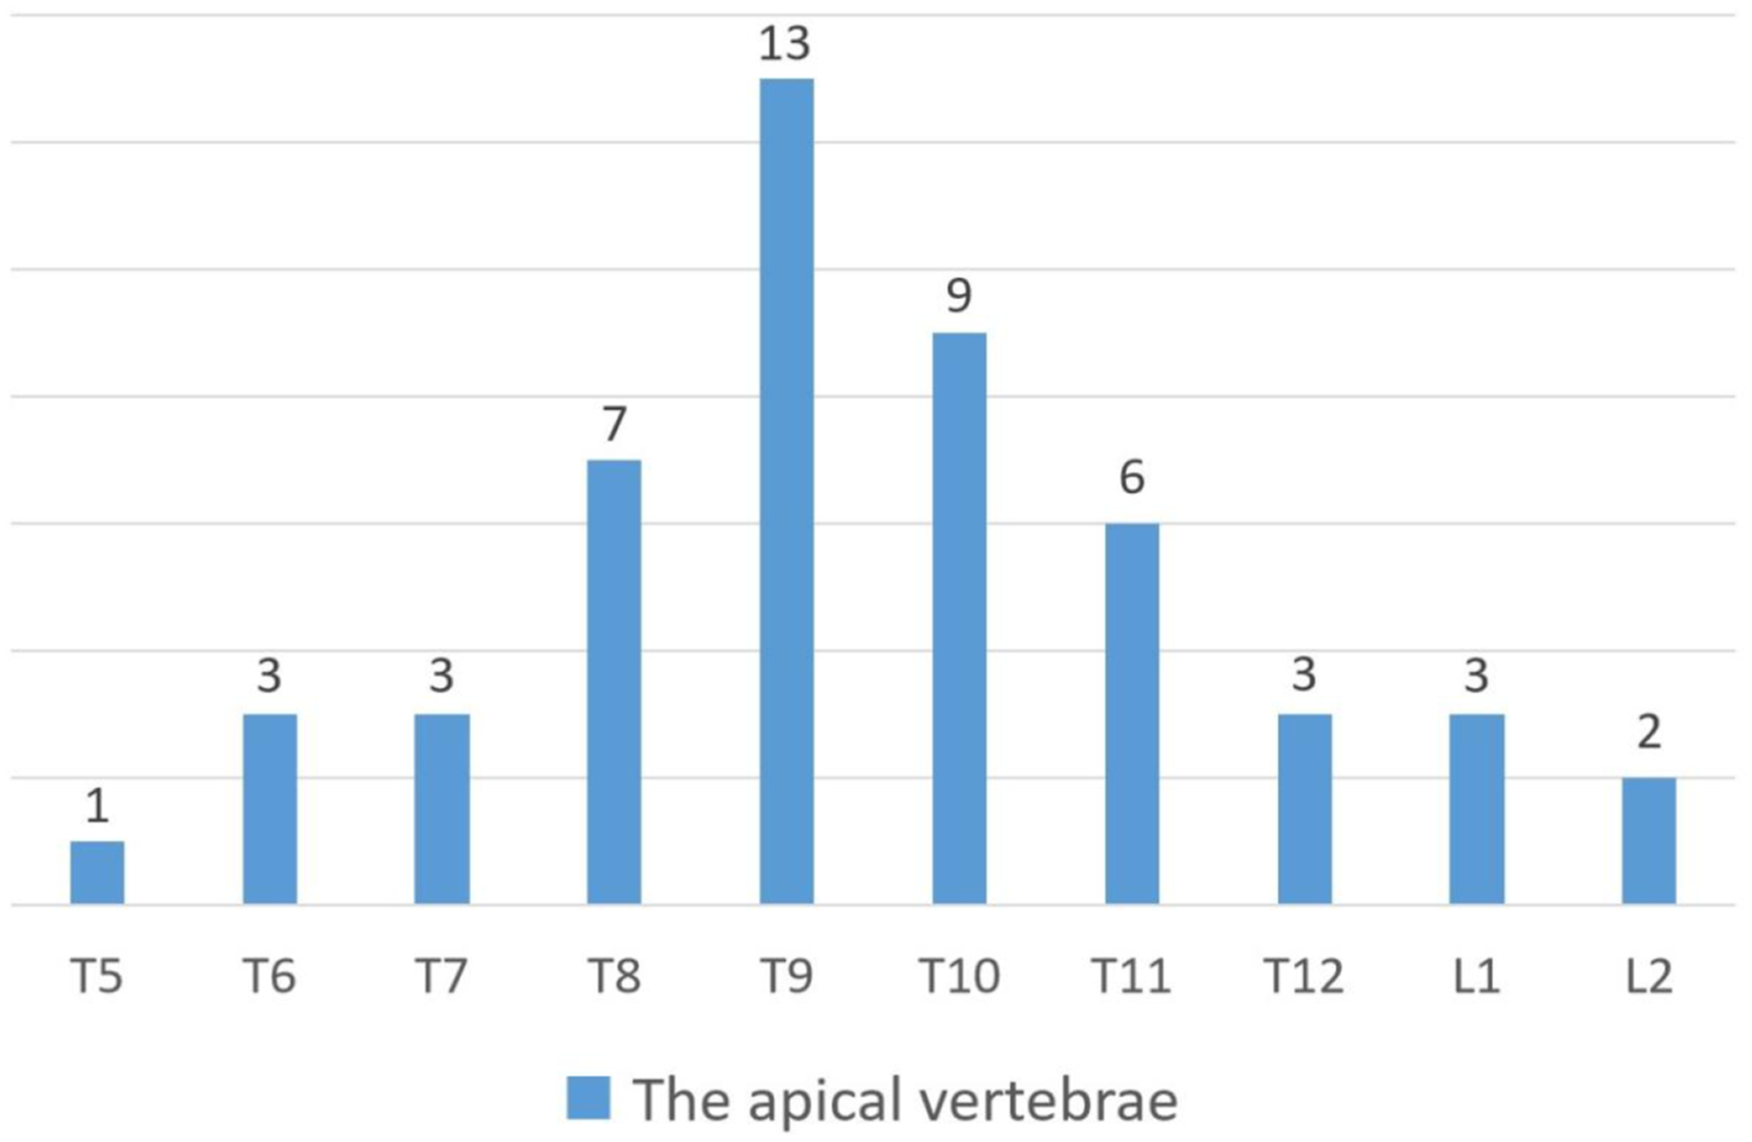
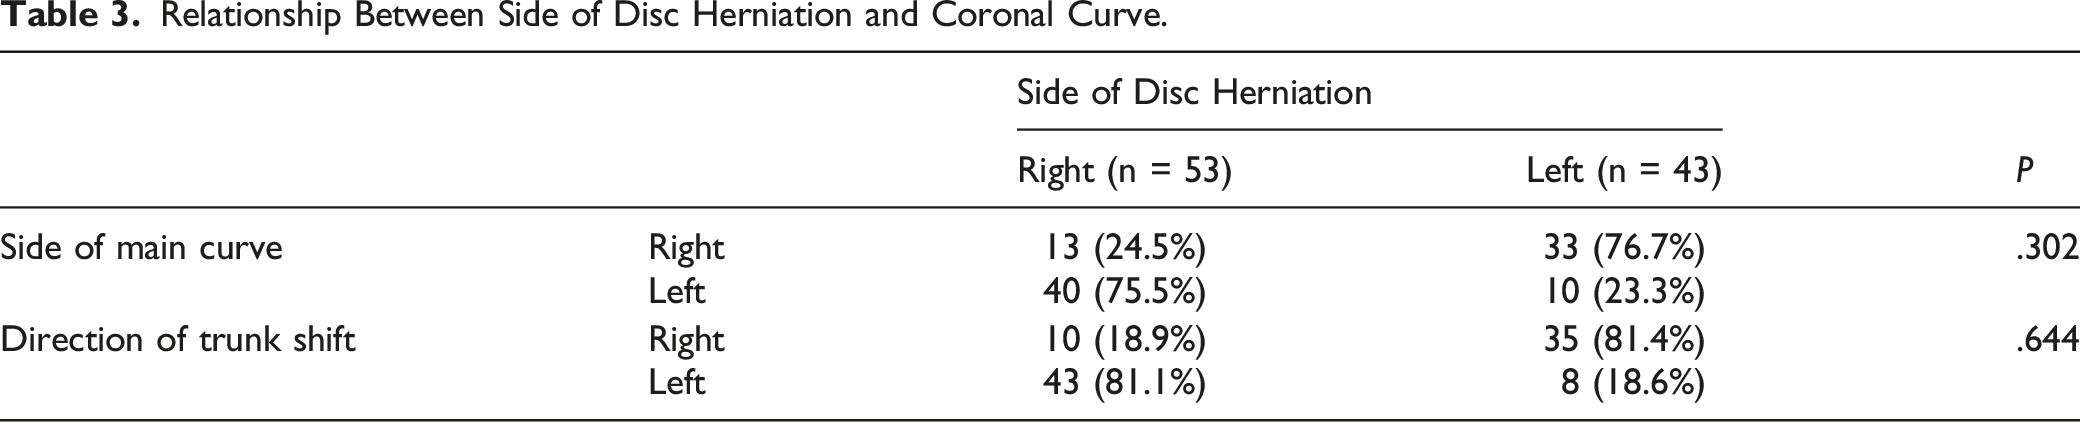
Relationship Between Side of Disc Herniation and Coronal Curve.
Comparison of Segment and Side of Disc Herniation Between the Sciatic Scoliotic List and Non-Sciatic Scoliotic List groups.
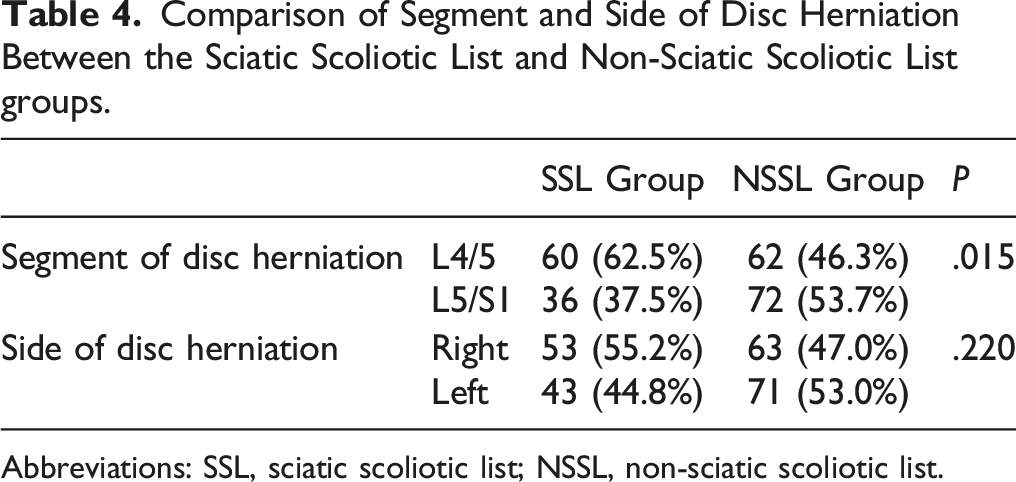
Abbreviations: SSL, sciatic scoliotic list; NSSL, non-sciatic scoliotic list.
Comparison of Sagittal Parameters Between the Three Groups.
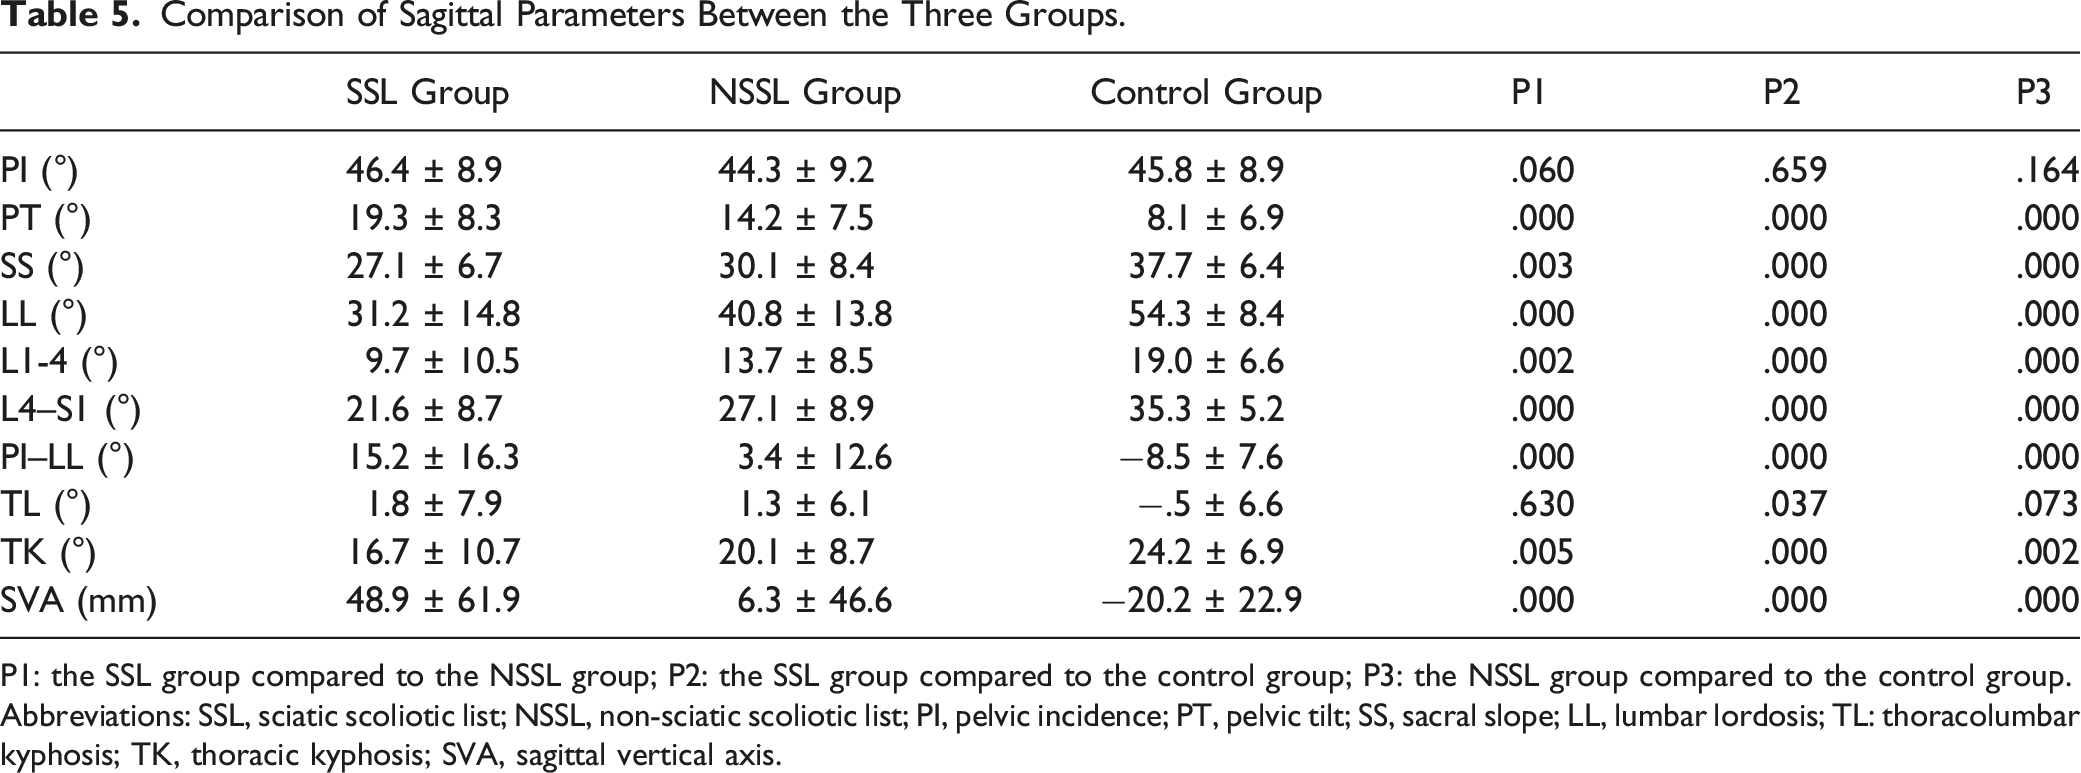
P1: the SSL group compared to the NSSL group; P2: the SSL group compared to the control group; P3: the NSSL group compared to the control group.
Abbreviations: SSL, sciatic scoliotic list; NSSL, non-sciatic scoliotic list; PI, pelvic incidence; PT, pelvic tilt; SS, sacral slope; LL, lumbar lordosis; TL: thoracolumbar kyphosis; TK, thoracic kyphosis; SVA, sagittal vertical axis.
Classification
According to the positional relationship between vertebrae and CSVL, the coronal curve of SSL can be divided into two types, Types 1 and 2.
Type 1: The shifts of the lumbar and thoracic vertebrae (T4-T12) are on the same side as the CSVL. Type 1 was observed in 95.8% (91/96) of all patients.
Type 1A: The apical vertebra is T1 (Figure 2). Examples of a Type 1A curve. (A) Radiograph of a 30-year-old man diagnosed with L4/5 left disc herniation. The coronal curve has a long thoracolumbar scoliosis, CA = 22.8°. There is a shift in all the vertebrae to the left side of the CSVL, and T1 is the farthest vertebra from the CSVL, AVT = 59.9 mm, TS = 57.7 mm. No rotation of the vertebrae is observed. In the sagittal plane, PI = 46.8°, PT = 17.2°, LL = 28.1°, TK = 11.3°, and SVA = 78.9 mm. The thoracolumbar curve has lost the normal physiological curvature, and is almost a straight line, which is why it is called the “straight line sign”. (B) Radiograph of a 42-year-old man diagnosed with L4/5 right disc herniation. T1 is the apical vertebra. CA = 21.5°, AVT = 71.7 mm, TS = 71.7 mm, PI = 50.6°, PT = 24.1°, LL = 36.4°, TK = 28.6°, and SVA = 41.0 mm. Abbreviations: CA, Cobb’s angle; CSVL, central sacral vertical line; TS, trunk shift; AVT, apical vertebral translation; PI, pelvic incidence; PT, pelvic tilt; LL, lumbar lordosis; TK, thoracic kyphosis; SVA, sagittal vertical axis.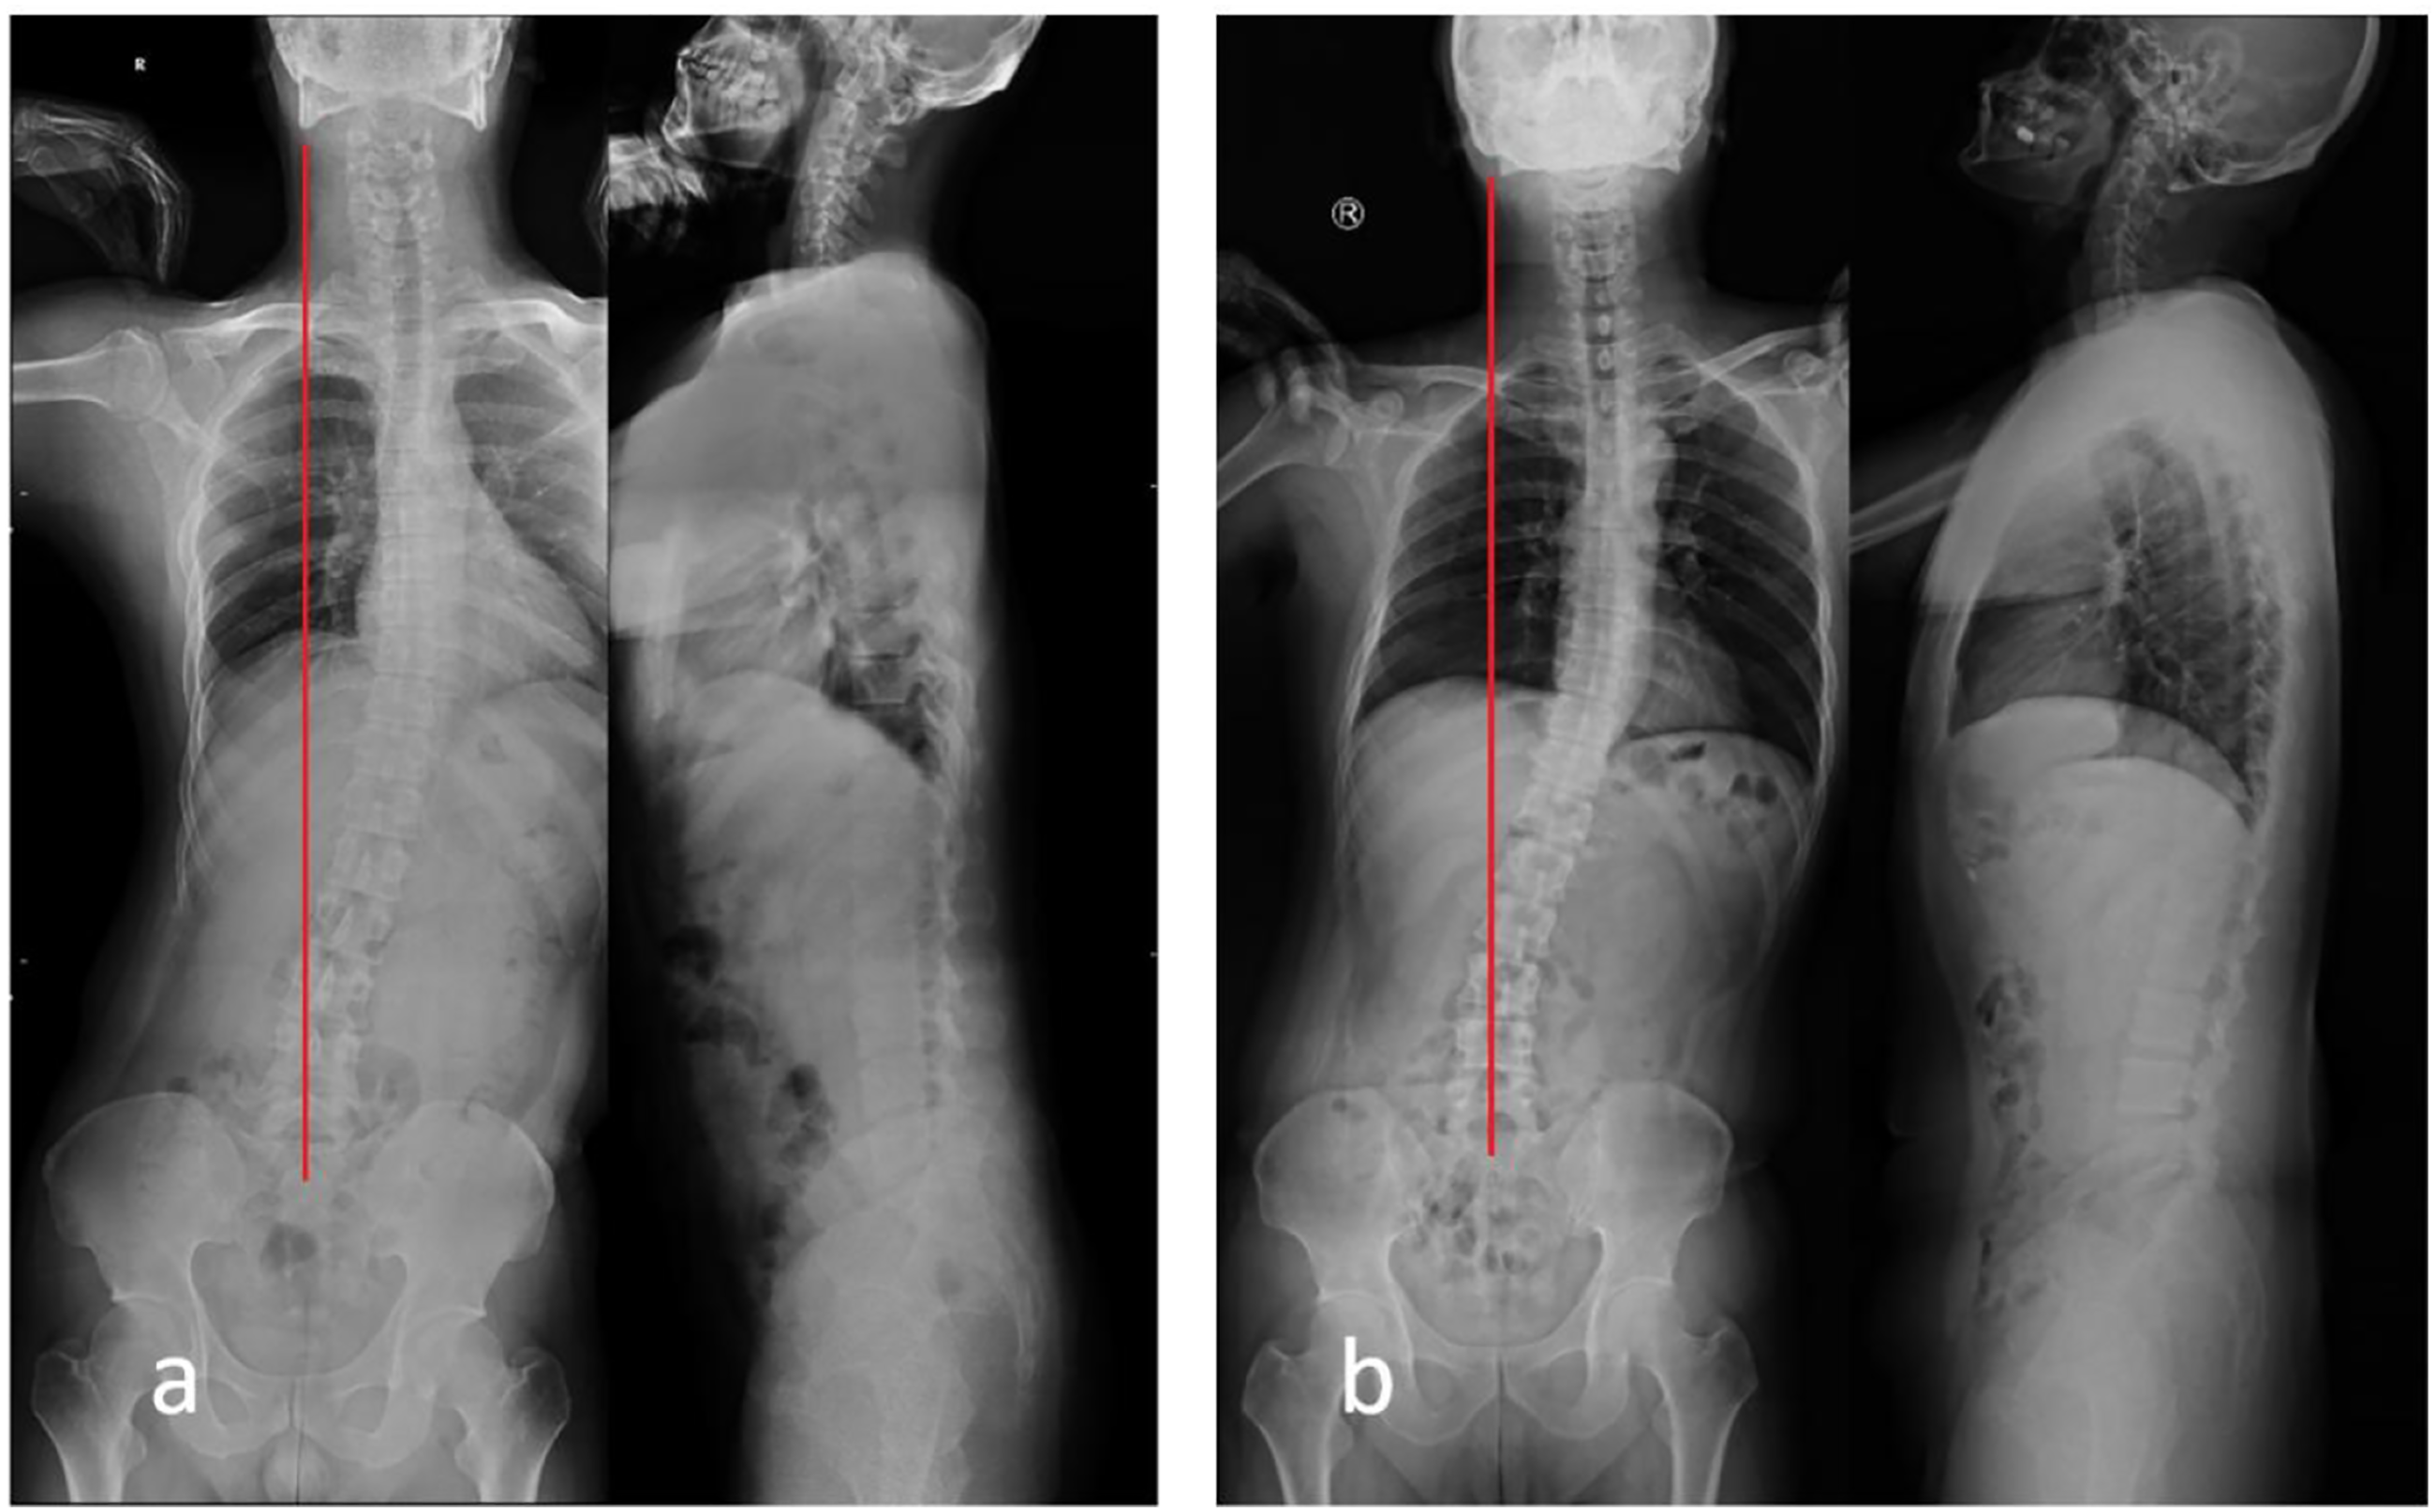
Type 1A was found in 45.8% (44/96) of all patients. From L5 to T1, the deviation of the vertebrae from the CSVL gradually increased. TS = 37.0 ± 15.6 (17.1-88.2) mm, CA = 10.9 ± 4.6 (4.2-22.8)°. According to the Nash-Moe grading of vertebral rotation, 33 cases (75.0%) of apical vertebrae were grade 0, 9 cases were grade 1, and 2 cases were grade 2.
Type 1B: The apical vertebra is between T5 and L1 (Figure 3). Examples of a Type 1B curve. (A) Radiograph of a 21-year-old man diagnosed with L4/5 right disc herniation. The coronal curve has a long thoracolumbar scoliosis, CA = 31.2°. There is a shift of the entire vertebral spine to the left side of the CSVL, and T10 is the farthest vertebra from the CSVL, AVT = 61.0 mm and TS = 38.3 cm. No rotation of vertebrae is seen. In the sagittal plane, PI = 63.5°, PT = 39.7°, LL = 8.5°, TK = 6.2°, and SVA = 162.0 mm. The “straight line sign” can be observed. (B) Radiograph of a 33-year-old woman diagnosed with L4/5 left disc herniation. T9 is the apical vertebra. CA = 15.7°, AVT = 43.6 mm, TS = 27.4 mm, PI = 42.5°, PT = 17.2°, LL = 32.2°, TK = 24.1°, and SVA = 34.6 mm. Abbreviations: CA, Cobb’s angle; CSVL, central sacral vertical line; TS, trunk shift; AVT, apical vertebral translation; PI, pelvic incidence; PT, pelvic tilt; LL, lumbar lordosis; TK, thoracic kyphosis; SVA, sagittal vertical axis.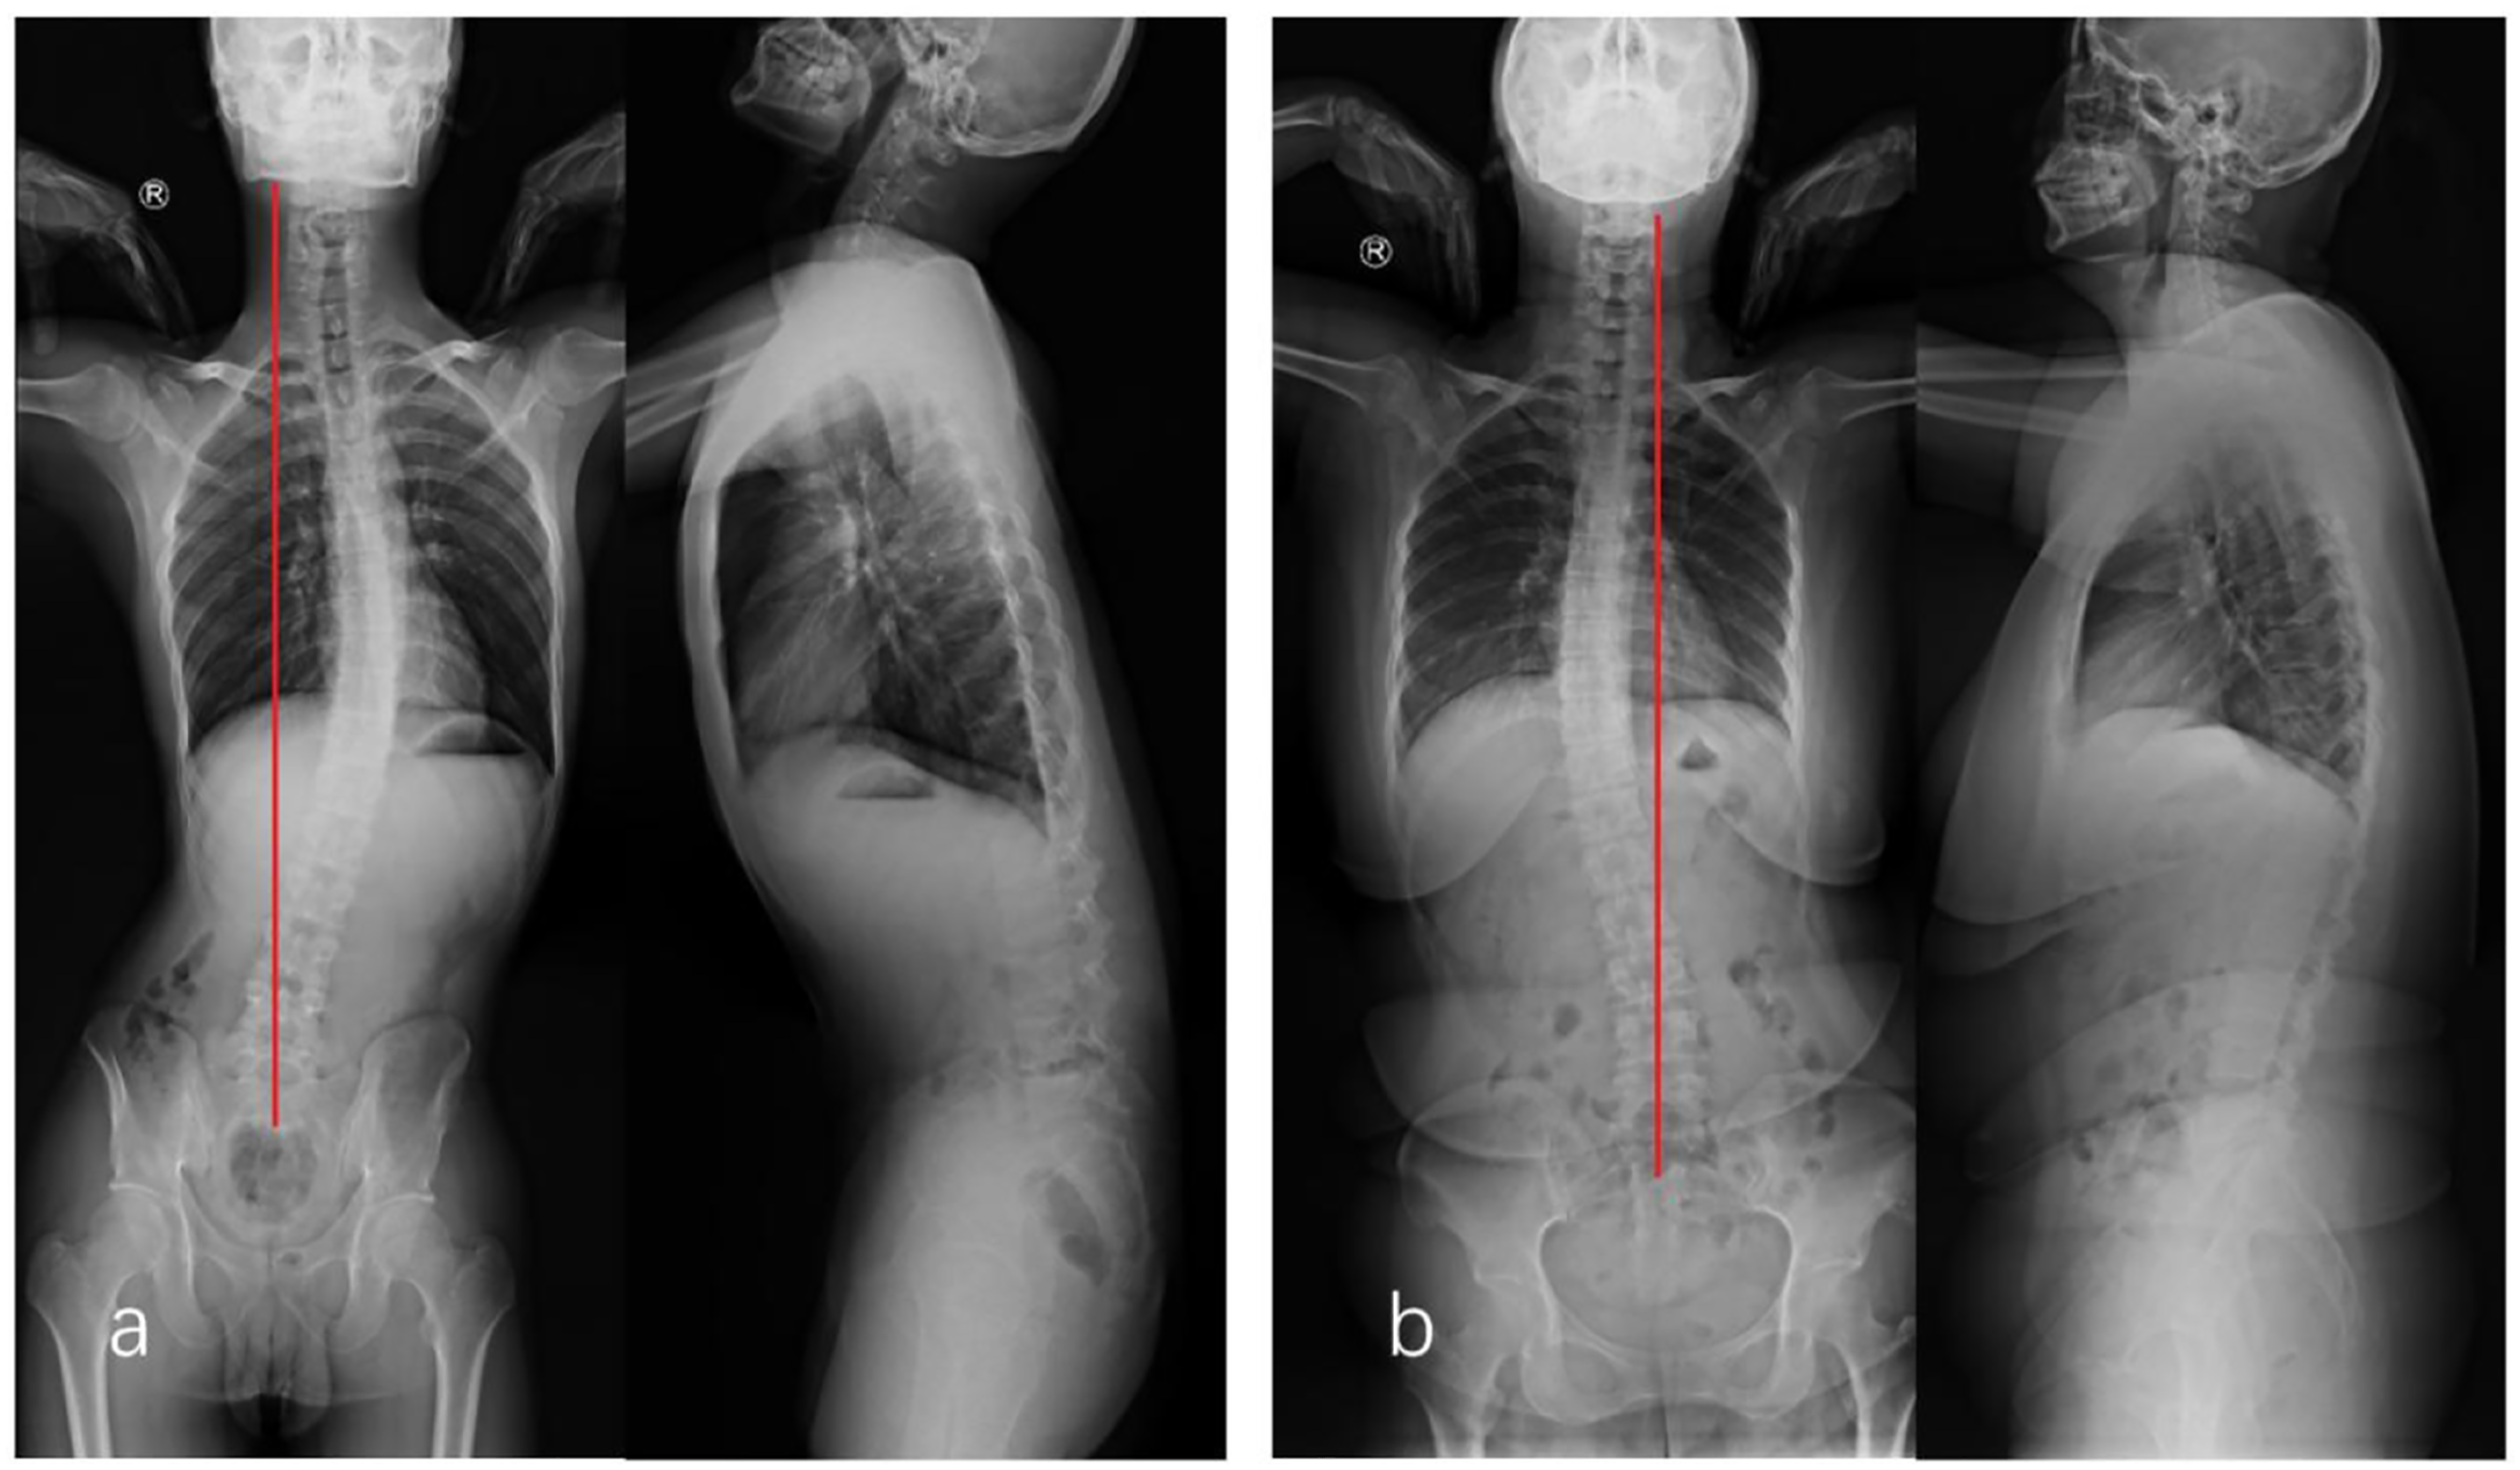
Type 1B was observed in 49.0% (47/96) of the patients. The vertebrae above the apical vertebra approaches the CSVL, and C7 crossed the CSVL in five patients. TS = 17.7 ± 14.4 (.0-63.2) mm, which is smaller than that in Type 1A (P = .000), and CA = 13.7 ± 5.5 (6.0-31.2)°, which is larger than that in Type 1A (P = .008). There are no significant differences in sagittal features between Type 1A and Type 1B. Apical vertebrae were Nash-Moe grade 0 in 35 cases (74.5%), 11 cases were grade 1, and 1 case was grade 2.
Type 2: Lumbar and thoracic vertebral shift (T4–T10) is on the opposite side of the CSVL (Figure 4). Examples of a Type 2 curve. (A) Radiograph of a 35-year-old man diagnosed with L5/S1 right disc herniation. CA = 9.9° and TS = 28.6 mm. Lumbar vertebrae are shifted to the right side of the CSVL, L2 is the apical vertebra of the lumbar curve, and lumbar AVT = 10.5 mm. Thoracic vertebrae are shifted to the left side of the CSVL, T1 is the apical vertebra of the thoracic curve, and thoracic AVT = 31.7 mm. In the sagittal plane, PI = 32.9°, PT = 3.3°, LL = 48.0°, TK = 23.6°, and SVA = −23.3 mm (B) Radiograph of a 25-year-old man diagnosed with L4/5 right disc herniation. CA = 20.8°, TS = 2.5 mm, lumbar AVT = 20.9 mm, thoracic AVT = 11.1 mm, PI = 41.4°, PT = 3.2°, LL = 51.9°, TK = 18.0°, and SVA = 7.5 mm. Abbreviations: CA, Cobb’s angle; CSVL, central sacral vertical line; TS, trunk shift; AVT, apical vertebral translation; PI, pelvic incidence; PT, pelvic tilt; LL, lumbar lordosis; TK, thoracic kyphosis; SVA, sagittal vertical axis.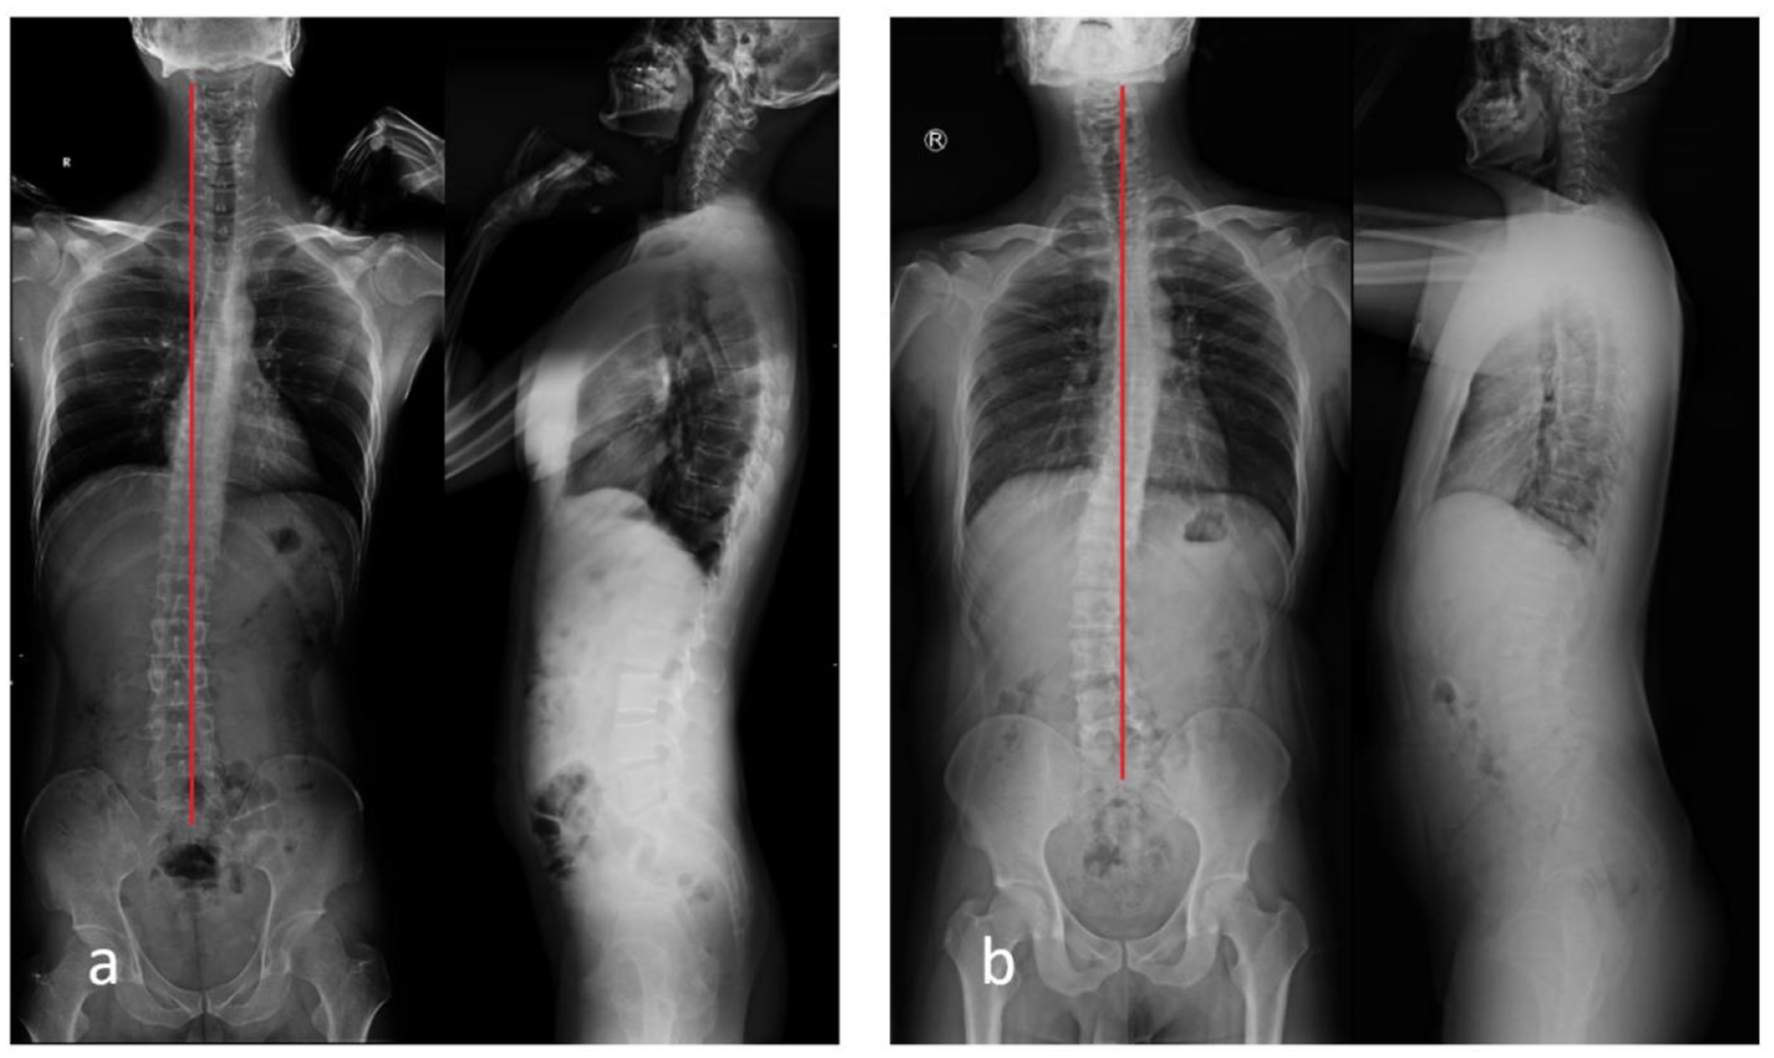
Comparison of Coronal and Sagittal Parameters Between the Three Types.
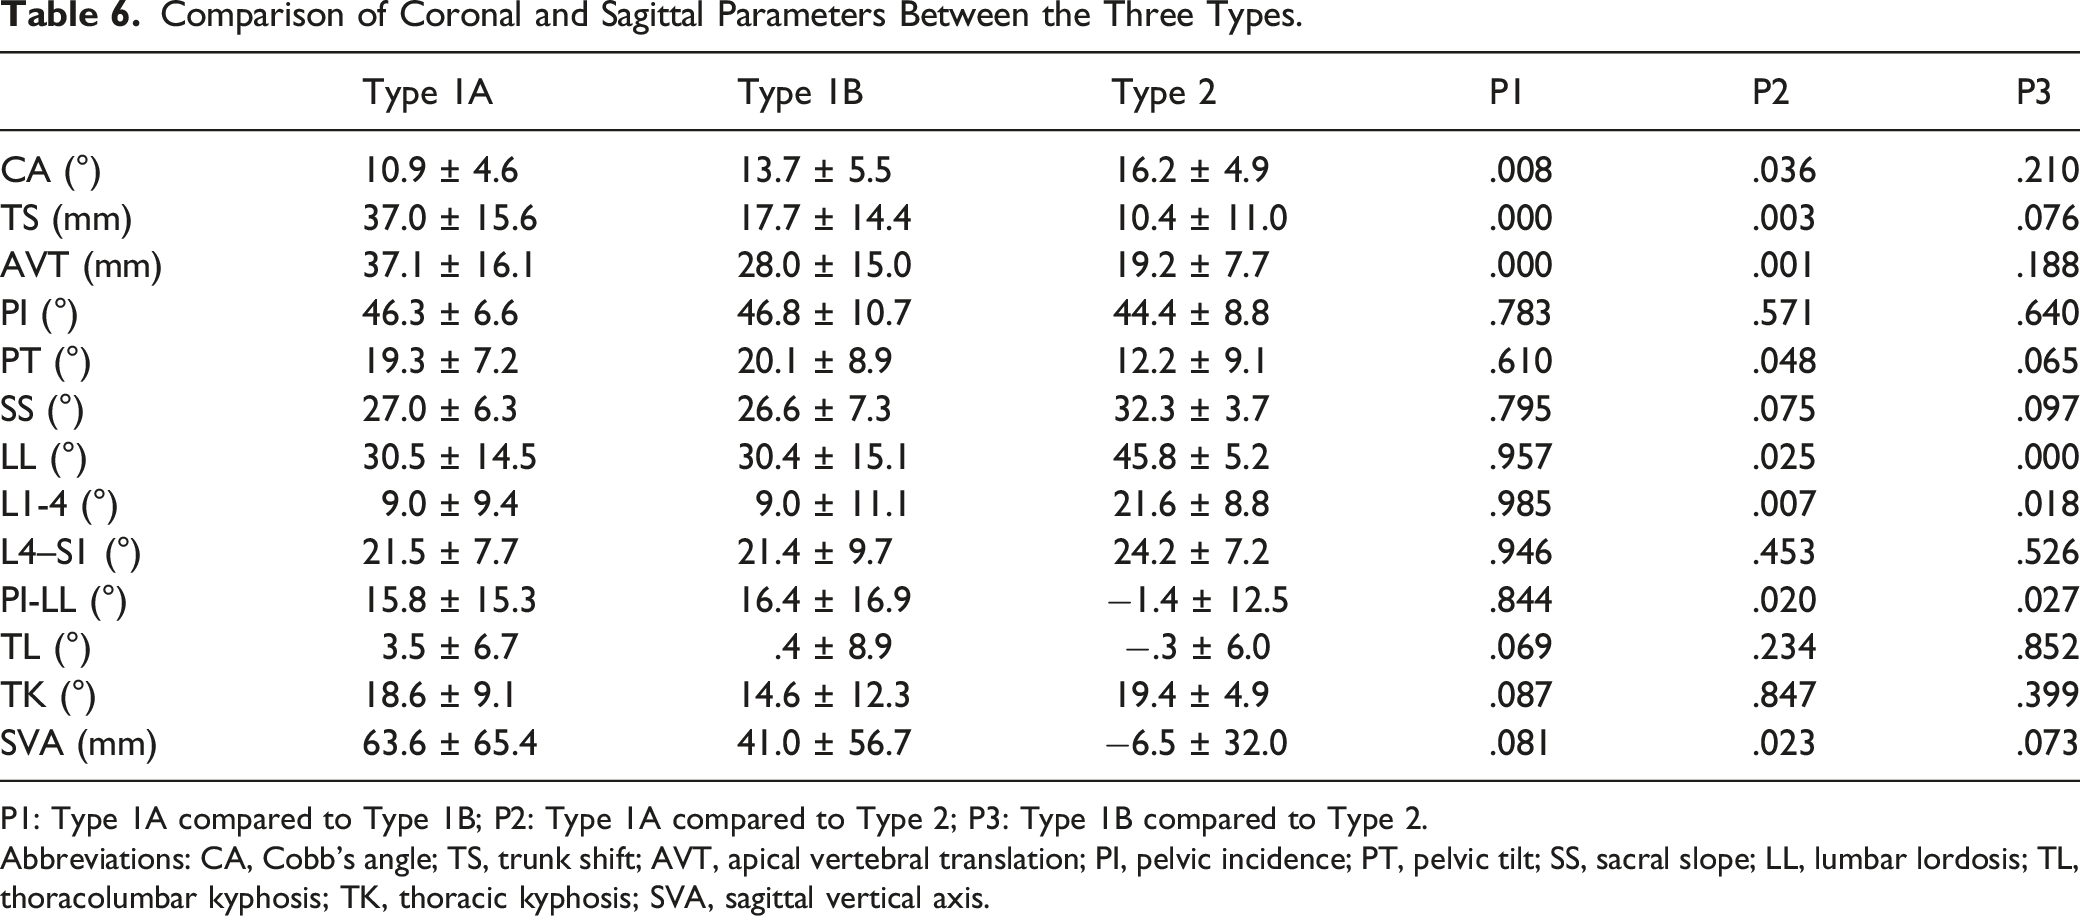
P1: Type 1A compared to Type 1B; P2: Type 1A compared to Type 2; P3: Type 1B compared to Type 2.
Abbreviations: CA, Cobb’s angle; TS, trunk shift; AVT, apical vertebral translation; PI, pelvic incidence; PT, pelvic tilt; SS, sacral slope; LL, lumbar lordosis; TL, thoracolumbar kyphosis; TK, thoracic kyphosis; SVA, sagittal vertical axis.
Discussion
Sciatic scoliosis is considered a nonstructural scoliosis secondary to nerve irritation. In our study, the incidence of SSL was 16.9% (96/568) in the patients with single-segment LDH. The actual incidence should be higher because not all patients underwent full-length spine radiography. Since the treatment principles for sciatic scoliosis are different from those for idiopathic or degenerative scoliosis, it is important to identify the cause of scoliosis. Although most patients with LDH have typical clinical features, such as lower back pain, sciatica, and positive straight leg raising test, some patients do not have these features. Akhaddar et al 10 reported a case of LDH with isolated painless scoliosis. Zhu et al 11 reported that 4 of 29 adolescents with LDH who had a scoliotic posture were misdiagnosed with idiopathic scoliosis at the initial diagnosis. Therefore, identifying the characteristics of this type of postural scoliosis is helpful for clinical diagnosis.
Zhang et al 6 analyzed 41 adults with LDH who had AVT>2 cm, with an average age of 34.5 years, an average CA of 15.9°, and a TS of 45.5 mm. Wu et al 8 measured 42 adults with LDH, with an average CA of 16.5° and TS of 26 mm. These findings are similar to those of our study. In the sagittal plane, most authors found an increase in PT and SVA and a decrease in LL and TK.5,6,12,13 Some patients lost their normal S-shaped sagittal curve and showed the “straight line sign”. We also found that disc herniation at the L4/5 level was more likely to cause SSL, which was consistent with the research findings of Kim et al. 5 The possible reason for this phenomenon is a relatively wider spinal canal at L5/S1 and the lack of a movable segment below L5/S1.
According to Finneson’s hypothesis, when disc herniation is lateral to the nerve root, the list is toward the opposite side of the sciatica. When the herniation is medial to the nerve root, the list is toward the opposite side of the sciatica (Figure 5).
3
However, this hypothesis was based on theoretical analysis, which has not been confirmed by current studies, and trunk list did not appear to be correlated with the presence of sciatic root tension.3,5,7,8,11,14 Previous researches reported that 66.7-84.6% patients with LDH had disc herniation at the convex side of scoliosis,11,14 and 75.9-77.2% patients with coronal imbalance presented trunk shift to the contralateral side of the disc herniation.5,9 We found that 76.0% (73/96) of patients had disc herniation at the convex side of lumbosacral scoliosis and 81.3% (78/96) of patients had disc herniation at the opposite side of the trunk shift. The convex side of the lumbosacral scoliosis could enlarge the intervertebral foramen, which might relieve nerve compression. Porter et al
15
analyzed the mechanism of sciatic scoliosis and concluded that the herniated disc was reduced in size by stretching or inward bulging at the convex side of the scoliosis. The authors refer to this phenomenon as autonomic decompression. Zhu et al
11
proposed that trunk shift toward the opposite side of the disc herniation could change weight-bearing on the legs, and a small amount of weight supported by the affected leg might alleviate nerve root irritation. We agree with this theory. Relationship between scoliosis and relief of nerve root compression. (A) The disc herniation is medial to the nerve root, and the convex side of the scoliosis is opposite the side of herniation. (B) The disc herniation is lateral to the nerve root, and the convex side of the scoliosis is the same as the side of herniation.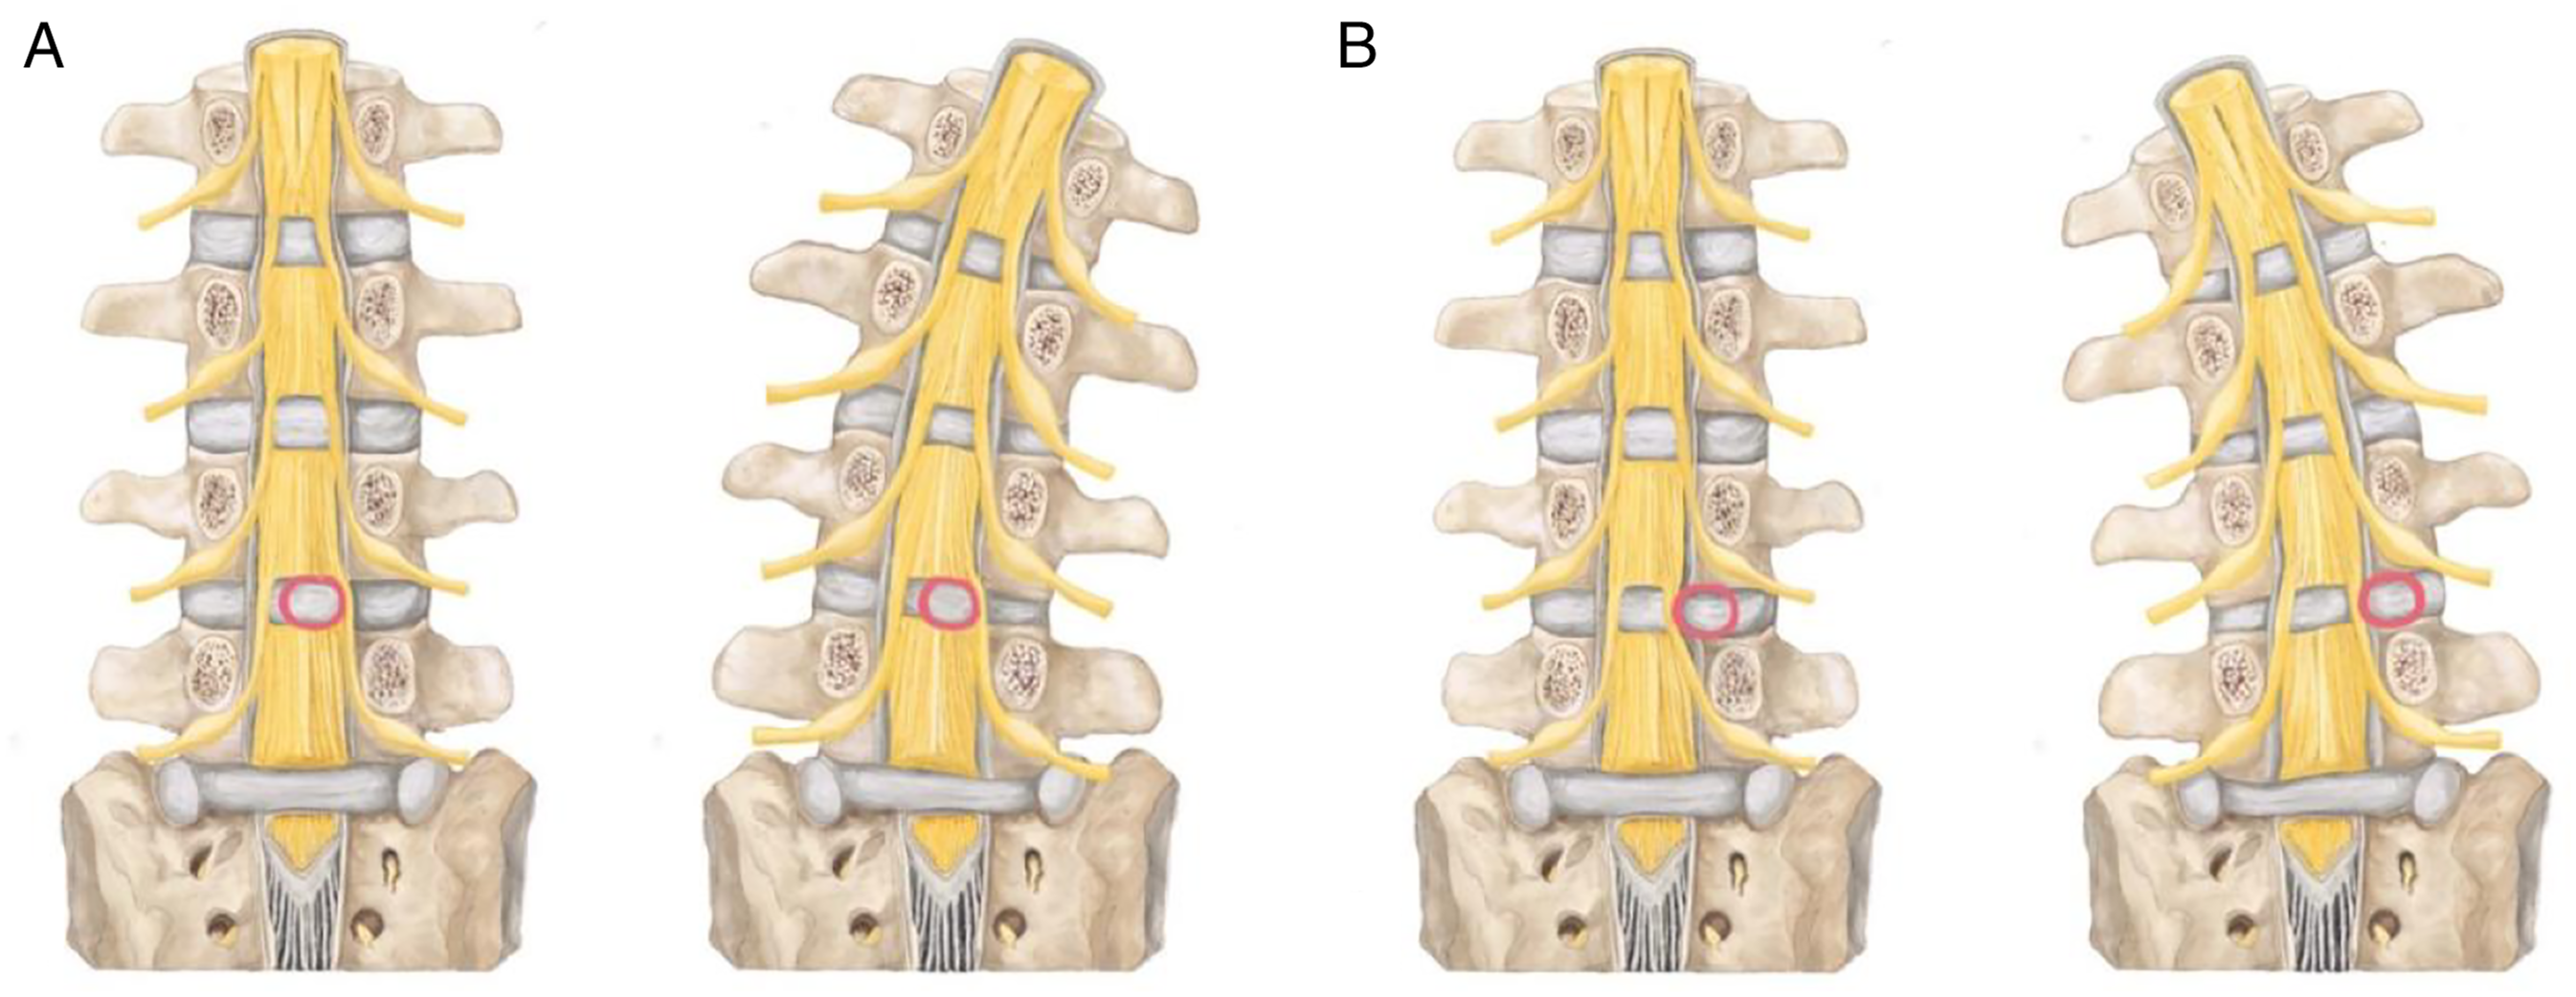
We found that most coronal curves of the SSL were Type I, and the shifts of the lumbar and thoracic vertebrae (T4-T12) were on the same side as the CSVL. In addition to scoliosis, the curve showed decreased thoracic kyphosis and lumbar lordosis. The main muscles that flex the lumbar spine ipsilaterally include the psoas major, quadratus lumborum, and erector spinae muscles. At the same time, the erector spinae could extend the thoracic vertebrae; therefore, we considered that these muscles played an important role in SSL. Tension of the erector spinae, quadratus lumborum, and psoas major on the ipsilateral side could result in a Type 1A curve. The apical vertebra of the Type 1B curve was located at T5 or below. The iliocostalis lumborum originated from the lateral crest of the sacrum, medial end of the iliac crest, and inserted into the angle of ribs 5-12, transverse processes of vertebrae L1–L4. Therefore, we speculated that the contraction of the ipsilateral iliocostalis lumborum caused TS. To correct the coronal imbalance, the contralateral longissimus and spinalis contracted to form a Type 1 B curve (Figure 6). Schematic diagram of sciatic scoliosis list. (A) The contraction of the erector spinae, quadratus lumborum, and psoas major on the ipsilateral side could result in a Type 1A curve. (B) The contraction of the longissimus and spinalis on the contralateral side could result in a Type 1B curve.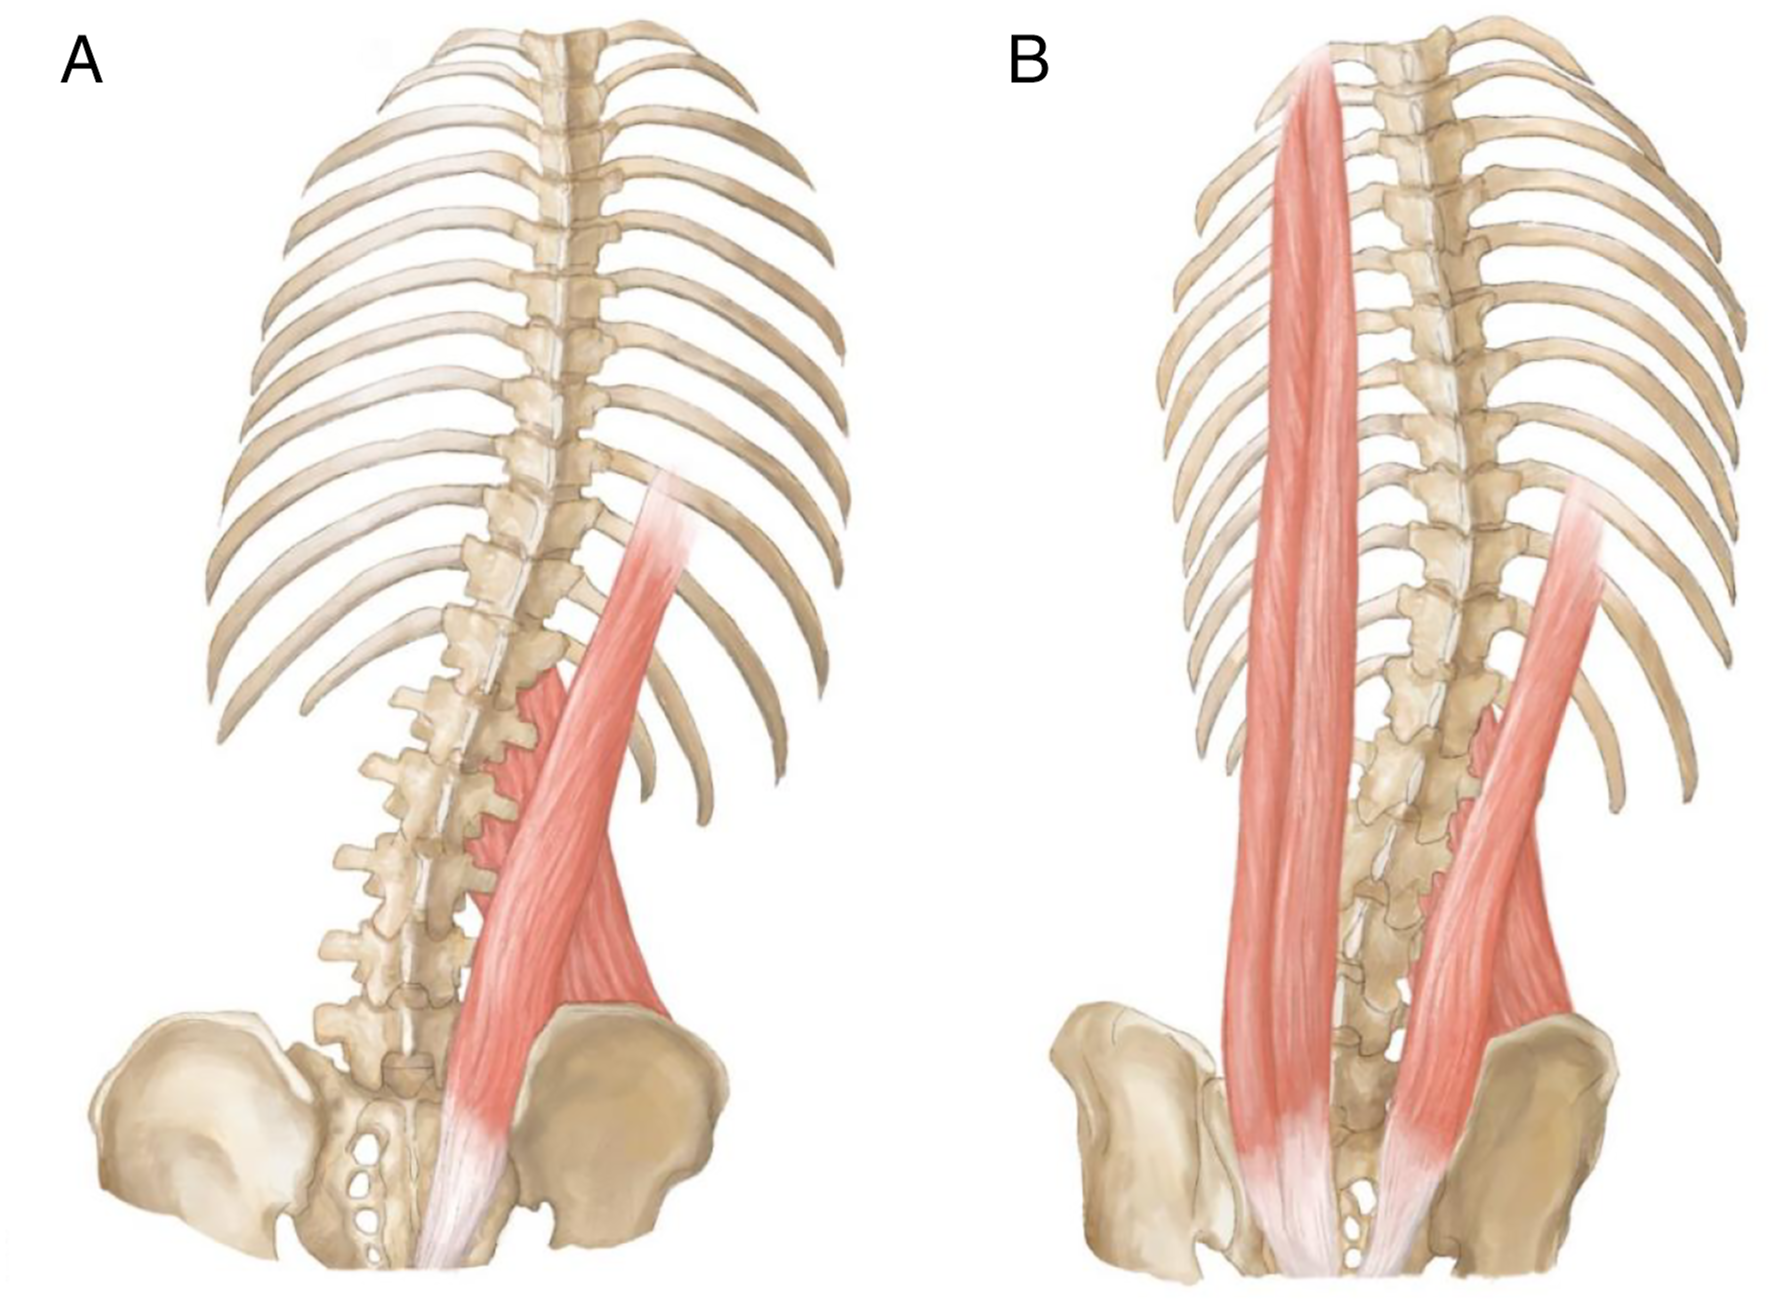
The Type 1A curve was similar to that of Pisa syndrome. Pisa syndrome was defined as a reversible lateral bending of the trunk with a tendency to lean to one side, which is commonly seen in patients with Parkinson’s disease. 16 One hypothesis suggested central mechanisms, whereby Pisa syndrome was considered to be caused by alterations in sensory-motor integration pathways. Liang et al 13 used electromyography to record the mixed recruitment potential of the paraspinal muscles. The largest recruitment potential of the spinal musculature was decreased in patients with LDH. The psoas major, quadratus lumborum, and erector spinae were not innervated by the L4-S1 nerve root; therefore, the postural change of LDH could not be simply explained by only peripheral mechanisms. We believe that this was caused by complex central regulatory mechanisms. The body receives pain stimulation and changes the curve of the spine by adjusting the tension of the paravertebral muscles, thereby reducing the pressure on the nerves.
To exclude the influence of degenerative scoliosis, young subjects were selected for this study; however, we believe the elderly could also develop SSL. The Type 1B curve is similar to the Lenke 1A curve. 17 The Type 2 curve occasionally mimics degenerative scoliosis. Following thorough history taking and careful physical examination, some clinical findings related to LDH were revealed. Previous studies reported that more than 90% of patients achieved resolution of scoliosis within 6 months after percutaneous endoscopic lumbar discectomy.6,9 Since SSL is not a structural imbalance, if it is difficult to identify, we recommend a full-length spine radiography in the supine position or nerve root block. If nerve root block is performed, after pain relief, both the scoliosis and trunk shift would be resolved, and an SSL diagnosis would be more likely.
To our knowledge, our study included the largest sample of patients with SSL. However, this study has several limitations. First, this was a retrospective radiological study that lacked follow-up data. Although our subjects denied a history of scoliosis, we could not completely rule out scoliosis due to the lack of spinal imaging before LDH onset, especially for Type 2 patients. Second, the sample size was not sufficiently large and selection bias may have occurred. In addition, we did not perform electrophysiological examination of the paravertebral muscles to support our hypothesis. At present, there are only a few studies on SSL, and a large sample size is warranted to confirm our classification.
Conclusion
SSL is common in patients with LDH. The typical features of the SSL curve are long thoracic or thoracolumbar curves, with a relatively straight sagittal profile and little rotation. Moreover, the shifts of the lumbar and thoracic vertebrae (T4–L5) are on the same side as the CSVL. Understanding the features of the SSL curve can help to differentiate it from other types of structural scoliosis. Further studies are required to confirm the complex mechanisms underlying SSL.
Footnotes
Declaration of Conflicting Interests
The author(s) declared no potential conflicts of interest with respect to the research, authorship, and/or publication of this article.
Funding
The author(s) disclosed receipt of the following financial support for the research, authorship, and/or publication of this article: This study is supported by the capital health research and development of special fund, 2022-2Z-40713.