
Abstract
Study design/setting
Retrospective cohort.
Objective
Adult spinal deformity (ASD) corrective surgery is often a highly invasive procedure portending patients to both immediate and long-term complications. Therefore, we sought to compare the economic impact of certain complications before and after 2 years.
Methods
ASD patients with minimum 3-year data included. Complication groups were defined as follows: any complication, major, medical, mechanical, radiographic, and reoperation. Complications stratified by occurrence before or after 2 years postoperatively. Published methods converted ODI to SF-6D to QALYs. Cost was calculated using CMS.gov definitions. Marginalized means for utility gained and cost-per-QALY were calculated via ANCOVA controlling for significant confounders.
Results
244 patients included. Before 2Y, complication rates: 76% ≥1 complication, 18% major, 26% required reoperation. After 2Y, complication rates: 32% ≥1 complication, 4% major, 2.5% required reoperation. Major complications after 2 years had worse cost-utility (.320 vs .441, P = .1). Patients suffering mechanical complications accrued the highest overall cost ($130,482.22), followed by infection and PJF for complications before 2 years. Patients suffering a mechanical complication after 2 years had lower cost-utility ($109,197.71 vs $130,482.22, P = .041). Patients developing PJF after 2 years accrued a better cost-utility ($77,227.84 vs $96,873.57; P = .038), compared to PJF before 2 years.
Conclusion
Mechanical complications had the single greatest impact on cost-utility after adult spinal deformity surgery, but less so after 2 years. Understanding the cost-utility of specific interventions at certain timepoints may mitigate economic burden and prophylactic efforts should strategically be made against early mechanical complications.
Introduction
Surgical intervention has often proven to restore significant quality of life to patients with adult spinal deformity (ASD), mitigating the high costs of these naturally invasive procedures.1,2 ASD patients encompass a complex population, in terms of medical comorbidities and functional status, often leading to an increased risk of complications that can prevent a favorable economic outcome.3,4 Moreover, this risk is compounded by the severity of baseline deformity present and the degree of surgical intervention necessary to correct such deformity.5,6 Complication rates following corrective surgery for ASD can be extensive, with some studies reporting rates as high as 71%. Nonetheless, the nature of these complications vary with respect to their incidence and cost-utility.
The presence of preoperative risk factors may increase the incidence of certain complications after ASD surgery, and different timepoints throughout the postoperative course beget different complications. Prior literature has shown that medical comorbidities, older age, higher BMI, and increased frailty play a significant role in the development of perioperative complications within 90 days of ASD surgery.7-9 These often occur in the form of urinary tract infections (UTIs), venous thrombo-embolism (VTEs), infections, and neurologic complications. On the contrary, longer-term complications, which occur greater than several months postoperatively, tend to be radiographic or mechanical in nature, and these have a separate host of risk factors that contribute to their occurrence.
The occurrence of certain complications at specific timepoints may alter the trajectory of improvement.7,9 Cost-utility is defined as the cost of surgical intervention divided by the quality-adjusted life years gained. Complications from surgical intervention may require additional hospitalizations and/or treatment, further driving up costs and negatively affecting quality of life and clinical outcomes. The purpose of this investigation was to stratify complications occurring before and after the 2-year mark from ASD surgery, to define overall costs and clinical improvement gained from surgery, in order to determine the cost-utility in patients who sustained various short- and long-term complications. We hypothesize that mechanical and radiographic complications, as well as earlier (<2 years) complications, will have a more significant impact on cost-utility after ASD surgery.
Methods
Data Source and Study Design
This is a retrospective analysis of a prospectively-collected, single-center database containing ASD patients who were enrolled from 2012 to 2019. Institutional Review Board (IRB) approval was obtained prior to enrollment and all patients provided informed consent. General enrollment criteria, including a minimum of three levels fused during surgery, and definition of ASD for this dataset have been described in previous publications, which have also effectively used this cohort to study aspects of clinical management and healthcare policy in the setting of spinal deformity.10,11 The inclusion criteria of the present study required operative ASD patients with complete demographic and radiographic data preoperatively, as well as surgical, radiographic data and complications reported at least 3 years and up to 5 years postoperatively. Patients with a primary diagnosis of acute trauma, infection, or oncologic etiologies were excluded. Patients undergoing a surgery that did not include sagittal or coronal correction of either lumbar or global parameters were also excluded.
Data Collection and Radiographic Assessment
For patients eligible for inclusion, we collected demographics (age, gender, race, BMI, frailty [described using the Passias modified ASD Frailty Index], and comorbidities) at initial presentation, surgical characteristics [estimated blood loss (EBL), operative time, number of levels fused, whether decompression was performed, and osteotomies]. 10 Functional outcome assessments consisted of the Oswestry disability index (ODI) and Scoliosis Research Society 22-item questionnaire (SRS-22) and were collected preoperatively, at 3-month, 6-month, 1-year, 2-year, and 3-year follow-up. Lateral spine radiographs were used to assess radiographic parameters at baseline and follow-up intervals. All images were analyzed with SpineView® (ENSAM, Laboratory of Biomechanics, Paris, France).12-14 Spinopelvic radiographic parameters assessed included pelvic tilt (PT: the angle between the vertical and the line through the sacral midpoint to the center of the 2 femoral heads), the mismatch between pelvic incidence and lumbar lordosis (PI-LL), and the sagittal vertical axis (SVA: C7 plumb line relative to the postero-superior corner of S1). 15
Classifying Postoperative Complications
Eight complication groups were defined in our cohort: 1. Any – Any Complication 2. Major – Any complication resulting in prolonged hospitalization, readmission, or reoperation 3. Medical – Complications of cardiac, pulmonary, gastrointestinal, infectious, neurologic, or renal etiology, which were not deemed to be a direct result of the index procedure 4. Neurological – motor and sensory deficits, abnormal reflexes or occurrence of neurological signs and symptoms attributed to the procedure 5. Infection – superficial or deep surgical site infections 6. Mechanical – Complications related to the implant, including implant prominence, implant malposition, painful implant, implant failure, interbody dislocation, screw-nerve impingement, screw fracture, rod dislocation, and rod fracture 7. Radiographic – proximal junctional kyphosis (PJK), proximal junctional failure (PJF), adjacent segment disease (ASD) or pseudarthrosis 8. Reoperation – Any Reoperation
Complications in this analysis included mechanical as well as radiographic complications. Radiographic complications included proximal junctional kyphosis (PJK) and proximal junctional failure (PJF). PJK was defined by a PJK angle of < -10° and a PJK angle difference of < -10° from baseline to any time point. PJF was defined using the criteria of Lafage et al: a PJK angle of < -28° and a difference in PJK angle of < -22° from baseline at any follow-up time point. 16
Complications were divided chronologically: before the 2-year follow-up (Before 2Y) or later (after 2Y).
Cost Calculation
In line with prior work, the PearlDiver database was utilized to calculate costs using job order cost accounting (“charge analysis”).17,18 Reflecting both Medicare reimbursement and private insurance, the PearlDiver data is one of the most comprehensive datasets with access to Medicare reimbursement charges, outcome data, and trends. Using mean costs associated with procedures based on 2018 adult spinal deformity diagnosis-related groups, procedural costs for cases, cases with complications and comorbidities (CC), major complications and comorbidities (MCC), and revisions were determined according to CMS.gov manual definitions. 19 Our estimates for 2-year reimbursement consisted of a standardized determination using regression analysis of Medicare pay-scales for all services rendered within a 30-day window, including costs of postoperative complications, outpatient healthcare encounters, revisions and medical related readmissions, as per previously published methods.17,20-22 The World Health Organization (WHO) has determined the threshold value for cost-effectiveness when analyzing cost-utility ratios is one to three times gross domestic product (GDP) per capita.17,23,24 According to the International Monetary Fund, in 2018 (the enrollment of this study was from 2008 to 2017) the United States GDP per capita was $62,606; therefore, $187,818 represents the upper threshold of the United States cost/QALY willingness to pay and was deem ‘Low Cost-Utility.’23-25
Utility Calculation
Utility data was calculated via the difference between baseline and the corresponding ODI score at follow-up time point. Utility data was calculated using ODI converted to SF-6D, using published conversion methods. 26 The utilities were then transformed into Quality Adjusted Life Years (QALYs) using marginalized means controlling for baseline ODI score and characterized as QALYs gained. QALYs were discounted at an annual 3% rate for each time point as recommended by the WHO to account for decline in function associated with aging. 22
Statistical Analysis
Frequency distributions and summary statistics were calculated for all demographic, clinical, surgical, and radiographic variables. The frequency of complications that occurred before or after the 2-year mark were compared. Marginalized means for utility gained and Cost per QALY were calculated, controlling for age, invasiveness (as assessed by the ISSG ASD surgical and radiographic invasiveness index), history of prior fusion, and baseline deformity and disability, and they were assessed via Analysis of Covariance (ANCOVA). 5 All analyses were performed using SPSS software (IBM Corp. IBM SPSS Statistics for Windows, v25.0. Armonk, NY, USA). Statistical tests were two-tailed with significance set to P < .05.
Results
Cohort Overview
Two hundred forty-four operative patients with ASD met inclusion criteria. The mean age in this cohort was 59.4 ± 14.6 years. 77% were female, mean BMI was 27.2 ± 5.4 kg/m2, and mean Charlson Comorbidity Index (CCI) was 1.7 ± 1.7. Mean preoperative radiographic parameters were as follows: pelvic tilt (PT) 24.3°, PI-LL 16.1°, SVA 65.5 mm, and T2-T12 thoracic kyphosis -38.4°. SRS-Schwab modifiers assessed at baseline (BL) identified the following distribution of deformity severity: 37.5% non-pathologic [0], 21.1% moderate deformity [+], and 41.4% marked deformity [++] for PI-LL; 42.0% 0, 27.9% +, and 30.1% ++ for SVA; 35.3% 0, 36.7% +, and 28.1% ++ for PT.
Surgical Characteristics
Mean levels fused was 11.1 ± 3.9, mean EBL was 2041 mL, and mean operative time was 370 min. In terms of surgical approach, .6% (n = 2) underwent an anterior approach, 80.6% underwent a posterior approach, and 18.9% underwent an anterior and posterior (ie, combined) approach. An osteotomy was performed in 79.7% of procedures.
Occurrence of Postoperative Complications Before 2 Years
By the 2-year follow-up, complication rates were as follows: 76% experienced at least one complication and 18% experienced a major complication. Before the 2-year mark, complication type was as follows: 16% medical complications, 16% neurological, 50% radiographic, 5% infection, and 20% mechanical, 26% reoperation. With respect to mechanical complications, 10.9% had implant failure, 7.0% had implant malposition, 4.1% had implant pain or prominence, 8.7% had rod breakage, and 1.6% had screw breakage. In terms of radiographic complications, 2.5% developed ASD, 3.3% developed pseudarthrosis, 37.7% developed PJK, and 8.6% developed PJF.
Occurrence of Postoperative Complications After 2 Years
After the 2-year follow-up, 32% of the cohort experienced at least one complication while 4% suffered a major complication. After the 2-year mark, complication type was as follows: 2% neurological, 22% radiographic, and 5% mechanical, with 2.5% reoperation. With respect to mechanical complications, 3.3% had implant failure, 1.2% had implant pain or prominence, and 3.3% had rod breakage. In terms of radiographic complications, .8% developed ASD, 1.2% developed pseudarthrosis, 17.4% developed PJK, and 6.0% developed PJF.
Overall Complications Before and After 2 Years on Cost-Utility
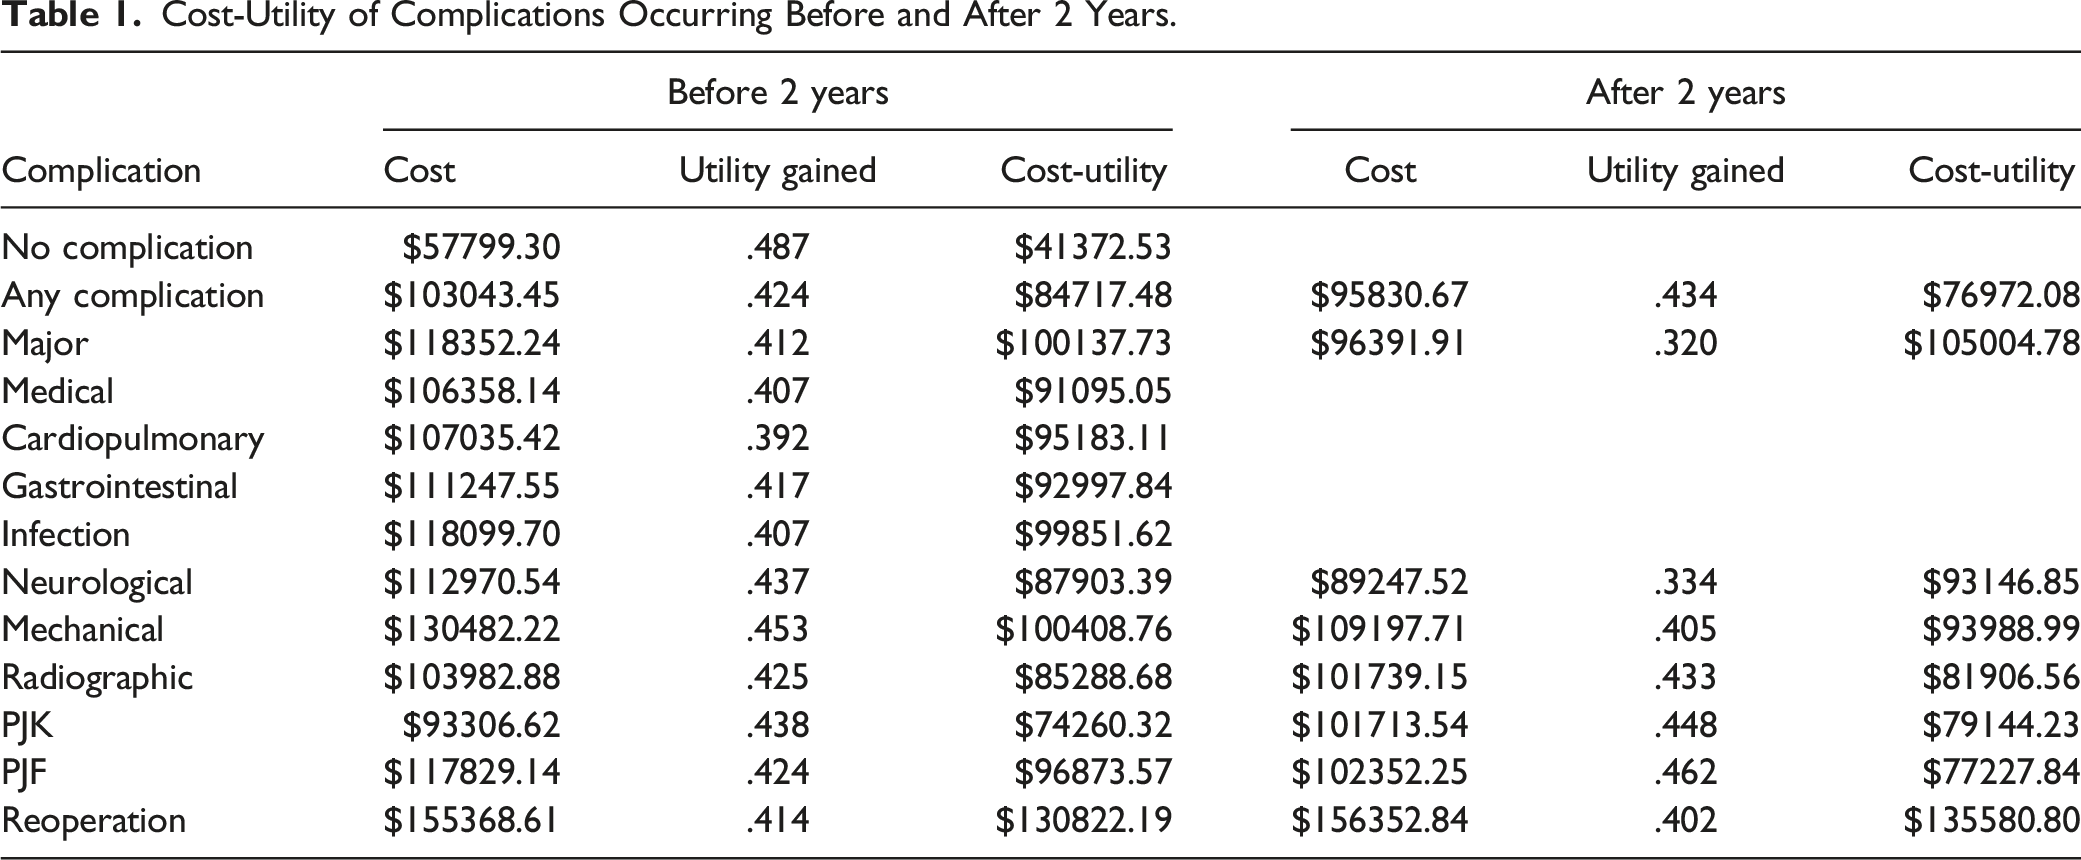
Cost-Utility of Complications Occurring Before and After 2 Years.
Complications Before 2 Years on Cost-Utility
In terms of complications that occurred before the 2-year mark, patients who developed a mechanical complication accrued the highest overall cost ($130,482.22), followed by infection and PJF. However, these same patient had the highest utility gained of any complication before 2 years, improving their overall cost-utility.
Complications After 2 Years on Cost-Utility
In contrast, patients who developed a mechanical complication after 2 years accrued a lower cost ($109,197.71 vs $130,482.22, P = .041). Similarly, patients who developed PJF after 2 years accrued a lower cost ($77,227.84 vs $96,873.57, P = .038) and had a higher utility gained, compared to patients who developed PJF before 2 years.
Discussion
Complications after ASD surgery are not uncommonly encountered. The cost-utility of a given intervention is important and should be considered. As such, we set out to deliberate the effect of timing on complications, in terms of cost-utility. Overall, we found mechanical complications before 2-year follow-up to have the biggest economic impact, demonstrating poor cost-utility, followed by infection and PJF. Complications after the 2-year mark had less of an influence on clinical improvement or cost-utility.
The economic outcomes of ASD surgery have been studied by stratifying patients based on various factors and surveying the cost-utility across the spectrum. A study by Yagi et al highlighted that patients over the age of 70 who underwent corrective surgery had worse cost-utility compared to younger patients, secondary to higher rates of postoperative complications, mainly implant-related. 3 Passias et al examined the effect of physiologic age, known as frailty, on cost-utility by 3 years and reported that frailer patients generate higher costs, while cautioning that a certain frailty level may still yield clinical benefits in the context of cost-utility analysis. 17 Previous research has also highlighted metabolic syndrome, surgical approach, and BMP-2 usage, in the context of ASD surgery, to have a significant impact on cost-utility.27-29
The common overarching theme driving poor cost-utility is the occurrence of complications. While prevention of any or all complications should be a basic expectation, corrective surgery for ASD is inherently complex and commonly associated with early and late complications. Prevention tools and resources should be allocated appropriately. By demonstrating worse cost-utility for early mechanical complications, a future focus may be placed on risk factors for the development of that particular complication type, in an effort to mitigate its occurrence and ultimately enhance clinical outcomes and cost-utility.
Alongside mechanical complications, infection and PJF had significant effects on cost-utility. Superficial and deep infections and have been shown to be the most common reason for readmission after lumbar surgery.30,31 A study by Anand et al demonstrated no infections in their minimally invasive surgery (MIS) cohort of patients, reporting the usage of less invasive techniques to mitigate infection rates. 32 As technological advancements continue to evolve in spine surgery, an emphasis must be placed on adoption of practices that incorporate cost-utility. Patients who developed PJF before 2 years had the third-worst cost-utility, behind mechanical complications and infection. Prior literature has described techniques and strategies to lower PJF occurrence.33,34
Timing of various complications affect cost-utility after corrective surgery for ASD. As shown by the clinical improvement in QALYs, patients in our cohort who experienced a major complication after the 2-year mark did worse than those who had a major complication before 2 years. Major complications have been shown to significantly inhibit the likelihood of achieving the best outcome in ASD surgery. 35 Morever, Bridwell et al found no differences in clinical improvement for patients who experienced a major complication by 2-year follow-up. They later followed these same patients out to 5-year follow-up and reported a negative impact of complication occurrence on clinical improvement.36,37 Interestingly, complications that occurred after 2 years were less costly compared to those before 2 years, despite diminished clinical improvement. They reported no differences in costs per QALY between complications before and after the 2-year mark. These findings highlight the notion that complications before 2 years have a greater effect on outright cost whereas complications after 2 years are more detrimental to clinical improvement.
Our study is not without limitations. First, the retrospective nature of this work subjects it to potential selection, indication, surveillance, and classification bias. By using a multivariable approach, we controlled for confounding variables but nonetheless not all can be accounted for. Secondly, we used Medicare allowable rates for cost-comparison, which we felt would be a suitable means of standardizing costs across various centers and improving generalizability of our study findings; translational capacity to other payors may be limited in that regard. Despite these limitations, our findings provide insight on the economic impact of a relevant postoperative occurrence after ASD surgery and adds to the existing body of literature on the subject matter.
Conclusions
Mechanical complications have a profound effect on cost-utility after adult spinal deformity surgery. In our cohort, complications that occurred before the 2-year mark had the greatest economic impact. Late mechanical and radiographic complications fared better economically than earlier ones, with medical complications playing merely a minor role. Understanding the economic impact of complications after adult spinal deformity correction is important for preferentially targeting prophylaxis against the costliest complications.
Footnotes
Declaration of Conflicting Interests
The author(s) declared no potential conflicts of interest with respect to the research, authorship, and/or publication of this article.
Funding
The author(s) received no financial support for the research, authorship, and/or publication of this article.
Ethical Approval
Institutional Review Board approval was obtained before enrolling patients in the prospective database. Informed consent was obtained from each patient prior to enrollment.