
Abstract
Study design
Retrospective study
Objectives
To explore preoperative segmental slope as a predictor of fusion rate after single-level anterior cervical discectomy and fusion (ACDF).
Methods
Data of consecutive patients with single-level cervical spondylosis who underwent ACDF between 2011 and January 2019 were retrospectively reviewed. Preoperative parameters including baseline characteristics, segment slope, T1 slope, range of motion, intervertebral disk height, and bone density were evaluated. Data were analyzed using Student’s t-test, Mann–Whitney U test, χ2 test, Fisher’s exact test, multivariate logistic regression analysis, and receiver operating characteristic curve.
Results
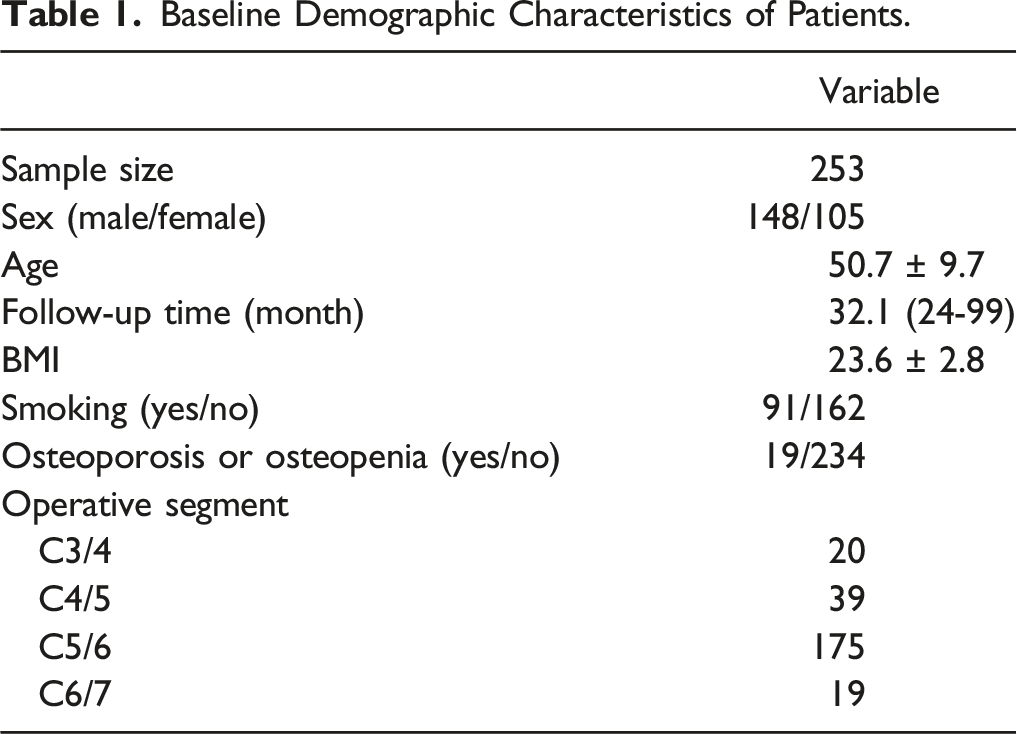
In total, 253 patients were selected. The mean follow-up was 32.1 months (range 24-99 months). Male sex, body mass index, preoperative segment slope, T1 slope, operative levels, and osteoporosis or osteopenia were associated with non-fusion at an early stage after surgery. However, no statistically significant difference was observed at the last follow-up. Multivariate logistic regression analysis revealed that the preoperative segment slope was an independent predictor for non-fusion at 3, 6, and 12 months postoperatively. Osteoporosis or osteopenia was an independent predictor of non-fusion at 6 and 12 months postoperatively. The area under the curve was .874 at 3 months (P < .001, cutoff value 10.21°), .888 at 6 months (P < .001, cutoff value 14.56°), and .825 at 12 months (P < .001, cutoff value 21.08°).
Conclusion
Preoperative segment slope can be used as a predictor of early fusion rate after single-level ACDF. We determined detailed cutoff values. This study may help surgeons take measures to promote early fusion in advance.
Introduction
Anterior cervical discectomy and fusion (ACDF), introduced by Cloward 1 and Smith 2 in 1958, is a classic surgical method for treating cervical spondylosis. Many studies have been published exploring the predictors or risk factors of non-fusion.3-6 Although non-fusion may not be related to patient-reported outcomes, it can cause various complications.7-9 Thus, if barriers to fusion can be predicted preoperatively, the surgeon may take various measures to promote early fusion or avoid the occurrence of pseudarthrosis.
According to previous studies, many preoperative factors may affect fusion rate, including osteoporosis, smoking, preoperative T1 slope, and range of motion (ROM).3-5,10,11 However, the T1 slope is often difficult to measure because T1 cannot be observed on X-ray film.12-14 Thus, this measure only reflects the overall force lines of the cervical spine and does not visually reflect the mechanics of the index level.
Previous studies have found that in multilevel ACDF, the caudal level has a larger slope and slower fusion speed, suggesting that the preoperative slope may be related to the fusion rate.15-18 Furthermore, we have also observed in our clinical work that patients with a large preoperative segmental slope show slower fusion speed in single-level ACDF.
However, the relationship between segment slope and fusion rate in single-level ACDF has not been reported to date. Therefore, the purpose of this study was to explore whether the preoperative segmental slope may serve as a predictor of fusion rate.
Methods
Study Design and Patients Demographics
This single-center retrospective study was approved by the Ethics Committee on Biomedical Research of the West China Hospital of Sichuan University and conformed with the guidelines of the Declaration of Helsinki. Informed consent was obtained from all patients. Data of patients who had undergone single-segment ACDF for cervical spondylosis at our hospital between March 2011 and April 2019 were reviewed from the hospital database.
The inclusion criteria were as follows: (1) a diagnosis of cervical spondylosis; (2) having undergone single-level ACDF; (3) being aged between 18 and 75 years at the time of surgery; (4) the operated segment being located at C3/4-C6/7; and (5) having a zero-profile device and an artificial bone used to achieve fusion. The exclusion criteria were as follows: (1) a history of secondary cervical spine surgery; (2) no complete 2-year radiological follow-up; (3) the presence of a tumor, cervical spine infection, or other serious systemic disease; (4) internal fixation using something other than the zero-profile device; (5) administration of intraoperative local steroids; and (6) administration of BMP-2.
Radiological Parameters
Radiography and CT three-dimensional reconstruction were performed at 1 week, 3 months, 6 months, 1 year, and 2 years after surgery, to evaluate the sequence of the cervical spine, osteophyte, and postoperative fusion. Magnetic resonance imaging and bone mineral density scans were performed before surgery to evaluate spinal cord compression, nerve root compression, and bone condition. Fusion was defined as an ROM of fusion level <2° on lateral flexion/extension radiography and the presence of trabecular bridging on radiography or CT scans. 19 If a patient was evaluated as fused at the time of follow-up and did not receive a subsequent follow-up or consultation, we still included him (or her) in the analysis and recorded fusion status at the subsequent time points.
Segment slope was defined as the angle between the horizontal line and the extension line of the lower endplate of the operative intervertebral space (Figure 1). The definitions of intervertebral disk height (IDH), T1 slope, and range of motion (ROM) are shown in Figure 1. Radiological parameters were measured using a picture archiving and communication system (version 4.0; GE Healthcare, Milwaukee, WI, USA). Measurement method of radiological parameters. Segment slope was defined as the angle between the horizontal line and the extension line of the lower endplate of the operative intervertebral space. Intervertebral disk height was calculated as length of (a+b)/2. T1 slope was defined as the angle formed by a line along the superior endplate of the T1 body and a horizontal line. Range of motion was calculated as the angle of (c-d).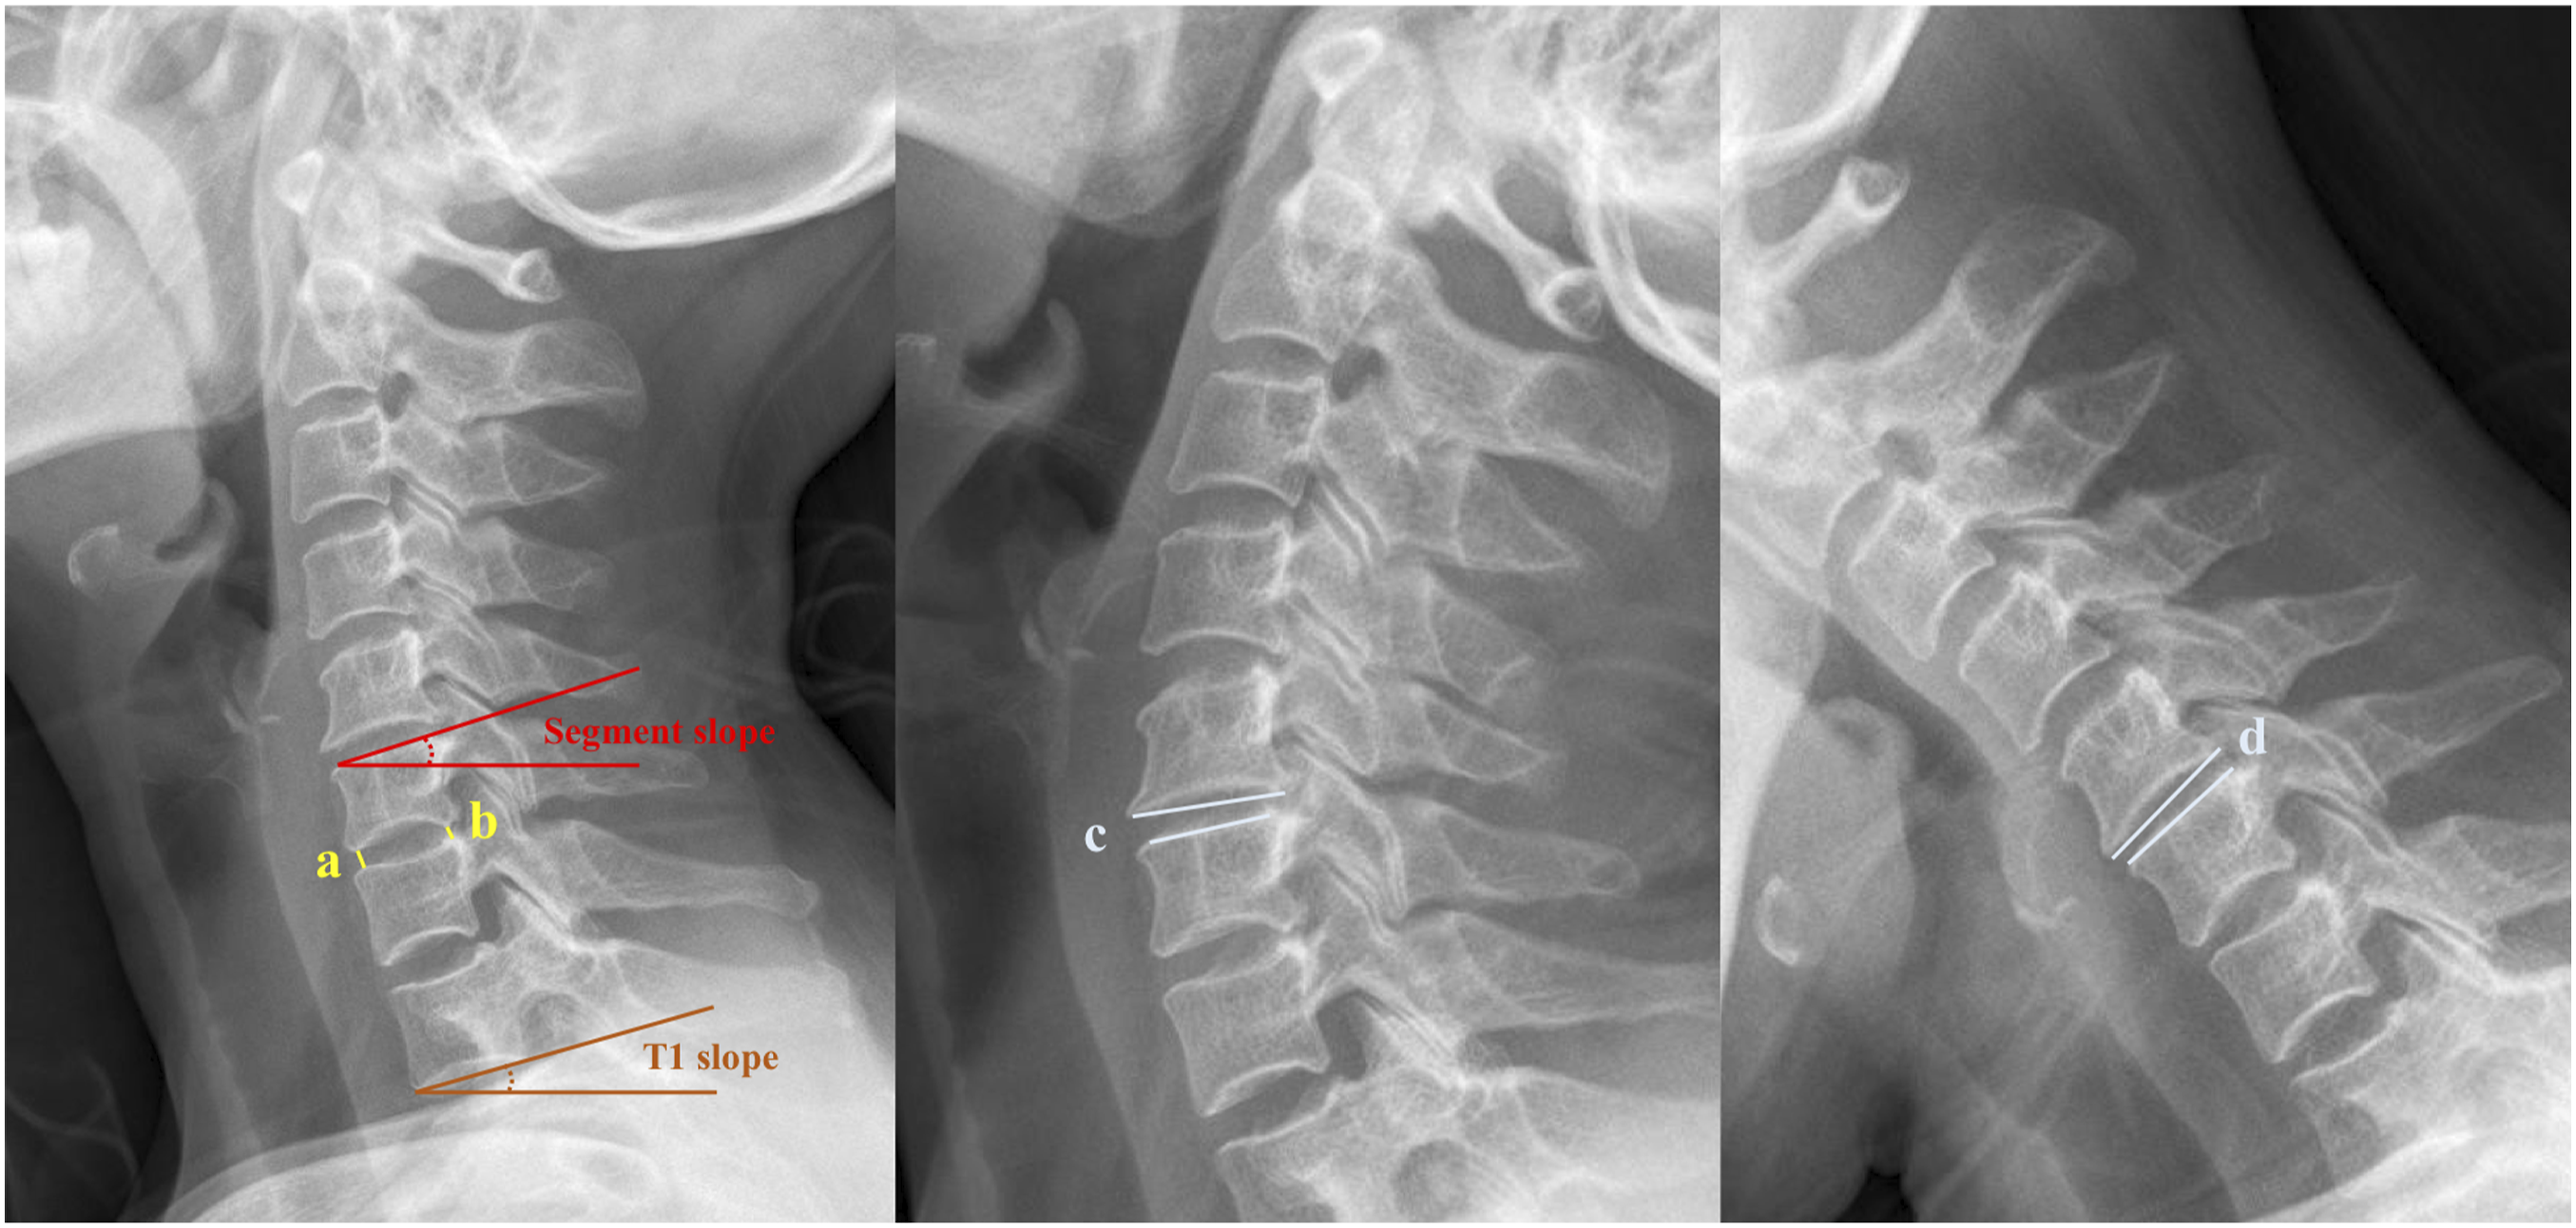
Surgical Techniques
All surgeries were led by a senior surgeon using a standard right-side anterior approach. A right front horizontal incision was made after general anesthesia. The disc tissue, posterior longitudinal ligament, and osteophytes were removed at the indicated levels to achieve thorough decompression. Then, the endplates were prepared by a high-speed burr. After complete hemostasis, an appropriately sized Zero-P device (Synthes, Oberdorf, Switzerland) filled with a composite artificial bone (beta-tricalcium phosphate, ChronOS; DePuy Synthes, Paoli, CA, USA) was implanted into the indicated intervertebral space. C-arm fluoroscopy was used to confirm the proper position and size of implants and screws. Finally, the muscle, the subcutaneous tissue, and the skin, were sutured layer-by-layer after drainage insertion. Steroids were not administered. Following the procedure, patients were instructed to wear a neck brace for 3 months.
Statistical Analysis
The results were represented as mean ± standard deviation. Student’s t-test was used to analyze normally distributed continuous data between the fusion and non-fusion groups, the Mann–Whitney U test was used to analyze nonnormally distributed data, and the χ2 test and Fisher’s exact test were used to analyze categorical data. Multivariate logistic regression analysis was used to identify predictors of non-fusion. If there was obvious collinearity between variables, we chose 1 of them for inclusion in the multivariate logistic regression analysis. A receiver operating characteristic (ROC) curve was used to assess the prediction ability of the segment slope for non-fusion and to determine its threshold. A two-tailed P-value of <.05 was considered as statistically significant. The SPSS software (version 23.0; IBM Corporation, Armonk, NY, USA) was used to perform standard statistical analyses.
Results
Patient Demographics
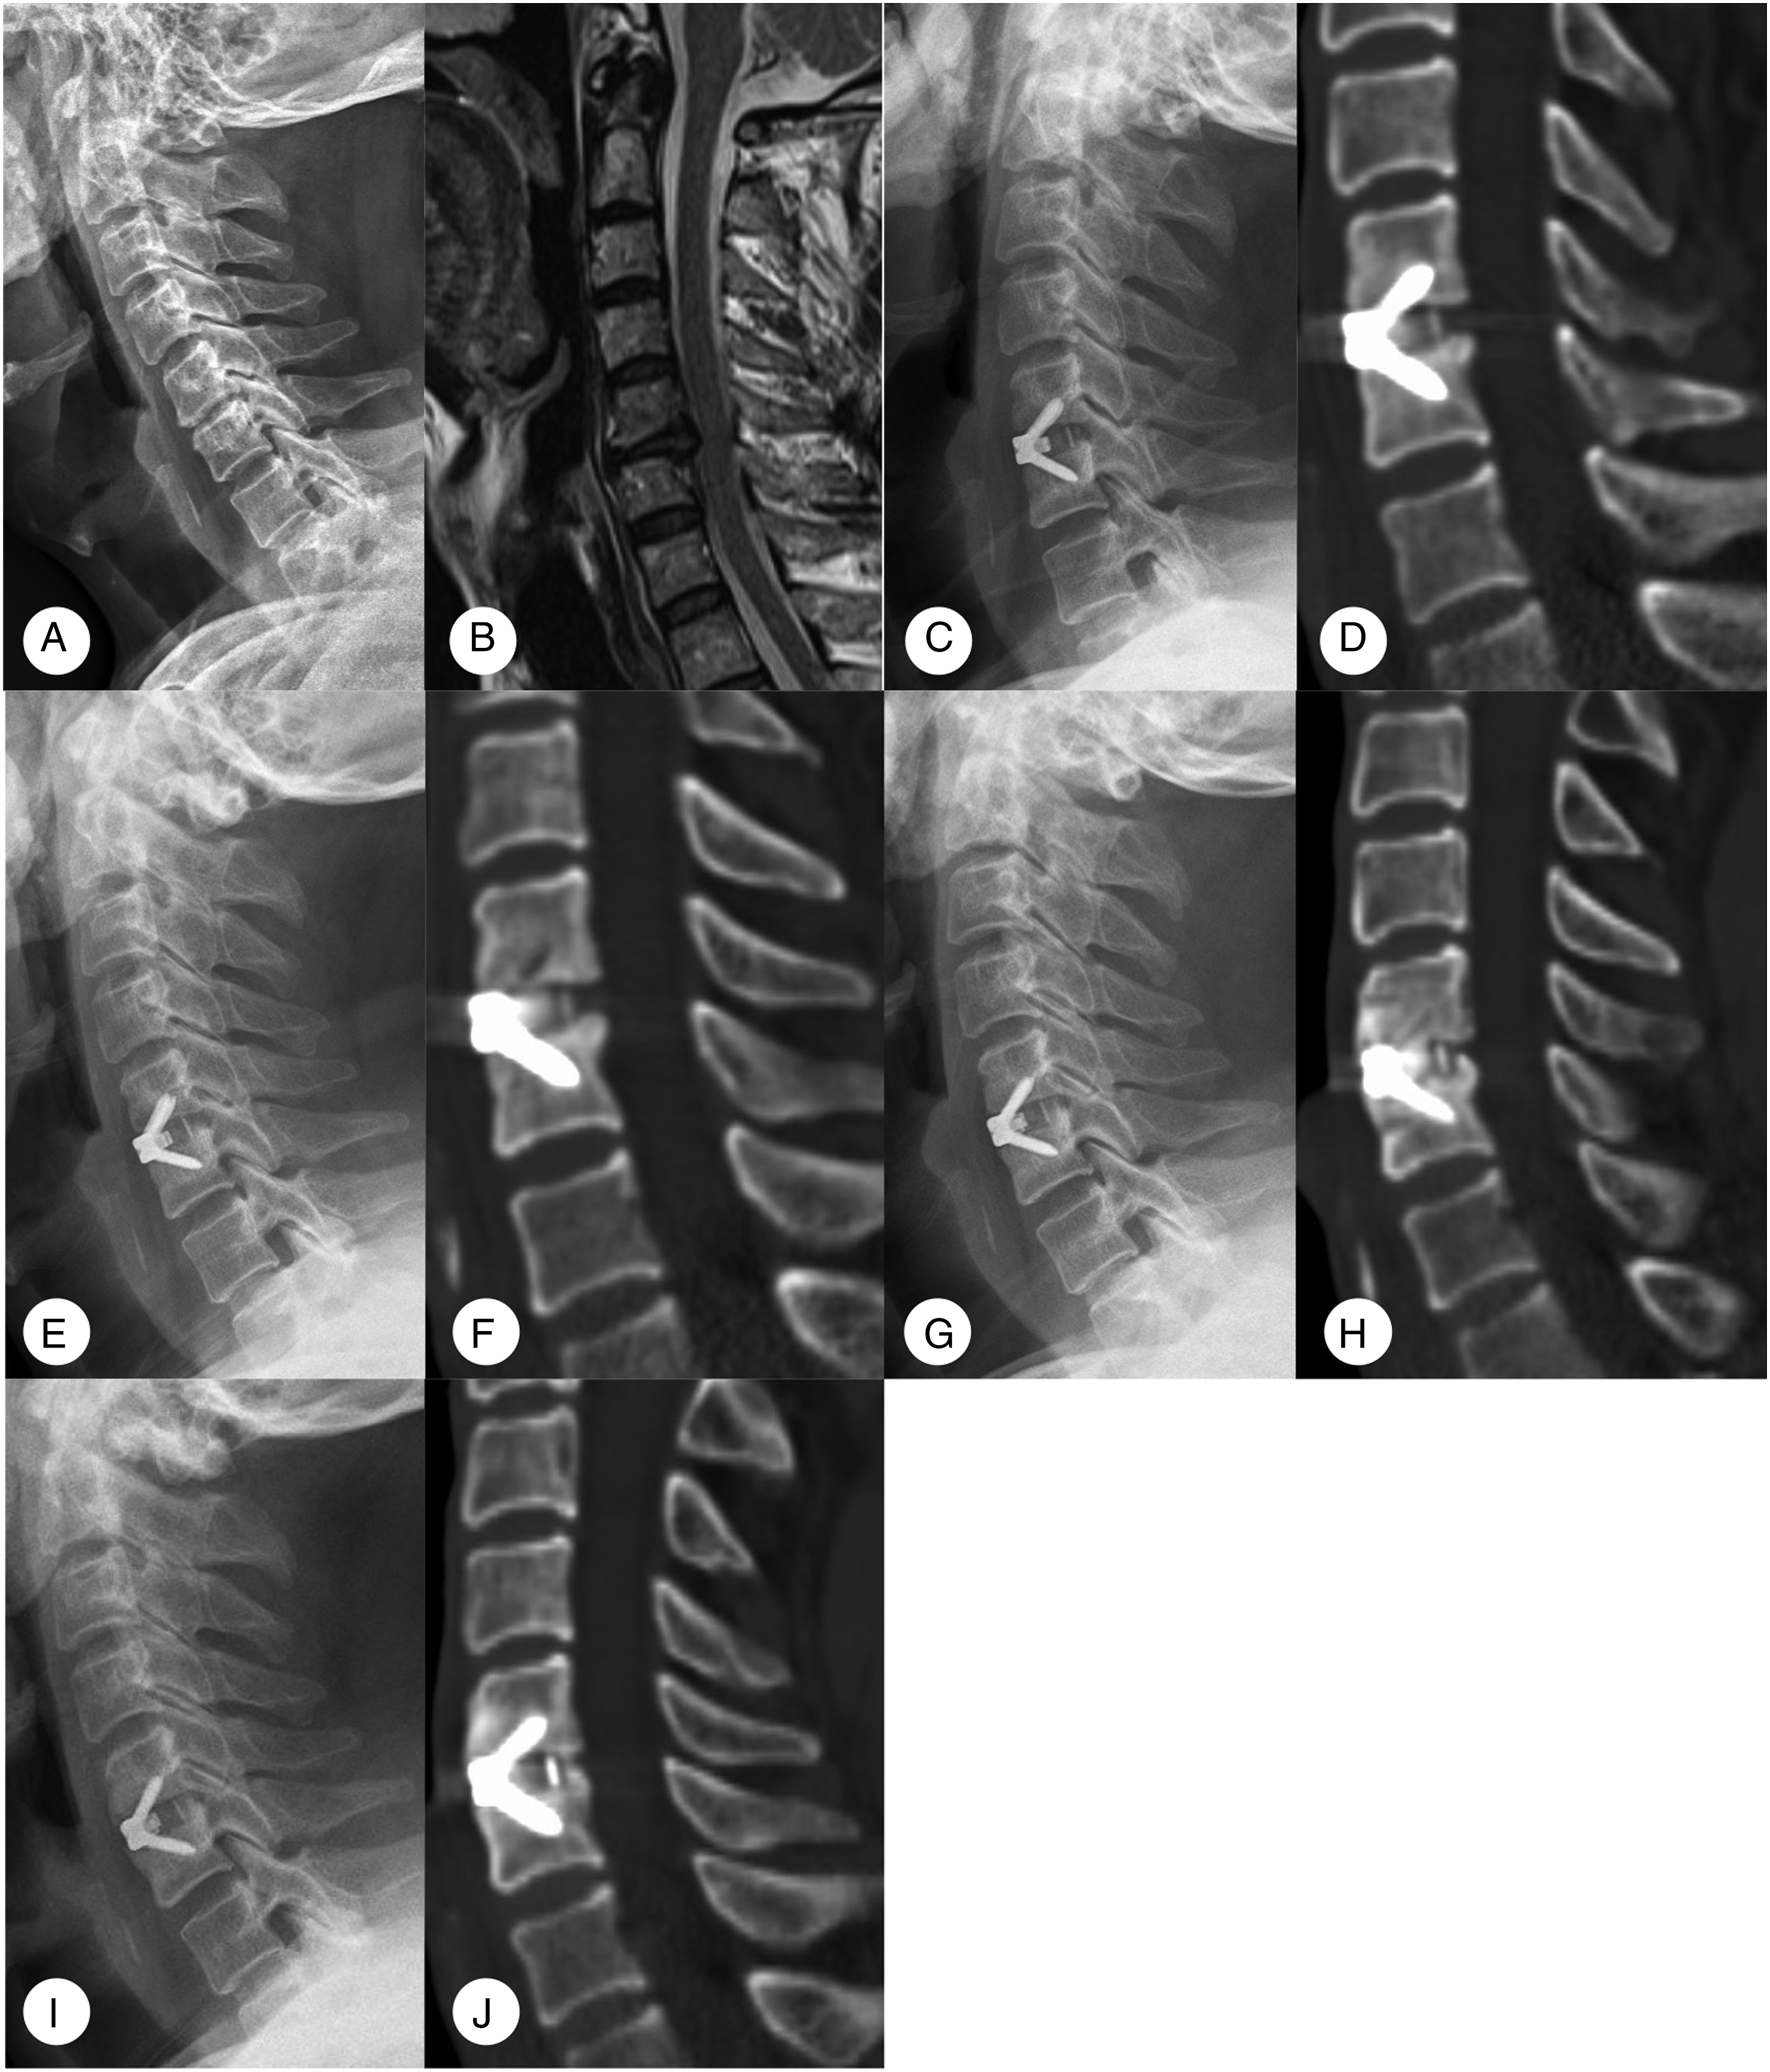
A total of 308 patients met the inclusion criteria. Of these 55 were excluded because they met 1 or more of the study’s exclusion criteria described in the Methods section. Ultimately, 253 patients with segmental ACDF were included in the analysis (Figure 2 and Figure 3). There were 105 females and 148 males among the study participants, with an average age of 50.7 ± 9.7 (24-75) years, and an average follow-up time of 32.1 months (range, 24-99 months). The detailed data are summarized in Table 1. Radiographs of a 69 year-old male. (A, B) Preoperative lateral radiograph shows degeneration and compression at the C3/4 level with a segment slope of 6.73°. (C, D) Radiographs show that the fusion has almost been completed to index levels at 3 months postoperatively. (E, F) Lateral radiographs showing a continuous bone bridge has been formed at 6 months postoperatively. (G, H) Radiographs show a stable and strong bone bridge at 12 months postoperatively. Radiographs of a 57 year-old male. (A, B) Preoperative lateral radiograph shows degeneration and compression at the C5/6 level with a segment slope of 37.72°. (C, D) Radiographs show that the fusion has not been completed to index levels at 3 months postoperatively. (E, F) Lateral radiographs showed that no continuous bone bridge has been formed at 6 months postoperatively. (G, H) Radiographs show that there was still no bone bridge formation at 12 months postoperatively. (I, J) At 33 months postoperatively, the continuous bone bridge has just been formed. Baseline Demographic Characteristics of Patients.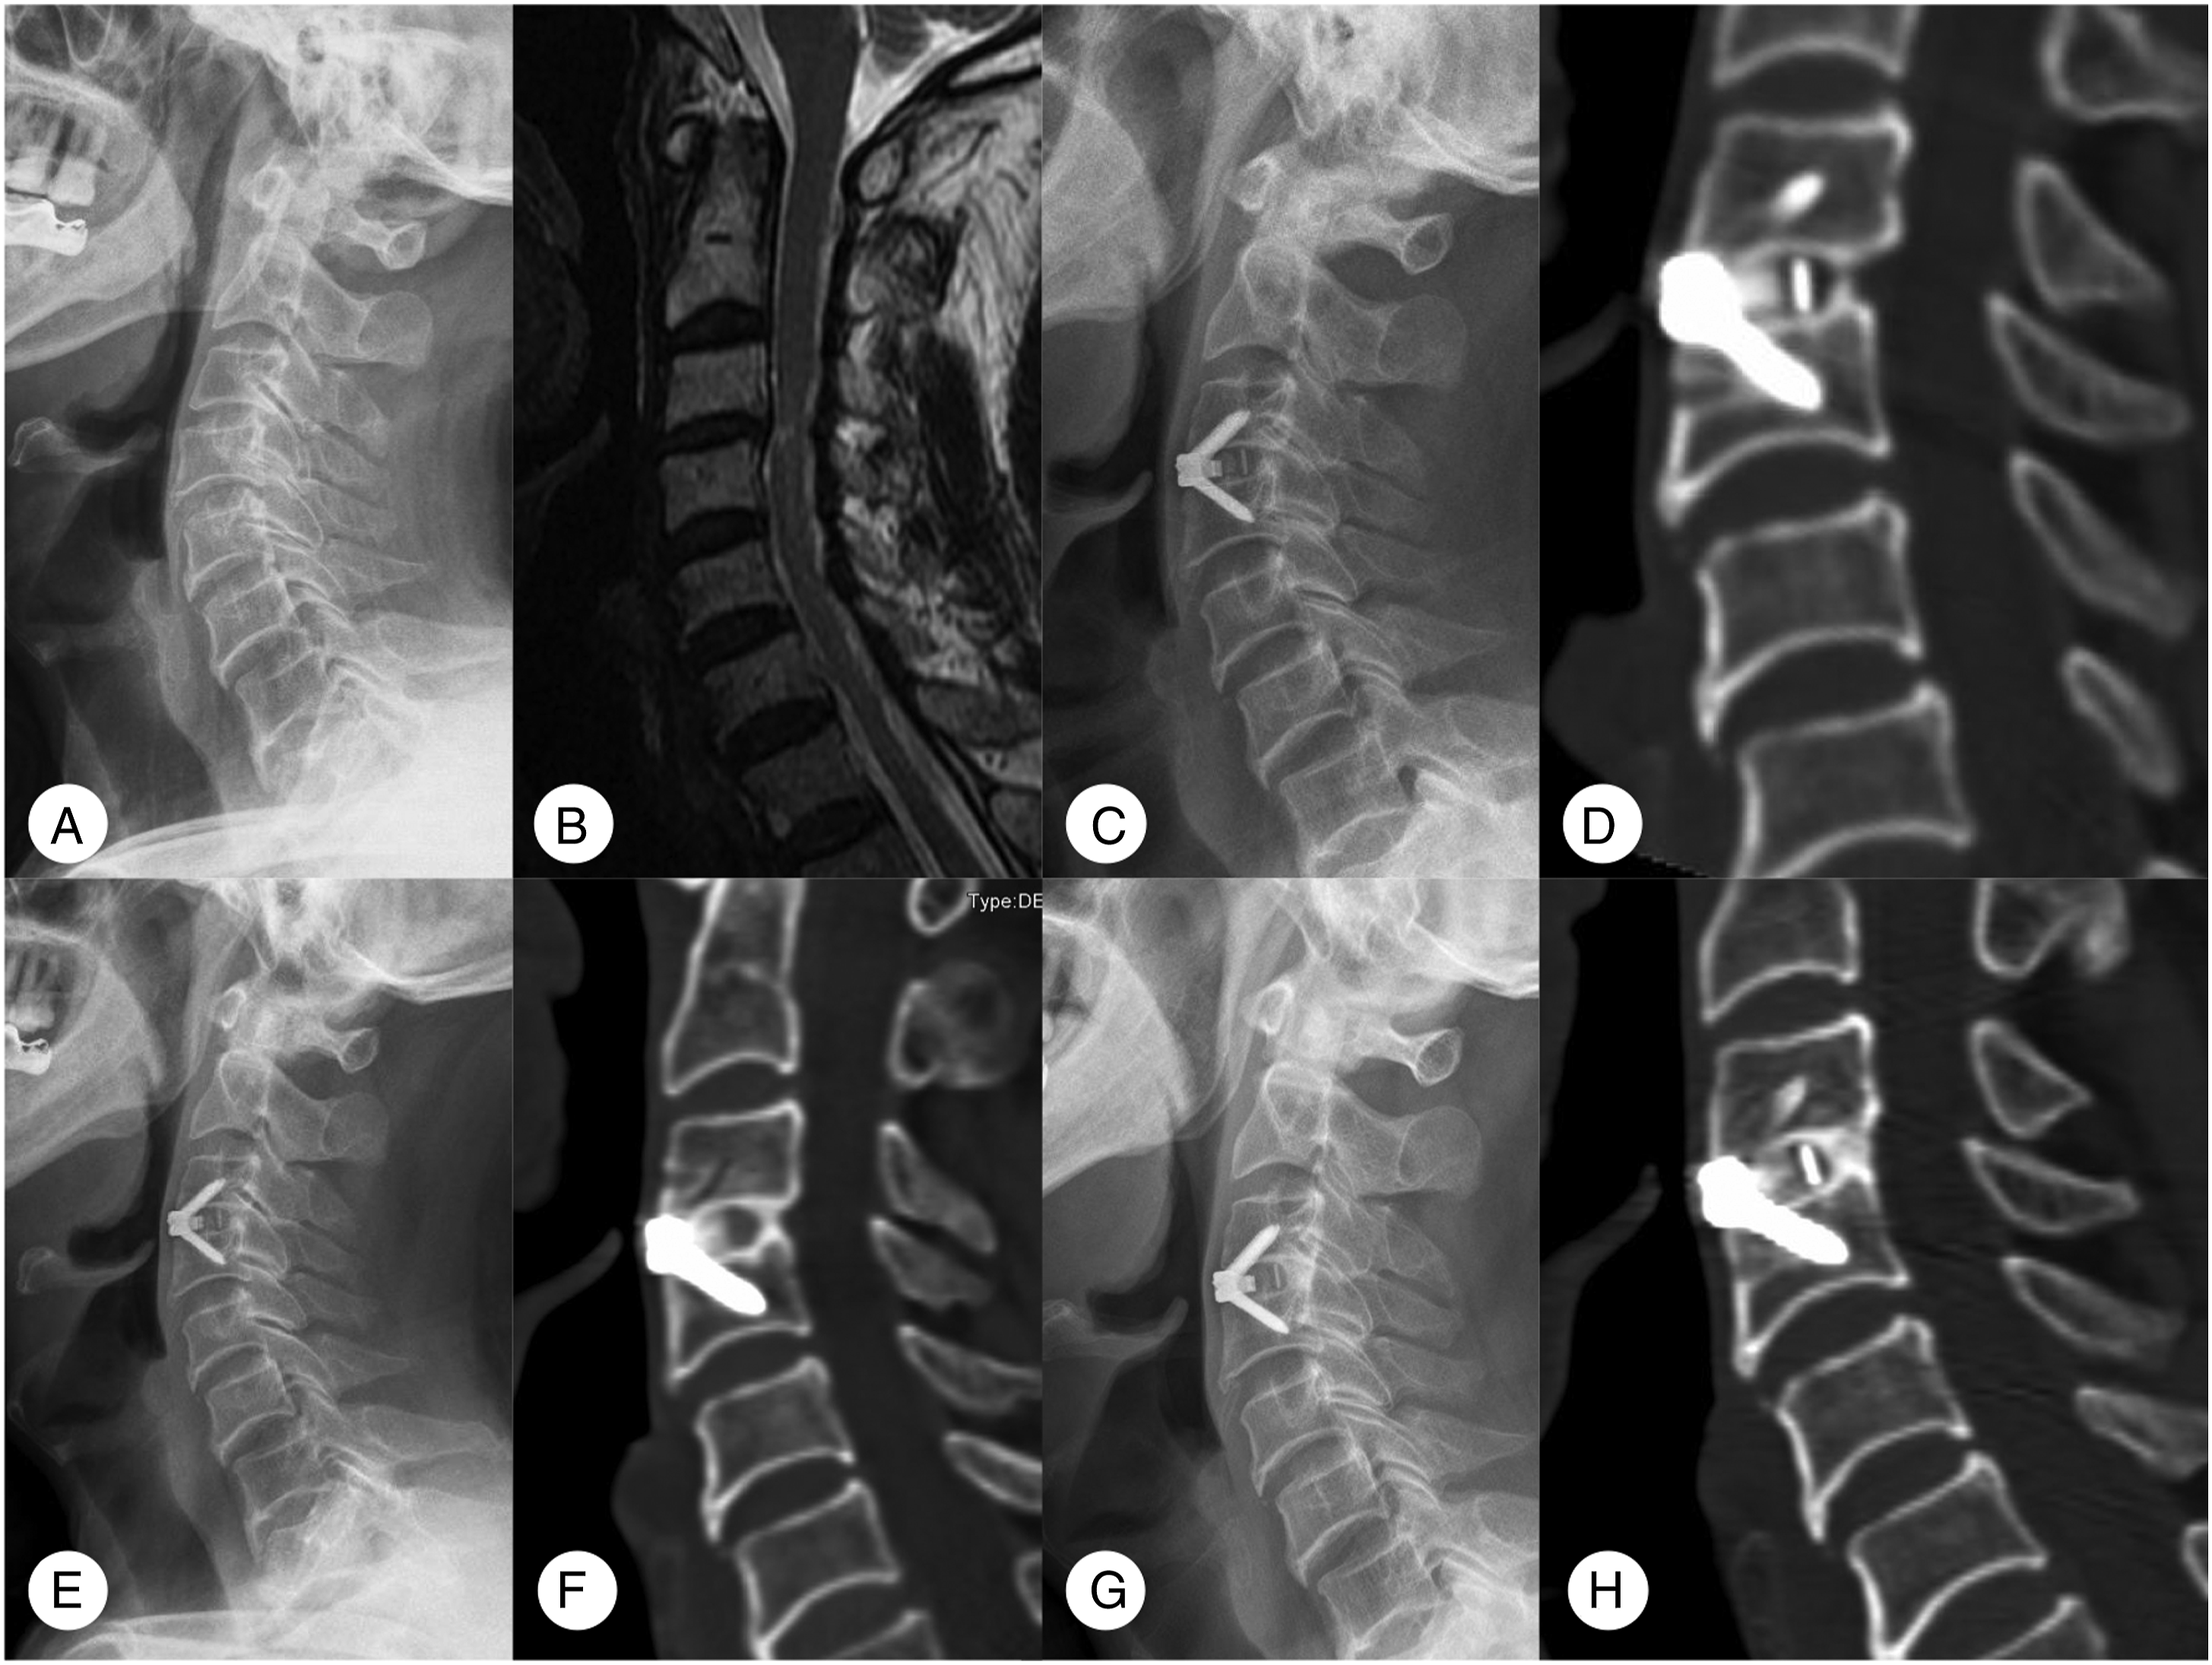
Fusion Rate and Predictors
Relationship Between Potential Preoperative Factors and Fusion.
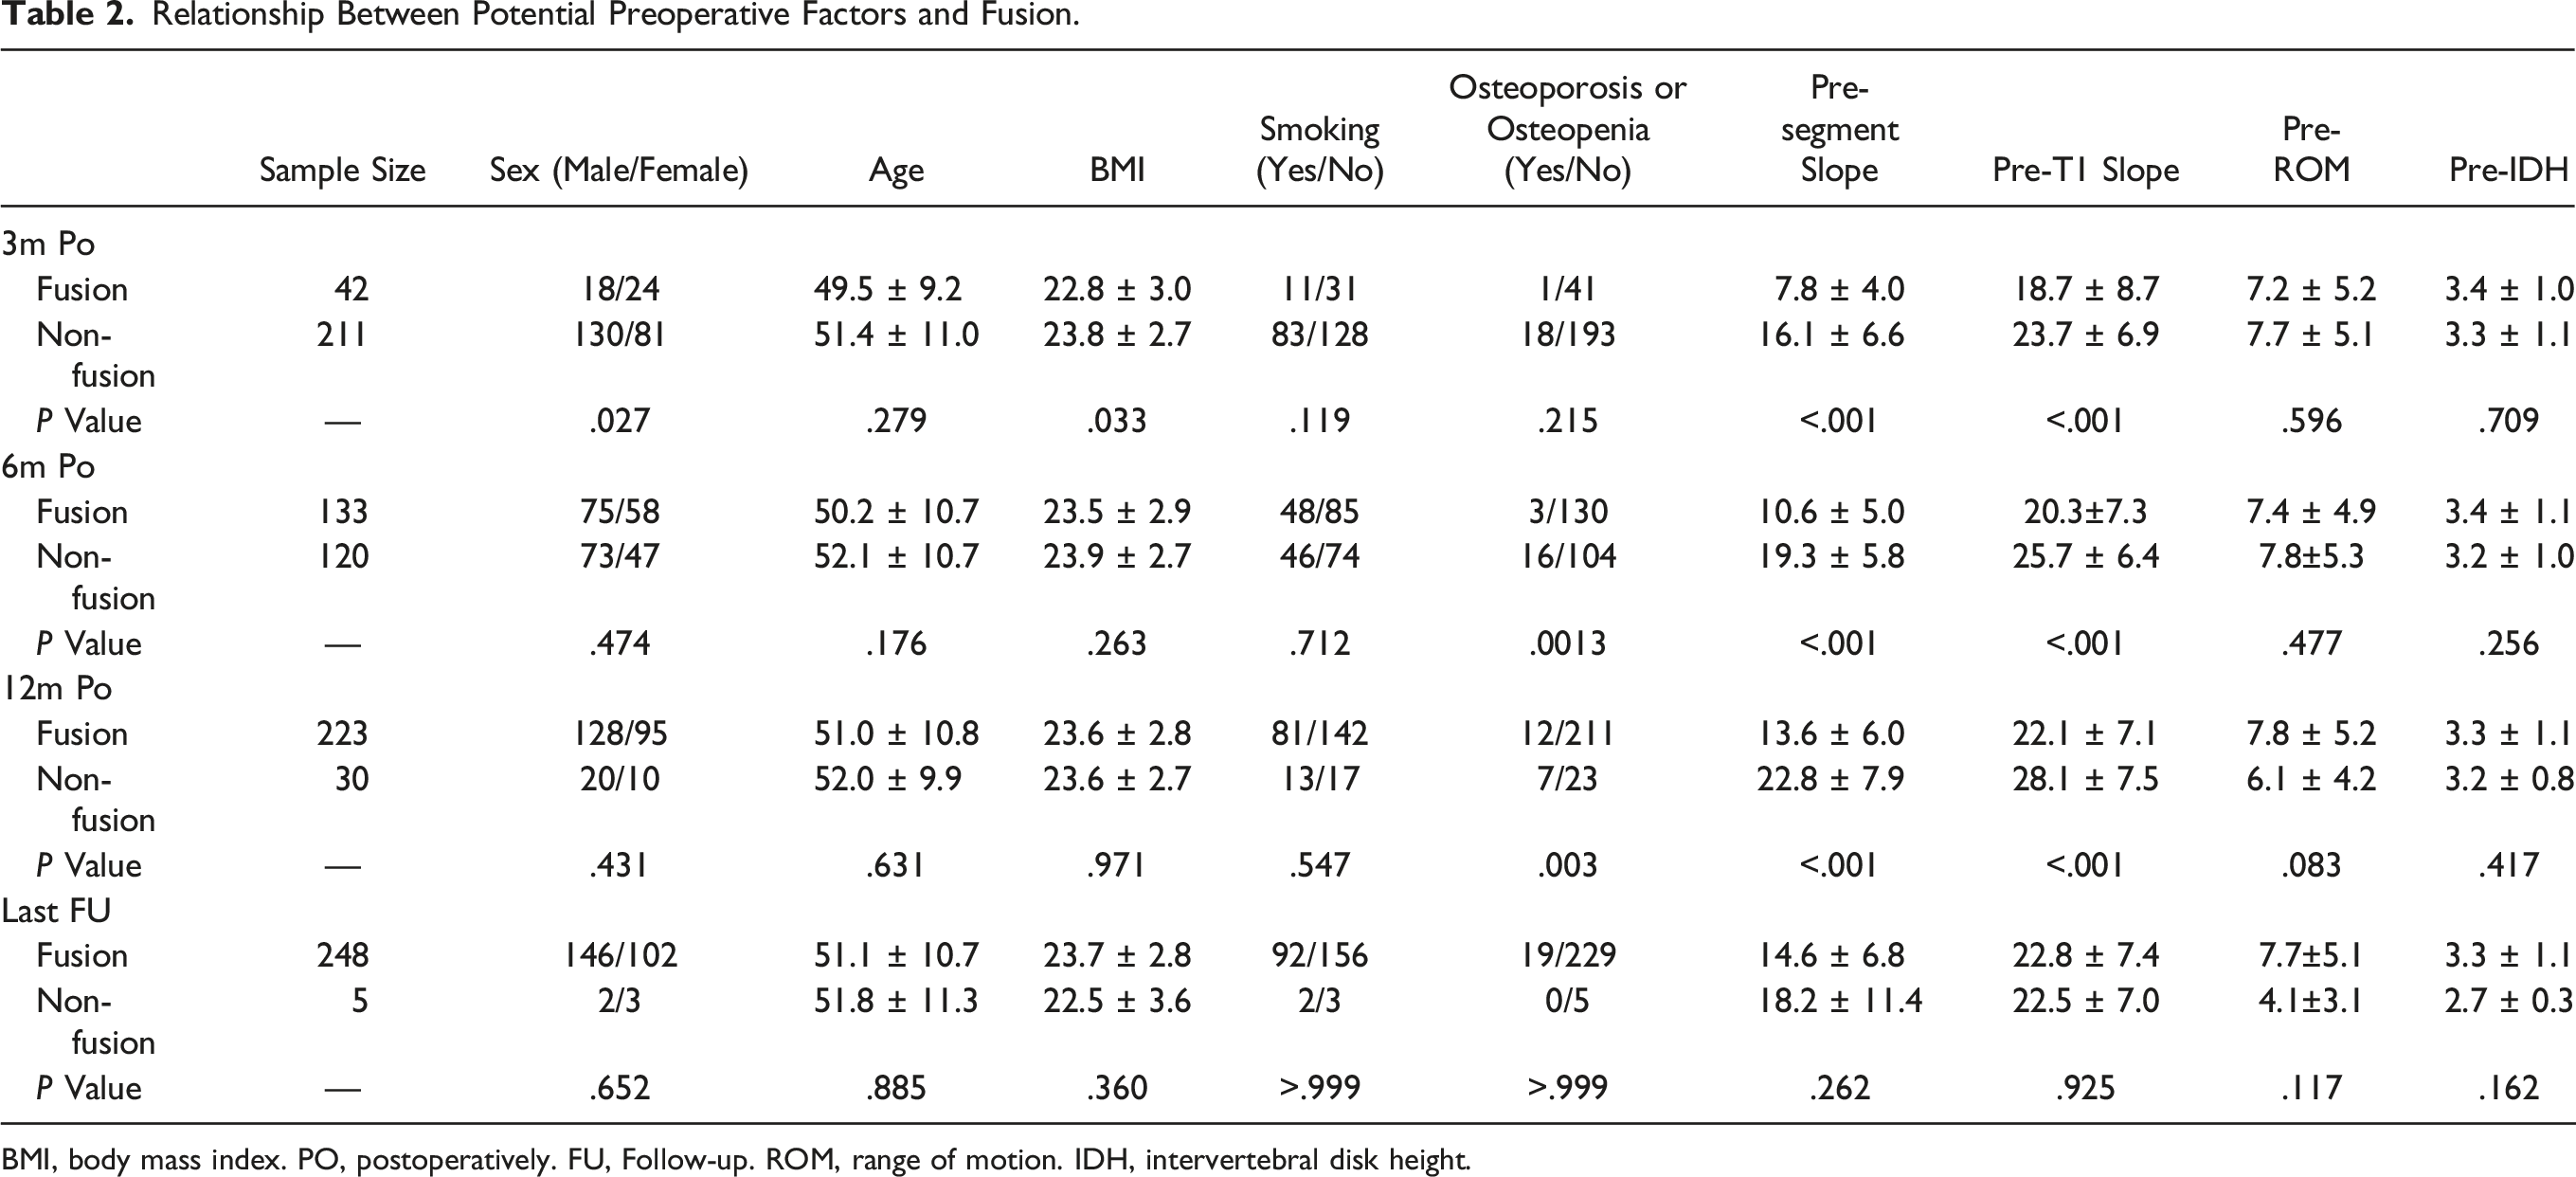
BMI, body mass index. PO, postoperatively. FU, Follow-up. ROM, range of motion. IDH, intervertebral disk height.
Six months postoperatively, the preoperative segment slope in the fusion group was less than that in the non-fusion group (10.6±5.0° vs 19.3 ± 5.8°, P < .001). The preoperative T1 slope of the fusion group was also smaller than that of the non-fusion group (20.3±7.3° vs 25.7 ± 6.4°, P < .001). Moreover, the incidence of osteoporosis or osteopenia in the fusion group was lower than that in the non-fusion group (2.3% vs 13.3%, P = .0013).
At 12 months postoperatively, the preoperative segment slope in the fusion group was less than that in the non-fusion group. (13.6 ± 6.0° vs 22.8 ± 7.9°, P < .001). The preoperative T1 slope of the fusion group was also smaller than that of the non-fusion group (22.1 ± 7.1° vs 28.1 ± 7.5°, P < .001). Furthermore, the incidence of osteoporosis or osteopenia in the fusion group was lower than that in the non-fusion group (5.4 vs 23.3%, P = .003). However, there were no significant differences in any aspect between the 2 groups at the last follow-up (Table 2).
Relationship Between Different Operative Levels And Fusion Rate.
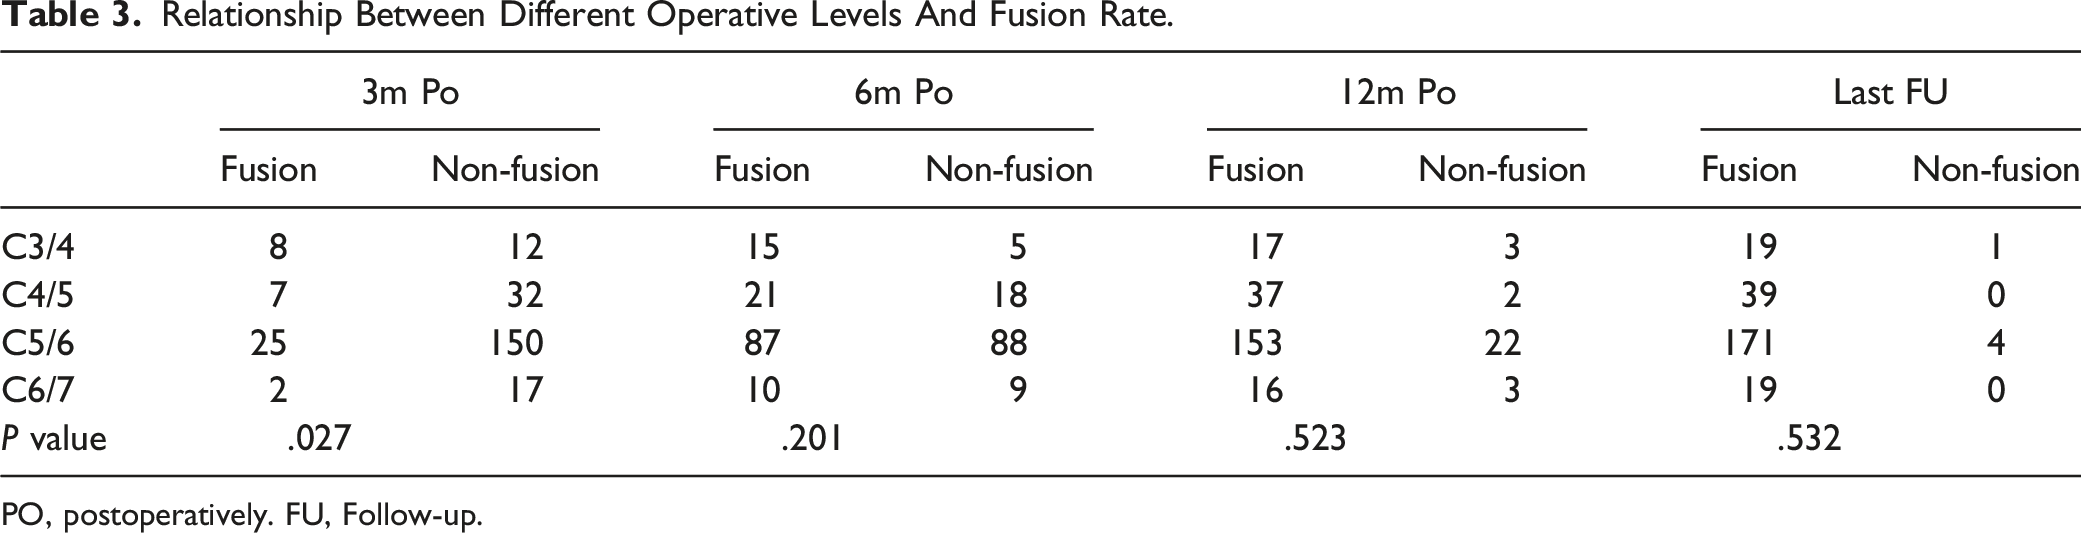
PO, postoperatively. FU, Follow-up.
Preoperative Segment Slope and Fusion
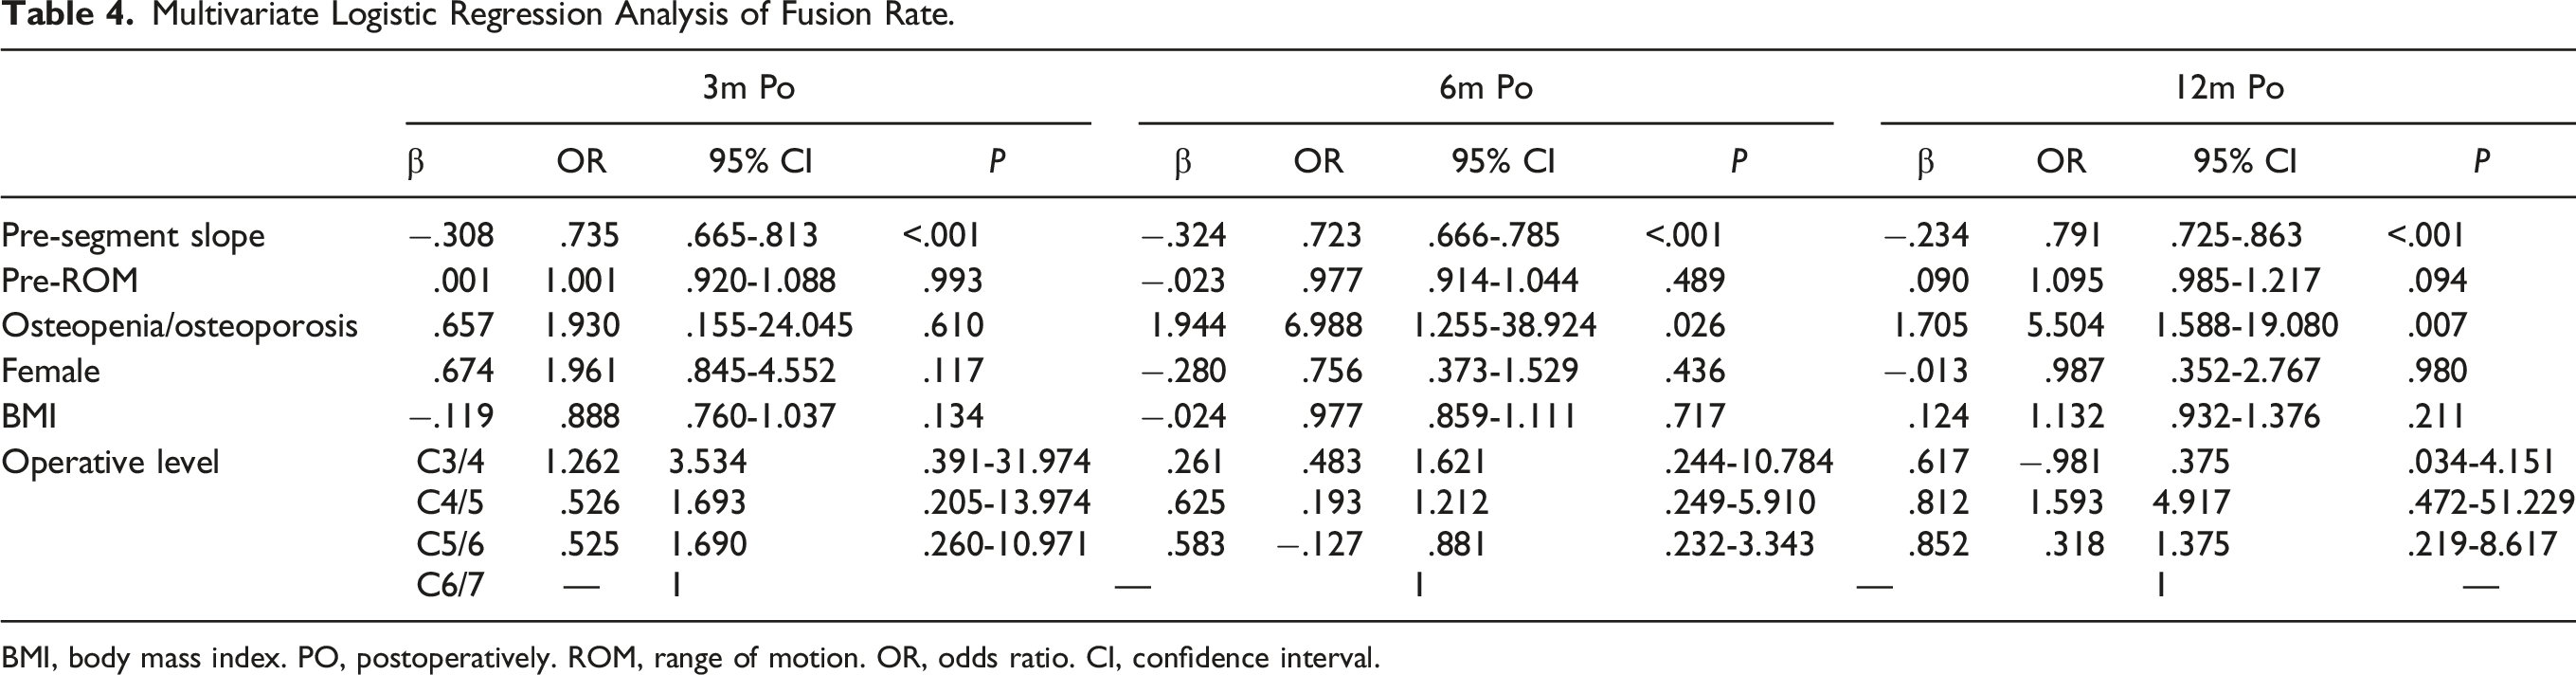
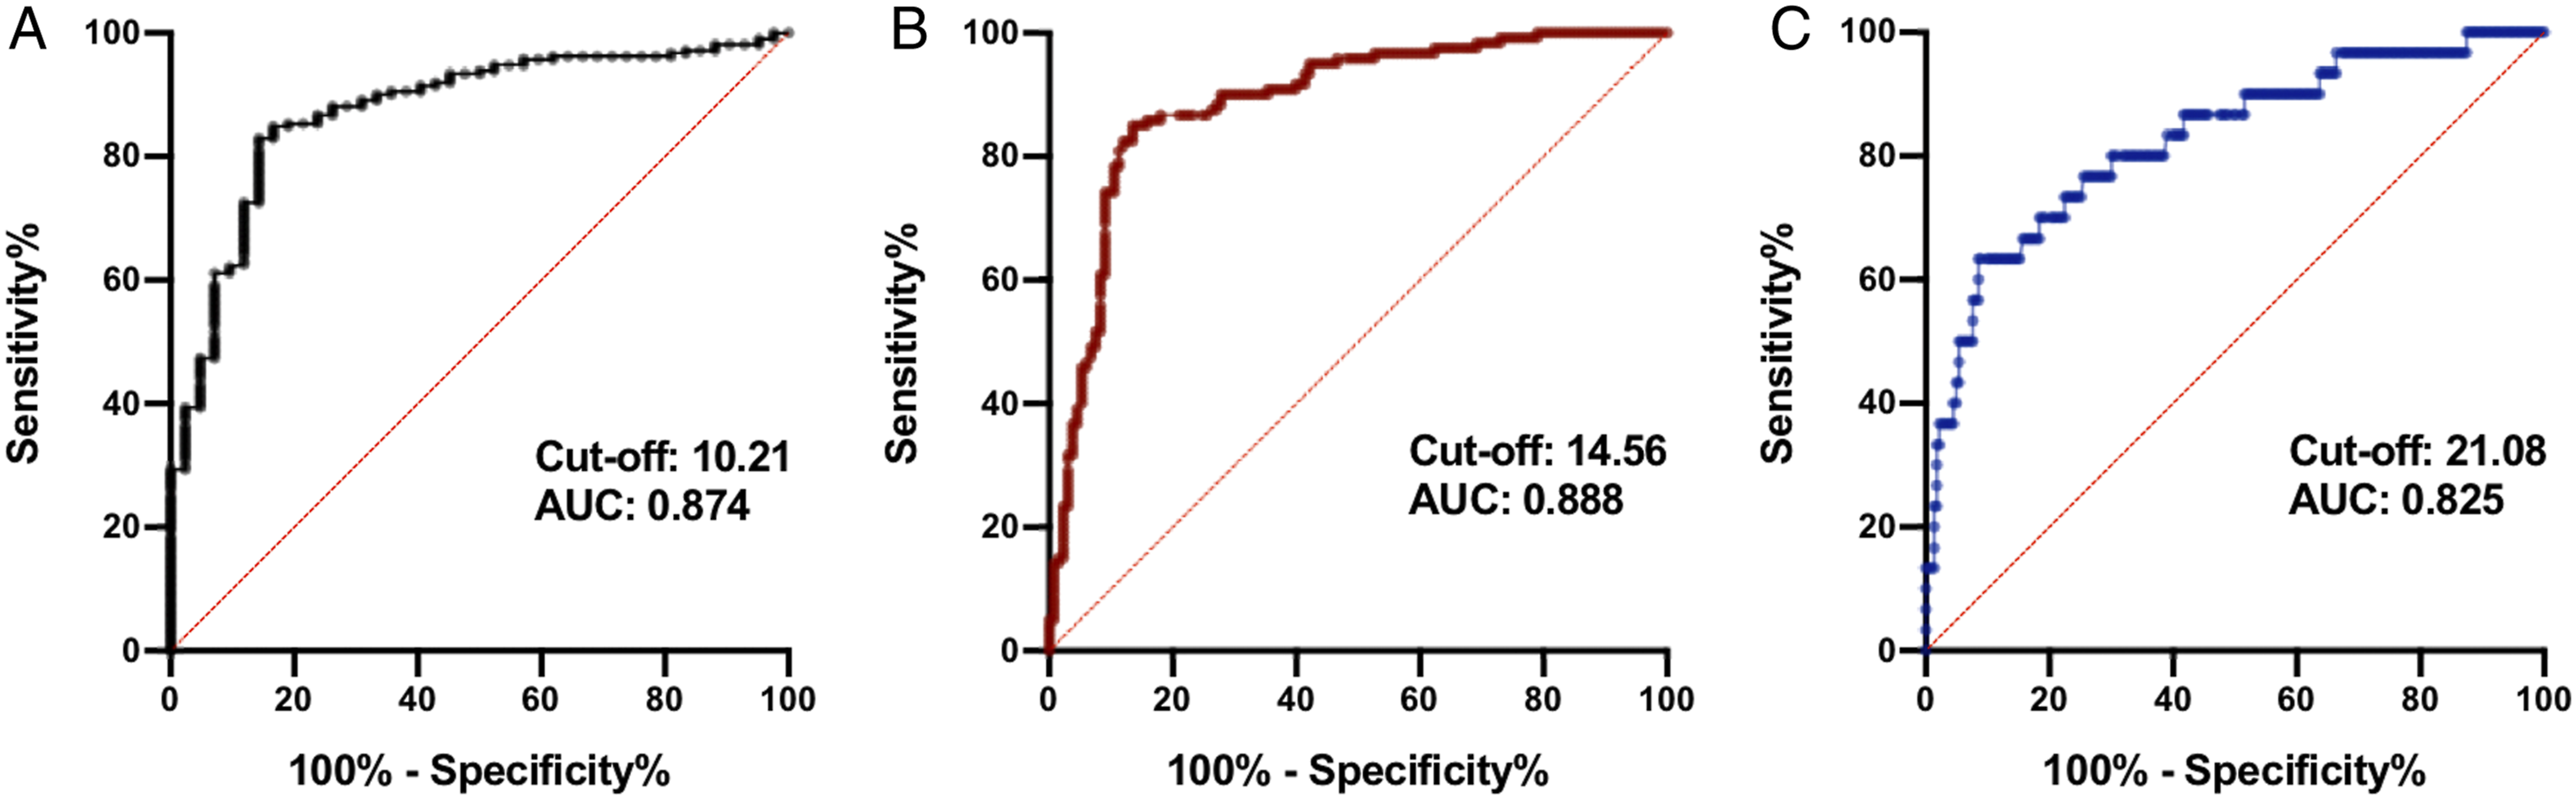
Since there was an obvious linear relationship between T1 slope and segment slope (r = .6141, P < .0001) (Figure 4), we did not include T1 slope in the multivariate logistic regression. Multivariate logistic regression showed that osteoporosis and osteopenia were independent predictors of non-fusion at 6 and 12 months postoperatively (Table 4). Segment slope was an independent predictor of the fusion rate at 3, 6, and 12 months postoperatively, and the greater the preoperative segment slope the more likely was non-fusion to occur. The ROC curve for the segment slope (Figure 5) as a predictor of non-fusion at 3 months postoperatively yielded an area under the curve (AUC) of .874 (95% confidence interval, .819-.930; P < .001). A cutoff value of 10.21 was associated with 82.9% sensitivity and 85.7% specificity for predicting non-fusion. At 6 months postoperatively, the AUC was .888 (95% CI, .846-.930; P < .001), and a cutoff value of 14.56 was associated with 85.0% sensitivity and 86.5% specificity for predicting non-fusion. At 12 months postoperatively, the AUC was .825 (95% CI, .739-.911; P < .001), with a cut-off value of segment slope of 21.08, associated with 63.3% sensitivity and 91.5% specificity. Scatter plot showing a linear correlation between segment slope and T1 slope (r = .614, P < .001). Multivariate Logistic Regression Analysis of Fusion Rate. BMI, body mass index. PO, postoperatively. ROM, range of motion. OR, odds ratio. CI, confidence interval. Receiver operating characteristic curve for segment slope as a predictor of non-fusion at (A) 3 months, at (B) 6 months, and at (C) 12 months postoperatively. AUC, area under the curve.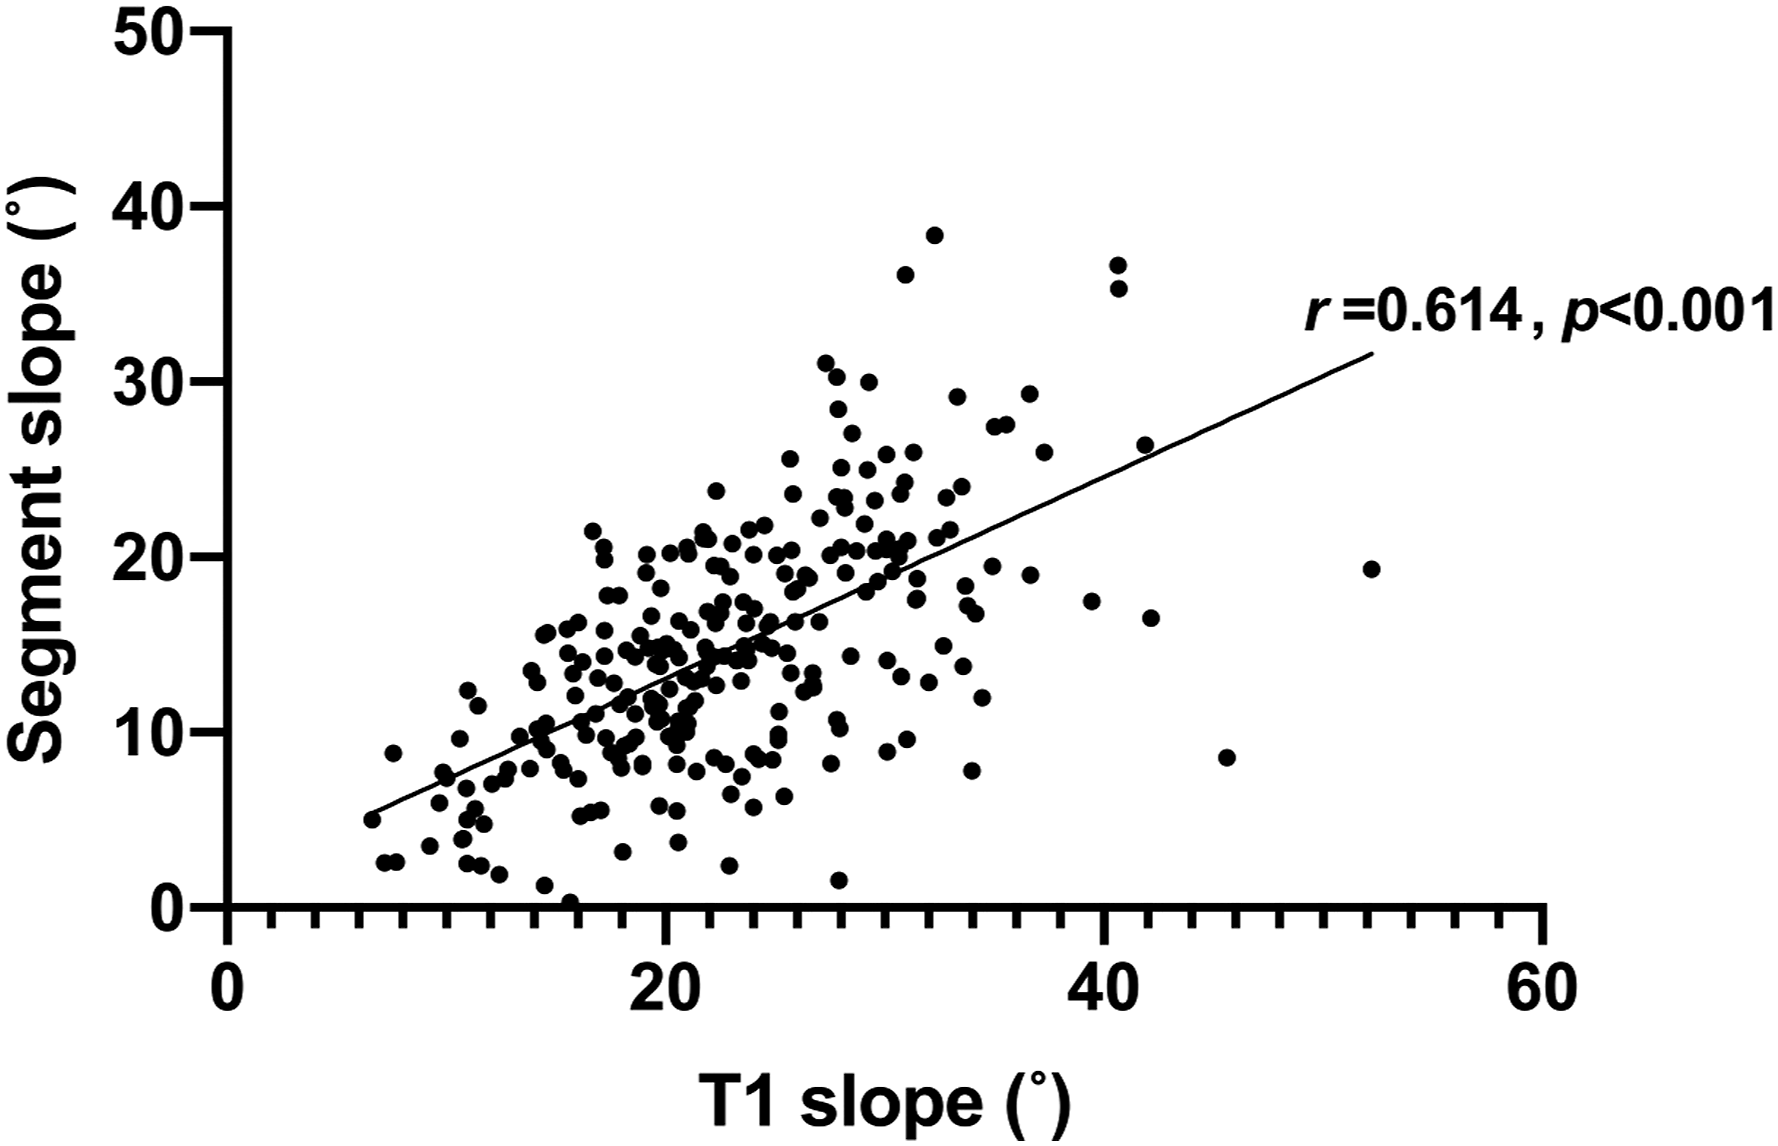
Discussion
This single-centered study with a large sample size explored the predictive value of segment slope for non-fusion in single-level ACDF. Although early non-fusion is often asymptomatic, it may still result in mechanical pain, poor patient satisfaction, and implant failure.7,8 Early fusion may improve patient satisfaction and reduce the incidence of prosthesis-related complications. Moreover, preventing non-fusion was the most common reason that spine surgeons recommended patients to wear a hard collar, 20 although its effectiveness on preventing non-fusion or implant migration is currently inconclusive.21,22 In addition, cervical braces are associated with complications23,24 such as pressure ulcers, dysphagia, stiffness of neck muscles, and preventing patients from returning to work. If surgeons could predict early fusion in patients preoperatively, they could take steps in advance to reduce unnecessary prolonged cervical brace wearing and allow patients to return to work earlier.
Preoperative segment slope is an independent predictor of non-fusion at an early stage after surgery. Previous studies found that the preoperative T1 slope is a risk factor for non-fusion.5,25,26 Although the T1 slope has been recognized as a common cervical radiological parameter, it is difficult to be accurately measured in nearly 70% of patients because of obscuring of the shoulder.27,28 In this study, the obvious collinearity between the T1 slope and segment slope revealed that the segment slope may be affected by the T1 slope. Therefore, we did not include T1 slope in the multivariate logistic regression analysis. The results of logistic regression analysis revealed an association between segment slope early fusion rate. In addition, using the ROC curve we obtained AUCs of .874, .888, and .825, at 3, 6, and 12 months after surgery, respectively. Therefore, segment slope may be a substitute as a fusion predictor. The underlying biomechanical mechanism may be that the shear stress increased with increasing slope, which resulted in a lower fusion rate. However, this hypothesis requires verification in future biomechanical studies. In addition, we concluded that a preoperative segment slope greater than 10.21°, 14.56°, and 21.08° predicted non-fusion at 3 months, 6 months, and 12 months postoperatively, respectively. However, these results were not observed during the last follow-up. This may be because cervical fusion is an ongoing process and patients eventually achieve fusion with increasing follow-up.
Preoperative osteoporosis or osteopenia are predictors of early non-fusion after ACDF. Bao et al found that 295 patients with osteoporosis had a lower fusion rate 6 months after surgery with ACDF using a PEEK cage. 4 Additionally, Stephen et al found that the presence of osteopenia or osteoporosis (16.3 vs 3.5%) was associated with pseudarthrosis at 300 day follow-up in a retrospective study of 326 patients using allograft cellular bone matrix. 3 Thus, osteoporosis or osteopenia may reduce the speed of bone healing and lead to early postoperative non fusion.
In this study, ROM was not a predictor of single-segment ACDF. Choi et al 5 found that a larger ROM was related to a lower fusion rate in a study of 84 patients using an anterior plate and cage, which differs from our results. This may be due to the difference in sample size and the inclusion of two- and three-level ACDF in the analysis. Choi et al 5 also found that the fusion rate of C6/7 was significantly lower than that of other levels. However, in our study, multivariate logistic regression analysis had a limited effect on fusion rate.
In addition, our results showed that the BMI of patients in the non-fusion group was higher at 3 months after surgery; however, the mean BMI differed between the 2 groups only by 1. Moreover, the fusion rate of men was lower than that of women at 3 months postoperatively, which contrary to how it is commonly observed. This difference was not observed beyond 3 months postoperatively; thus, this result must be interpreted carefully.
This study has some limitations that should be acknowledged. First, this was a retrospective study, which may have introduced some bias. Second, biomechanical analysis may be needed to prove the relationship between segment slope and shear stress in the future. Finally, the indices of bone metabolism in the patients’ blood and genetic factors before surgery were not included in the analysis because this examination was not conducted for all patients.
Conclusion
Preoperative segment slope may be used as a predictor of early fusion after single-level ACDF. It is collinear with the preoperative T1 slope and easy to measure. A preoperative segment slope greater than 10.21°, 14.56°, and 21.08°, indicates non-fusion at 3, 6, and 12 months postoperatively, respectively. In addition, osteoporosis and osteopenia were predictors of non-fusion at 6 and 12 months postoperatively. The results of the study can help surgeons take specific measures to promote early fusion.
Footnotes
Acknowledgments
We are very grateful to those who helped in the study process.
Declaration of Conflicting Interests
The author(s) declared no potential conflicts of interest with respect to the research, authorship, and/or publication of this article.
Funding
The author(s) disclosed receipt of the following financial support for the research, authorship, and/or publication of this article: This work was supported by the Sichuan Province Science and Technology Support Program of China (No. 2019YFQ0002 to Hao Liu and No. 2022YFS0101 to Yang Meng); and the 1.3.5 project for disciplines of excellence, West China Hospital, Sichuan University (No. ZYJC21070 to Yang Meng).