
Abstract

Meta-analysis is the statistical procedure for combining data from multiple studies. Meta-analyses are being conducted with increasing frequency (Figure 1). Compared to a single clinical study, they can increase statistical power, improve accuracy, and provide a summary of findings with respect to key clinical questions. Understanding the statistical models underlying the analysis is important. The number of PubMed articles over time with “meta-analysis” in the title.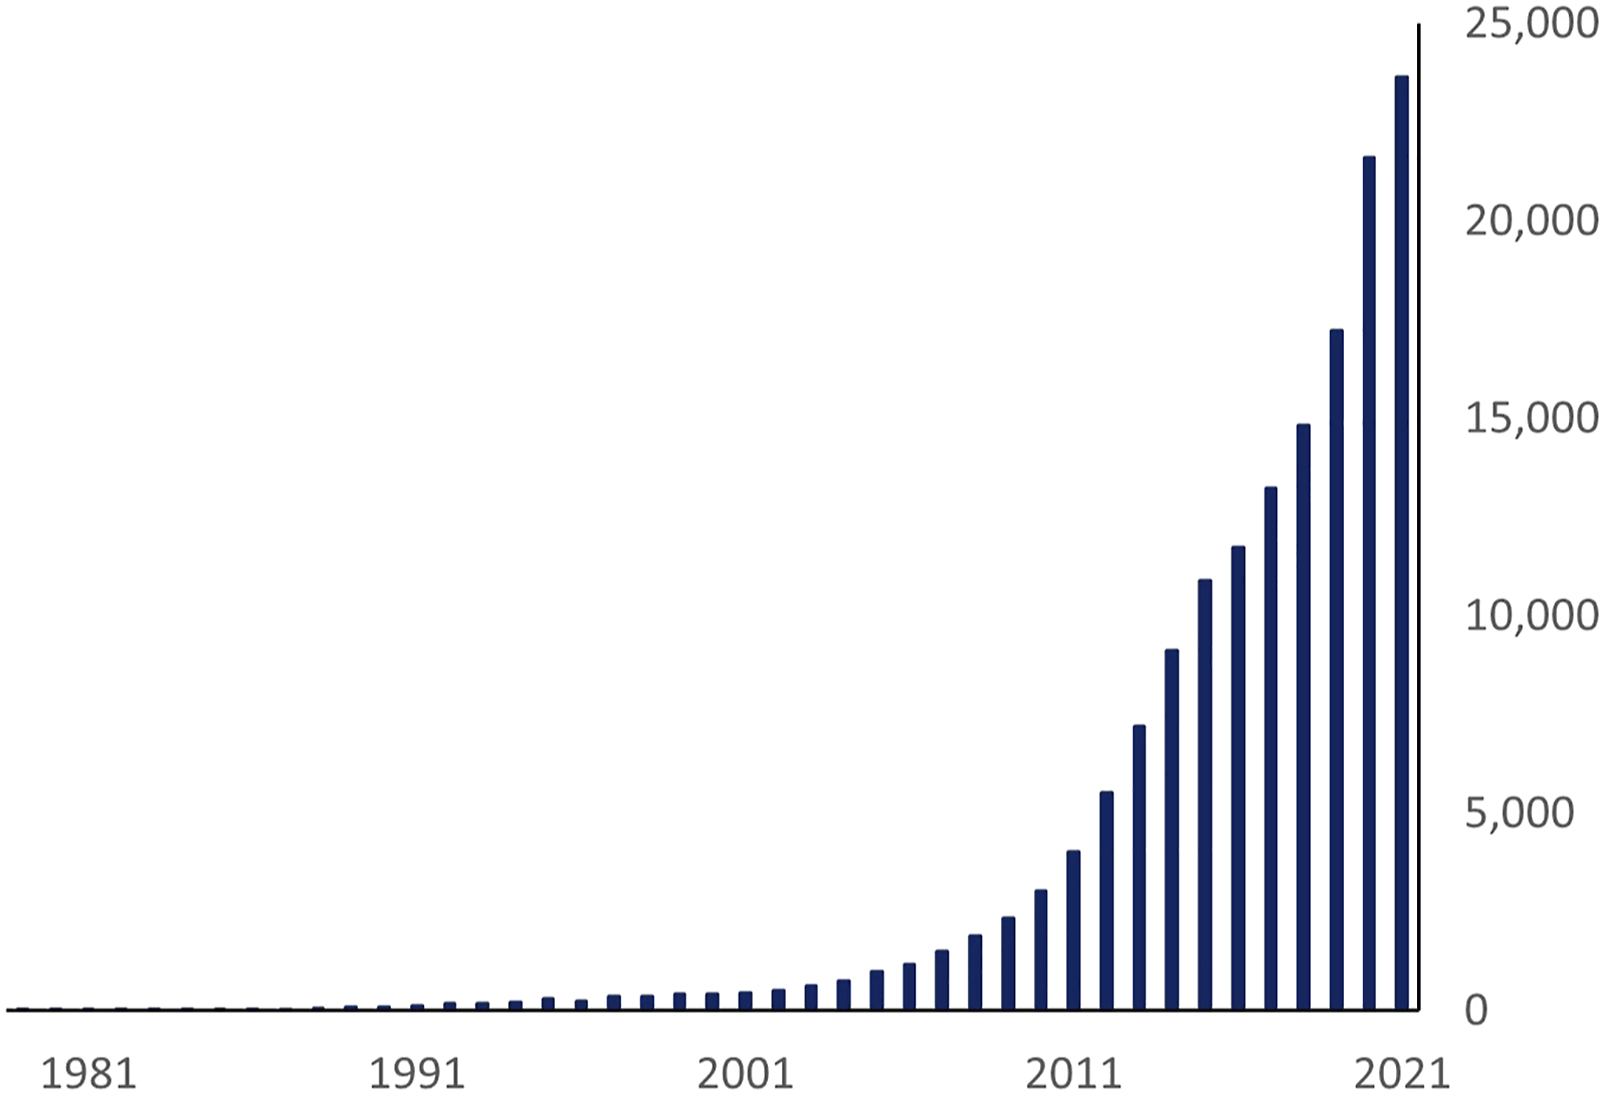
Most meta-analyses are based on 1 of 2 statistical models, the fixed-effect model or the random-effects model. 1. Understand that the assumptions for each model are different.
1
The
The
2. Understand that the statistics for each model are different.
We know that in a meta-analysis, a pooled estimate is calculated as a weighted average of the effect estimates within the individual studies. Weights are assigned to each study based on the inverse of the overall error variance (ie, 1/variance). Generally, more weight is given to studies with larger sample sizes.
In the
In the
3. Understand that the results under each model may be similar or different.
By way of example, we use selective data from a meta-analysis on the risk of nonunion in smokers undergoing spinal fusion.
2
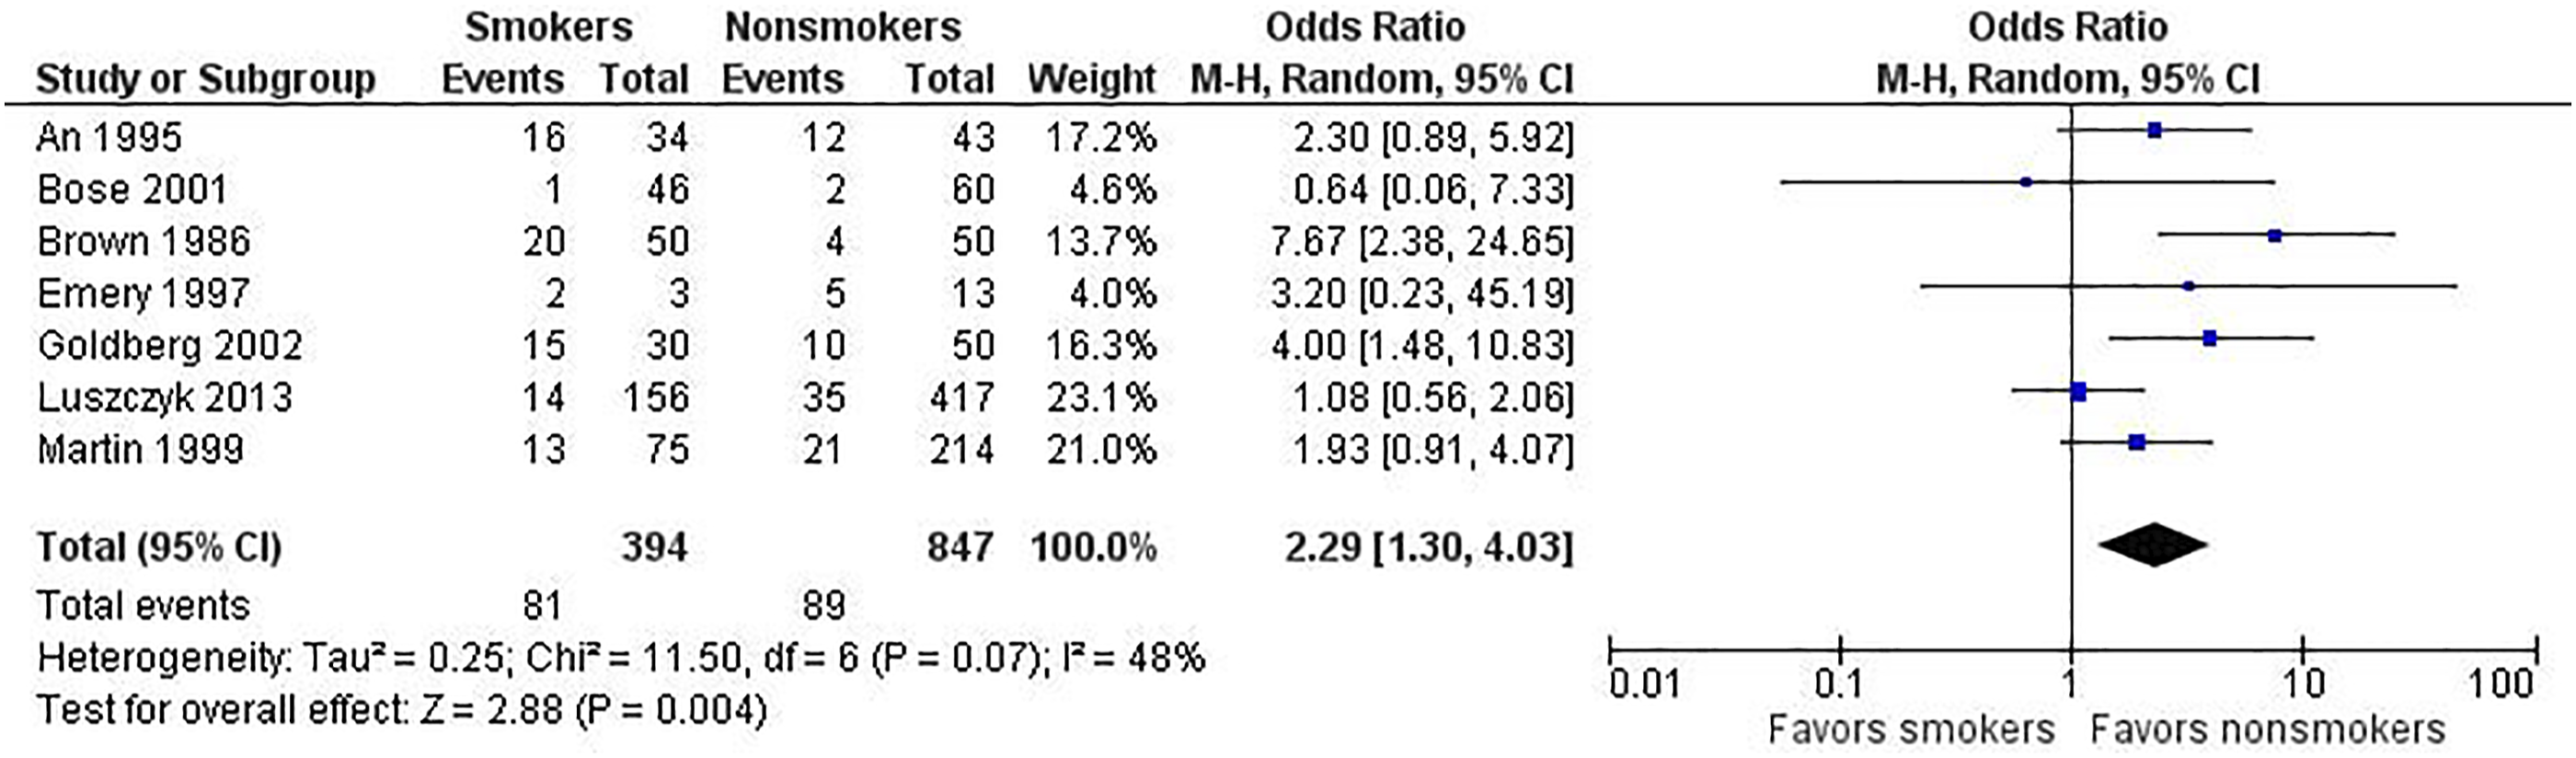
We present the same data for the fixed-effect (Figure 2) and random-effects (Figure 3) models to underscore how the different analyses affect the results. Note the following differences.
3
First, the study weights listed in the metaanalysis table and represented by the size of each study’s point estimate (box) are more similar under the random-effects model. Specifically, note the size of the boxes for the largest study (Luszczyk 2013) vs the smallest study (Emery 1997) under the 2 models. Second, the estimate of the effect size differs between the 2 models. In this case, the random-effects model results in a larger effect size, 2.39 vs 2.11 for the fixed-effect model. The results generated from fixed-effect and random-effects models can be the same or different, with either model yielding a higher estimate of the effect size. Third, the confidence interval for the summary effect is wider under the random-effects model. This will always be the case because the model accounts for 2 sources of variation. Example of a fixed-effect analysis. Example of a random-effects analysis.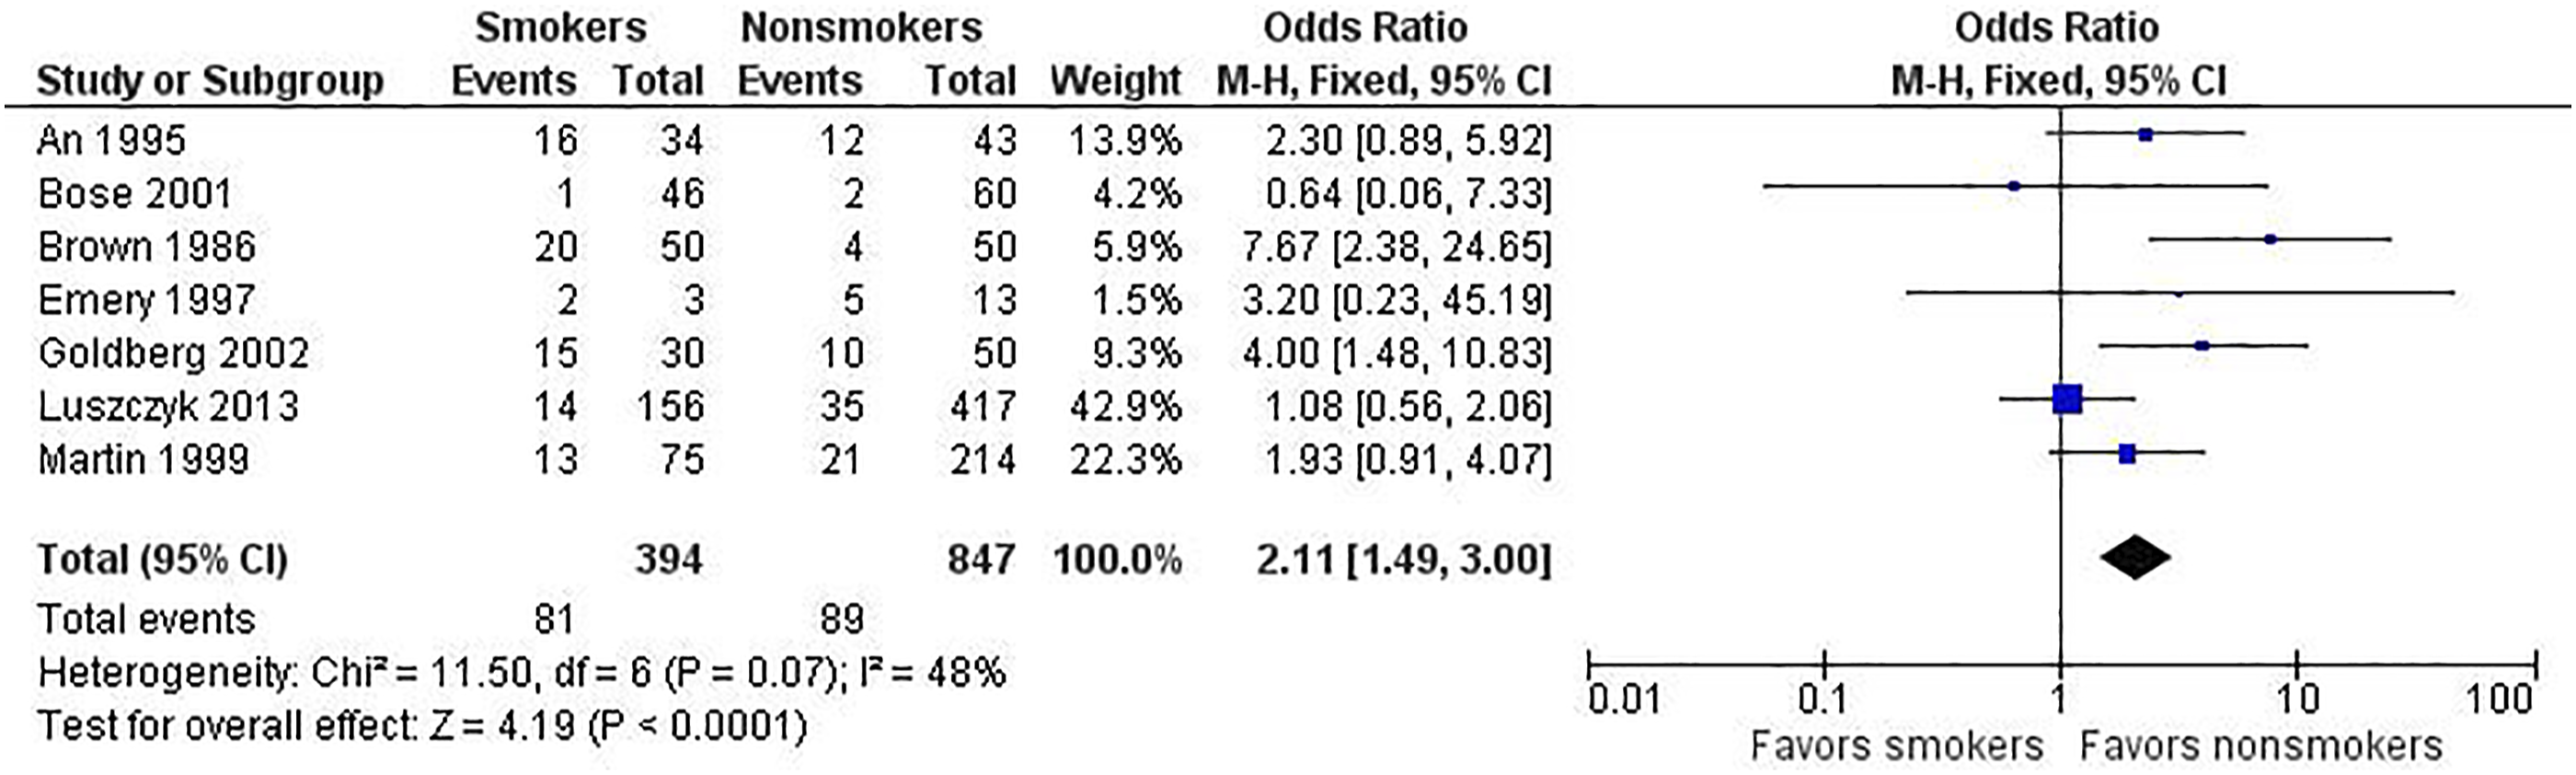
Which model to use depends on the circumstances. Generally, the random-effects model is often the appropriate model, capturing uncertainty resulting from heterogeneity among studies. When there are too few studies to obtain an accurate estimate of the between-studies variance, one may consider a fixed-effect model. Likewise, in the scenario of a high-quality study with a large sample size and a low-quality study with a small sample size, a fixed-effect model will provide a greater weight to the larger, better-quality study. 4
Footnotes
Declaration of Conflicting Interests
The author(s) declared no potential conflicts of interest with respect to the research, authorship, and/or publication of this article.
Funding
The author(s) received no financial support for the research, authorship, and/or publication of this article.