
Abstract
Study Design
Retrospective case series study.
Objectives
This study aims to compare preoperative indices, including the modified frailty index-11 (mFI-11), modified frailty index-5 (mFI-5), Oswestry Disability Index (ODI), and psoas muscle index (PMI), as they relate to outcomes in adult spinal deformity (ASD) surgery.
Methods
We identified 235 patients who underwent thoracolumbar ASD surgery (≥4 levels). The mFI-11, mFI-5, ODI, and PMI were determined from preoperative visits and correlated to outcome measures, including perioperative transfusion, duration of anesthesia, hospital and ICU length of stay (LOS), discharge disposition, readmission, change in ODI at last follow-up, revision surgery, and mortality.
Results
Our cohort had a mean age of 69.6 years and a male:female ratio of 1:2 with 177 undergoing an index surgery and 58 patients presenting after a failed multilevel fusion. The average number of levels fused was 9.3. The mFI-11 and mFI-5 were similar in predicting the need for intraoperative and postoperative transfusion. However, the mFI-11 was able to predict longer ICU and hospital LOS and mortality. The average preoperative ODI was 44.9% with an average decrease of 10.1% at the last follow-up. Preoperative ODI was the most significant predictor of postoperative change of ODI. Sarcopenia, defined as the lowest quartile of PMI values measured at L3 and L4, was not associated with any meaningful outcomes.
Conclusion
The mFI-11 better correlated with outcomes, indicating its increased prognostic value compared to other preoperative indices in ASD surgery. Preoperative ODI remains a significant predictor of postoperative change in ODI when evaluating ASD patients.
Introduction
As the median population age rises, the incidence of adult spinal deformity (ASD) and the need for surgical correction will continue to rise. The rate of surgical correction for ASD was reported to have doubled between 2000 and 2010. 1 Significant interest lies in identifying preoperative variables that will aid in predicting surgical outcomes and help counsel patients during the surgical decision-making process. There are several markers of frailty, disability, and sarcopenia which may be useful preoperatively to identify those at risk for adverse outcomes after long segment spine surgery.
In ASD surgery, numerous studies have found a correlation between frailty and postoperative surgical outcomes using the modified frailty index (mFI-11 and mFI-5), adult spinal deformity frailty index (ASD-FI), FRAIL scale, Charlson Comorbidity Index, and ASA score.2,3 Sarcopenia has also gained interest as a possible preoperative variable that can be used to predict surgical outcomes in spine surgery with mixed results.4-8 To our knowledge, no studies exist that compare frailty indices, disability indices, and sarcopenia metrics in their ability to predict postoperative complications after ASD correction.
The aim of this paper is to compare several preoperative variables, including the mFI-11, mFI-5, preoperative Oswestry Disability Index (ODI), and psoas muscle index (PMI) as they correlate with outcomes measures following ASD surgery.
Methods
Study Protocol
We conducted a retrospective case series study identifying all ASD patients (defined as ≥ 18 years of age) undergoing a long segment thoracolumbar fusion (defined as ≥ 4 segment instrumented fusion) for spinal deformity from January 1, 2016, to January 7, 2021. Using ICD 9/10 and Current Procedural Terminology codes, all long segment lumbar and thoracolumbar fusions were identified for spinal deformity. A neurosurgeon then reviewed all preoperative diagnoses and preoperative imaging to exclude any patients who did not have a 4 level or greater lumbar segment fusion for spinal deformity. Initially, 239 patients were identified as undergoing long segment lumbar fusion. Further investigation revealed 4 spinal tumor resections and fusion that were excluded. The study protocol was approved by our institutional review board and no informed consent was required (IRB#2019-0519).
For the remaining 235 patients, electronic medical records were used to document demographic information; comorbidities; prior surgeries; date of index long segment lumbar fusion surgery; intraoperative variables including duration of anesthesia and transfusions; perioperative variables including intensive care unit (ICU) length of stay (LOS), hospital LOS, transfusions, time to walking, and discharge location; postoperative variables including the need for revision surgery and ODI at last follow-up; and mortality. A neurosurgeon reviewed all preoperative imaging including x-rays and CT scans to identify preoperative deformity, side of deformity, Cobb angle, the sagittal vertical axis (SVA), Cobb lumbar lordosis (LL), sacral slope (SS), pelvic tilt (PT), and pelvic incidence (PI). Oswestry Disability Index scores were collected from the closest preoperative clinic visit to the index surgery and from the last postoperative clinic visit available. This was used to calculate the postoperative change in ODI. Preoperative MRI or CT was used to measure the cross-sectional area of the psoas muscle at the L3 and L4 levels. The total psoas cross-sectional area (TPA) was calculated by adding the left and right psoas cross-sectional area at the specified level. Using the height of the patient, the PMI was calculated by the following: (PMI mm2/m2 = TPA/height2). The mFI-11 and mFI-5 scores were calculated using the comorbidities collected from hospital records, and functional status was derived from preoperative clinic visits evaluation using PROMIS-29 scoring or EQ5D questionnaires.
All surgeries were performed by C.A.B., and as such, surgical indication and magnitude of fusion were at the discretion of the sole spine surgeon.
Statistical Analysis
Associated outcomes were analyzed for all patients using mFI-11, mFI-5, PMI, and preoperative ODI. Psoas muscle index and ODI were divided into quartiles. The lowest PMI quartile was compared to the highest 3 quartiles, whereas the highest ODI quartile was compared to the lowest 3 quartiles. Descriptive statistics were calculated as means with standard deviations or rates. For PMI and ODI, continuous variables were assessed for parametricity using Levene’s Test for Equality of Variances. Continuous variables were compared with a two-sided independent samples t-test if parametric, and a Welch’s t-test for non-parametric data. For mFI-11 and mFI-5, the groups were compared using Analysis of Variance with a post hoc least significant difference test to assess inter-group differences. Rates were compared using χ2, or a Fisher’s Exact test when n < 5 for a single observation. Mortality and revision surgery during follow-up were analyzed with Kaplan–Meier survival Log-Rank (Mantel Cox) test. Differences were significant when P < .05. Data analysis was performed using the Statistical Package for the Social Sciences (v24; IBM Corporation, Armonk, NY).
Results
Baseline Characteristics
Patient Demographics, Diagnosis, and Radiographic Parameters.
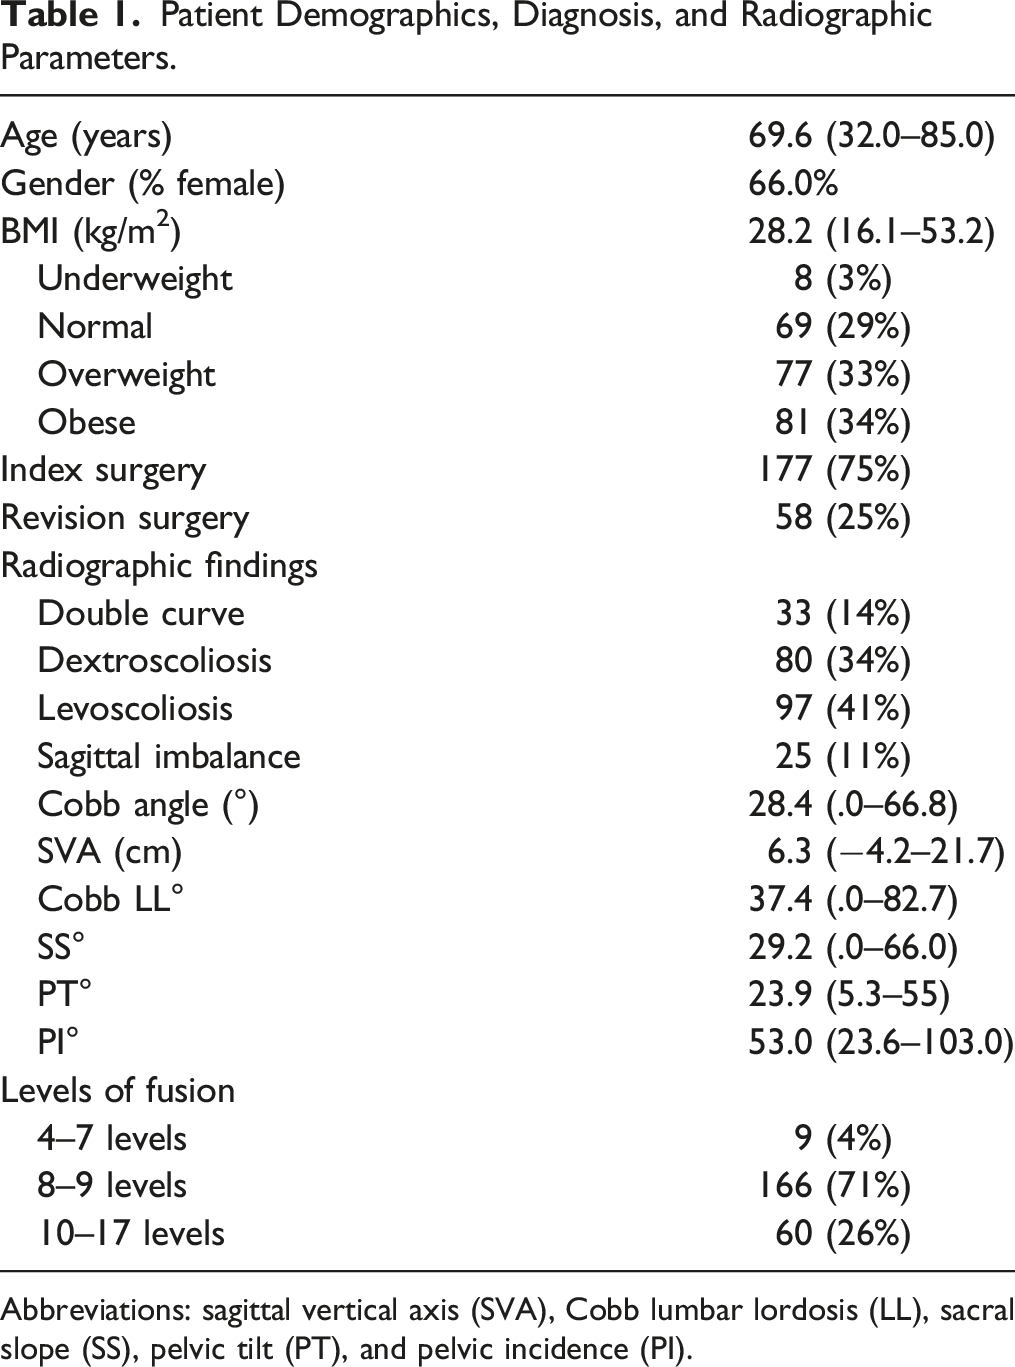
Abbreviations: sagittal vertical axis (SVA), Cobb lumbar lordosis (LL), sacral slope (SS), pelvic tilt (PT), and pelvic incidence (PI).
BMI, Comorbidities, and ASA Score
Regarding BMI, 8 (3%) patients were underweight, 69 (29%) were normal, 77 (33%) were overweight, and 81 (34%) were obese (Table 1) with 49 (21%) being Class I obesity, 22 (9%) being Class II obesity, and 10 (4%) being Class III obesity (severe obesity). 104 patients had a preoperative DEXA scan with 24 classified as normal, 43 as osteopenic, and 37 as osteoporotic. Smoking status was recorded as never in 131 patients (56%), former smoker in 95 patients (40%), and current smoker in 9 patients (4%). Within the cohort, 138 (59%) patients had hypertension, 39 (17%) had diabetes mellitus type II, 42 (18%) had obstructive sleep apnea, 64 (27%) had a cardiac diagnosis, and 60 (26%) carried a diagnosis of cancer. The ASA score was 2, 3, and 4 in 90, 139, and 6 patients, respectively.
Radiographic Parameters
The primary radiographic diagnoses were lumbar scoliosis (n = 139, 59%), thoracolumbar scoliosis (n = 70, 30%), and others including adjacent segment disease, flatback, PJK, pseudoarthrosis, and thoracic kyphosis (n = 26, 11%). The coronal imbalance was lumbar levoscoliosis (n = 97, 41%), lumbar dextroscoliosis (n = 80, 34%), thoracolumbar double curve dextro/levo (n = 26, 11%), thoracolumbar double curve levo/dextro (n = 7, 3%), and sagittal imbalance such as primarily flatback, adjacent segment disease, and kyphosis (n = 25, 11%).
The average initial Cobb angle for patients undergoing an initial surgery vs revision of a failed fusion was 29.6° +/− 10° and 21.8° +/− 11.2°, respectively. The SVA for patients undergoing an initial surgery vs revision of a failed fusion was 5.3 +/− 4.2 cm and 9.2 +/− 5.0 cm, respectively. Patients with a double curve had an average Cobb angle of 33° and 37° for the upper and lower curves, respectively. The average SVA, LL, SS, PT, and PI of the cohort were 6.3 cm, 37.4°, 29.2°, 23.9°, and 53.0° (Table 1).
PMI
The average axial cross-sectional area of the right and left psoas at the midbody level of L3 was 699.4 mm2 and 736.5 mm2. The average axial cross-sectional area of the right and left psoas at the midbody level of L4 was 1002.1 mm2 and 1023.8 mm2. The average TPA at L3 and L4 was 1435.4 mm2 and 2025.9 mm2. The average PMI at L3 and L4 was 514.4 mm2/m2 and 728.4 mm2/m2, respectively. Stratified against gender, the average PMI at L3 and L4 for women was 448.3 mm2/m2 and 646.54 mm2/m2 and for men was 605.6 mm2/m2 and 836.0 mm2/m2, respectively.
Preoperative Outcome Measures
Distribution of Frail Patients Using mFI Scale, Pre-and Postoperative ODI, and Indication for Revisions Surgery.
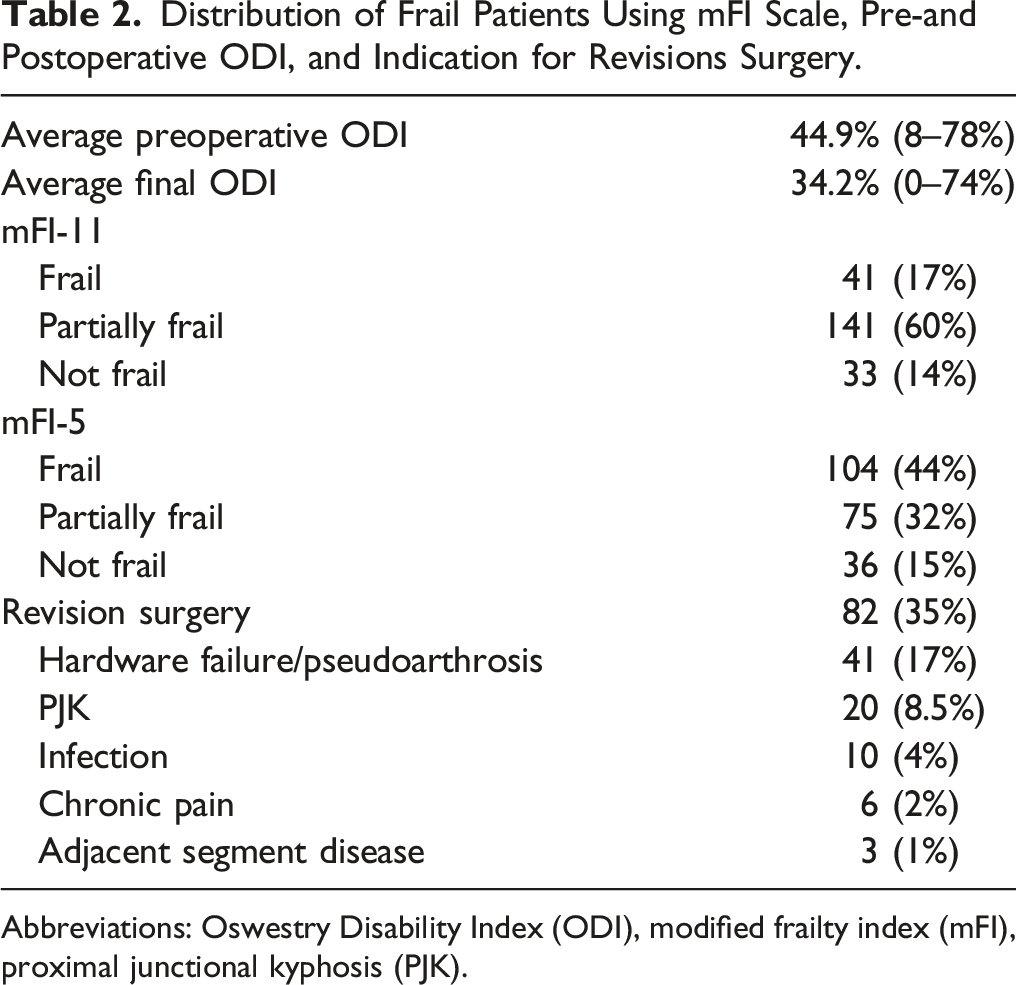
Abbreviations: Oswestry Disability Index (ODI), modified frailty index (mFI), proximal junctional kyphosis (PJK).
Sarcopenia was defined as the lowest quartile of PMI. The average PMI within the lowest quartile calculated at L3 was 333.78 mm2/m2 with a range of 135 to 403 mm2/m2. The average PMI within the lowest quartile calculated at L4 was 493 mm2/m2 with a range of 289 to 577 mm2/m2. The concordance rate was 70% between the PMI measurement at the L3 and L4 levels.
Perioperative Outcome Measures
The average duration of anesthesia was 280 minutes. The average intraoperative RBC transfusion was 1590 mL, and the average total transfusion (RBC, albumin, FFP, cryoprecipitate, and platelets) was 2472 mL. The general practice is to give tranexamic acid when no contraindications exist. The average ICU LOS was 1.2 days, and the average total hospital LOS was 5 days. The average postoperative blood transfusion volume was 620 mL. Patients were discharged home 35% (n = 83), to inpatient rehabilitation 48% (n = 113), or to a skilled nursing facility 9% (n = 20).
Postoperative Outcome Measures
The total number of follow-up months was 5463 months with a range from 3 months to 72 months. 166 patients (71%) were followed up for at least 10 months or more. The average ODI at the last preoperative clinic visit was 44.9% with a range from 8% to 78% collected from 206 patients (88%). The average last available postoperative ODI was 34.2% collected from 210 patients (89%). The average decrease in ODI was 10.1% at the last postoperative visit (Table 2).
Of the 235 patients, 82 (35%) had a complication for which revision surgery was recommended. Of those 82 complications, 10 were postoperative infections; 20 were PJK; 3 were for adjacent segment disease; 6 were chronic pain which received removal of hardware, spinal cord stimulator, or foraminotomy; and 41 were hardware failure, mainly broken rod and/or pseudoarthrosis (Table 2). The median times for revision surgery for PJK, hardware failure/pseudoarthrosis, and wound infection were 185 days, 479 days, and 87 days, respectively. There were 15 mortalities (6%) with 5 occurring 30 days from surgery and 10 occurring an average of 1.6 years (range .7–4.8 years) from surgery.
Analysis of Outcomes
Modified frailty index-11
Demographics and Outcomes Associated With Modified Frailty Indices.
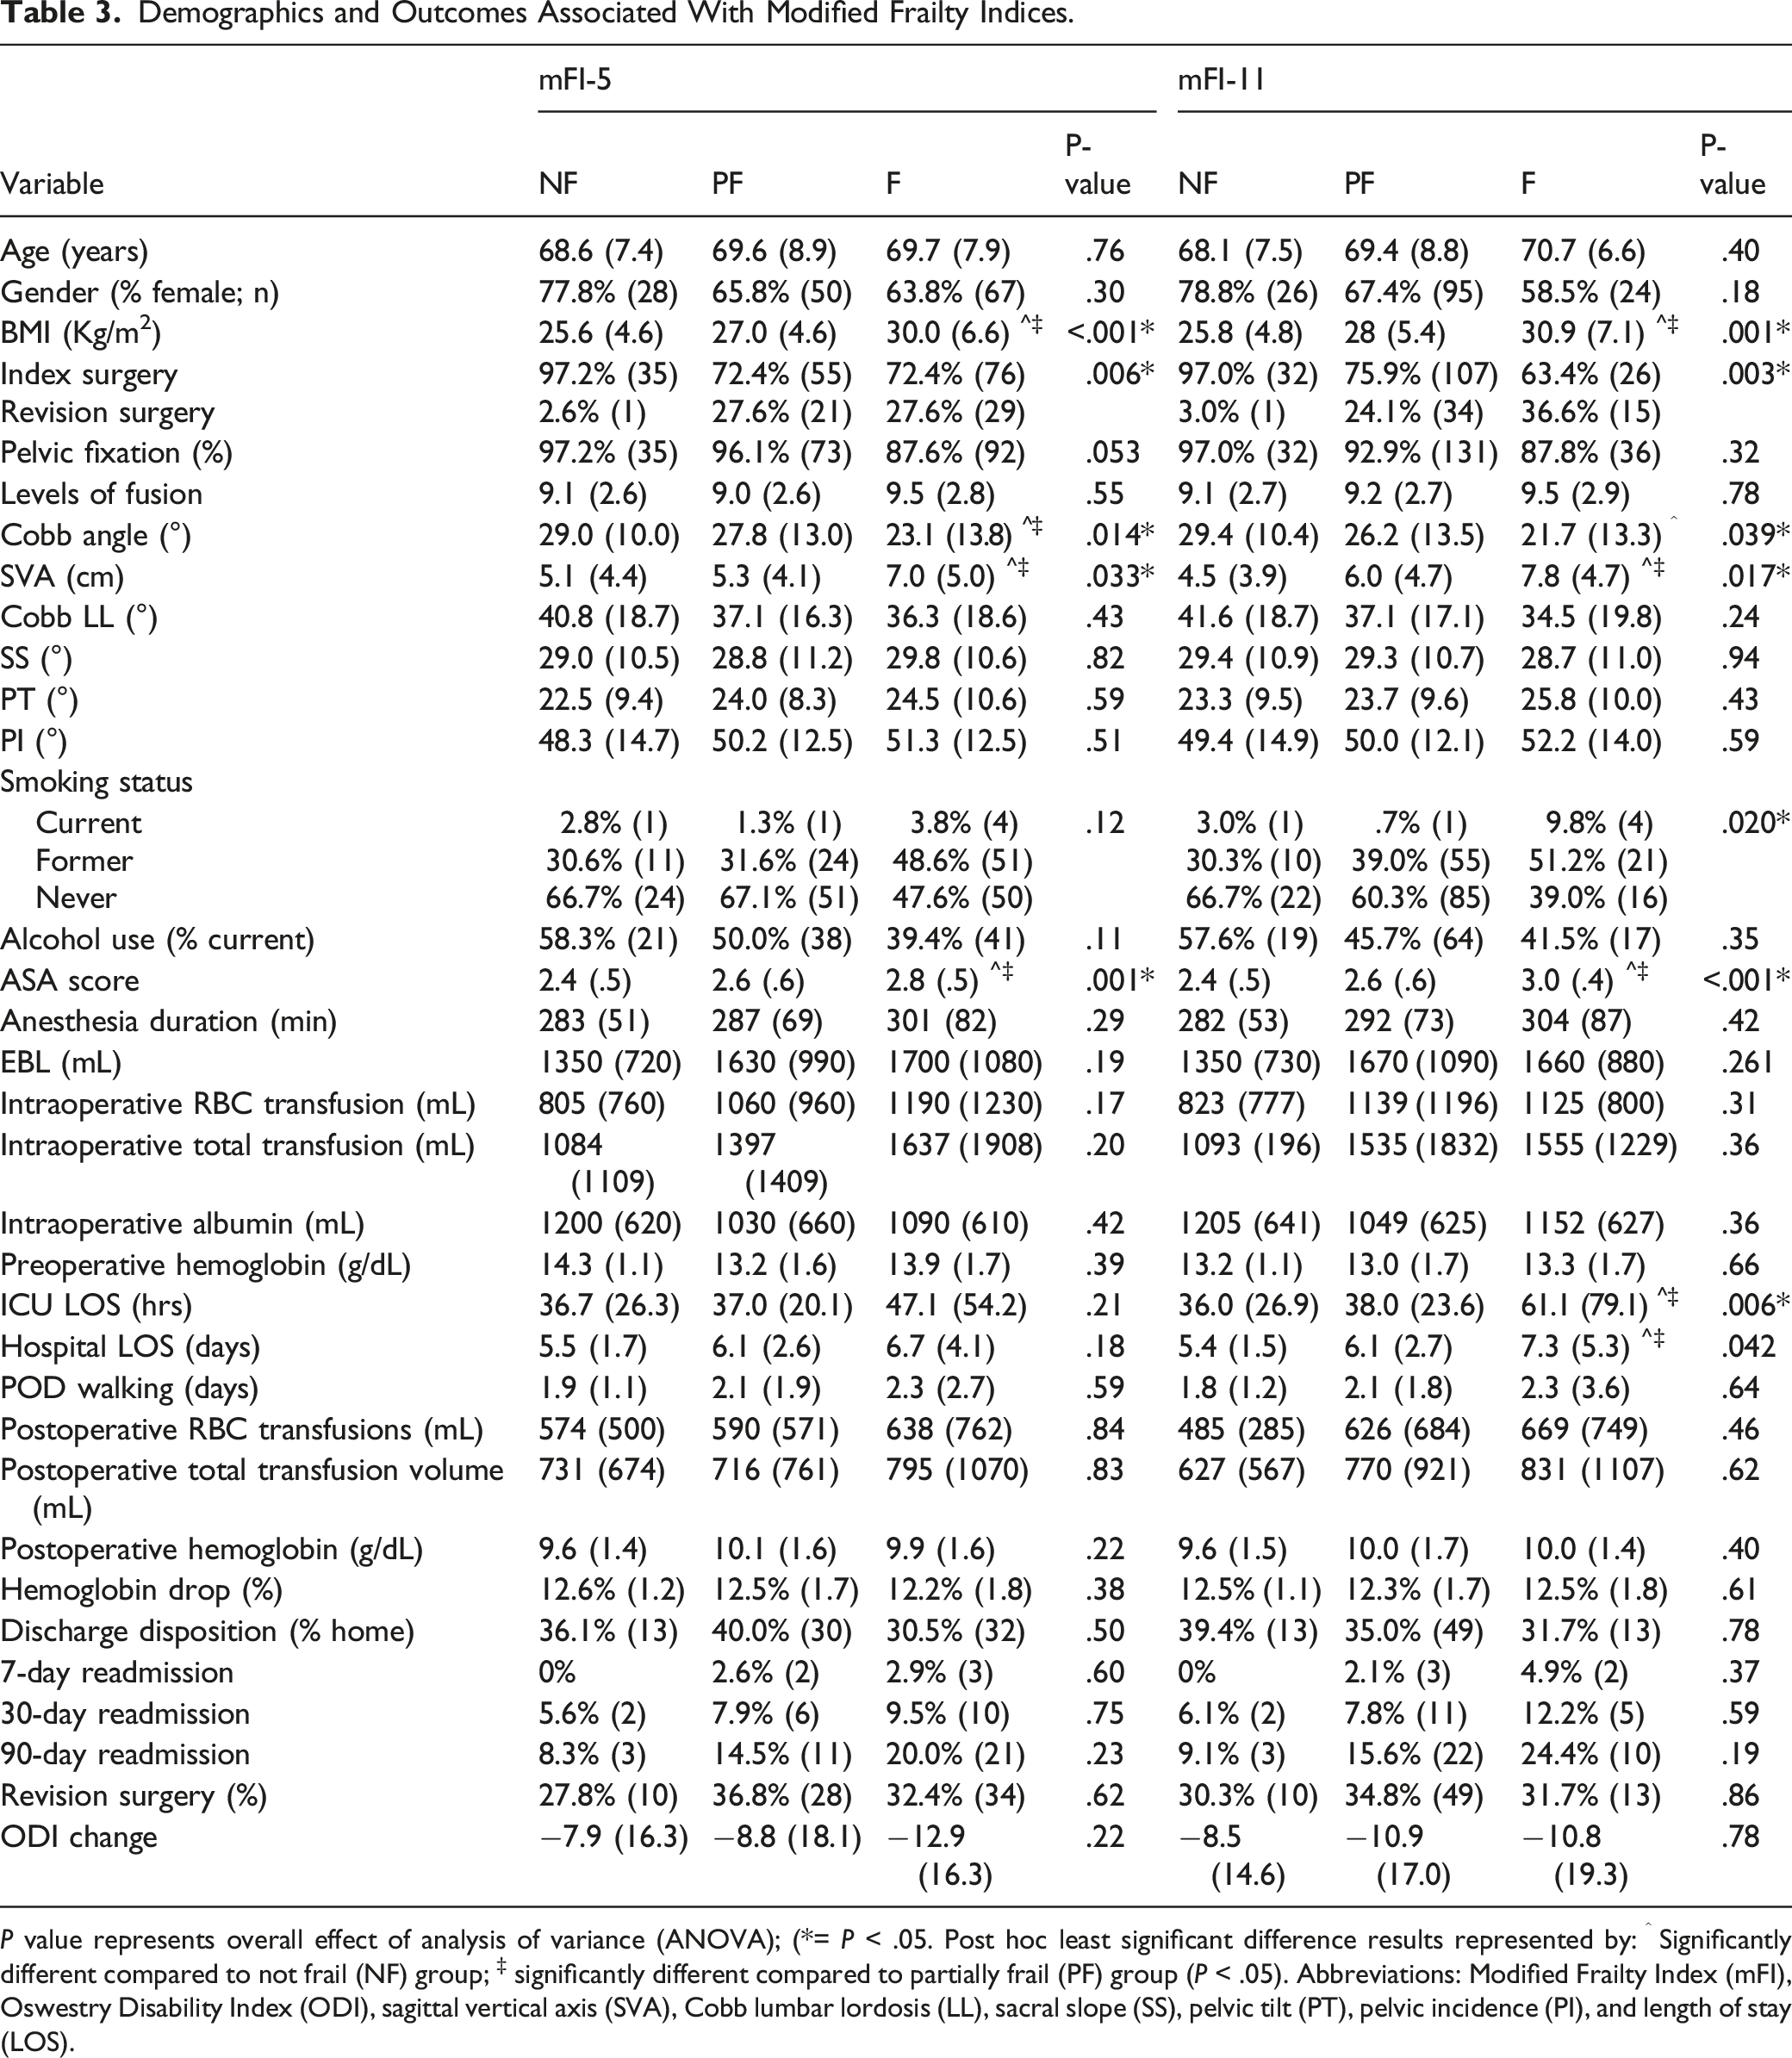
P value represents overall effect of analysis of variance (ANOVA); (*= P < .05. Post hoc least significant difference results represented by: ^ Significantly different compared to not frail (NF) group; ‡ significantly different compared to partially frail (PF) group (P < .05). Abbreviations: Modified Frailty Index (mFI), Oswestry Disability Index (ODI), sagittal vertical axis (SVA), Cobb lumbar lordosis (LL), sacral slope (SS), pelvic tilt (PT), pelvic incidence (PI), and length of stay (LOS).
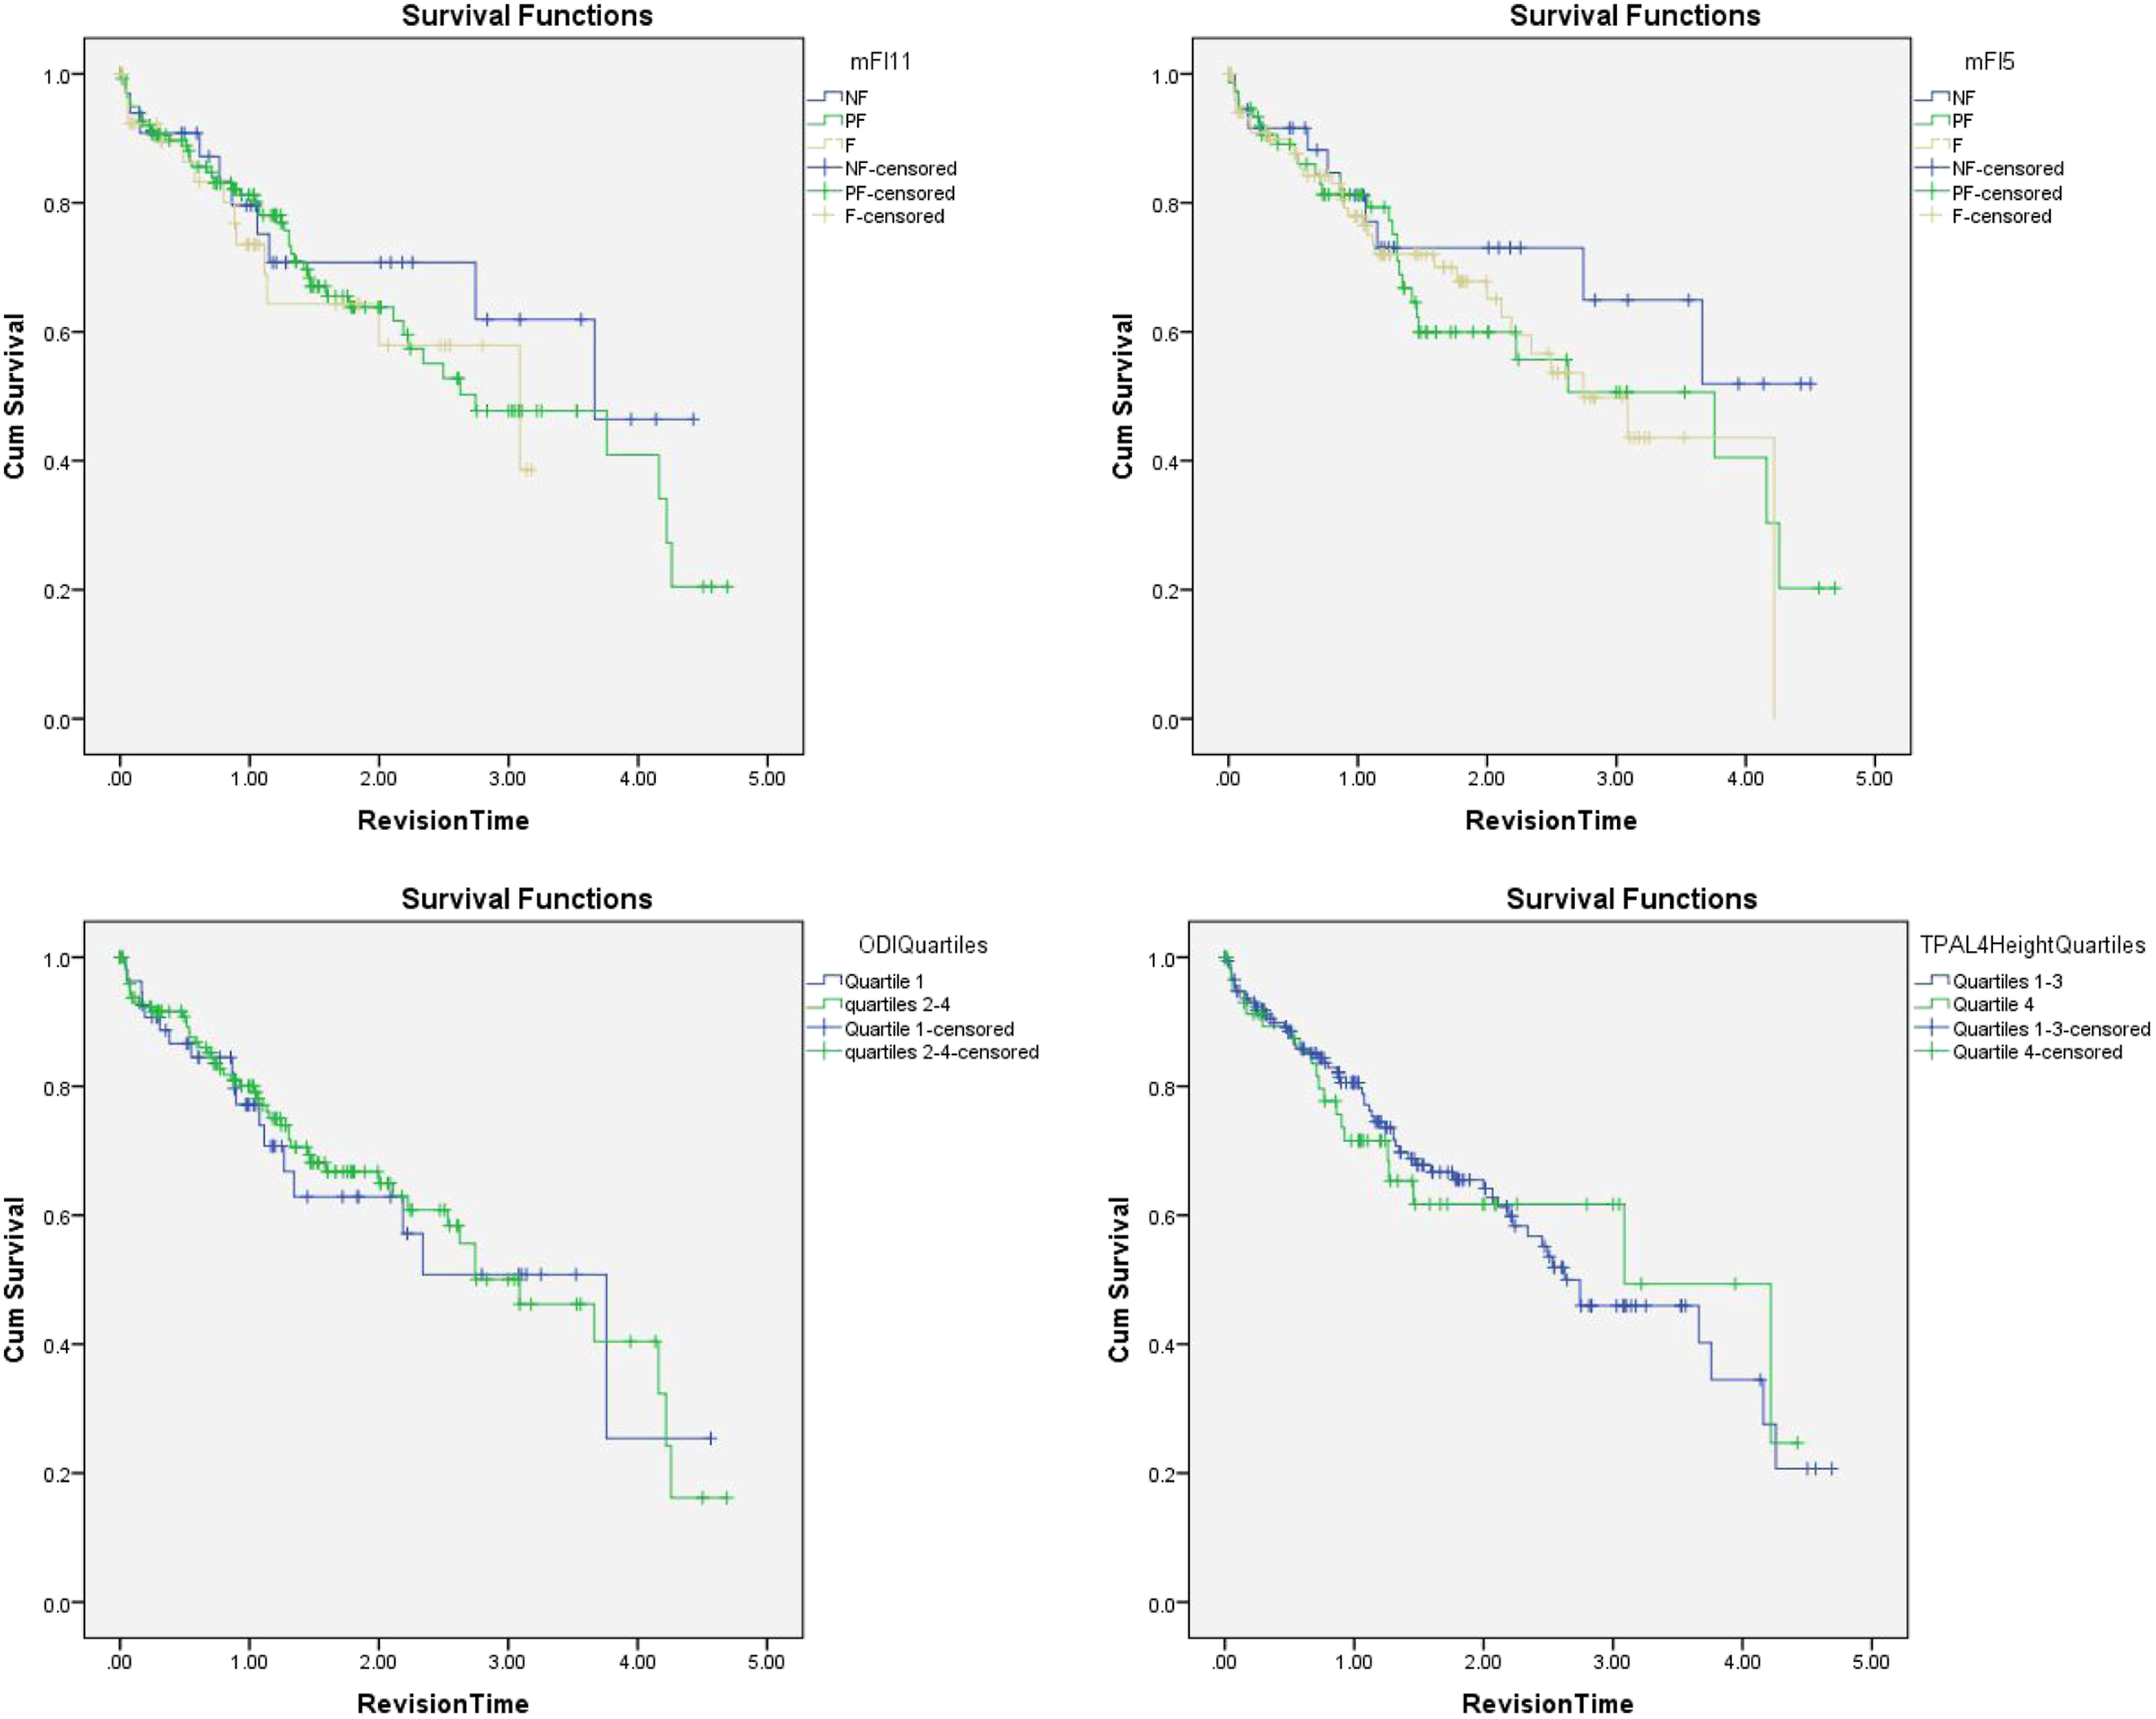
Postoperatively, there were no differences between the groups in blood product transfusion, initiation of walking, aggregate complications, discharge disposition, or readmission. However, frail patients required a significantly longer duration of stay in the ICU compared to PF and NF patients (61.1 vs 38.0 vs 36.0 hrs, respectively). Frail patients also had longer durations of total hospital LOS compared to PF and NF patients (7.3 vs 6.1 vs 5.4 days, respectively). During follow-up, there was no difference in Kaplan–Meier survival curves for receipt of revision surgery. Cumulative survival was significantly lower during follow-up in frail patients (5 deaths/41 patients, 12.2%), compared to PF (8 deaths/141 patients; 5.7%), and NF patients (0 deaths/33 patients, 0%; P = .043; Figures 1 and 2). Kaplan–Meier Survival curves depicting death during study follow-up duration for modified frailty index-5 (P = .18), modified frailty index-11 (P = .043), Oswestry Disability Index quartiles (P = .13), and psoas muscle index quartiles at L4 (P = .51). Kaplan–Meier statistics for revision surgery during follow-up duration for modified frailty index-5 (P = .48), modified frailty index-11 (.70), Oswestry Disability Index quartiles (P = .84), and psoas muscle index quartiles at L4 (P = .92).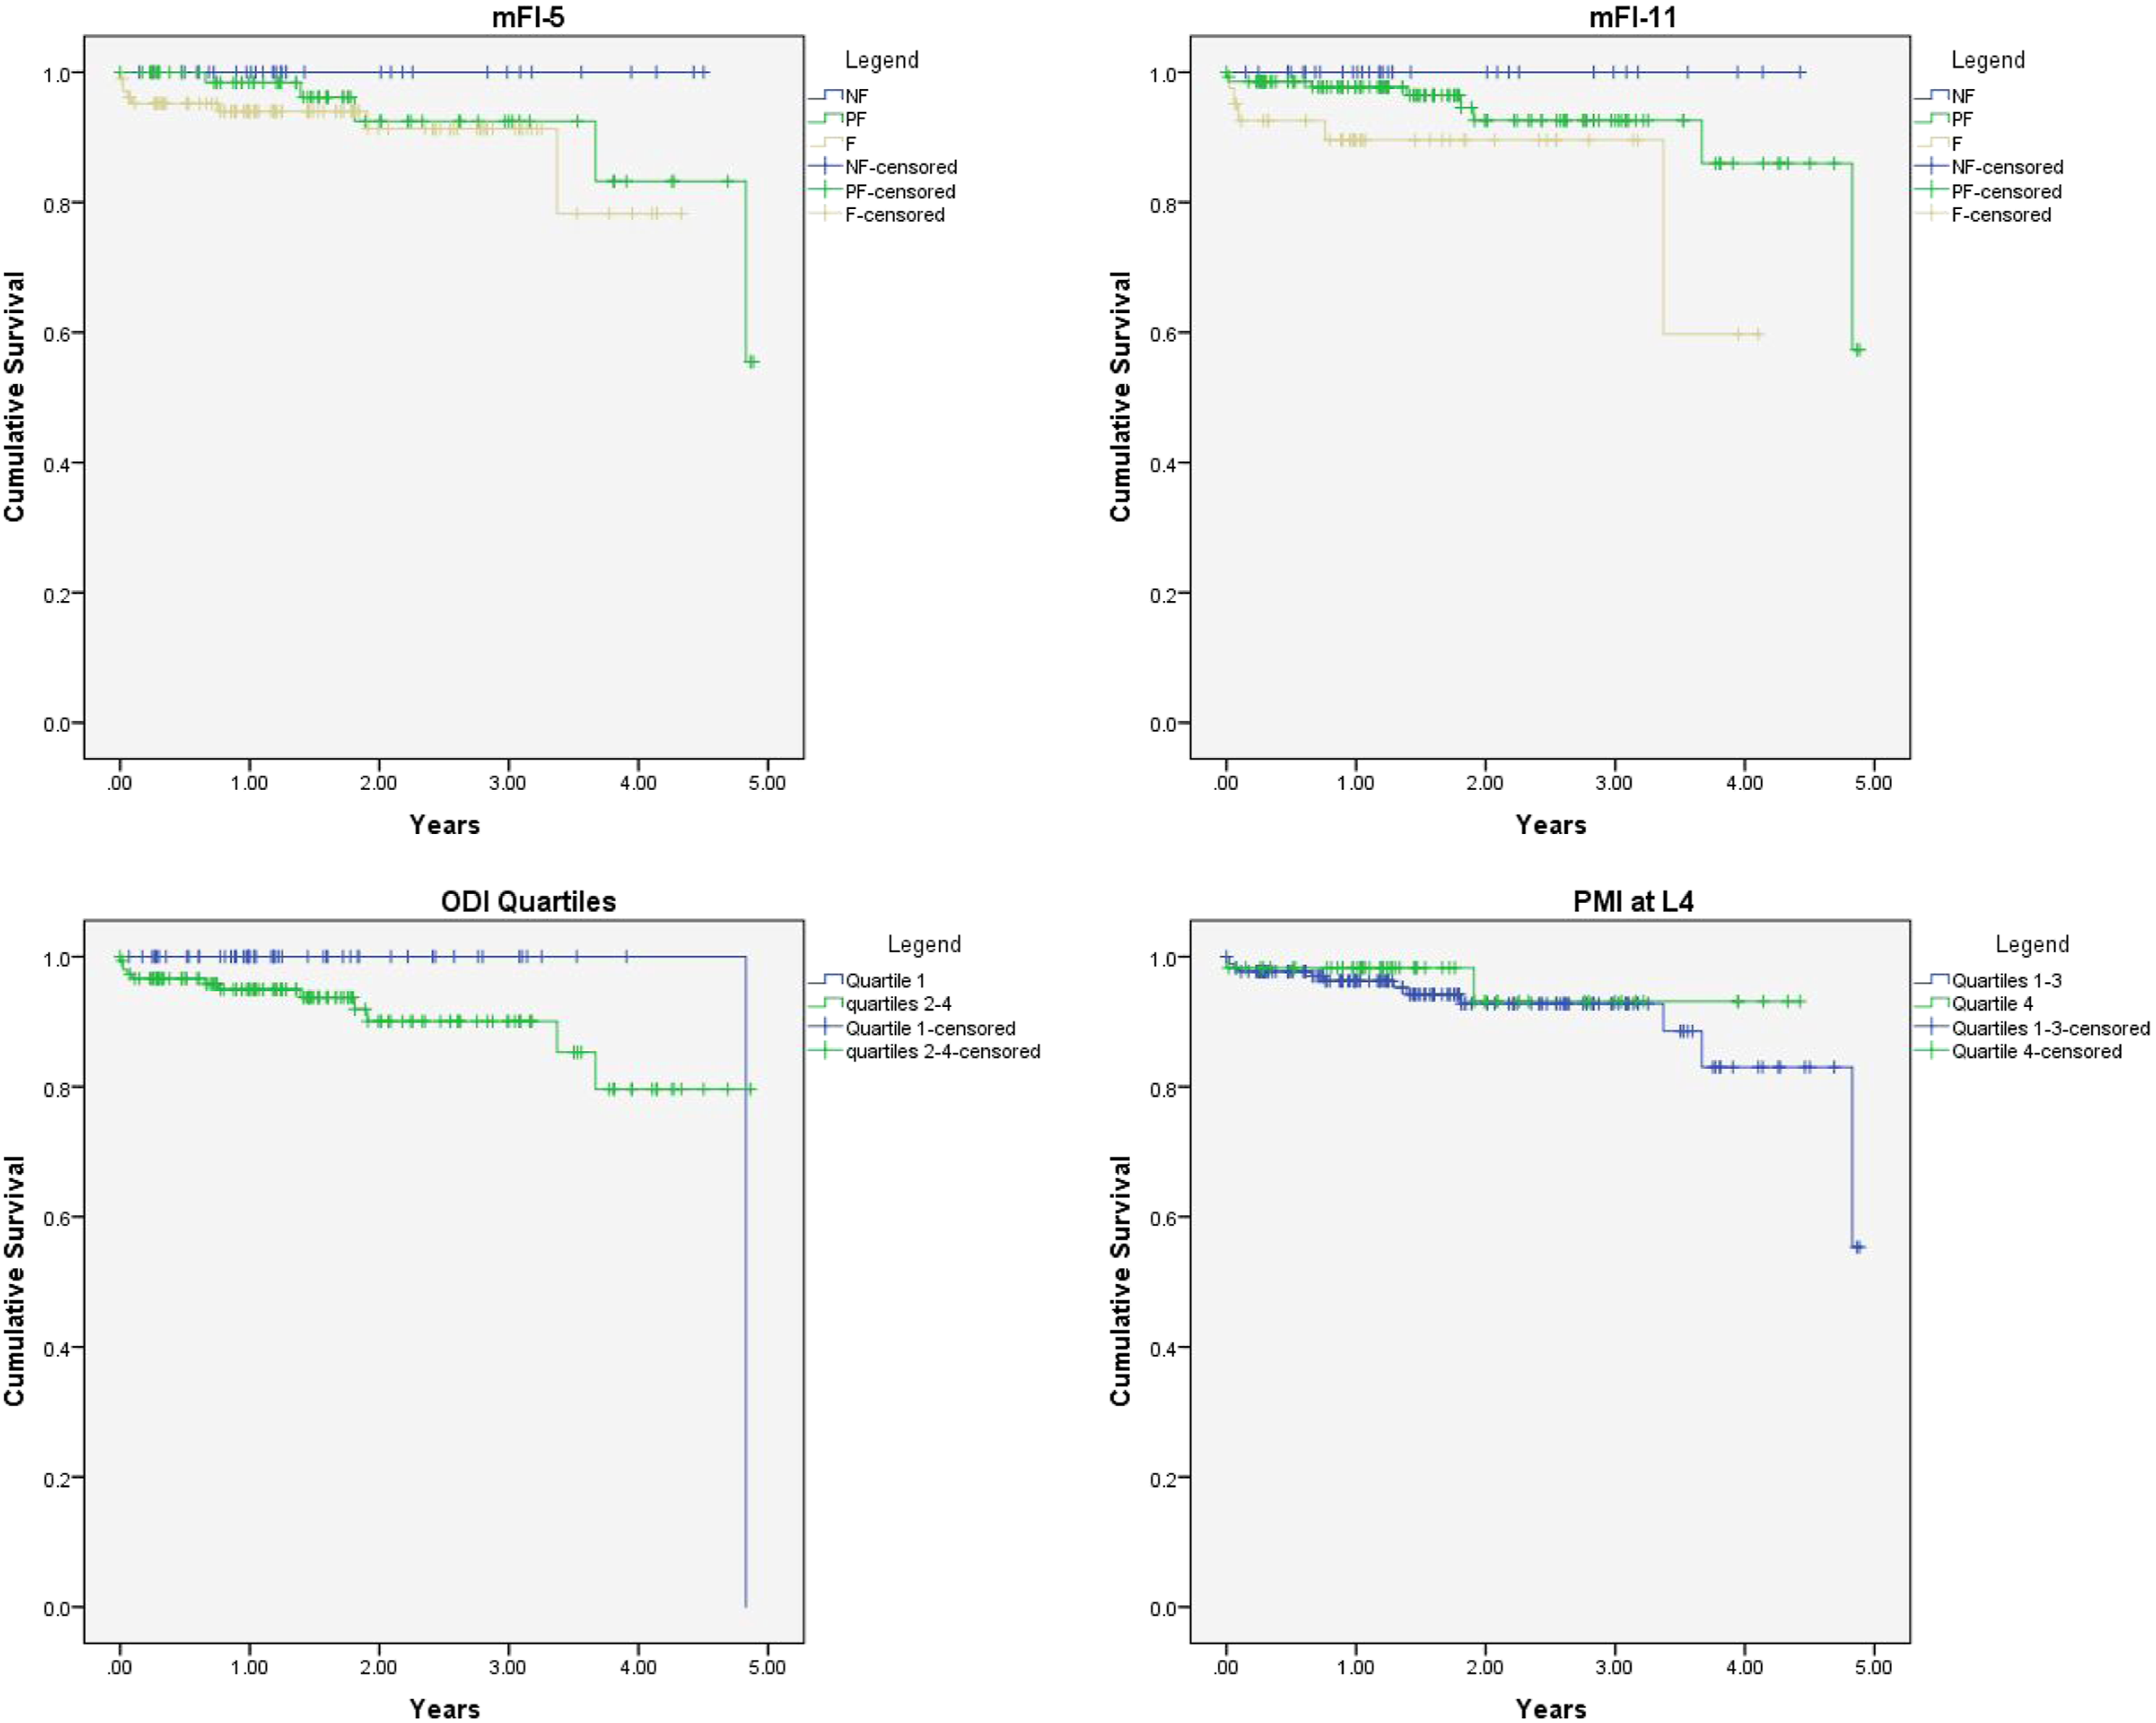
Modified frailty index-5 (mFI-5)
The preoperative demographic and health characteristics of patients classified as frail by the mFI-5 were similar to NF and PF patients. However, frail patients had a higher BMI and ASA score compared to NF and PF patients. Frail patients were more likely to have had a failed fusion (27.6%) compared to NF patients (2.6%) and had differing proportions of coronal imbalances, with a higher proportion of frail patients having no coronal imbalance. Cobb angle was significantly lower in frail patients (23.1°) compared to NF (29.0°) and PF (27.8°) patients, whereas SVA was higher in frail patients compared to NF and PF patients (7.0 vs 5.1 vs 5.3 cm, respectively). Intraoperatively, there were no differences between the 3 groups with regard to the duration of anesthesia, receipt of pelvic fixation, levels of fusion, EBL, or blood product requirements (Table 3).
Postoperatively, there were no differences between the groups in blood product transfusion, initiation of walking, discharge disposition, hospital or ICU LOS, aggregate complications, or readmission. Kaplan–Meier analysis did not show any difference in the need for revision surgery or mortality during follow-up (Figures 1 and 2).
Preoperative ODI
Demographics and Outcomes Associated With Oswestry Disability Index (ODI).
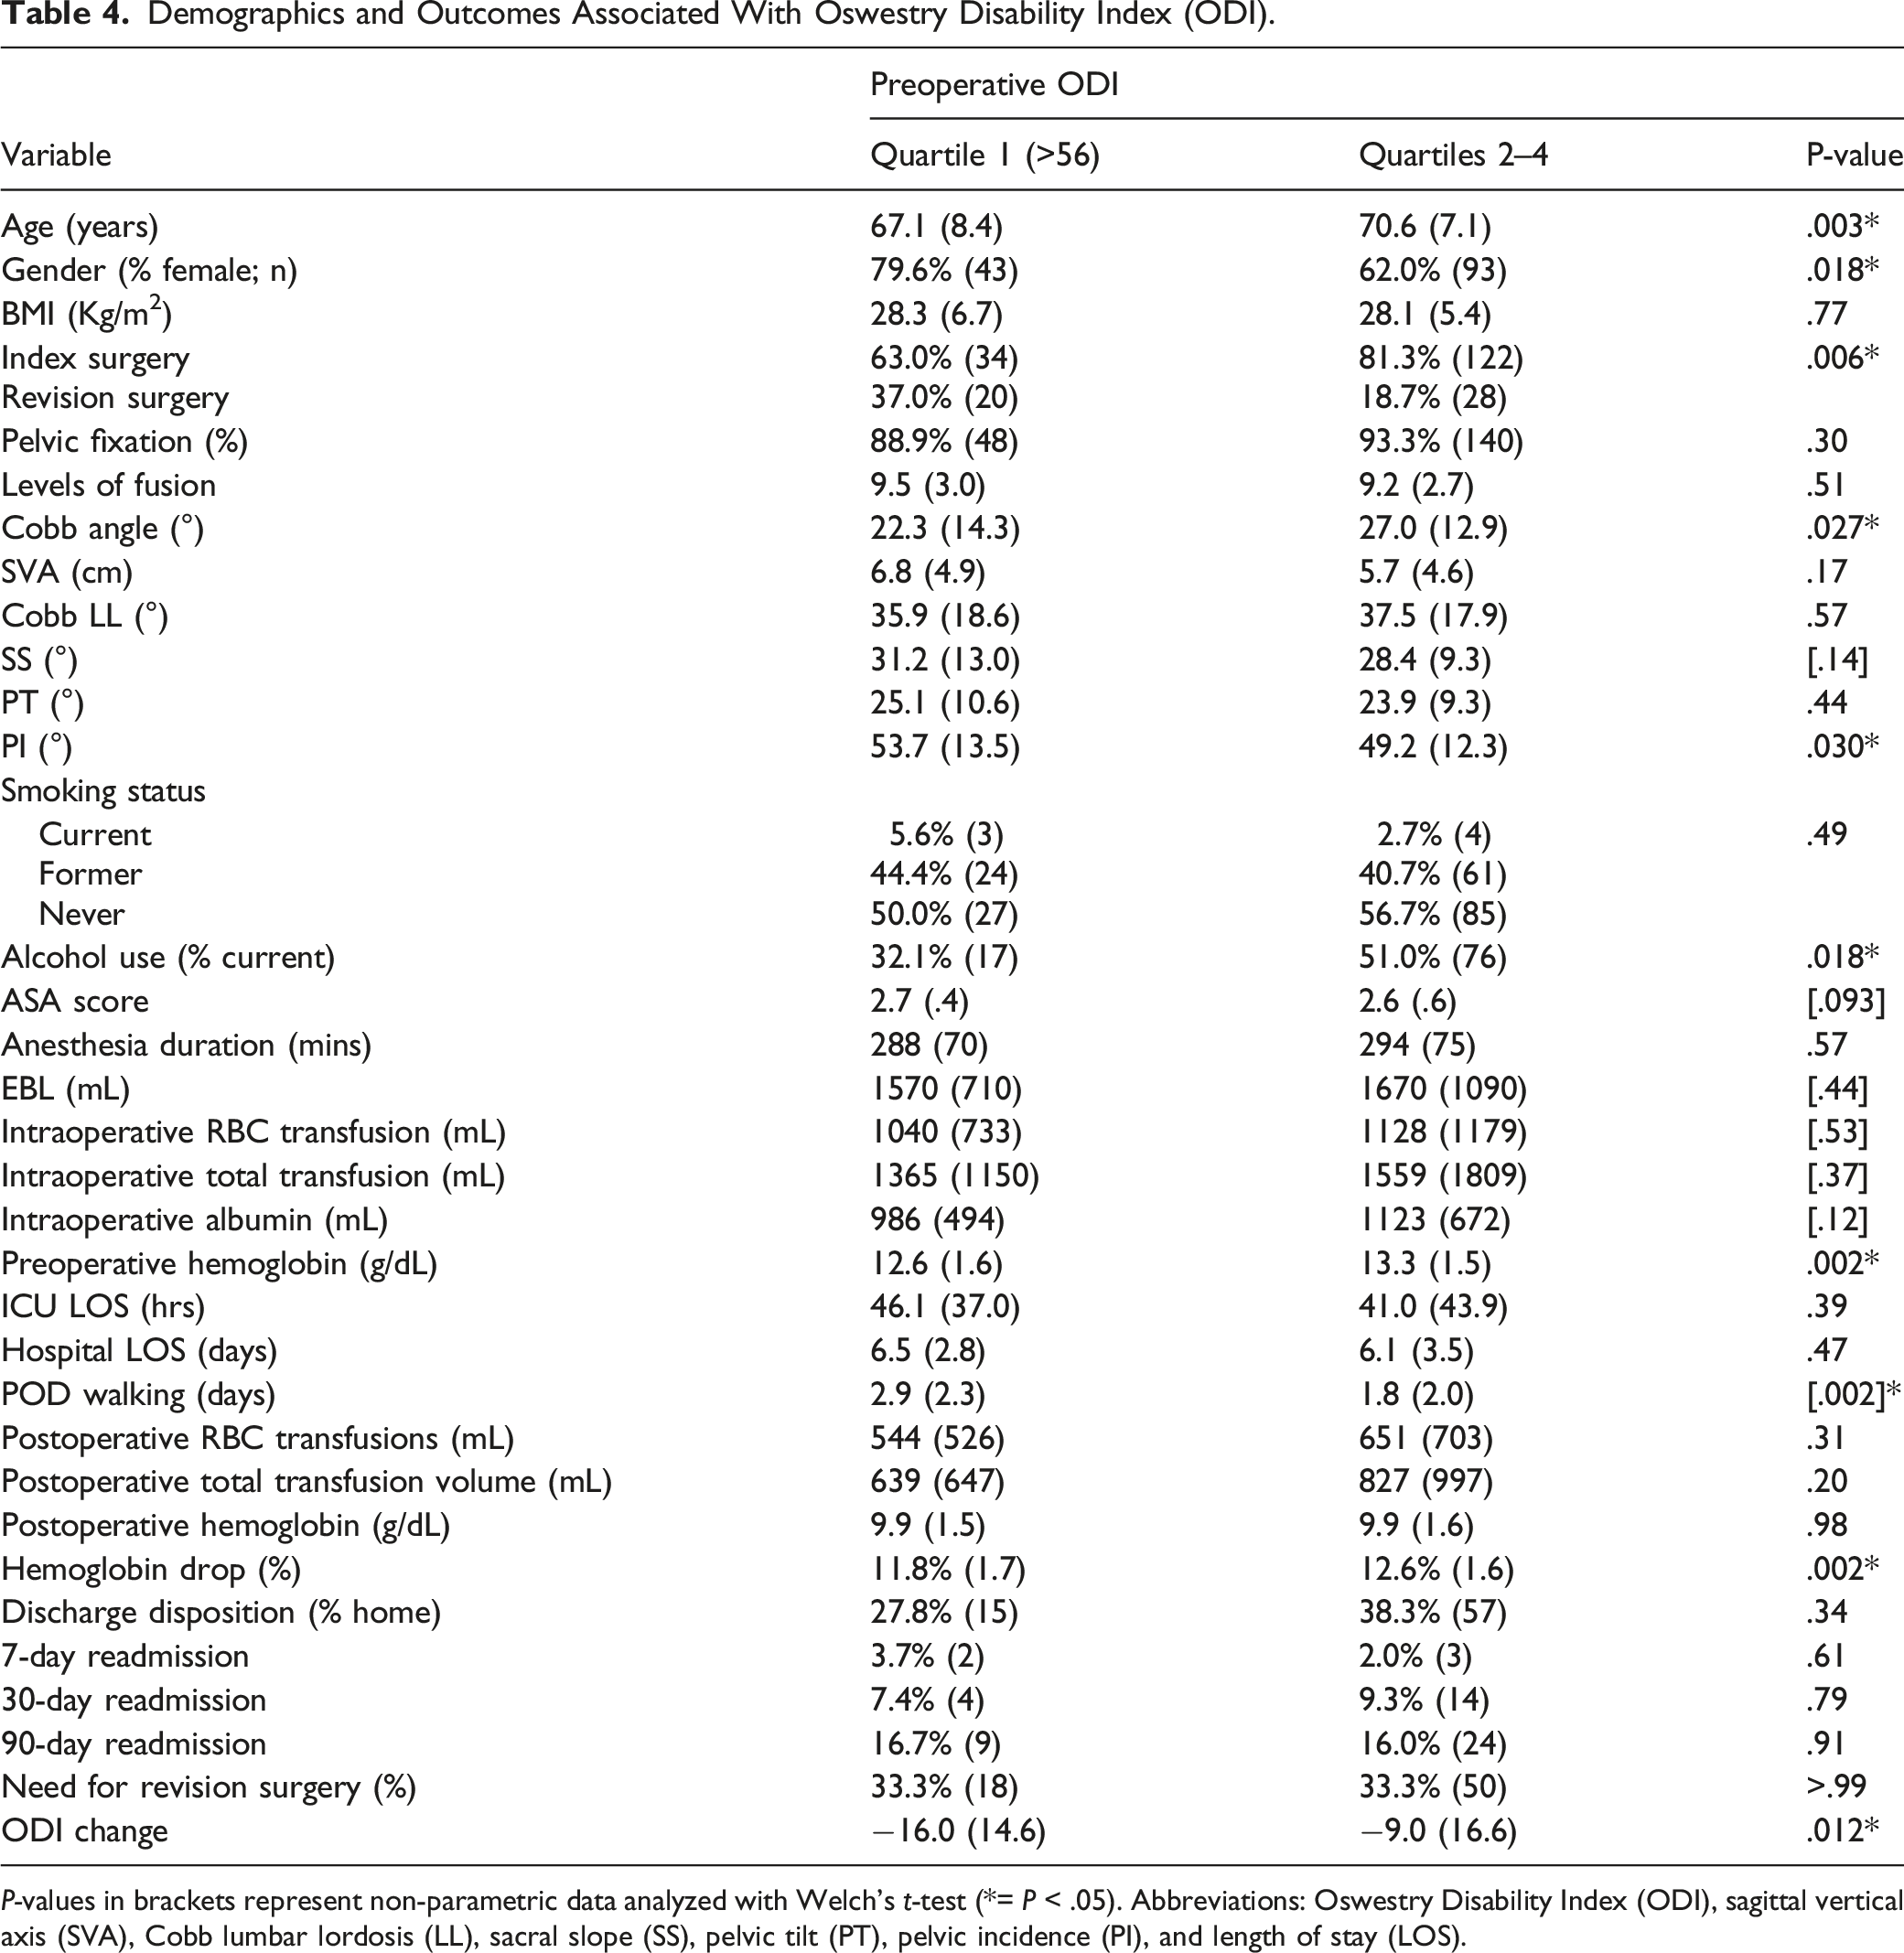
P-values in brackets represent non-parametric data analyzed with Welch’s t-test (*= P < .05). Abbreviations: Oswestry Disability Index (ODI), sagittal vertical axis (SVA), Cobb lumbar lordosis (LL), sacral slope (SS), pelvic tilt (PT), pelvic incidence (PI), and length of stay (LOS).
Postoperatively, there was no difference in aggregate complications, hospital or ICU LOS, discharge disposition, or readmission. Patients in the highest quartile received significantly lower volumes of platelet transfusions, but otherwise required a similar amount of blood product transfusion. Patients in the highest ODI quartile initiated walking at 2.9 days on average compared to 1.8 days in the lower quartiles (P = .002). During follow-up, there was no difference in mortality or need for revision surgery (Figures 1 and 2). However, patients with a preoperative ODI >56 had significantly greater decreases in ODI score during the last follow-up compared to lower quartiles (−16.0 vs −9.0 points; P = .012).
PMI
Demographics and Outcomes Associated With Psoas Muscle Indices (PMI) at L3 and L4.
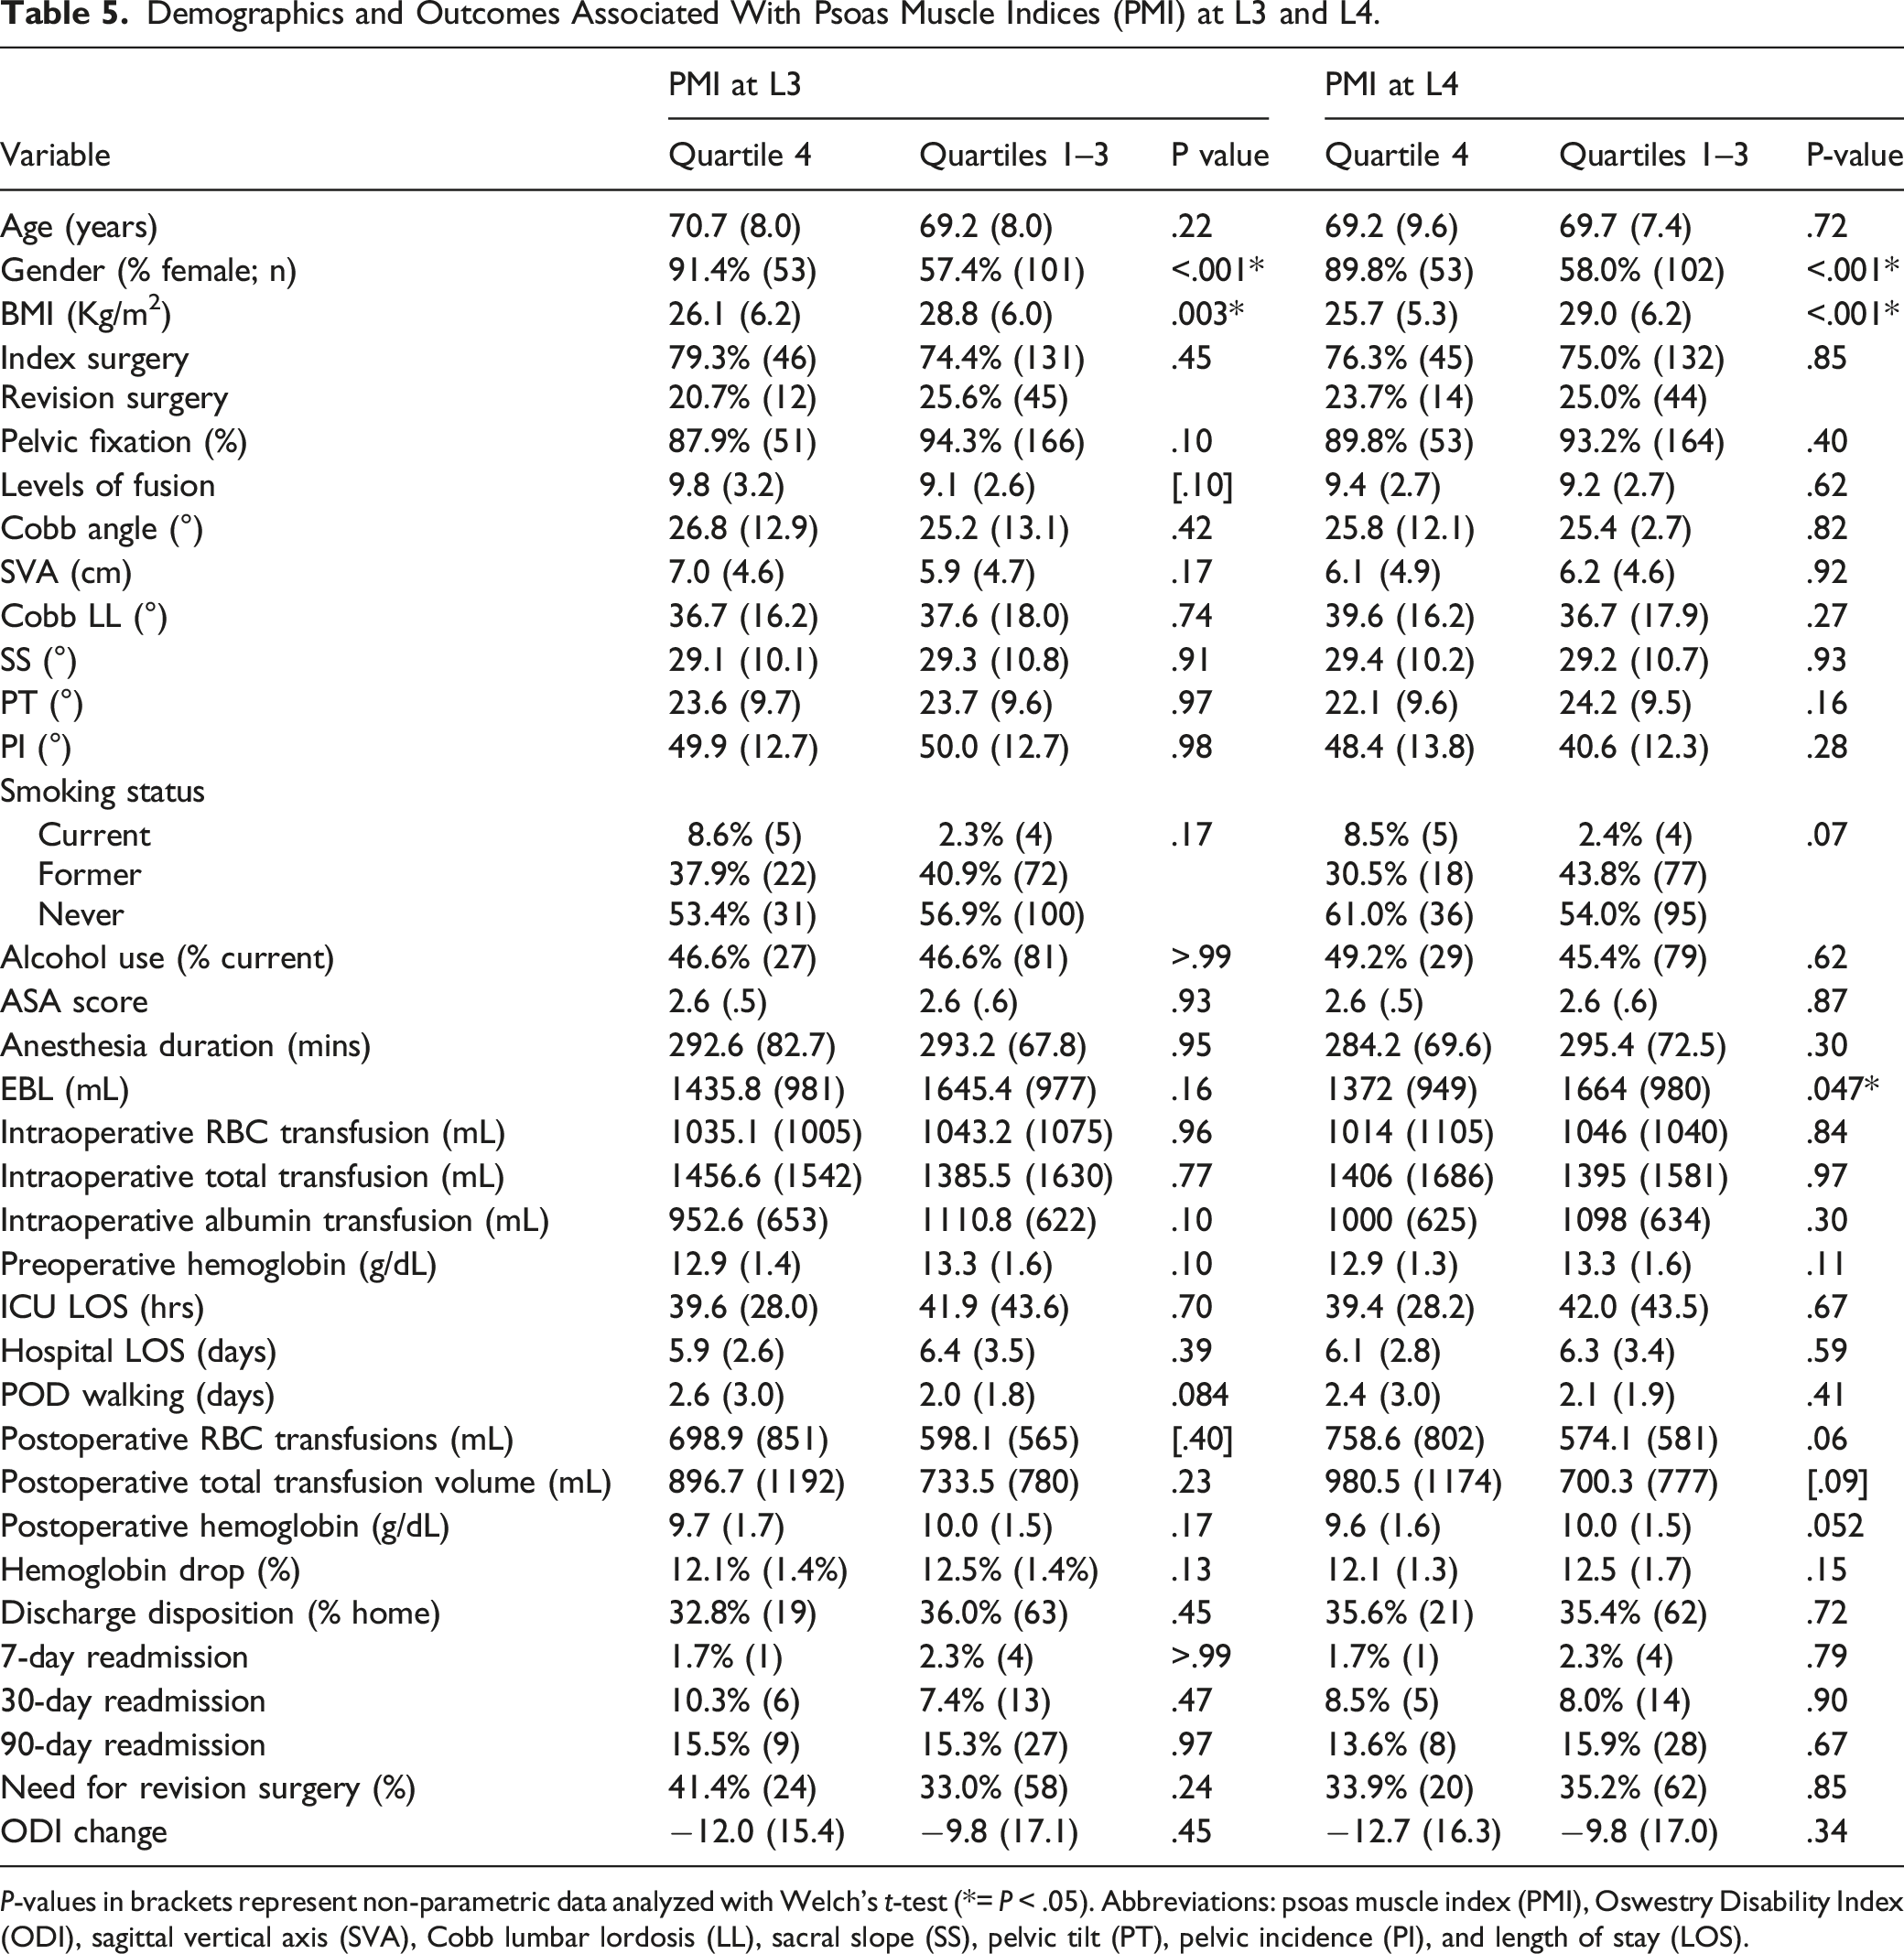
P-values in brackets represent non-parametric data analyzed with Welch’s t-test (*= P < .05). Abbreviations: psoas muscle index (PMI), Oswestry Disability Index (ODI), sagittal vertical axis (SVA), Cobb lumbar lordosis (LL), sacral slope (SS), pelvic tilt (PT), pelvic incidence (PI), and length of stay (LOS).
Discussion
Modified Frailty Index-11 and Modified Frailty Index-5
The mFI-11 has been found to correlate with complications of spine surgery outcomes including surgery for spinal tumors as well as degenerative spine conditions, and it is the most widely employed in the literature. 2 Regarding ASD, the mFI has been found to correlate with postoperative complications9,10 as well as mortality. 10 This correlation was not reported when looking specifically at elderly patients (>65 years) undergoing thoracolumbar fusion surgery. 5 When comparing the mFI-11 with the mFI-5, Yagi et al 11 reported that both were equally effective at predicting a severe adverse event postoperatively in ASD surgery.
In our cohort, frail patients, as defined by mFI-11 and mFI-5, were more likely to have had a failed fusion surgery. This was also reflected in the preoperative spinal parameters where frail patients had lower Cobb angles and higher SVAs. In our results, both mFI-11 and mFI-5 correlated with ASA scores with frail patients having worse scores. When looking at posterior lumbar fusion outcomes using a National Surgical Quality Improvement Program (NSQIP) database, Ondeck et al 12 reported a similar correlation between ASA and mFI in 5 of their 6 outcomes categories with ASA showing superiority in its ability to predict LOS.
Our cohort demonstrated a significant positive correlation between both mFI-11 and mFI-5. In regard to the mFI and BMI, previous literature has reported a significant negative correlation between the variables. 13 This result is expected since the medical comorbidities typically associated with a higher BMI (ie, hypertension, heart disease, and diabetes) score positively on the mFI.
When looking at intraoperative variables, both mFI-11 and mFI-5 demonstrated that higher frailty scores trended with longer anesthesia durations, higher EBLs, larger intraoperative RBC transfusions, and larger total intraoperative transfusions (platelets, cryoprecipitate, fresh frozen plasma). This result is consistent with prior studies that have found a significant correlation between frailty, as calculated by mFI, and blood transfusion volumes for ASD surgery. 10 In regard to postoperative variables, the positive correlation between frailty scores on the mFI-11 and mFI-5 and 90-day readmission rates trended toward significance, which was not seen in association with 7- and 30-day readmission rates.
The frailty scores on the mFI-11 and mFI-5 were not significantly correlated with the changes in postoperative ODI. Using a more complex model of frailty, ASD-FI, Reid et al 14 reported an improvement in ODI of −10.3% for non-frail, −18.1% for frail, and −9.1% for severely frail, yielding the greatest absolute change in preoperative ODI amongst frail patients. However, our results reflected that frail patients, determined by the mFI-11, experienced longer hospital and ICU LOS, which was not demonstrated using the mFI-5 scores. Similarly, only higher frailty scores on the mFI-11 correlated with mortality. Overall, our cohort’s results support the mFI-11 as a superior predictive model, in contrast with the results published by Yagi et al 11
PMI
Diagnosis of sarcopenia has been defined as a two-stage diagnosis with clinical suspicion confirmed by grip strength followed by a measurement of muscle mass. 15 While the DEXA scan is considered the reference for measured muscle mass, 16 other studies have used surrogate markers including PMI,17,18 skeletal muscle index (SMI), 19 and the arm muscle area, as calculated by triceps skin and arm circumference measurements.20,21 There is emerging evidence for PMI as a correlate of total body muscle mass that may allow for reliable and efficient assessments of sarcopenia and operative risk.22,23
Within the oncology field, sarcopenia has been found to be a significant predictor of poor surgical and oncologic outcomes. 24 In regard to spine surgery, there is conflicting evidence with some reports finding that sarcopenia does correlate with postoperative complications and readmission rates4,7,8 but does not affect outcomes.5,6 In surgery for metastatic spine disease, a decreased PMI was associated with an increase in postoperative adverse events 25 and 1-year mortality. 26 However, the lack of defined cutoff values for PMI, as exists for radiographic metrics such as appendicular skeletal muscle mass and grip strength, results in great variability in how PMI is reported. This variability in PMI defined sarcopenia is seen amongst the papers discussing spine surgery outcomes. The diagnosis of sarcopenia has been reported as the absolute value of PMI (<984mm2/m2) measured at the L3-4 disc, 6 absolute values of PMI (<500mm2/m2 for males and <412mm2/m2 for females) measured at L3, 8 lowest tertile of PMI values measured at L4,4,7 and lowest quartile of PMI values measured at L3. 5
In our cohort, 2 separate PMI values were recorded at L3 and L4 with sarcopenia being defined as the lowest quartile. While the authors suspected that higher levels of sarcopenia may correlate with the degree of spinal deformity due to less muscle contribution to spine stabilization, sarcopenia was not correlated with greater radiographic parameters such as Cobb angle or SVA. Sarcopenia, defined by PMI in our cohort, was found to correlate significantly with lower BMI values, consistent with current literature. 5 There was also a trend associated with the presence of sarcopenia and lower preoperative hemoglobin values.
The presence of sarcopenia, defined by the PMI at L4, correlated with significantly higher postoperative RBC and total (platelets, fresh frozen plasma, and cryoprecipitate) transfusions, whereas this correlation trended toward significance when using the PMI at L3. However, sarcopenia, defined by either PMI measurement, was not significantly correlated with intraoperative transfusions, readmission rates, need for revision surgery, mortality, or change in ODI. Similarly, Charest-Morin et al 5 found that PMI-defined sarcopenia was not predictive of outcomes in elective thoracolumbar spine surgery. Of note, we identified significant differences in PMI values (measured at L3 and L4) between genders, as documented in other studies. 27 Future studies are needed to establish baseline values within the normal population stratified against gender.
ODI
The ODI has long been a robust tool in the outcome assessment of spine disorders and in the evaluation of various interventions.28,29 Most adopt a minimal clinically important difference (MCID) of 4 to 15, as an acceptable improvement in the treatment of ASD.30,31 In our cohort, the average decrease in ODI was 10.1%. In our study, patients with a prior failed fusion were found to have higher preoperative ODI (>56%) values as compared to patients undergoing their index surgery for adult degenerative scoliosis. Patients with a prior failed fusion undergoing a second surgery had higher SVA and lower Cobb angles compared to patients with degenerative scoliosis undergoing an index surgery. Patients in the highest preoperative ODI quartile had significantly lower Cobb angles and a trend toward higher SVAs on presentation.
An association was found between longer time to walk postoperatively with patients in the highest quartile preoperative ODI quartile. Sheer et al reported that preoperative ODI values were higher in ASD with complications postoperatively (49 vs 42.9) vs those without. 32 However, in our cohort no significant association was found between preoperative ODI and the need for revision surgery, longer hospital LOS, or other postoperative complications. Schwab et al 33 reported patients with a higher preoperative ODI are more likely to experience a substantial improvement from treatment. Further, Nielsen et al 34 showed that in elderly patients undergoing multilevel deformity surgery, those with an ODI of 71–80% had a 100% chance of improving their score by at least one decile compared to a 62.5% chance in those with a baseline of 11–20%. Likewise, in our cohort, higher preoperative ODI values correlated with greater reductions postoperatively. Our patients in the highest preoperative ODI quartile (>56%) had an average decrease of 16% as compared to 9% in the lowest three quartiles. Preoperative ODI was the only variable that correlated with the degree of postoperative change in ODI when looking at mFI-11, mF-5, and PMI. When looking at patients who elect surgical correction vs those who continue conservative treatment, higher preoperative ODI scores were reportedly more influential than similar radiographic parameters on elective surgical decision-making in ASD patients. 35
Limitations
A major limitation in the use of PMI as a surrogate marker for sarcopenia exists in the variability of PMI defined sarcopenia values. The literature is still mixed on whether an absolute value should be used or a lowest quartile. More research is needed to establish reference ranges of PMI with gender and age-specific values. In addition, the nature of retrospective research introduces its own limitations. Due to lack of functional status questionnaires in clinic, 10% of patients did not have mFI-11 and mFI-5 scores. There was variability in the total months of follow-up for each patient providing another area of limitation.
Conclusion
In our cohort of ASD patients, assessment of the various preoperative variables (mFI-11, mFI-5, ODI, and PMI) revealed mFI-11 as superior in predicting longer hospital LOS, longer ICU LOS, larger intraoperative blood transfusions, a trend toward higher rates of 90-day readmission, and mortality. Preoperative ODI remains the best predictor of postoperative change in ODI when evaluating ASD patients. Sarcopenia, as measured by PMI, did not provide any meaningful correlation with postoperative outcomes but is still an area of research in need of establishing baseline values of ASD patients with a focus on gender differences.
Footnotes
Author Contributions
Conceptualization, OSA and CAB; Data curation, OSA, NA, and KH; Writing original draft preparation, OSA, NA, MNP, and WHH; Writing review and editing, OSA, NA, MNP, WHH, KH, SGA, and CAB; All authors have read and agreed to the published version of the manuscript.
Declaration of Conflicting Interests
The author(s) declared no potential conflicts of interest with respect to the research, authorship, and/or publication of this article.
Funding
The author(s) disclosed receipt of the following financial support for the research, authorship, and/or publication of this article: C.A.B. receives royalties from K2M/Stryker. The other authors declare no other external sources of funding.