
Abstract
Study Design
Retrospective cohort study.
Objective
To validate the predictive accuracy of both the SpineSage and ACS-NSQIP surgical risk calculators in patients over the age of 80 years, undergoing spine surgery for any reason.
Methods
We included 210 consecutive patients treated with single-stage spine surgery at our institution between 2009 and 2019. The demographic details and preoperative characteristics of each patient were collected and reviewed for entry into both the SpineSage and ACS risk calculators. The estimated risk supplied by these calculators was compared to the observed rate of complications post-surgery. The main method of comparison was using receiver operating characteristic (ROC) curve analysis.
Results
Complications were identified in 51 patients (24%). Most patients underwent surgery for a degenerative cause (71%), with the majority of procedures performed on the lumbosacral spine (66%). Receiver operating characteristic (ROC) curves were calculated to compare the outcomes of each tool. Area under the curve (AUC) analysis showed similar predictive accuracy between SpineSage and ACS when predicting overall complications (0.688; P < .001 vs 0.634; P = .021). AUC analysis demonstrated that SpineSage had better predictive accuracy when estimating risk of major complications (0.778; P = .037 vs 0.675; P = .001).
Conclusion
For the prediction of risks associated with spine surgery in those aged >80 years, SpineSage appears to be preferable to the ACS-NSQIP surgical risk calculator in this single centre cohort, SpineSage was more accurate in predicting the risk of serious medical complications. The accuracy of both of these tools could still be improved upon.
Introduction
The proportion of elderly in the population continues to increase as our society ages and longevity increases. As patients live longer, the prevalence of musculoskeletal disease naturally rises too, and with advances in treatment modalities there is an increasing demand and expectation for surgical intervention.1,2 Spinal complaints in elderly patients comprise a broad range of pathology including degenerative, infective, oncologic and traumatic. 3 Surgical treatment options should be considered as an option to improve patient survival and quality of life.
Increased or extreme age is often considered a relative contraindication to surgery because of the high prevalence of comorbid disease and frailty in this group, and the greater chance of complications occurring perioperatively.4,5 Although the rate of complications is higher, these risks can still often be effectively mitigated, and surgery improve quality of life.6-8 When offering surgical treatment to these at-risk patients, it is helpful for associated risks to be quantified to allow shared decision-making. Use of ‘risk calculators’ has become increasingly popular: tools such as SpineSage or the American College of Surgeons (ACS) National Surgical Quality Improvement Program (NSQIP) surgical risk calculator have been developed based on large data sets and are available for global use.9,10
However, wider use of any clinical tool requires validation and when many options are available assessment is required to determine which is most appropriate for the specific clinic setting which may be geographically and socially remote from the developing centre(s). Accepting that those aged over 80 years represent a demographic of increased surgical risk, and in whom the use of a risk calculator may be most useful, the aim of this study is to validate the predictive accuracy of both the SpineSage and ACS surgical risk calculators in patients over the age of 80 years, undergoing spine surgery.
Materials
This retrospective analysis was approved by the hospital Clinical Audit Support Unit (Ref: 4161). This study was deemed exempt from informed consent due to its retrospective nature.
Patients treated with single-stage spine surgery at our institution were identified from hospital coding and cross-referenced against theatre operating records to ensure accuracy. The dates chosen, between December 2009 and December 2019, coincide with the availability of the digital imaging system, allowing full access to radiographic records, and allowing sufficient time for follow-up. The hospital is a 600-bed level-1 trauma centre and the tertiary referral spine centre for a population of near 1 million.
All patients over the age of 80 years who underwent spine surgery for any reason were initially included in this study. Patients without post-operative radiographic imaging, those lacking intra-operative details and those with incomplete clinical data were excluded. Unavailability of imaging and relevant patient history warranted exclusion as it would have prevented accurate calculation of surgical risk scores. In total, 210 patients were included.
Clinical notes, intra-operative details and radiographic imaging were used to confirm both the patient’s diagnosis and the particulars of their surgery. Demographics, comorbidities, complications, length of stay, American Society of Anesthesiologists (ASA) score, body mass index (BMI) and mortality were collected. These details were used to grade each patient using both the Charlson Comorbidity Index (CCI) and the 11-item modified Frailty Index (mFI-11).11,12
The risk of medical complication was calculated for each patient according to their individual comorbidities, demographics and the surgical procedure they had using the surgical risk calculators.
The ACS risk calculator considers patient demographics and comorbidities, as well as the surgical procedure, ASA and BMI. The outputs recorded from this tool included the percentage risk of any complication, the risk of a serious complication and the risk of death. 9
Elements Assessed by the SpineSage and ACS Surgical Risk Calculators.
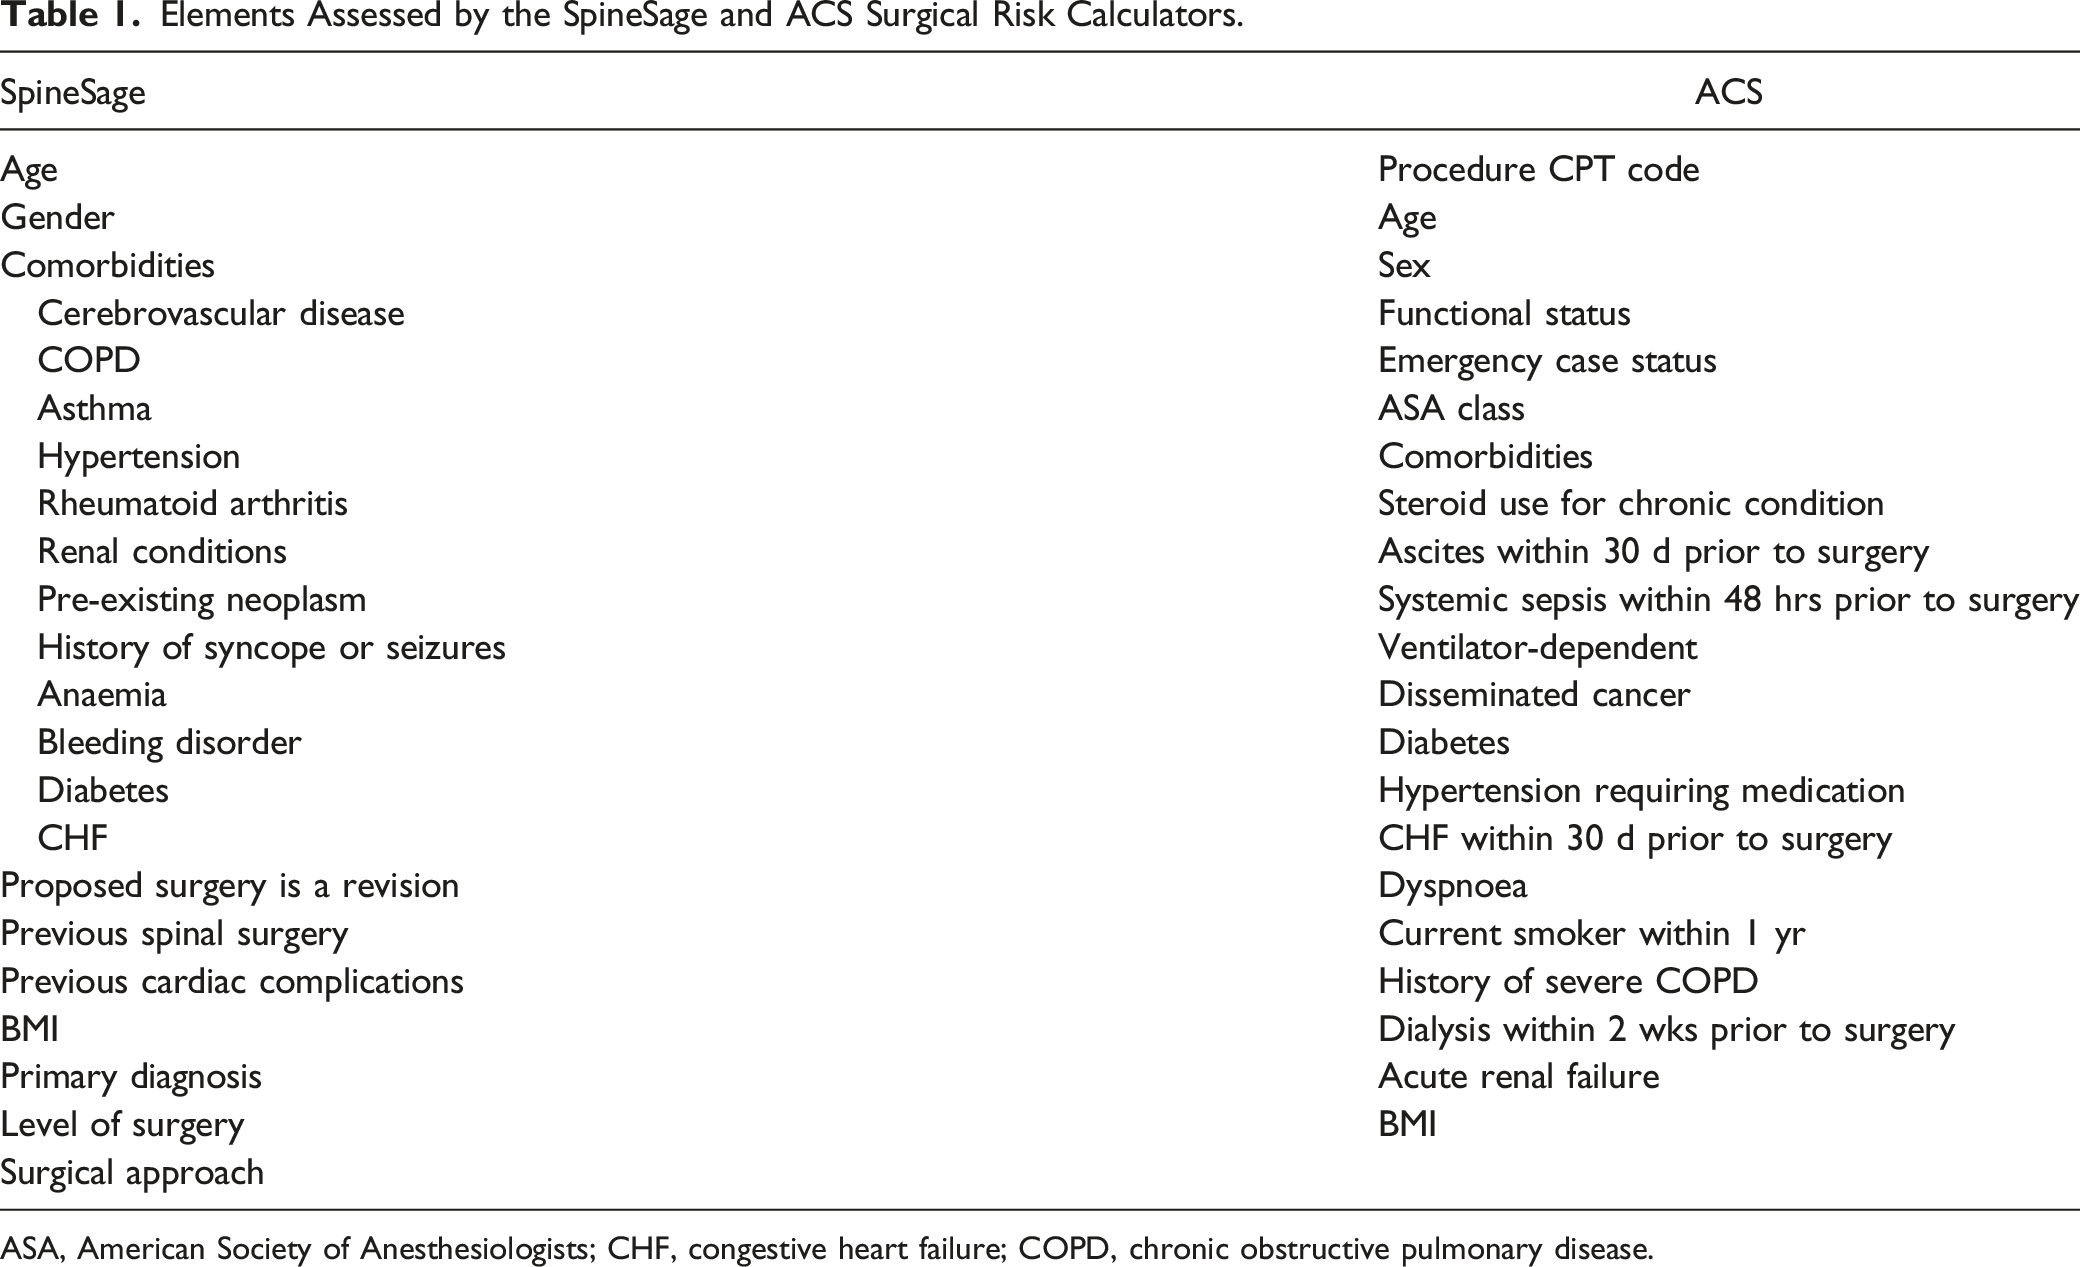
ASA, American Society of Anesthesiologists; CHF, congestive heart failure; COPD, chronic obstructive pulmonary disease.
Any medical complications within 30 days of surgery were recorded. These complications were then grouped into ‘overall’ and ‘major’ complications. Because this study has a focus on both the ACS and the SpineSage prediction tools, complications were grouped separately for both calculators based on their own individual criteria. Each complication was also graded using the Clavien–Dindo scale. This is a system used for grading complications based on the level of intervention required to treat each event. At its simplest, it is a 5-grade scale that provides an objective measure of the seriousness of each complication. 14
Statistics
All data was recorded and stored in Microsoft Excel (Version 2008). The data that supports the findings of this study is available on request from the corresponding author. The data is not publicly available due to privacy and ethical restrictions.
Statistical analysis was performed using IBM SPSS Statistics (version 25; NY, USA), and Jamovi (version 1.6; NSW, Australia).
Survivorship and complication severity were compared between patient groups using Mann–Whitney U tests and one-way ANOVA tests in univariate analysis. Multivariate analysis was performed using Cox regression. Significance was taken to be P < .05 for all analyses.
For initial analysis of the risk calculators, patients were separated into low-, medium- and, high-risk groups. Necessarily, these groups were created separately for analysis of each calculator. This is because each tool has different criteria for classifying adverse outcomes, and each therefore has different risk output. For example, the median predicted risk for overall complications was 22.5% for SpineSage, but only 10.2% for ACS. SpineSage predicts a wider range of medical complications, while ACS is more restricted. The risk groups for the ACS tool were chosen as 0–10%, 10–20% and 20%+. The risk groups for SpineSage were chosen as 0–20%, 20–40% and 40%+.
Pearson’s Chi-square test was used to compare the median predicted risk of each tool for both overall complications and major complications, as well as risk of death for ACS, with the observed complication rate. This is the same method employed by Kasparek et al. 15 The median value of each stratified group was also compared with observed rates.
The diagnostic value of each tool was further assessed using receiver operator characteristic (ROC) analysis. This allowed us to ascertain and compare the area under the curve (AUC) for each calculator based on both predicted risk and the presence or absence of adverse events.
The mean squared error (Brier score) was calculated for each tool based on their ability to predict overall complications and major complications. This average prediction accuracy was compared between the SpineSage and ACS calculators using paired t-tests. The mean squared error was also calculated for the ACS calculator based on its ability to predict post-operative death.
Results
Cohort Demographics
Characteristics of 210 Patients Aged Over 80 Years Old Who Underwent Spinal Surgery, 2009–2019.
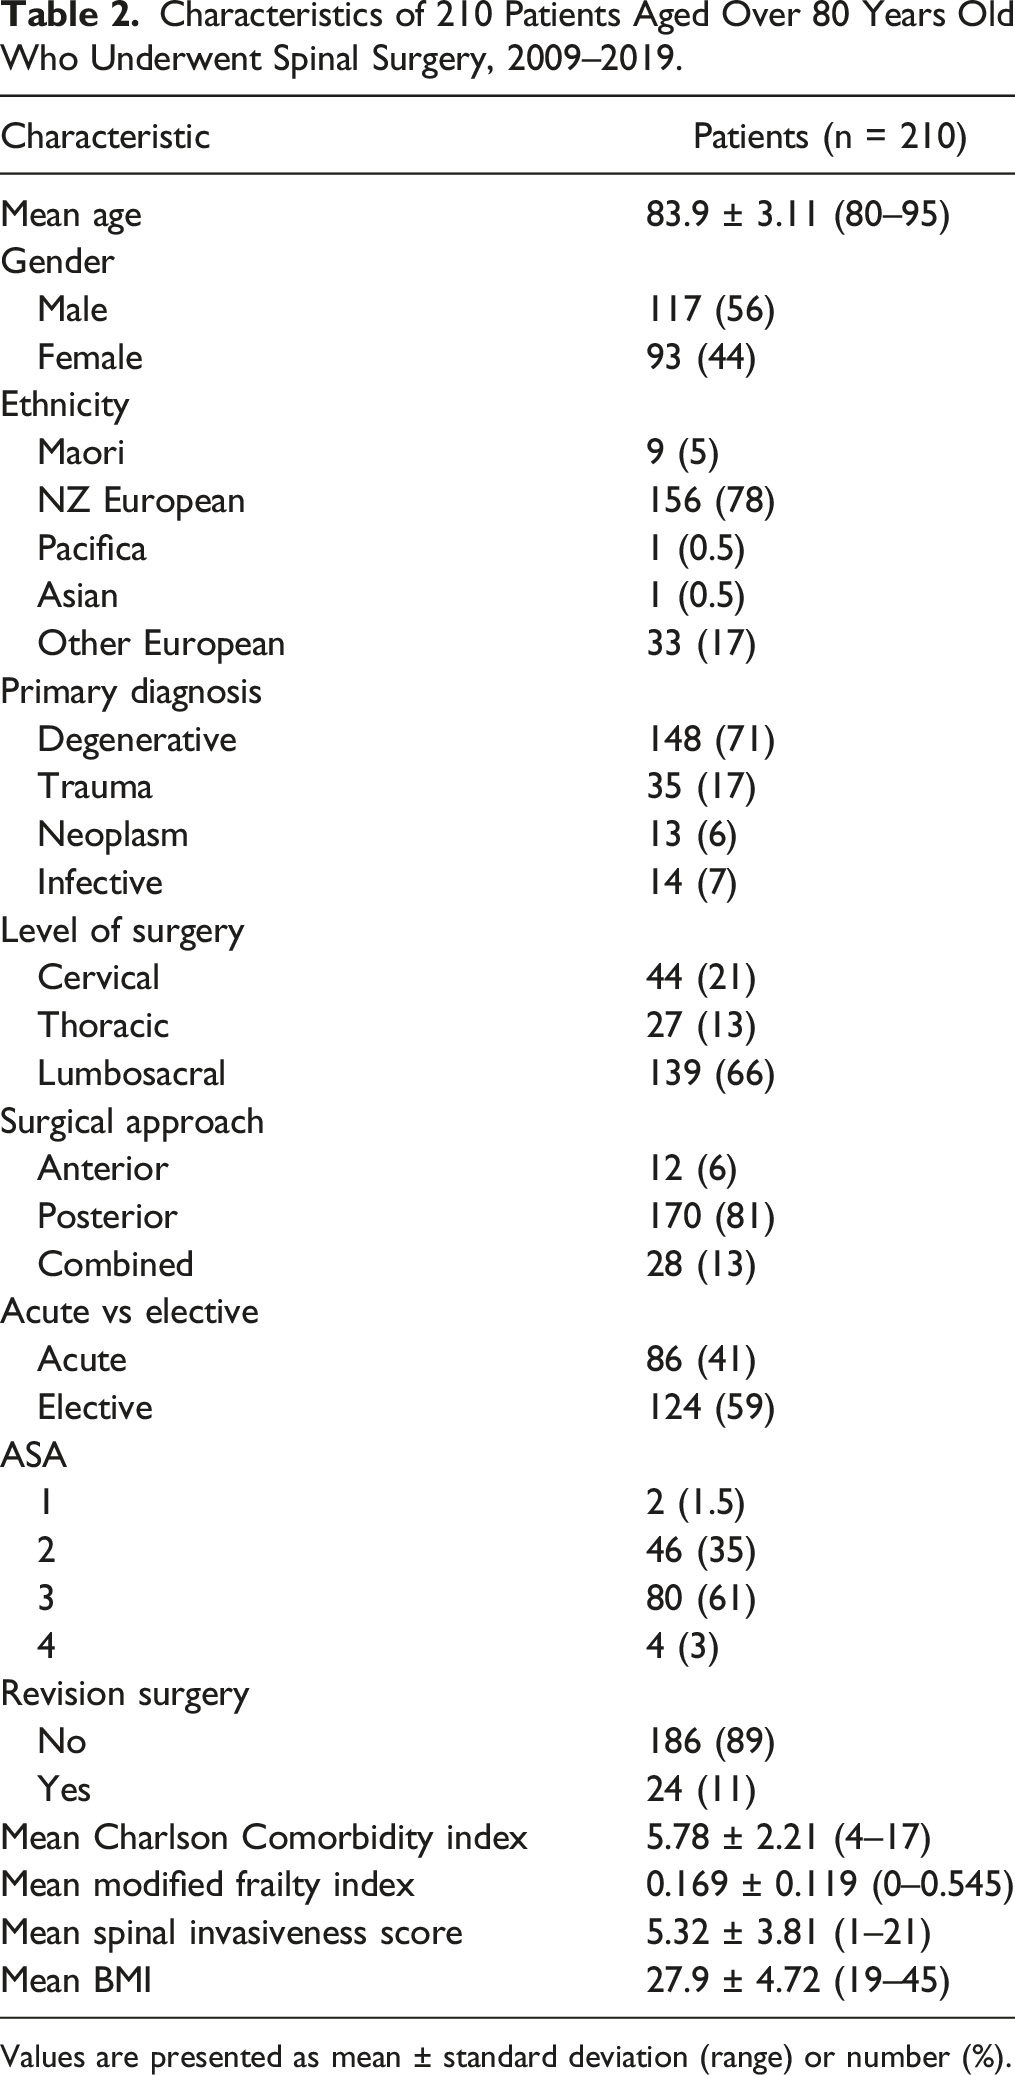
Values are presented as mean ± standard deviation (range) or number (%).
Mortality and Complication Data
Outcomes of 210 Patients Over the Age of 80 Years Old Who Underwent Spinal Surgery, 2009–2019.
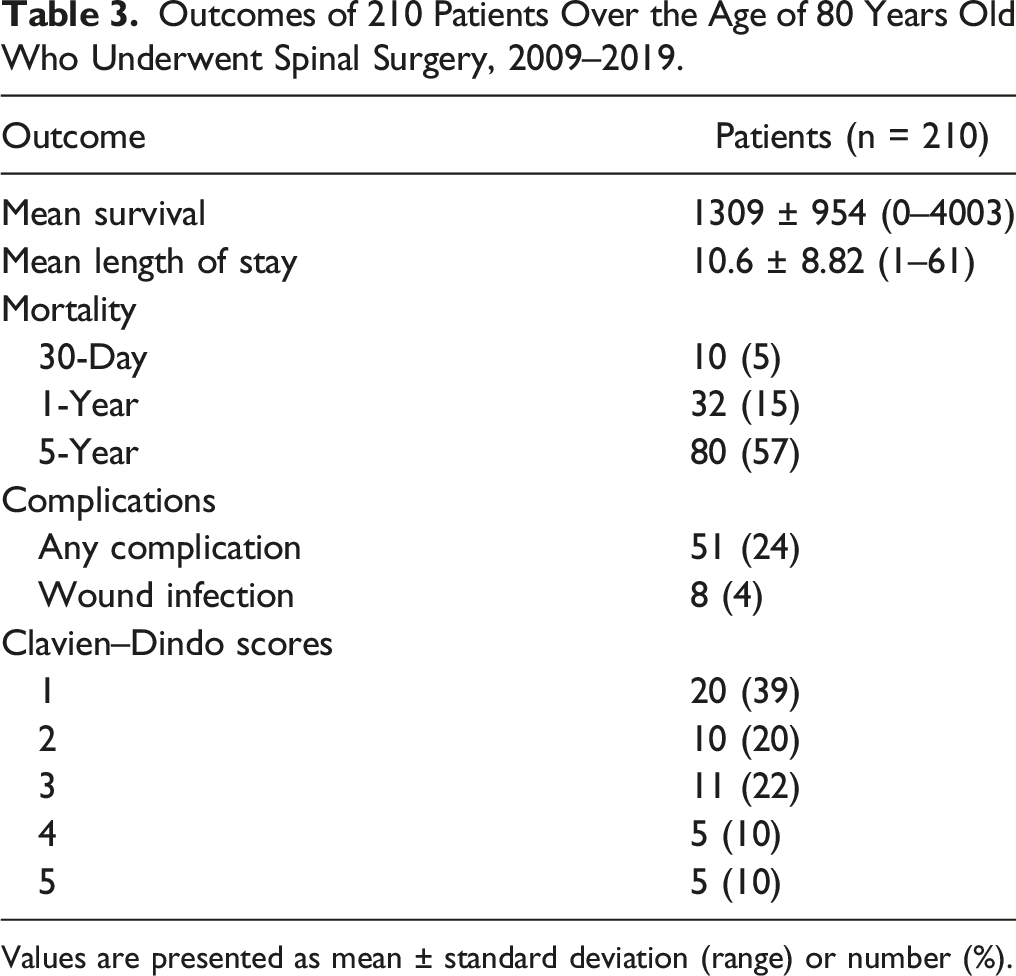
Values are presented as mean ± standard deviation (range) or number (%).
Univariate Analysis of Mean Survival Time for 210 Patients Undergoing Spine Surgery, 2009–2019.
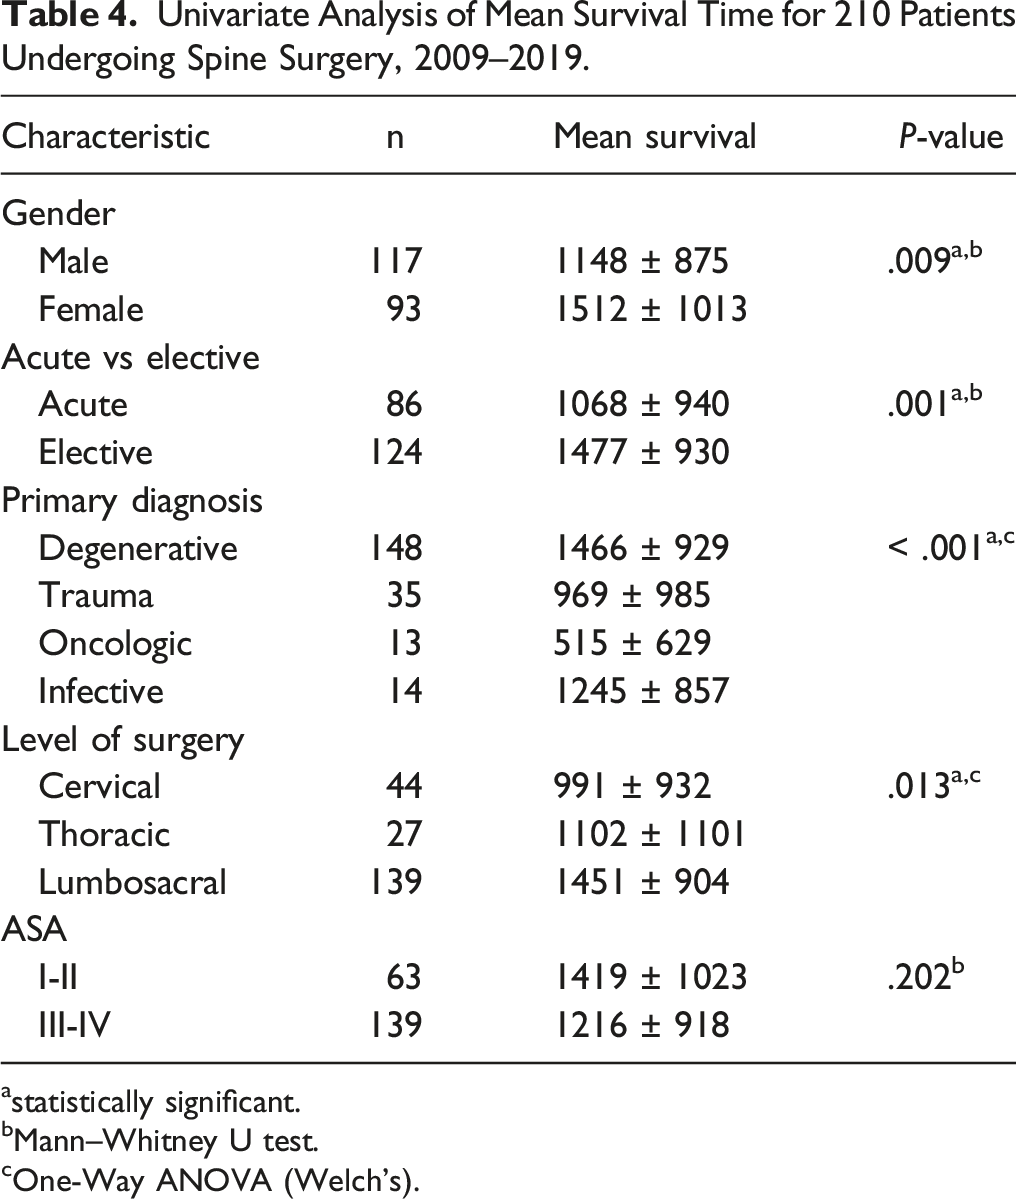
astatistically significant.
bMann–Whitney U test.
cOne-Way ANOVA (Welch’s).
Multivariate Cox Regression Analysis of 210 Patients Who Underwent Spine Surgery, 2009–2019.
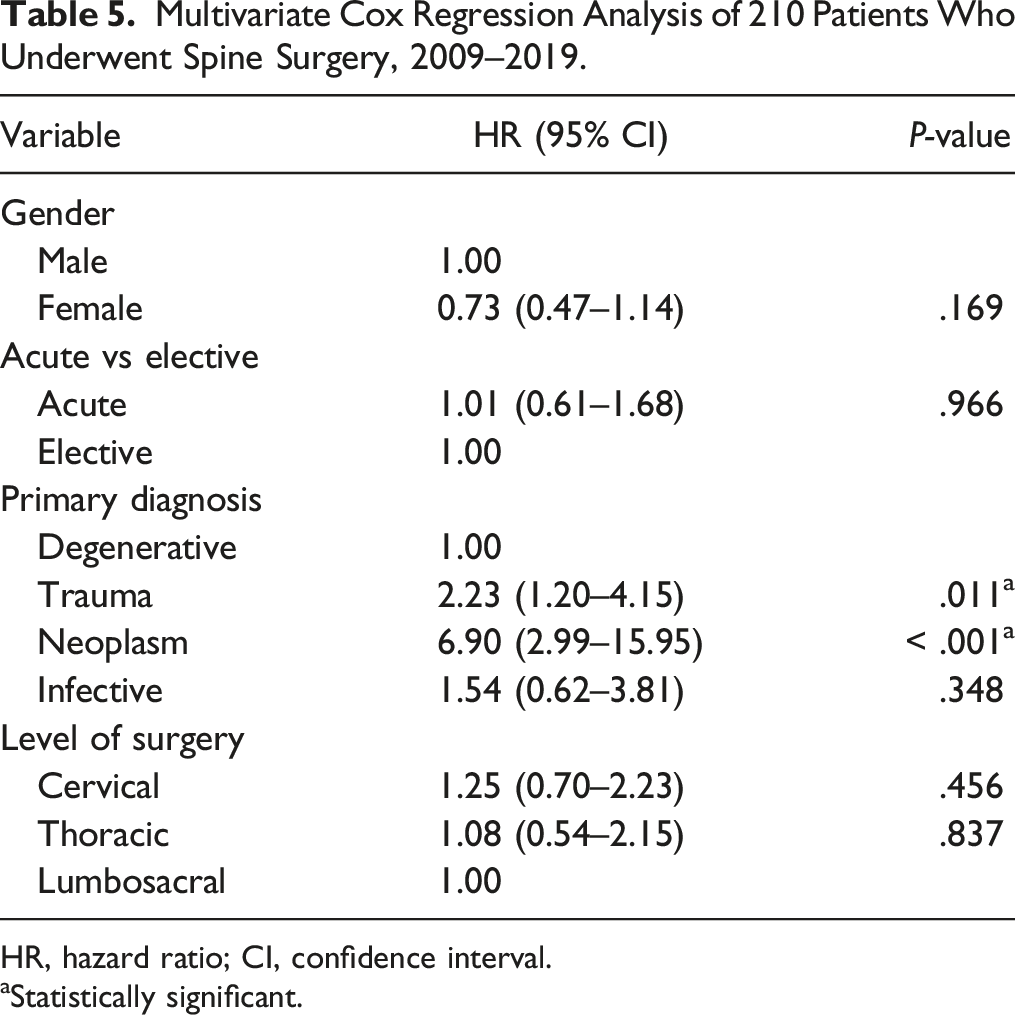
HR, hazard ratio; CI, confidence interval.
aStatistically significant.
ACS Surgical Risk Calculator
We recorded the percentage risk scores for developing an adverse event post-surgery from the ACS risk calculator in the following categories: major complication (median 9.3; range 2.1–34.5), overall complications (median 10.2; range 0.5–36.8) and death (median 3.1; range 0–28.1). These median-calculated risk scores were able to be compared against the observed outcomes in each category.
Predicted Risk vs Observed Complication Rates for 210 Patients Undergoing Spine Surgery, 2009–2019.

Values are reported as median (range).
The ACS surgical risk calculator significantly distinguished between those who developed complications and those who did not. The mean calculated risk of experiencing any complication in the group of patients that had at least one complication was 16.3%, compared with 11.2% in the group that did not have any complications (P = .001). The mean calculated risk of a serious complication occurring in the group of patients with at least one serious complication was 14.5% compared with 10.3% in those that did not experience any serious complication (P = .004).
SpineSage Risk Calculator
We recorded the percentage risk scores for developing an adverse event post-surgery from the SpineSage risk calculator in the following categories: major complication (median 11.6; range 2.4–75.4) and overall complications (median 22.5; range 16.4–78.2).
As was done with the ACS calculator, the cohort was split into three groups based on each patient’s estimated percent risk of experiencing any complications after surgery, as determined by the SpineSage surgical risk calculator. These groups were low-risk (n = 59, range 16.4–20.0), medium-risk (n = 99, range 20.4–39.4) and high-risk (n = 52, range 40.4–78.2). For the low-risk group, the complication rate was 10.2%, the medium-risk group had a complication rate of 26.3% and the high-risk group had a complication rate of 34.6%. The SpineSage risk calculator overestimated risk in the low- and high-risk groups. The predicted complication rate in the low-risk group was 17.8%, in the medium-risk group it was 22.5% and in the high-risk group it was 53.8%. Chi-squared tests showed no significant difference between predicted risk and actual outcomes for the low- and medium-risk groups, but there was a meaningful difference for the high-risk group (P = .006). These results are shown in Table 6.
The SpineSage surgical risk calculator significantly distinguished between those who developed complications and those who did not. The mean calculated risk of experiencing any complication in the group of patients that had at least one complication was 35.1%, compared with 29.1% in the group that did not have any complications (P = .004). The mean calculated risk of a serious complication occurring in the group of patients with at least one serious complication was 28.9% compared with 17.2% in those that did not experience and serious complication (P = .003).
Comparing ACS and SpineSage as Risk Calculators
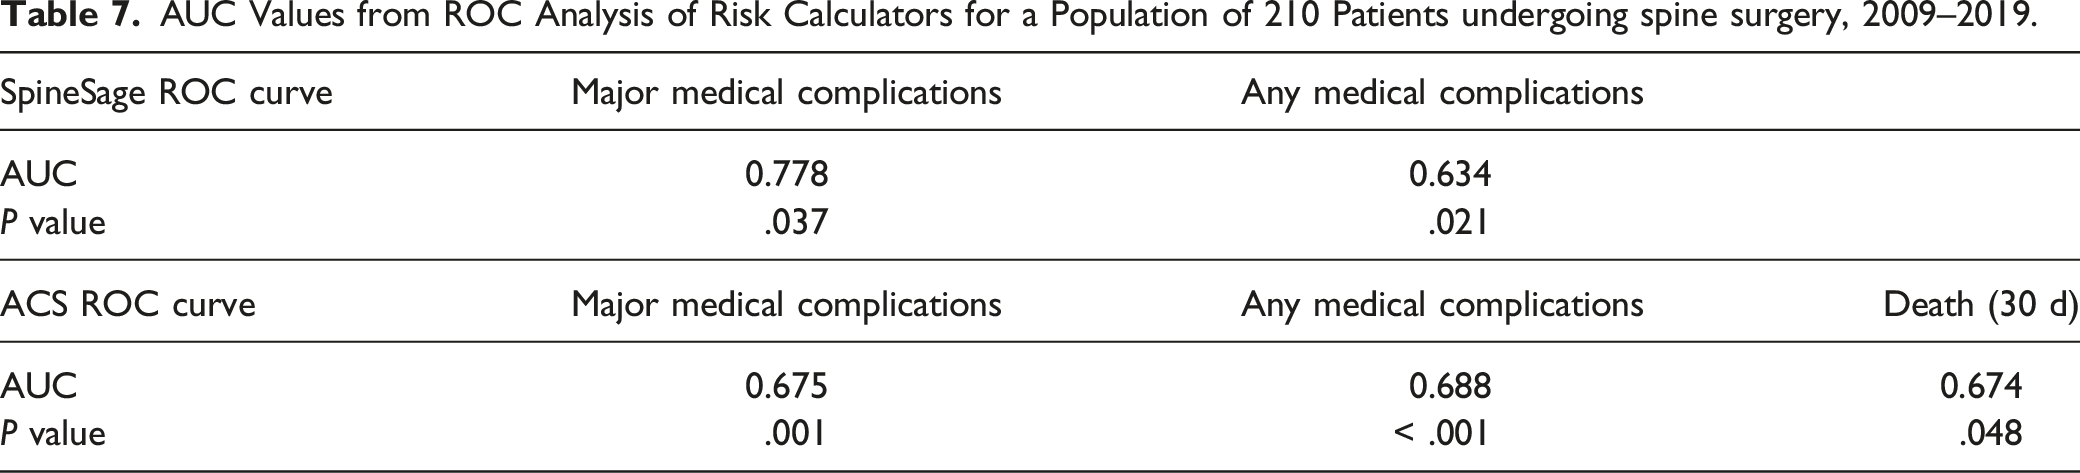
In ROC analysis, the ACS and SpineSage tools had similar accuracy when predicting post-operative risk of overall complications. When calculating the risk of major complications, however, SpineSage was a better predictor of outcomes. The AUC value for predicting overall complications was 0.688 (P < .001) for the ACS risk calculator, and 0.634 (P = .021) for the SpineSage calculator. The AUC value for predicting major complications was 0.675 (P = .001) for the ACS risk calculator, and 0.778 (P = .037) for the SpineSage calculator (Figure 1). Additionally, the AUC for predicting post-operative death was 0.674 when calculated by the ACS tool (P = .048). A summary of this analysis is shown in Table 7. ROC curves for the SpineSage and ACS surgical risk calculators when predicting occurrence of major complications after spine surgery in an elderly population. The red dotted line represents prediction by pure chance. The closer the line to the top left, the better the model’s predictive accuracy. The AUC values are 0.675 for the ACS risk calculator and 0.778 for the SpineSage risk calculator. AUC Values from ROC Analysis of Risk Calculators for a Population of 210 Patients undergoing spine surgery, 2009–2019.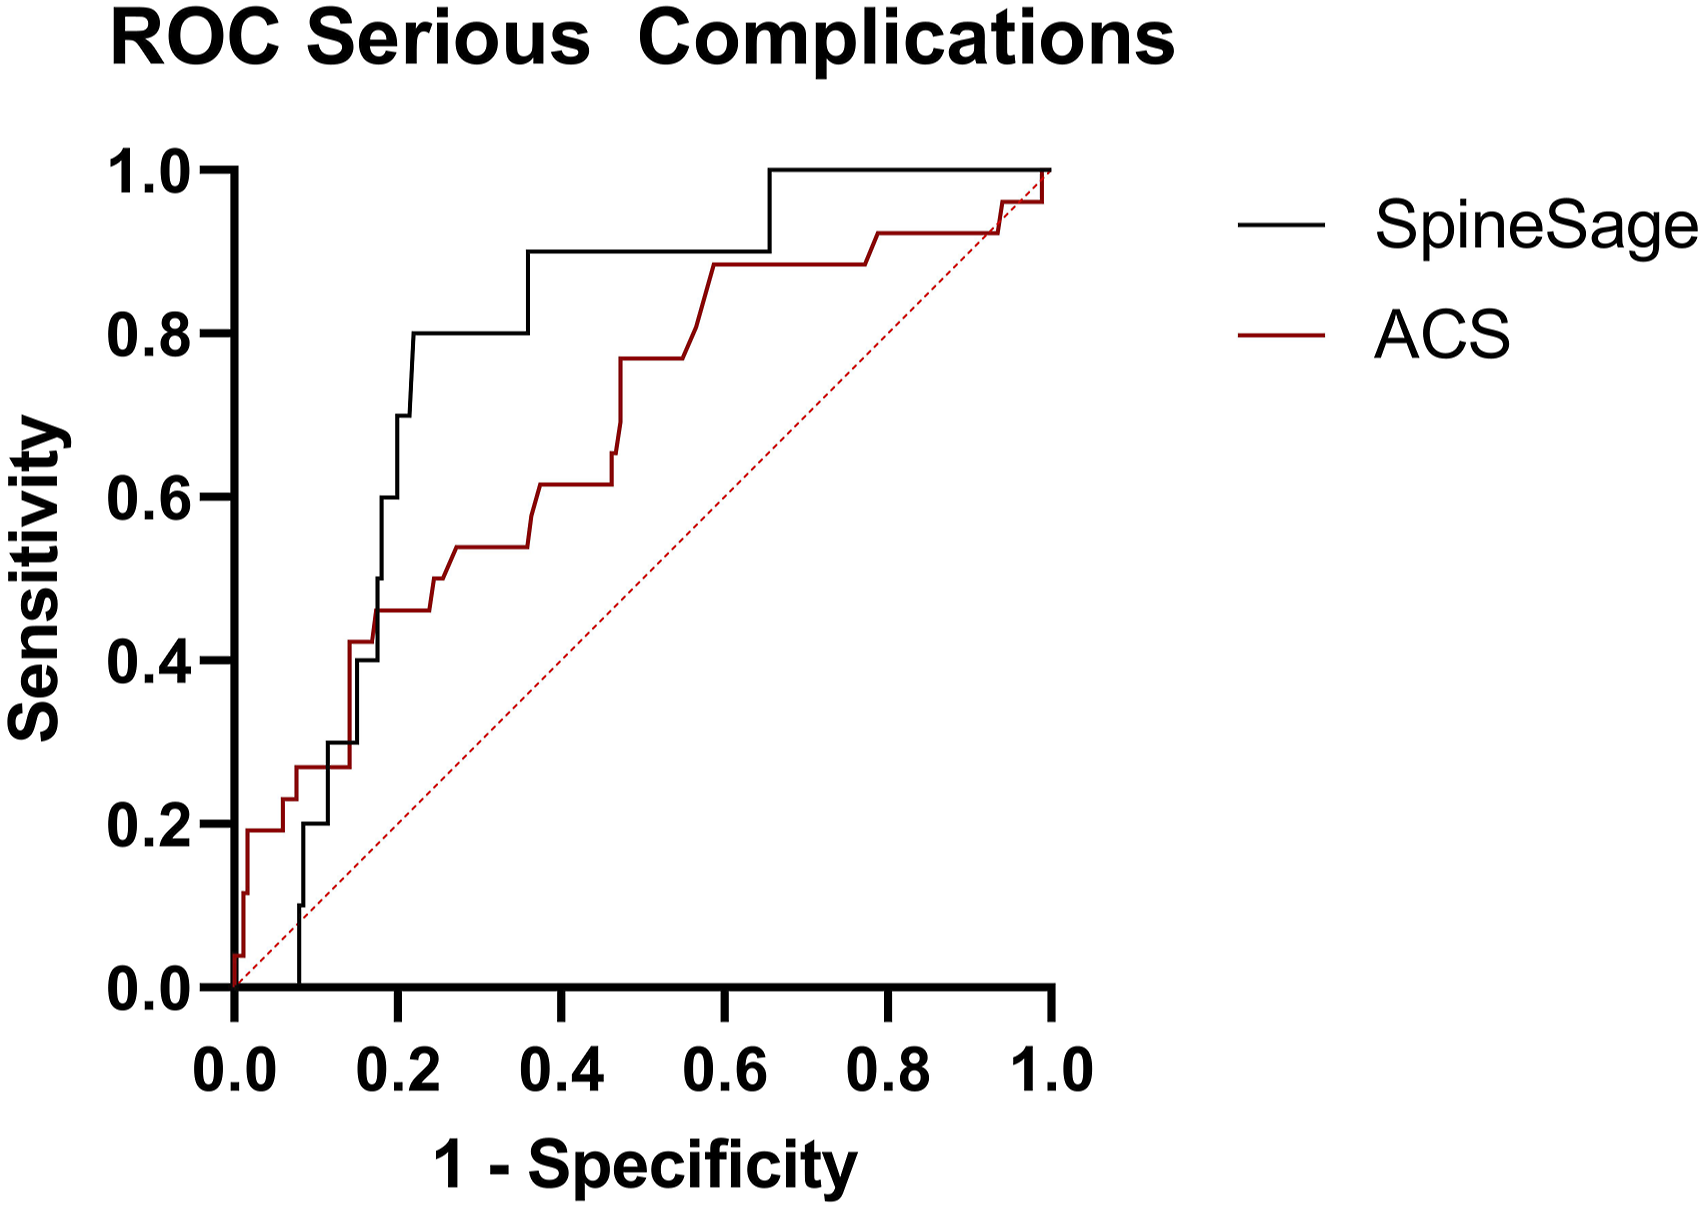
In addition to ROC analysis, mean squared error (MSE) was used to calculate the absolute value accuracy of the ACS and SpineSage risk calculators. The mean squared error for ACS when predicting overall complications was 0.11; for SpineSage predicting overall complications the score was 0.19. The difference between these two scores is −0.08 (95% CI −0.10 to −0.04; P < .001). Therefore, the mean prediction error of the scores generated by the ACS risk calculator was significantly lower than the mean error generated by the SpineSage surgical risk calculator when predicting overall complications.
The mean squared error for ACS predicting major complications was 0.10, and the score for SpineSage was 0.08. The difference between these two scores is 0.02 (95% CI −0.01 to 0.06; P = .132). There was no significant difference between the mean prediction error for the two tools when estimating risk of major complications post-surgery.
Discussion
It is increasingly useful to have tools available to inform both surgeon and patient of the risk of surgery and to allow shared decision-making. While a variety of tools are available for risk stratification, a key step before introducing their use to local clinical practice is validation. In this study, assessing the utility of two risk calculators in those aged over 80 years of age undergoing spine surgery, we found that SpineSage was more accurate in our cohort, providing fair estimation of major complications associated with surgery. Based upon the results of this study, we recognise the limitations of each of these tools, but consider for our own demographic that SpineSage is a more suitable tool to provide information for elderly patients in a shared decision-making process.
There are few studies attempting to validate SpineSage, likely because it is only intended for use in a single subspeciality. Kasparek et al., concluded that SpineSage was clinically useful for predicting the overall medical complication rate as well as the major medical complication rate in its cohort of 273 patients who underwent spine surgery. The study reported an AUC of 0.71 for prediction of overall complications and an AUC of 0.85 for major complications. 15 The developers of SpineSage reported similar results to Kasparek et al. For prediction of overall medical complications, the AUC was 0.76, and for major complications it was 0.81. 16 We believe that ours is the first study to investigate the validity of this tool in an elderly population and highlights the utility of SpineSage in what is a naturally higher-risk demographic.
Comparison of the stratified risk groups in this study also failed to demonstrate any significant difference between the predicted complication rate and the observed complication rates in both the low- and medium-risk groups. The greater accuracy of SpineSage in predicting the occurrence of serious complications may be due to the incorporation of factors specific to spine surgery such as the spinal invasiveness index created by Mirza et al 13 Although the ACS risk calculator incorporates the type of surgery by recording CPT (Current Procedural Terminology) codes, it does not account for multiple procedures, and the invasiveness index may be a better indication of the complexity of the procedure. SpineSage also takes into account the underlying pathology, which the ACS risk calculator does not.
The ACS risk calculator has been re-calibrated on several occasions. 17 It has also been independently validated for its use in predicting complications across a variety of surgical specialities and for many different procedures. The results of these studies have been mixed.18-24 Wang et al, investigated the predictive validity of the tool in a population of geriatric patients undergoing spine surgery. The study concluded that the calculator was not an accurate predictor of post-operative complications. 24 We believe that ours is the first study to attempt to validate this tool for a cohort of patients over 80 years old undergoing spine surgery. Our study does not support the use of the ACS risk calculator for predicting complications after spine surgery, with an AUC of 0.69 for overall complications and an AUC of 0.67 for major complications.
The main limitation of this study is that it was retrospective in nature and as such is subject to inaccurate or incomplete clinical documentation as all retrospective studies of this nature are. Nonetheless, we believe we have mitigated this weakness by applying firm exclusion criteria. We have also intentionally restricted inclusion to those aged over 80 years of age and some may claim that this limits the generalizability of our findings. However, in our experience, such risk calculators anecdotally are used more often when counselling patients of greater age, as the decision on whether to undergo a major surgical procedure carries somewhat more gravitas at that stage of life.
Conclusion
For the prediction of risks associated with spine surgery in those aged over 80 years, SpineSage appears to be preferable to the ACS surgical risk calculator – in this single centre cohort, SpineSage was more accurate in predicting the risk of major medical complications. It should be kept in mind however that no risk calculator is precise but simply provides an estimate of risk that is easy to understand and facilitates shared decision-making.
Footnotes
Declaration of Conflicting Interests
The author(s) declared no potential conflicts of interest with respect to the research, authorship, and/or publication of this article.
Funding
The author(s) disclosed receipt of the following financial support for the research, authorship, and/or publication of this article: This work was supported by a NuVasive summer student scholarship.
Ethical Approval
This retrospective analysis was approved by the hospital Clinical Audit Support Unit (Ref: 4161). This study was deemed exempt from informed consent due to its retrospective nature.