
Abstract
Study Design:
Retrospective cohort study.
Objectives:
Spinal epidural abscess (SEA) is a rare but potentially life-threatening infection treated with antimicrobials and, in most cases, immediate surgical decompression. Previous studies comparing medical and surgical management of SEA are low powered and limited to a single institution. As such, the present study compares readmission in surgical and non-surgical management using a large national dataset.
Methods:
We identified all hospital admissions for SEA using the Nationwide Readmissions Database (NRD), which is the largest collection of hospital admissions data. Patients were grouped into surgically and non-surgically managed cohorts using ICD-10 coding and compared using information retrieved from the NRD such as demographics, comorbidities, length of stay and cost of admission.
Results:
We identified 350 surgically managed and 350 non-surgically managed patients. The 90-day readmission rates for surgical and non-surgical management were 26.0% and 35.1%, respectively (P < .05). Expectedly, surgical management was associated with a significantly higher charge and length of stay at index hospital admission. Surgically managed patients had a significantly lower risk of readmission for osteomyelitis (P < .05). Finally, in patients with a low comorbidity burden, we observed a significantly lower 90-day readmission rate for surgically managed patients (surgical: 23.0%, non-surgical: 33.8%, P < .05).
Conclusion:
In patients with a low comorbidity burden, we observed a significantly lower readmission rate for surgically managed patients than non-surgically managed patients. The results of this study suggest a lower readmission rate as an advantage to surgical management of SEA and emphasize the importance of SEA as a not-to-miss diagnosis.
Keywords
Introduction
Spinal epidural abscess (SEA) is a rare but severe condition defined by a purulent infection between the spinal dura mater and the vertebral periosteum.1,2 SEA is potentially life threatening and, when left untreated, can cause significant neurological deficits, morbidity, and mortality. 3 The incidence rate for SEA is on the rise with estimates of prevalence in the last decade between 1.7 and 8 per 10 000 hospital admissions compared to the historical incidence rate of 0.2-1.2 per 10 000 admissions.4-7
Early surgical decompression followed by intravenous antimicrobials is the most widely utilized treatment of SEA, particularly in patients with advanced infection or neurological deficits on presentation.3,8-13 Indications for surgical management include acute neurologic deficits, spinal instability, ring-enhancing lesions on magnetic resonance imaging (MRI), or disease progression despite antimicrobial therapy. 13 Medical management of SEA with antimicrobials alone has, however, been shown to be effective in patients with minimal neurologic deficit and in patients without certain risk factors.13-19 Indications for medical management include radiculopathy that has been stable for more than 72 hours, no signs of systemic sepsis, back pain as the lone symptom, and minimal neurologic deficit. 19
A recent review paper by Sharfman et al highlighted that a major limitation in studies intending to compare surgical and medical management of patients with SEA is that the majority are low powered and limited to a single institution experience. 20 As such, the goal of the present study is to compare readmission rates and factors associated with readmission between surgical and non-surgical management of SEA using a large national dataset. To our knowledge, this is both the first study to compare readmission rates in SEA using a nationwide dataset and the largest sample sized study comparing surgical and non-surgical management strategies.
Methods
Study Population Selection
We queried the Nationwide Readmissions Database (NRD) from January 2016 to September 2016 for patients diagnosed with SEA. The NRD was created by the United States Healthcare Cost and Utilization Project (HCUP) and is the largest collection of longitudinal data regarding national hospital admissions, comprising 58.7% of all inpatient admissions. 21 Patients were identified and classified into surgical and non-surgical management groups using the International Classification of Diseases, 10th revision (ICD-10) (Figure 1). Institutional Review Board exemption was obtained from our institution and this study was deemed exempt from informed consent requirements.
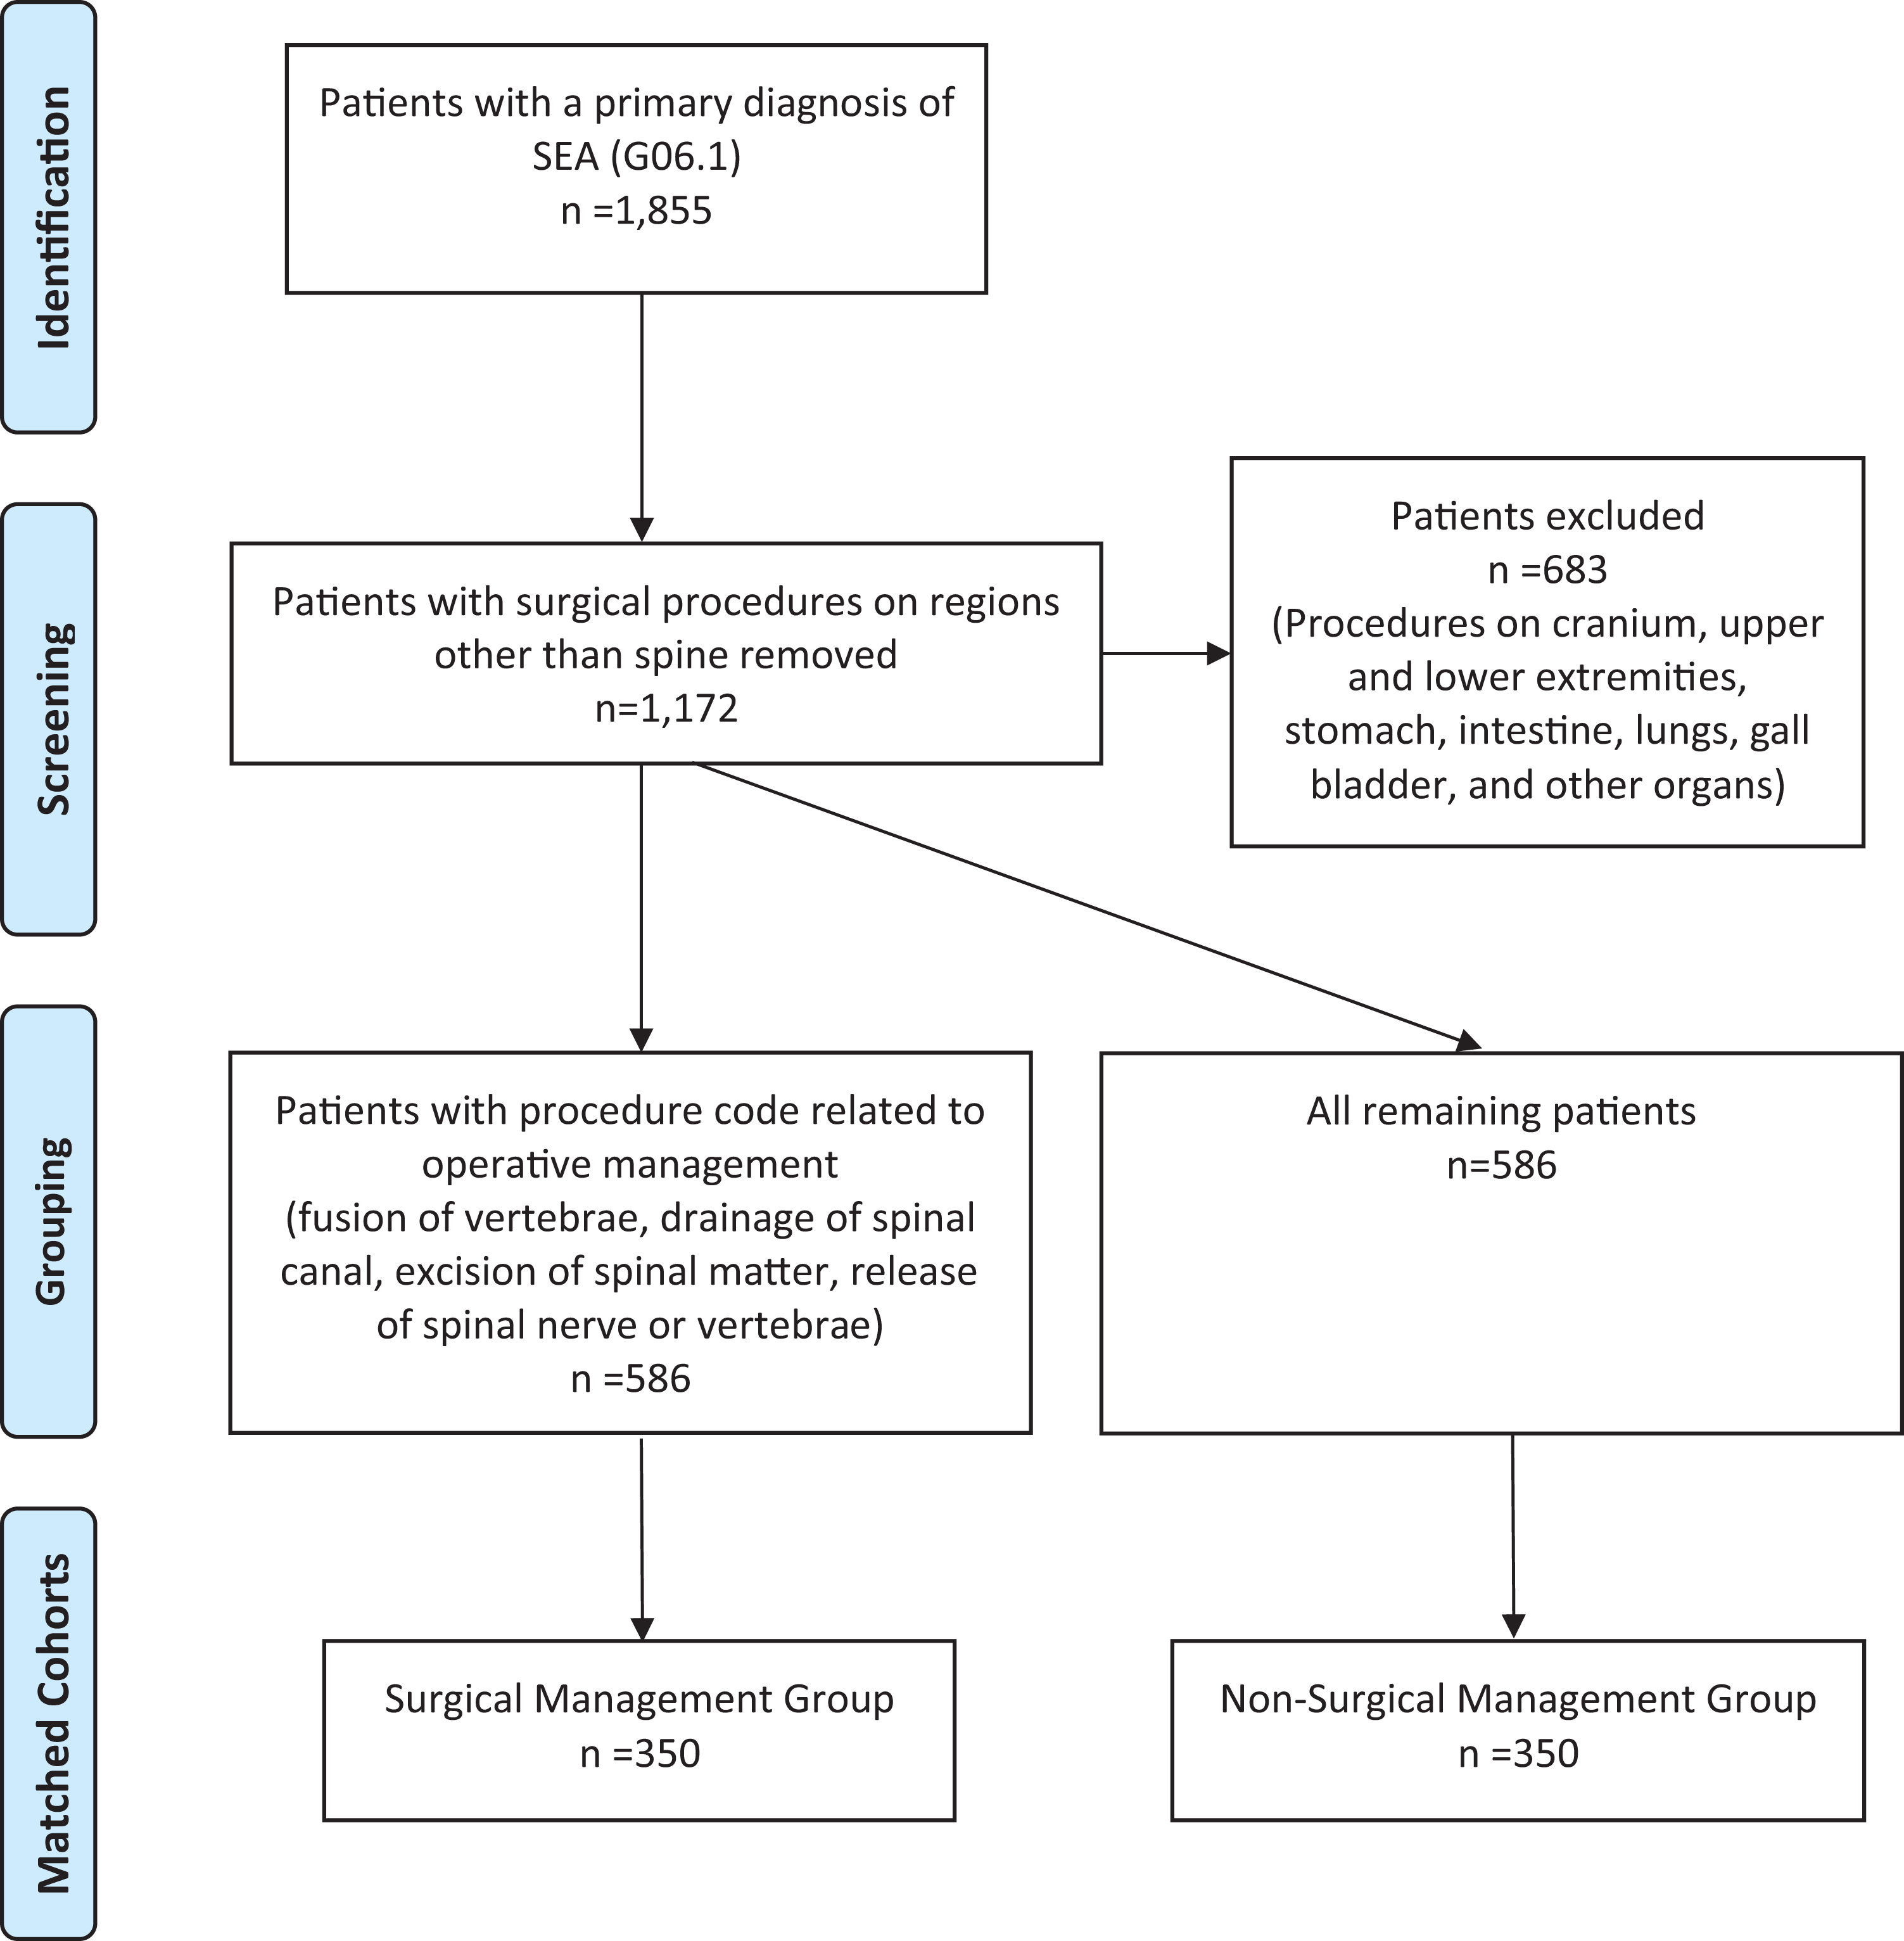
Patient population.
Inclusion and Exclusion Criteria
Patients with a primary ICD-10 diagnostic code of G06.1 (epidural infection: intraspinal abscess and granuloma) were identified. Exclusion criteria included death during hospitalization, nonelective surgery, use of emergency services, and age <18. Death during hospitalization was part of our exclusion criteria based on previously published studies as patients who died during hospitalization were not eligible for readmission.22-24 Associated ICD-10 procedural codes were manually reviewed and cases with surgical procedures on regions other than the spine (e.g., cranium, upper and lower extremities, stomach, intestine, lungs, gallbladder, and pancreas) were excluded in order to limit the possibility that patients were readmitted for complications or diagnoses unrelated to SEA. Patients who had a primary procedure code related to operative management (e.g., fusion of vertebrae, drainage of spinal canal, excision or extirpation of spinal matter, and release of nerve or vertebrae) were included in the surgical group. The remaining patients were considered non-surgically managed (Figure 1). The comorbidity burdens of our surgical and non-surgical cohorts were checked and the groups were propensity matched based on comorbidity burden (Figure 1).
Patient Characteristics
Patient characteristics were obtained from the NRD including demographic information, diagnoses, payer status, discharge disposition, length of stay (LOS) and charge of initial hospital admission. Utilizing data from the NRD, the comorbidity package in R was utilized to calculate Charlson Comorbidity Index (CCI) and Elixhauser Comorbidity Index (ECI) scores. 25 This software identifies 30 comorbidities based on the ECI and 17 comorbidities based on the CCI using ICD-10 and ICD-9 codes. 26 The CCI and ECI are widely used to measure burden of disease and estimate a mortality risk. The CCI was developed by Charlson et al and includes 17 comorbidities as well as their respective weights. 27 The ECI works similarly but defines 30 comorbidities. 28 Patients within both the surgical and non-surgical groups were then divided into 2 cohorts based on whether or not they were readmitted within 90 days of index hospitalization. Primary diagnosis at readmission was retrieved from the NRD. Additionally, patients were classified as high or low comorbidity burden using a CCI or ECI of 3 as the cutoff in accordance with prior reported studies.29-31
Statistical Analysis
Demographic information and risk factors for readmission were compared using a student’s t-test, Chi Squared analysis, or Fisher Exact. 30-day and 90-day readmission rates were calculated and compared using Fisher Exact. Primary diagnosis at readmission was compared using Fisher Exact. Multivariate linear regression was used to assess specific comorbidities within the CCI and ECI. A value of P < .05 was used to determine statistical significance.
Results
We identified 1,172 patients, 586 of which met our criteria for surgical management, and 586 of which met our criteria for non-surgical management (Figure 1). After propensity matching by comorbidity burden, our final cohorts each included 350 patients (Figure 1). There was no difference in comorbidity burden between the 2 matched groups as measured by both the ECI and CCI and there was no significant difference in the number of patients presenting with neurological deficits as measured by the variable for neurological disorders within the ECI (Table 1). 10 surgically managed and 7 non-surgically managed patients died during initial hospitalization and were not included in analysis. There was a significant difference in payer status (P < .05) and discharge disposition (P < .05) between the 2 groups.
Demographics of Surgically Managed and Non-Surgically Managed Patients With SEA.
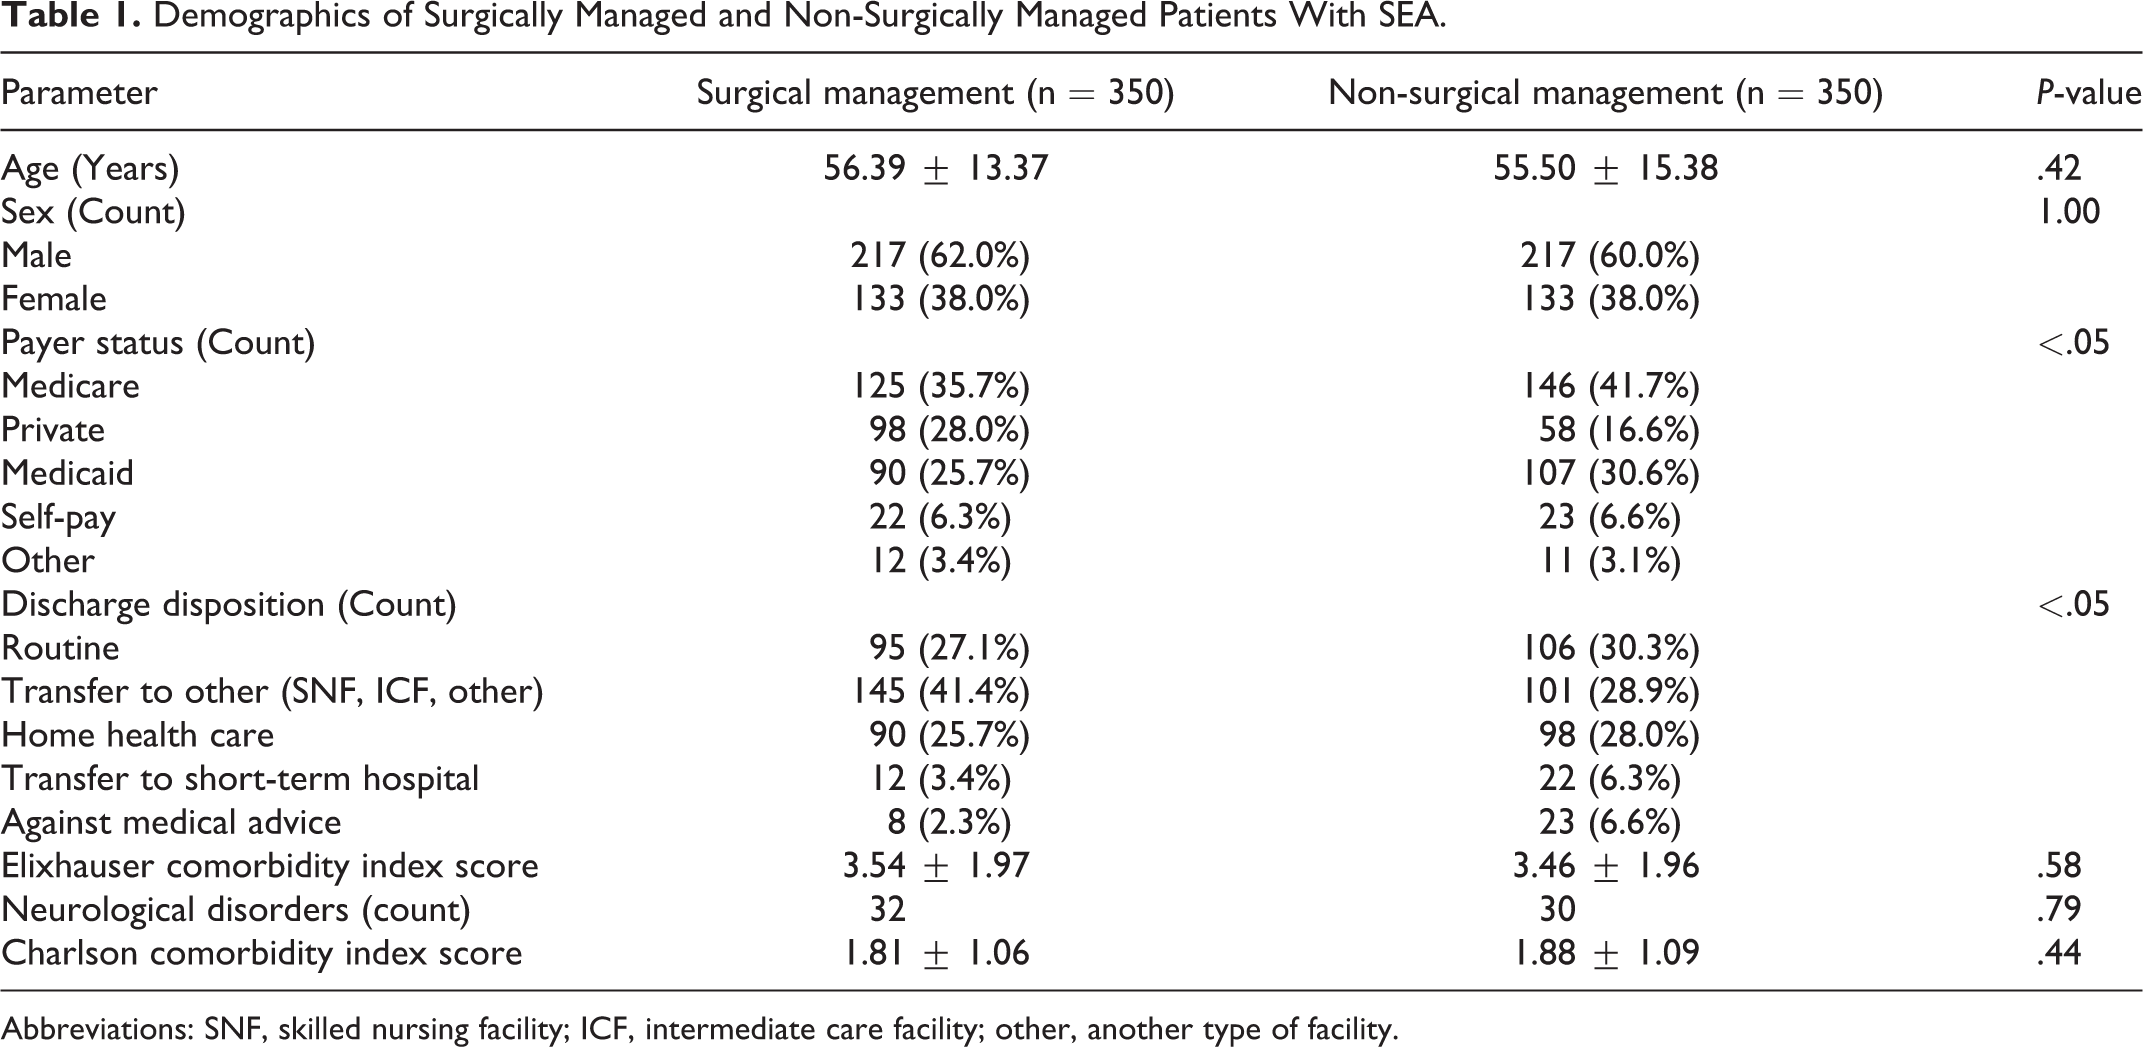
Abbreviations: SNF, skilled nursing facility; ICF, intermediate care facility; other, another type of facility.
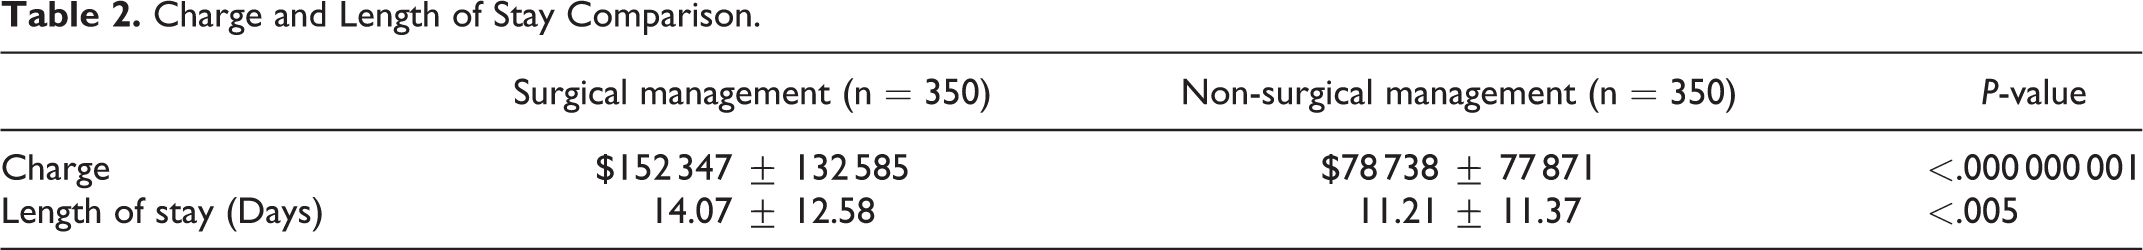
In consideration of the index admission, surgically managed patients had a significantly longer length of stay than non-surgically managed patients (surgical: 14.07 ± 12.58, non-surgical: 11.21 ± 11.37, P < .005). Expectedly, hospital cost at index admission was significantly higher in the surgically managed group than the non-surgically managed group (surgical: $152 347 ± 132 585, non-surgical: $78 738 ± 77 871, P < .000 001) (Table 2).
Charge and Length of Stay Comparison.
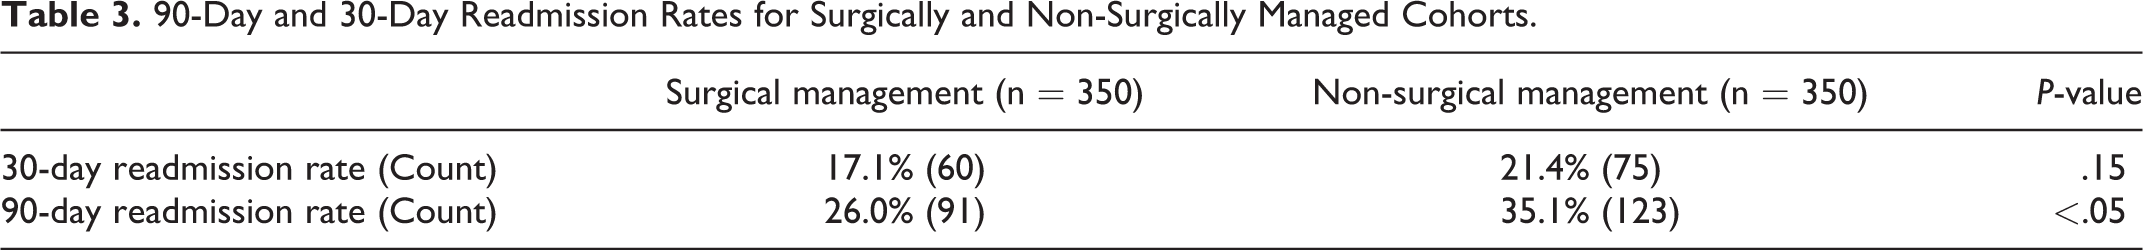
The 90-day readmission rate was 26.0% for surgically managed patients and 35.1% for non-surgically managed patients (P < .05). While the readmission rate was significantly lower for surgically managed patients at 90-days, there was no significant difference in the readmission rate at 30 days (surgical: 17.1%, non-surgical: 21.4%, P = .15) (Table 3).
90-Day and 30-Day Readmission Rates for Surgically and Non-Surgically Managed Cohorts.
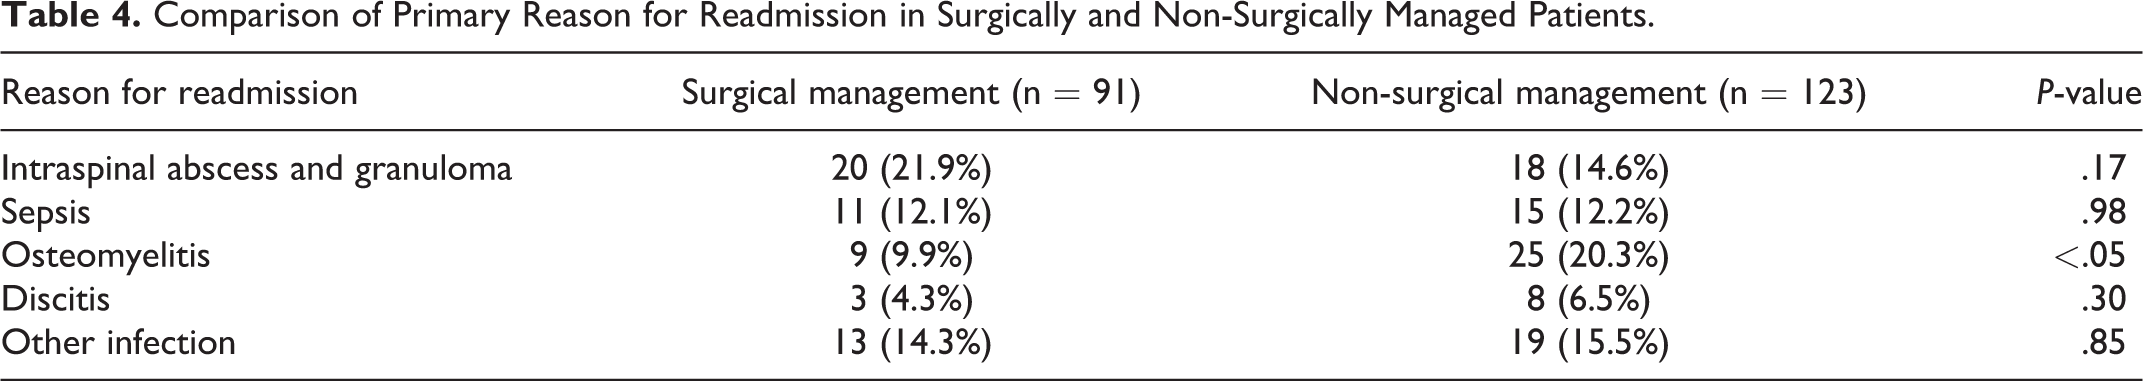
Surgically managed patients were found to have a significantly lower risk of being readmitted for osteomyelitis (surgical: 9.9%, non-surgical 20.3%, P < .05). All other infection related primary diagnoses were found to occur at similar rates between the groups (Table 4).
Comparison of Primary Reason for Readmission in Surgically and Non-Surgically Managed Patients.
In surgically managed patients, worse comorbidity burden (ECI, CCI: P < .0001), longer LOS (P < .05) and higher cost (P < .05) at index admission were associated with readmission (Table 5). Specifically, peripheral vascular disorders and paralysis were associated with readmission in surgically managed patients on multivariate analysis (both P < .05). Using private insurance as reference, surgically managed patients with Medicare insurance had greater odds of readmission (P < .05).
Analysis of Risk Factors for Admission for Both Surgically and Non-Surgically Managed Patients.
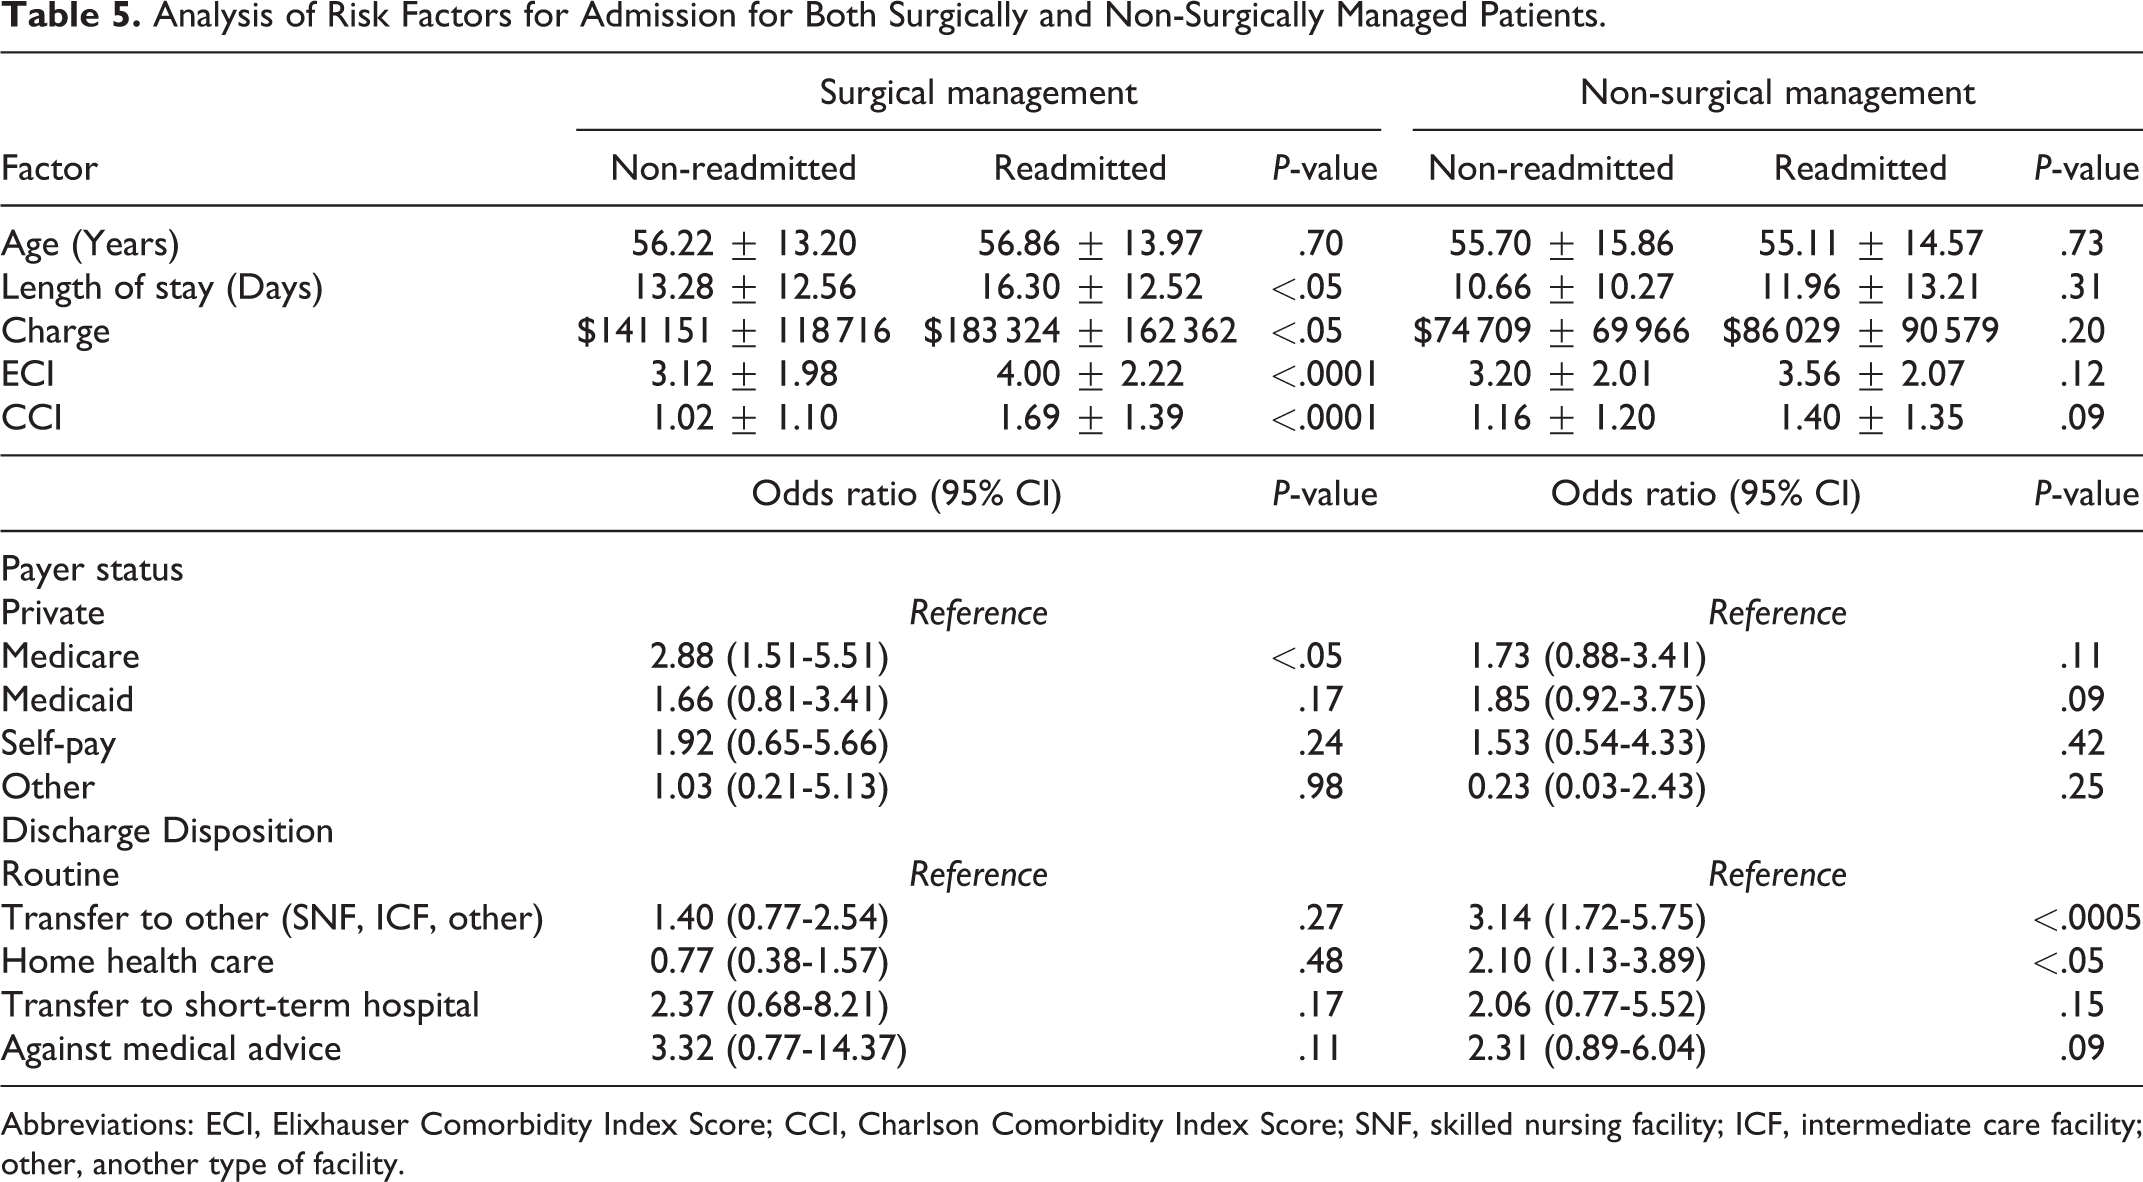
Abbreviations: ECI, Elixhauser Comorbidity Index Score; CCI, Charlson Comorbidity Index Score; SNF, skilled nursing facility; ICF, intermediate care facility; other, another type of facility.
In non-surgically managed patients, worse comorbidity burden at index admission was not associated with readmission as measured by CCI (P = .09) or by ECI (P = .12) (Table 5). However, coagulopathy was associated with readmission in non-surgically managed patients on multivariate analysis (P < .05). Within the non-surgical group, patients discharged to skilled nursing facilities (P < .0005) or home health care (P < .05) were more likely to be readmitted than routinely discharged patients (Table 5).
Among patients with fewer comorbidities (CCI/ECI<3), there was a significantly lower risk of readmission with surgical management than non-surgical management (Figures 2 and 3). This effect was observed using both the CCI (surgical: 23.0%, non-surgical: 33.8%, P < .05) and the ECI surgical: 18.6%, non-surgical: 29.7%, P < .05). No significant difference was found in readmission rate among patients with a high comorbidity burden (CCI/ECI≥3) for either CCI (P = 0.69) or ECI (P = .06) (Figures 2 and 3).
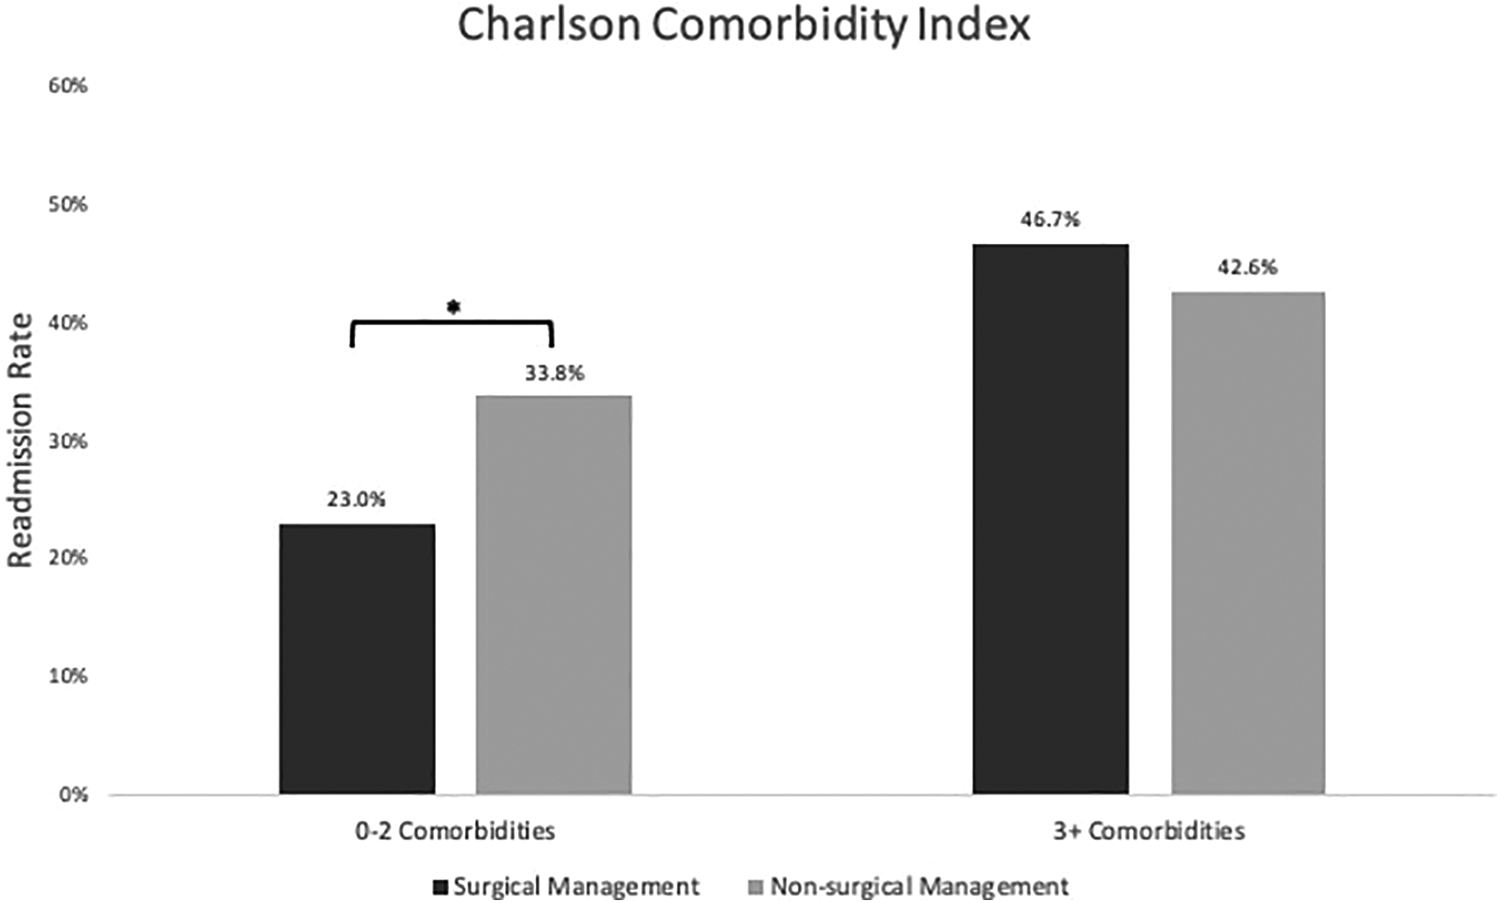
Charlson comorbidity index 90-day readmission rate for surgically and non-surgically managed patients by number of comorbidities. *Indicates significant difference.
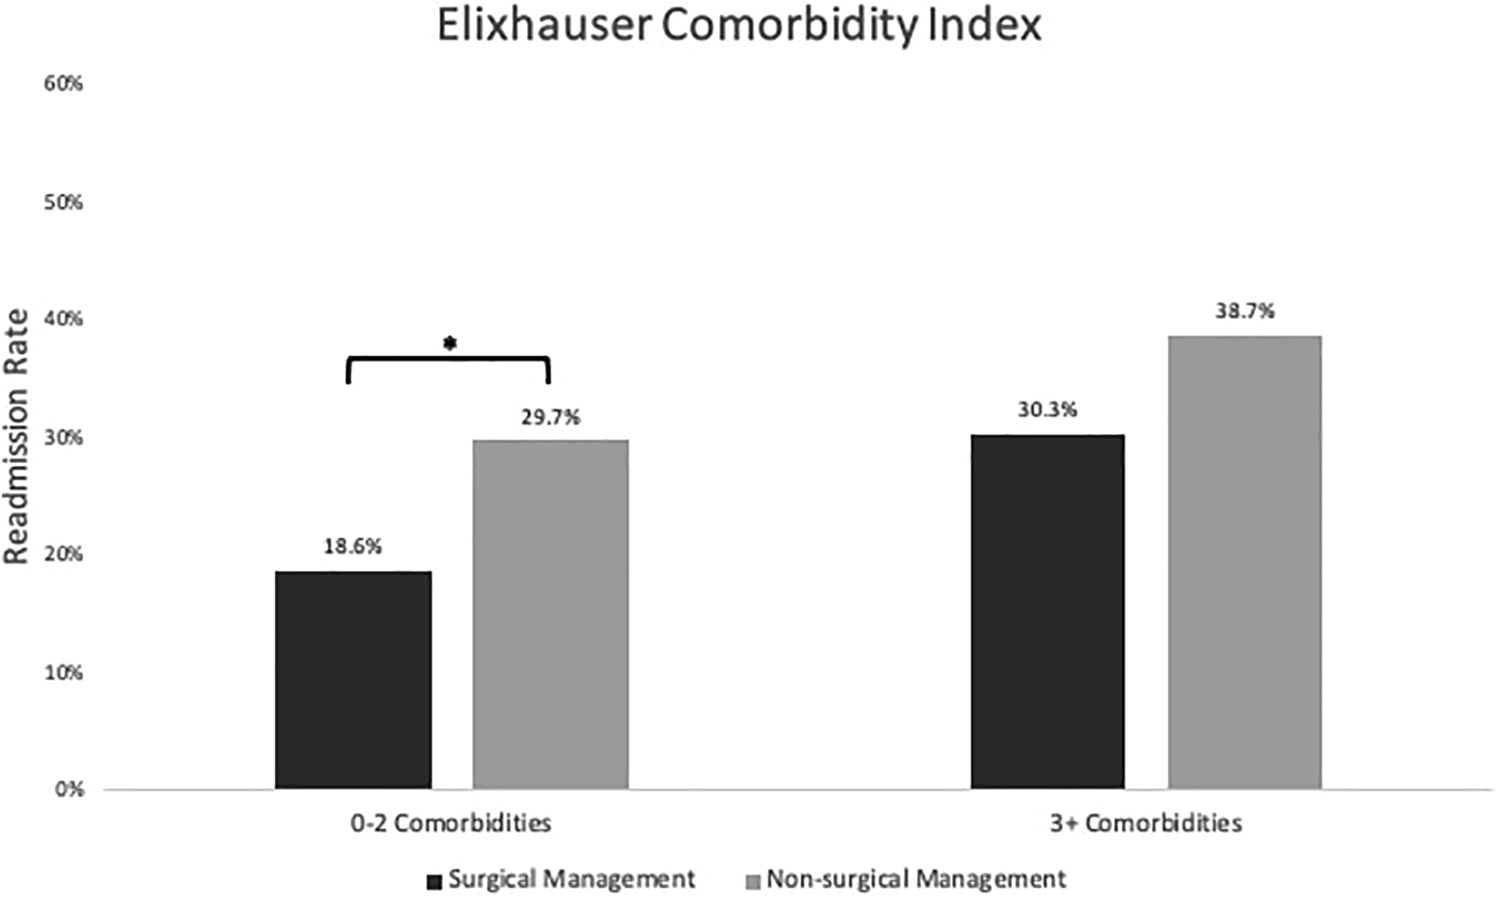
Elixhauser comorbidity index 90-day readmission rate for surgically and non-surgically managed patients by number of comorbidities. *Indicates significant difference.
Discussion
The aim of the present study was to compare surgical and non-surgical management of SEA using readmission rate as a metric of success of treatment strategy. Due to the rarity of SEA of 1.7-8 cases per 10 000 hospital admissions, studies intended to advise on management strategies are limited by small sample sizes and to single institutional cohorts.5-7,20 To our knowledge, the present study is the largest powered comparing readmission in surgical and non-surgical management strategies and is the first to include a national sample.17,20,32 We queried the NRD for patients with a primary diagnosis of SEA and found the 90-day readmission rate to be 26.0% for surgically managed patients and 35.1% for non-surgically managed patients (P < .05). We found that surgically managed patients had a lower risk of being readmitted for a primary diagnosis of osteomyelitis than non-surgically managed patients (P < .05). Additionally, Medicare insurance status (P < .05) and complexity of index visit (higher LOS: P < .05, higher cost P < .05) were associated with readmission in surgically managed patients. Furthermore, the readmission rate was significantly lower for surgically managed patients with a low comorbidity burden as measured by CCI (P < .05) and ECI (P < .05) but not for patients with a high comorbidity burden (CCI: P = .69, ECI: P = .06).
In a large national sample, patients with SEA experienced very high rates of 90-day readmission (surgical: 26.0%, non-surgical 35.1%), long LOS (surgical: 14.07 ± 12.58 days, non-surgical: 11.21 ± 11.37 days), and expensive admissions (surgical: $152 347 ± 132 585, non-surgical: $78 871 ± 77 871). In comparison to elective lumbar spine surgery which has a 90-day readmission rate of 2.5% and an average LOS of 4.16-4.49 days and to primary metastatic spine tumors which has a 90-day readmission rate of 11.6%, patients with SEA experienced very high rates of readmission and long hospital admissions.23,33 The readmission rate and average LOS observed in our study are lower but comparable to numbers reported in a recent bi-institutional analysis of 93 patients by Longo et al which reported a 90-day readmission rate of 37.1% and an average LOS of 20.3 ± 15.3 days. 32
Awareness of SEA is increasing, as evidenced by the increase in its prevalence in the recent decade.4-7 Delays in diagnosis, however, are common and have been found to occur in as many as 75% of patients.34,35 Such delays in diagnosis and treatment can lead to irreversible neurological deficits and morbidity.13,34,35 One of the main challenges of early identification of SEA is that patients typically present with some combination of a nonspecific triad of symptoms including fever, neck or back pain, and neurological impairment.3,20,36 The present study emphasizes the seriousness of SEA and supports its inclusion as a not-to-miss diagnosis for patients presenting with symptoms because early recognition and prompt treatment are key to avoiding adverse results in patients.2,18
Our study found the global readmission rate to be significantly lower in our surgical cohort than our non-surgical cohort. Specifically, we observed that in patients with a lower comorbidity burden, the readmission rate was significantly lower in surgically managed patients than non-surgically managed patients. Furthermore, we observed a decreased rate of readmission for osteomyelitis in surgically managed patients, possibly due persistent low-grade infection with exclusive antimicrobial treatment that can lead to more severe infection and osteomyelitis. 37 Early surgical intervention has been shown to improve neurological outcomes and conservative non-surgical management has been shown to fail in 41-75% of patients who required subsequent surgical decompression.9,11,38-40
While the majority of studies advocate for better outcomes with immediate surgical decompression, 12 some studies have sought to identify risk factors for failed medical management and subgroups where medical management might be advisable.12,14-16,38 Kim et al identified patients with age >65 and diabetes, MRSA infection, and neurologic compromise as risk factors for failed medical management. 15 Patel et al found diabetes mellitus, bacteremia, and high white blood cell counts as risk factors for failed medical management. 38 Shah et al identified diabetes mellitus, active malignancy, and 4 other factors to be predictive of failed medical management. 14 Furthermore, we identified 5 systematic literature review articles since 2014 that advocated for a nuanced approach to SEA management and created decision tree models to help guide treatment depending on patient and disease characteristics such as the risk factors previously mentioned.8,10,13,20,41 Our present analysis can help guide future treatment guidelines as we found an advantage to surgical management in patients with low comorbidity burden that was not sustained in patients with a high comorbidity burden.
The strength of the present study is in its large sample size (1,172 patients) and in its use of national data. A 2020 review by Sharfman et al identified small sample size as a major problem in studies intended to guide treatment of SEA which is likely driven by the rarity of SEA infections. 20 Because of the high sample size of our study and its use of a national cohort, our study helps to establish statistics for SEA on a national level such as demographic of SEA patients, readmission rate, average LOS, and average cost at index admission. Additionally, our study provides evidence for a benefit to surgical management of SEA patients, particularly in those with low comorbidity burdens.
The main limitation of the present study is in its inability to control for SEA severity, size, or location, as well as neurological status and presence of spinal instability as the NRD does not contain this level of granularity. In literature treatment recommendations, surgical decompression is advised in patients with advanced, large, and severe SEA and medical management is advised in patients with more limited and contained infection.10,13 We were unable to control for this possible effect given the limitations of the NRD and so it is possible that our surgical cohort had, on average, worse infection than our non-surgical cohort. Controlling for SEA severity might have made the observed effect even more pronounced and so a major goal in future studies comparing readmission rates between surgical and non-surgical management should be to account for SEA severity. Additionally, the retrospective nature of this study limits our ability to establish causation between management strategy and readmission rate. The results of the present study should be interpreted as an association rather than a cause-and-effect relationship.
Conclusion
In a large national dataset, we calculated a readmission rate of 26.0% for surgically managed and 35.1% for non-surgically managed patients. In patients with a low comorbidity burden, we observed a significantly lower readmission rate for surgically managed than non-surgically managed patients. These results suggest a lower readmission rate as an advantage of surgical management of SEA and can be used to guide future treatment recommendations.
Footnotes
Declaration of Conflicting Interests
The author(s) declared no potential conflicts of interest with respect to the research, authorship, and/or publication of this article.
Funding
The author(s) received no financial support for the research, authorship, and/or publication of this article.