
Abstract
Study Design:
This is a retrospective cohort study.
Objectives:
Pre and postop Measurement Testing. This is a retrospective study of 33 consecutive interbody spacers in 21 patients who underwent pre, intra, and postoperative measurement of the middle column to determine if this would lead to more precise restoration of middle column height and spacer fit. Scaled transparencies of the pre-operative simulation of angular correction and spacer geometry could be overlayed on the post-operative imaging studies.
Methods:
Multiple Observers Measurement Testing. 33 consecutive vertebral levels requiring interbody spacers for multilevel deformities had middle column height pre and post operatively measured by 3 blinded observers. The preoperative and postoperative measurements were compared using a linear regression analysis and Pearson product-moment correlation.
Results:
Pre and postop Measurement Testing: Thirty-three interbody devices in 21 patients had pre-operative planning, simulation of cage dimensions to determine the proper cage fit which would provide for the desired correction of foraminal height and sagittal balance parameters. The simulated preoperative plan overlayed the final post-operative radiograph and was a near-perfect match in 20 of 21 patients (95.2%). Multiple Observers Measurement Testing: A Pearson product-moment correlation was run between each individual’s pre-op and post-op middle column measurements. There was a strong, positive correlation between pre-operative and post-operative measurements, which was statistically significant (r = 0.903, n = 33, P < 0.001).
Conclusions:
This consecutive series of 33 cases demonstrated the utility of measuring the preoperative middle column length in predicting the optimal height of the spacers, intervertebral disks, and posterior vertebral body height simultaneously restoring sagittal and coronal plane alignment.
Introduction
Statement of the Problem
Spinal deformity correction utilizing SPO, PSO, VCR, and assymetrical osteotomies was creating different geometric anterior and middle column defects.1-3 Posterior wedges of bone are removed from the posterior elements, the spine hinges on the middle column, and the anterior column usually opens up in a triangular wedge. If additional middle column height is desired then the anterior and middle column defect is a trapezoidal shape instead of a triangle. The challenge is that the cage footprint and variable height of the middle column (posterior margin of the cage) gives rise to a variable amount of inventory to provide a secure cage fit. Our objective was to better predict the precise cage geometry in restoring anterior and middle column defects. Figure 1 shows “you can’t put a square peg in a triangular hole.” More often it needed to be a trapezoidal shape. For example, in C7-T1 posterior osteotomies for ankylosing spondylitis, Ames et al 4 reported a high incidence of C8 radiculopathies and interosseous weakness. This is because the middle column height was lost at the osteotomy site and the C7-T1 neuroforamen was closed down. The solution is a second stage anterior custom spacer C7-T1 to restore the height of the middle column, the anterior border of the neuroforamen.
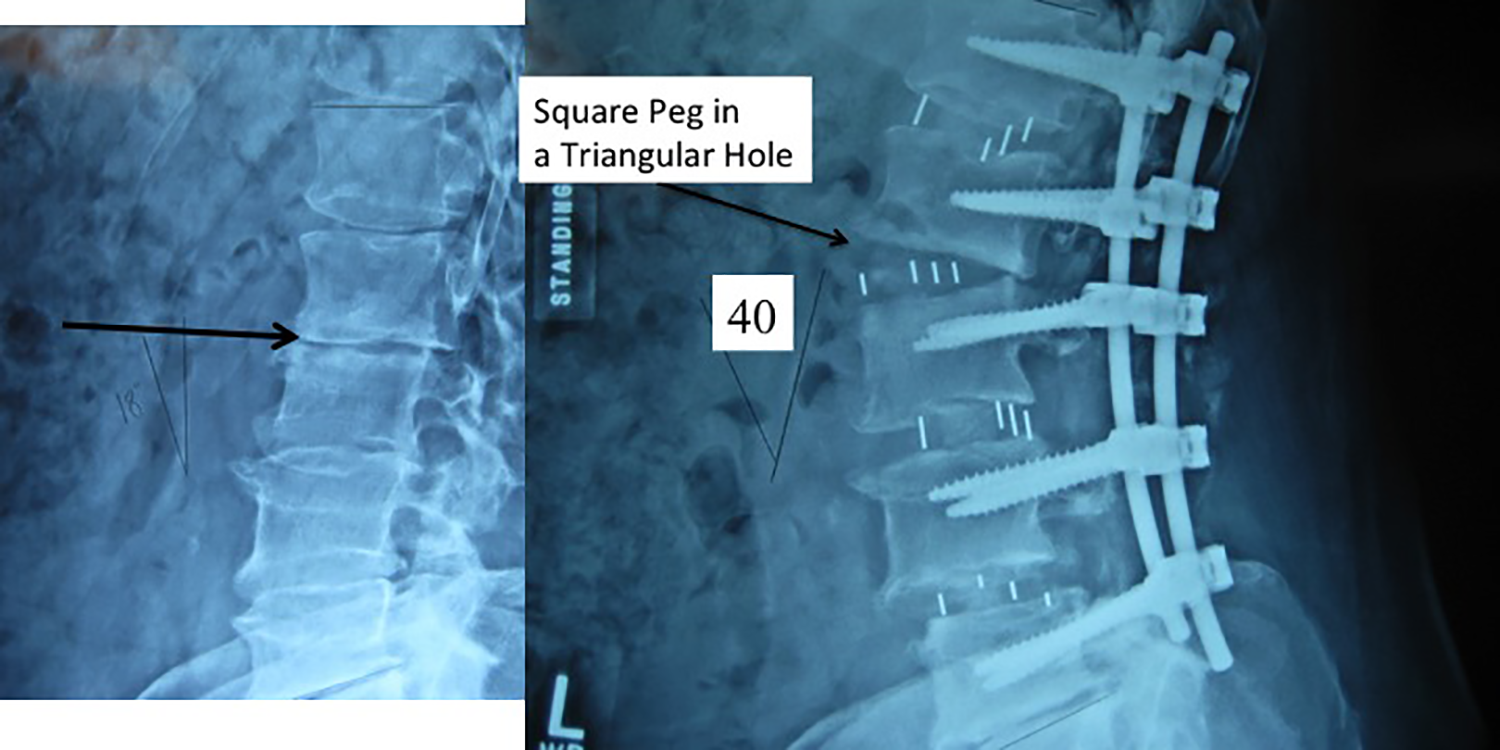
The problem. After posterior osteotomies, SPO, PSO, and VCR, the anterior and middle column defects are often triangular or trapezoidal. Most anterior load sharing spacers are rectangular or have parallel endplates. The overall problem is “the surgeon can’t fit a square peg in a triangular hole.” This illustration shows that a rectangular LLIF spacer inserted at L2-L3 during a multilevel 40 degree lordotic correction would not be ideal. Optimal anterior spacer fit at surgery requires accurate pre-operative planning and corrective simulation.
Secondly, Anand et al 5 report of hyperlordotic cages had unacceptable variability in the actual correction achieved. A 20 degree hyperlordotic cage rarely gave 20 degrees of correction—they demonstrated extreme variability and a large standard deviation in their results. The placement of the cage either too anteriorly or too posteriorly in the disk space changed the lordosis. Cages placed in the anterior, middle, and posterior third of the disk space produced 13.02 degrees, 11.47 degrees, and 8.23 degrees of lordosis, respectively (P < .05). Le et al 6 reported radiographic subsidence in 14.3% of patients (20 of 140) undergoing extreme lateral interbody cages.
Furthermore, the degree of osteoporosis and bone quality created different amounts of subsidence. Lastly the surgical carpentry and direction of the long axis of the cage influenced the success of correction—ALIF, XLIF, and most importantly in TLIF. In order to improve the anterior column load sharing we attempted to more accurately measure the optimal cage dimensions by simulating the desired correction pre-operatively and correcting for magnification error (Figure 2A and B).
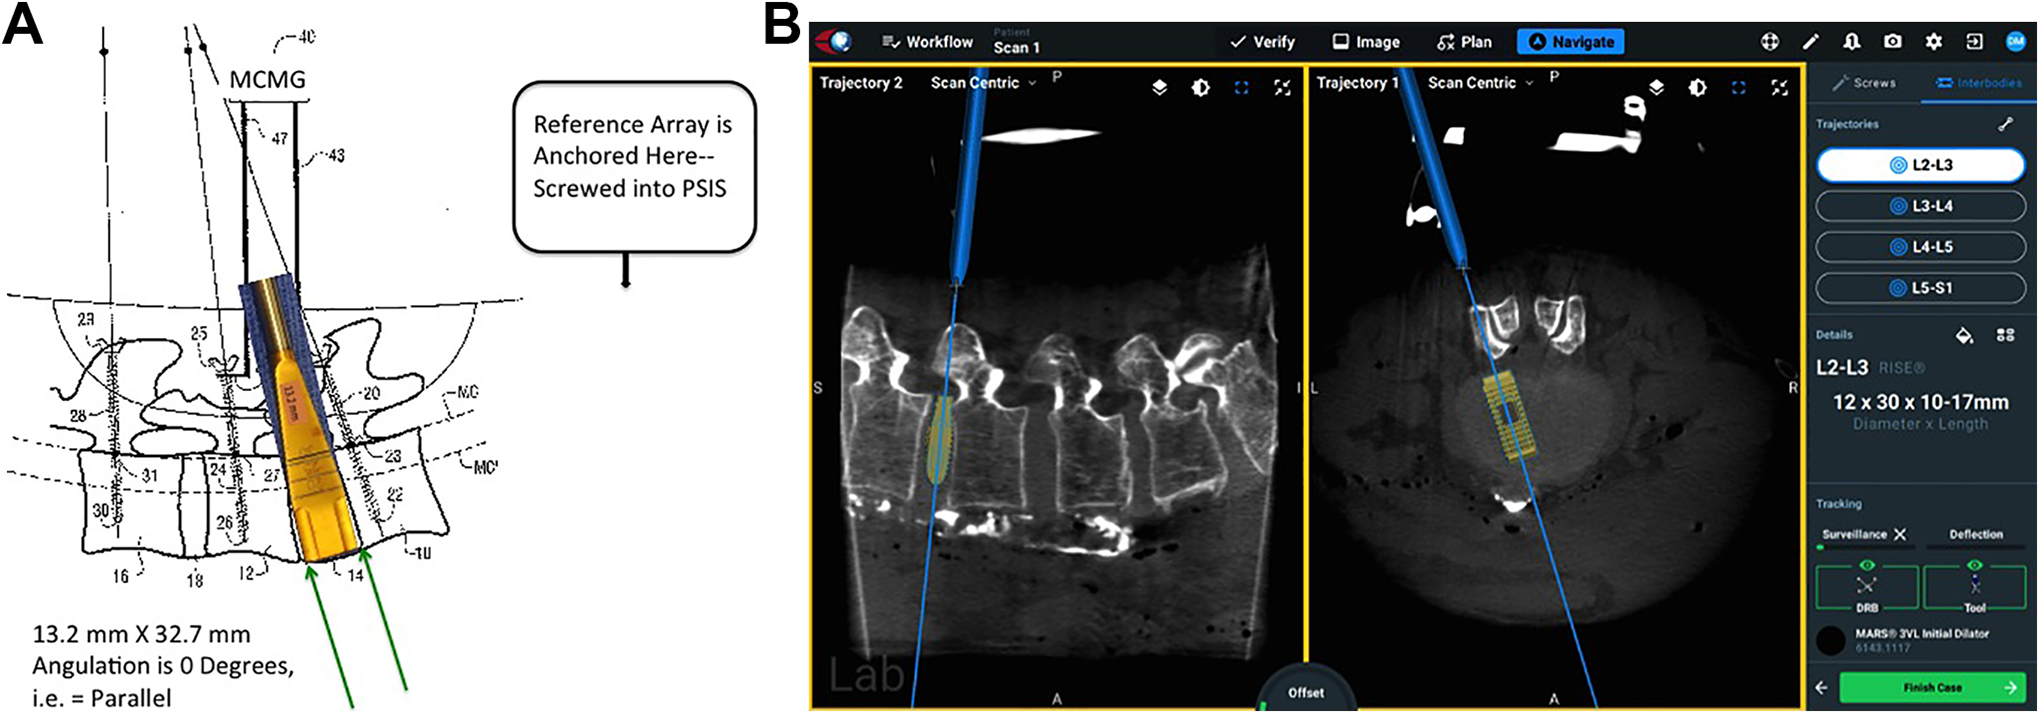
Merging planning with navigation. A, This is the overall theoretical concept of a solution from a patent from 2015. 7 A reference array is placed on the iliac crest on the right hand side of the figure and bone anchors or pedicle screws with reflective fiducials are placed at L3, L4, and L5. The L4-L5 intervertebral disk space is prepared for an interbody fusion spacer—the ultimate cage dimensions 13.2 mm along the PLL and 32.7 mm in anterior-to-posterior length are verified by an optoelectronic navigation system which can track the angulation and 3-D position of the bone anchors in real time. B, This is the actual state of the art of interbody cage navigation at the time of this writing. In particular the axial view based on preoperative or intraoperative CT provides feedback to the surgeon in real time as the intervertebral spacer is inserted.
Measurement Technique and Definition
Middle Column Gap Balancing (MCGB)7-10—Knee ligament gap balancing has proved to be a highly reproducible and predictive technique in preoperative planning to calculate the optimal prosthesis height in total knee reconstruction. Gap balancing is a concept originally developed in total knee replacement surgery which optimizes the thickness of the components throughout the entire flexion-extension cycle of the knee joint (120 arc of rotation). Total knee reconstruction surgeons have found it useful to tension the medial and lateral collateral ligaments while planning the (distal femoral and proximal tibial) osteotomy cuts in full extension and again in 90 degrees of flexion. This serves to keep the rotational alignment of the femur and tibia in correct anatomical position throughout the 120 degrees of the knee joint’s flexion-extension cycle. Gap balancing in knee surgery is used to determine optimal anterior and posterior implant thickness while simultaneously maintaining smooth ligament tension—if the thickness of the posterior spacer is too thin then a flexion gap is present and the knee joint is unstable in 90 degrees of flexion (positive anterior-posterior knee ligament laxity). This is analogous to our objective which was to optimize the anterior-posterior intervertebral disk height throughout the flexion-extension (lordosis-kyphosis arc of rotation) by making use of spinal ligament and annular tension. Therefore MCGB is a method of “gap balancing” the ligaments of the spine, specifically balancing the tethering function of the posterior longitudinal ligament with the bony height of the middle column. If a middle column mismatch (MCM) occurs then a spacer must incorporate this height for the spine to be stable and optimize neuroforaminal height. This method is effective in one or multiple vertebral segments in the cervical, thoracic, and lumbar spine.8,9
Instead of the knee joint which needs to have a balance in length of the medial and collateral ligaments throughout 120 degrees of flexion-extension, in the spine we need the PLL to act as a tether and only need to get 10 to 20 degrees of motion. The key reason for balance between axial height in the spine is to restore the optimum environment for neurological recovery, specifically at each level normalization of neuroforaminal height. The neuroforamen is immediately posterior, adjacent to the middle column. In fact the anterior border of the neuroforamen is the posterior 1/3 of the vertebral body and posterior 1/3 of the intervertebral disk (defined as the middle column)—therefore one would expect its height to be most directly related to the neuroforaminal height compared to the two other longitudinal spinal columns (anterior or posterior).
Materials and Methods
Interbody Solution
Our objective was better pre-operative planning in order to obviate intraoperative improvisation. We utilized software programs that could measure the calibrated length of a curved line (middle column height from pedicle-to-adjacent pedicle distance). This distance changes depending on the amount of flexion, neutral or extension position. Figure 3 illustrates the extent of interbody dimensional changes from extension to flexion throughout a single motion segment. The PLL is at maximum tension in full flexion, whereas the ALL is at maximum tension in full extension. Cage planning has to be done taking into account the final desired amount of lordosis. The dimensions of the interspace along the PLL can change from 7.5 mm up to 10.9 mm, or an error of 3.4/7.5 mm = 45.3% if the amount of final lordosis is not correctly predicted. In a similar fashion the anterior dimension of the interspace, ALL can vary from 20.7 mm down to 14.2 mm, or a potential error of 6.5 mm / 20.7 mm = 31.4%. Keep in mind that with robotics and digital measuring techniques, in accordance with Figure 2A the variation in cage dimension from extension to flexion can also be calibrated and determined from the angulation of the pedicle screws instead of direct measurements of the intraoperative images. A pre-operative simulation needs to be able to quantitate the amount of ligament tension to be able to plan surgical correction. A simulation is made with the proposed proper cage dimensions in the optimal sagittal balance. The simulated plan is made into a transparency. The transparency can be overlayed onto the intraoperative and post-operative imaging studies (Figure 4A, B, and C).
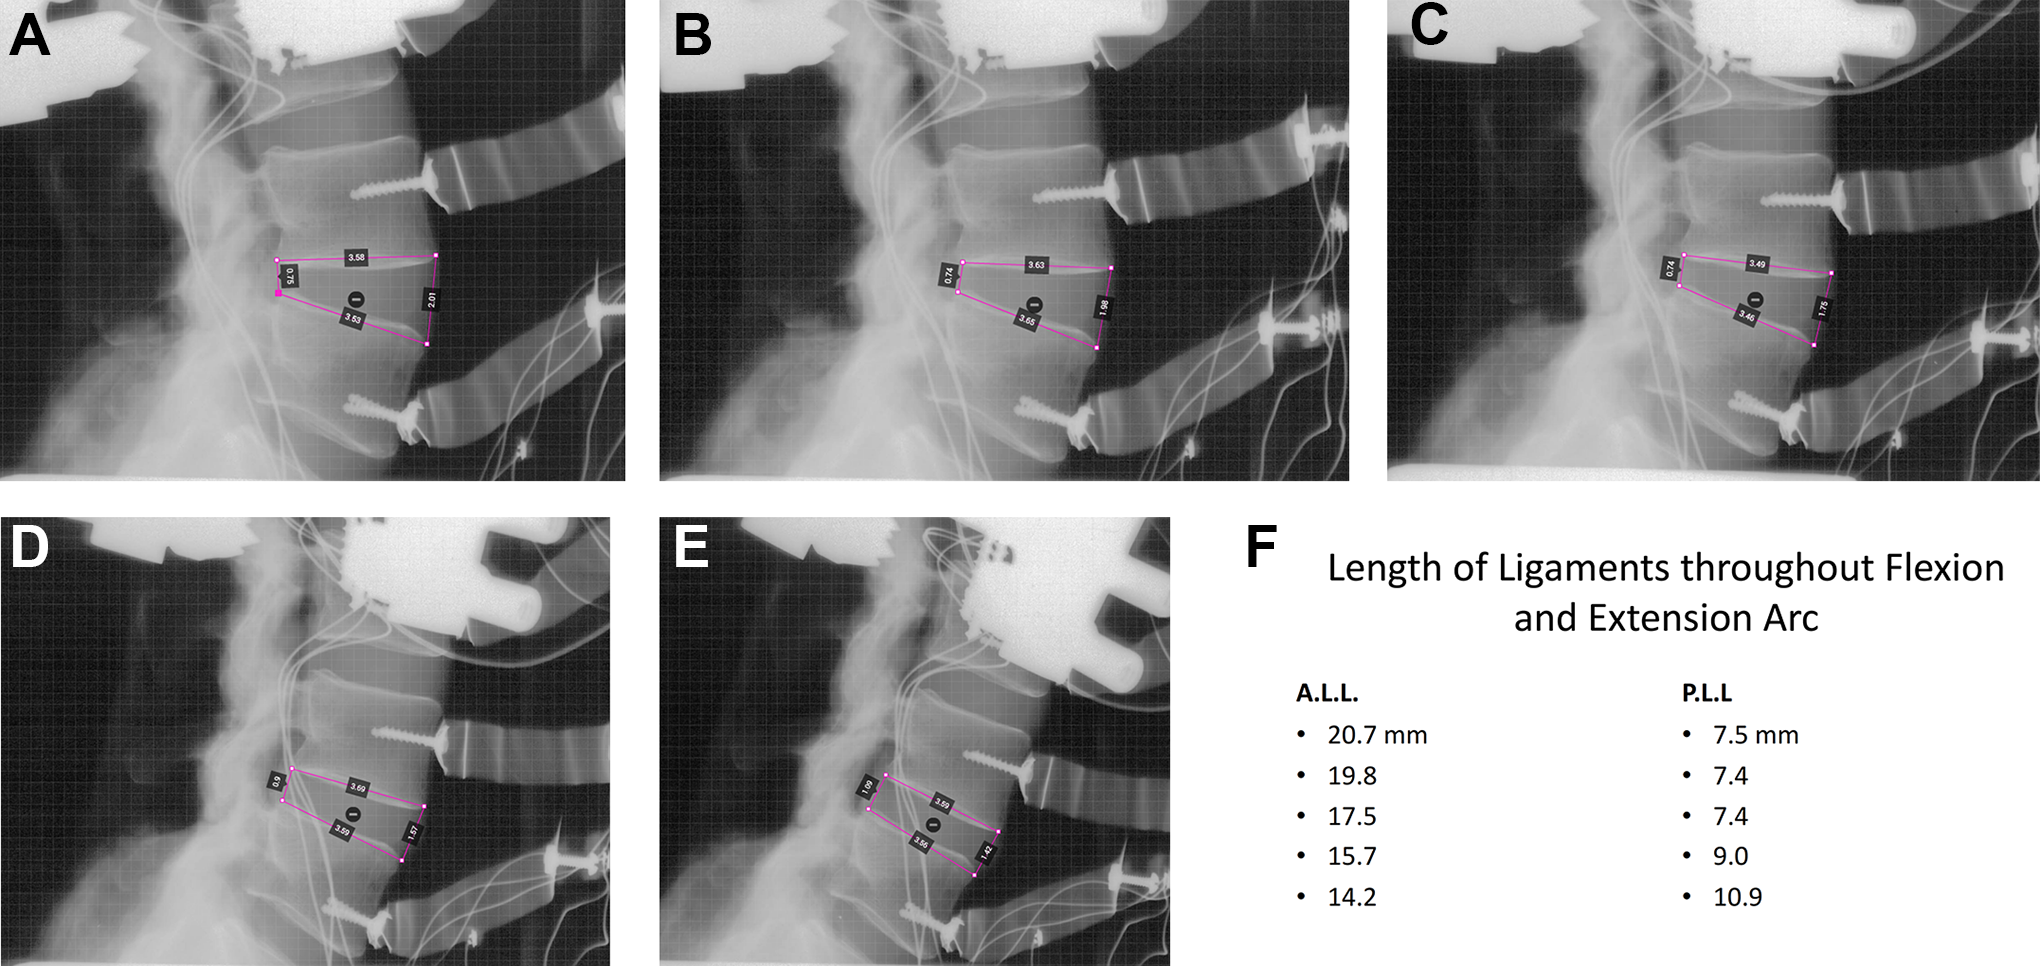
Change of interbody dimensions from extension to flexion. A, B, C, D, and E illustrate 5 gradations of lordosis from full extension to full flexion of a single motion segment. The PLL is at maximum tension in full flexion, whereas the ALL is at maximum tension in full extension. F. Cage planning has to be done taking into account the final desired amount of lordosis. The dimensions of the interspace along the PLL can change from 7.5 mm up to 10.9 mm, or an error of 3.4/7.5 mm = 45.3% if the amount of final lordosis is not correctly predicted. In a similar fashion the anterior dimension of the interspace, ALL can vary from 20.7 mm down to 14.2 mm, or a potential error of 6.5 mm / 20.7 mm = 31.4%.
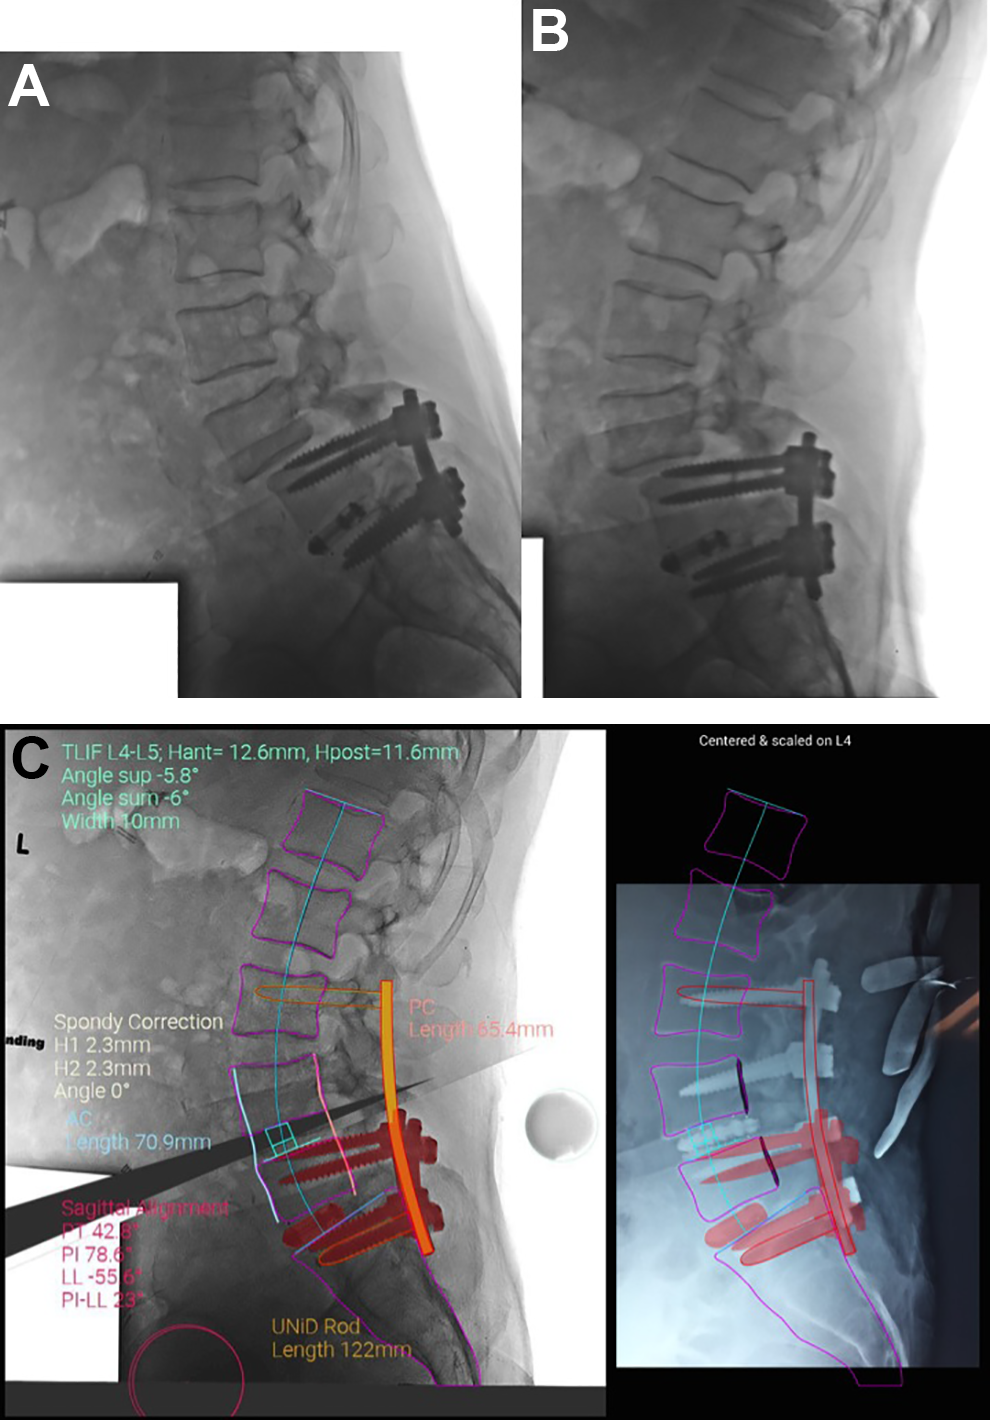
Simulated pre-operative planning. A, This illustrates the preoperative flexion and extension radiographs in a patient with neurogenic claudication from an L4-L5 spondylolisthesis. B, The preoperative simulation of the correction with an L4-L5 TLIF spacer, anterior height = 12.6 mm and posterior height = 11.6 mm, with posterior pedicle screw patient-specific instrumentation from L3 to S1. C, Notice that the transparency of the pre-operative plan is superimposed on the intraoperative radiograph. Once the image is centered and scaled the surgeon receives feedback as to how accurately the plan has been achieved. The silhouette of the simulated vertebral bodies in magenta are superimposed on the intraoperative real-time lateral radiograph. This provided for near anatomic reduction of the L4-L5 level with successful neuroforaminal height restoration and relief of neurogenic claudication.
Custom 3-D printed cages can be fabricated using the simulated plan above (Figure 5). This can also be augmented by using expandable cages which create compression within the disk space, allowing for a more secure fit. More compression at the bone-metal interface should also facilitate better integration and ingrowth. The footprint of the proposed cages can be measured directly off of the preoperative CT—better line-to-line prosthesis fit similar to total knee reconstruction using gap balancing.
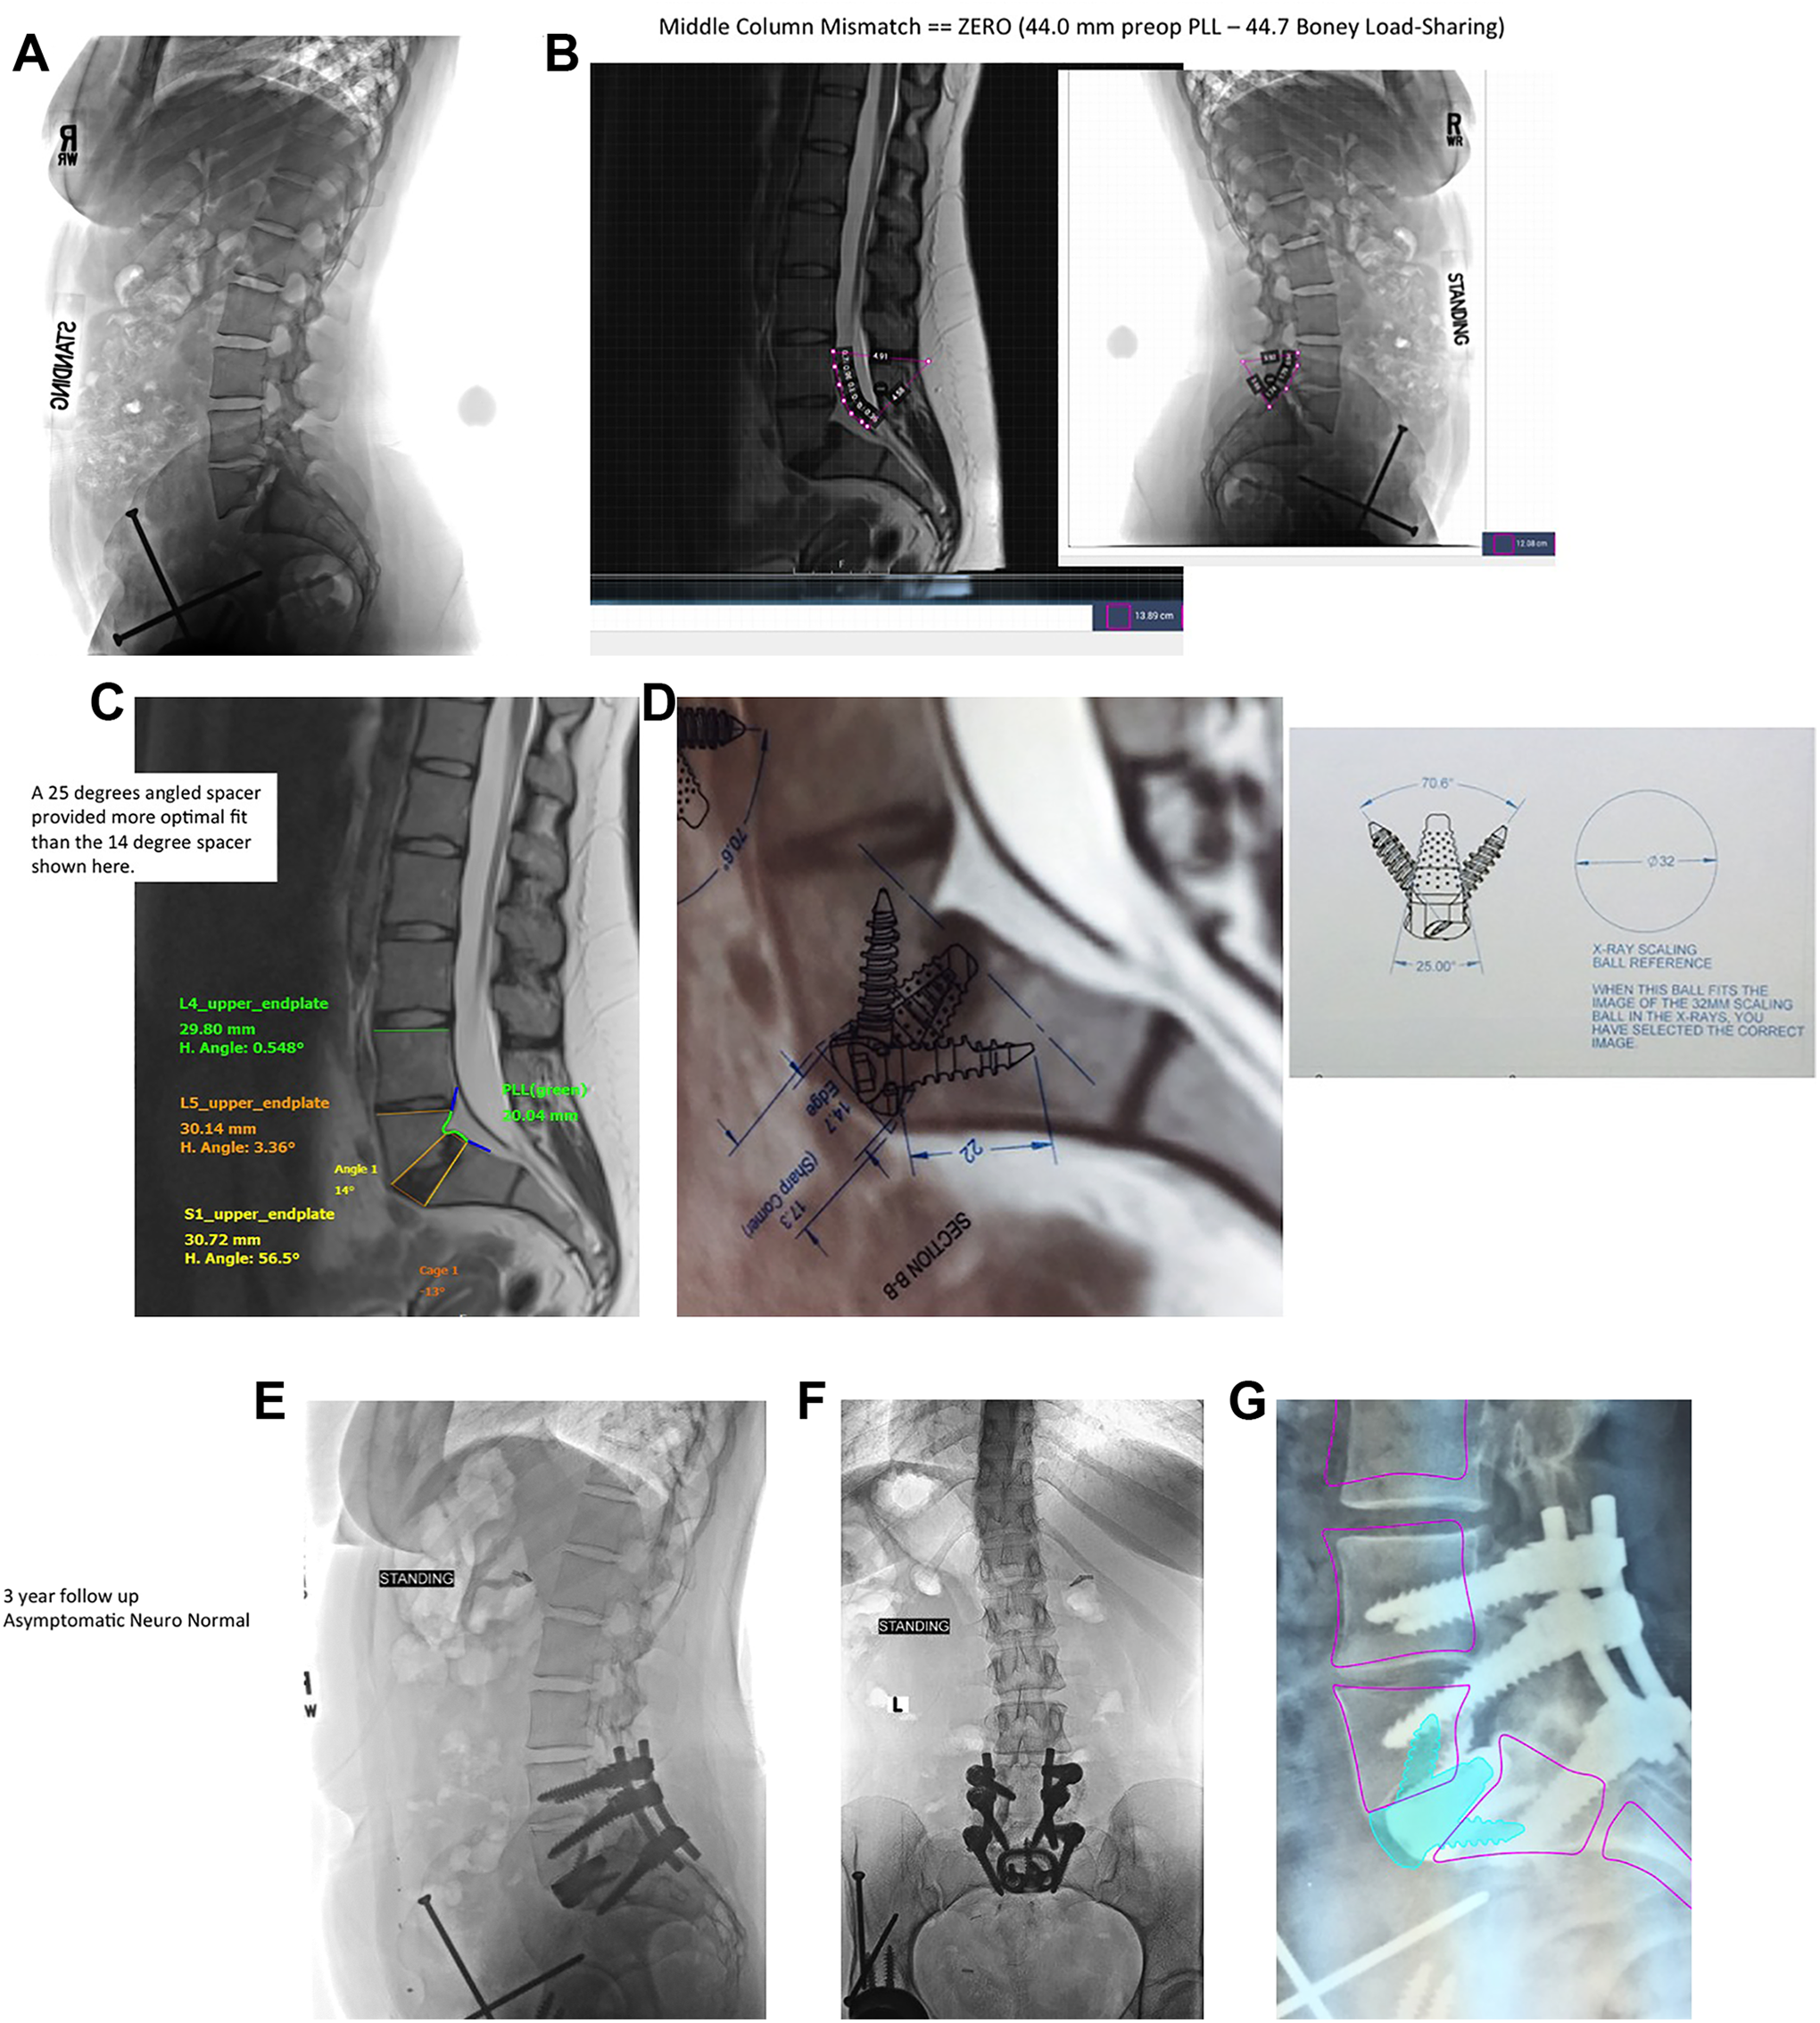
Custom 3-D printed Interbody Spacer. A, This 23 year old woman had already undergone 3 operations for a dysplastic hip problem. She presented with bilateral buttock pain, severe left L5 radiculopathy, walking tolerance of only one block, and she was unable to work. The plain lateral radiograph discloses a dysplastic L5-S1 spondylolisthesis with the posterior elements of L5 never forming. B, The dimensions of the middle column show a tethered cord situation. The length of the middle column PLL from the MRI on the left was nearly equal to the boney height measurement of the middle column from the plain radiograph on the right. Because there is no redundancy of the PLL, the insertion of a spacer cannot increase the height of the middle column (unlike degenerative or isthmic spondylolisthesis). C, Various simulations with different angled interbody spacers can be tried but the optimal fit proved to be a 25 degree lordotic spacer at L5-S1 with vertebral endplate fit line-to-line. D, The 3-D printed cage dimensions are printed on acetates which are corrected for magnification error to allow the surgeon to better visualize the final result with a 25 degree lordotic spacer in the optimal position. E and F, The postoperative standing lateral (E) and anteroposterior (F) radiographs at 3 years postoperatively show good integration of the spacer and no subsidence. The patient had a complete neurologic recovery, was asymptomatic, and returned to work. G, The preoperative simulation with the 3-D printed patient specific spacer is seen superimposed on the post-operative radiograph. The position of the L4, L4, and S1 vertebra are near optimal.
Intraoperative navigation and robotics provide more consistent anterior and middle column carpentry and cage fit. The components of a self-contained navigation system are identical to that described previously. We depend on a dynamic reference array, usually anchored into the posterior iliac crest (Figure 2A). In another portion of the same iliac crest or in the contralateral side a surveillance marker is inserted. This serves as an internal validation marker in case the reference array is inadvertently bumped. Throughout the interspace preparation active force monitoring is used to prevent skiving of the insertion instruments. There is interbody tracking via the holding instrument or the interbody shavers. The starting point and the 3 axis trajectory of the instruments are navigated similar to the insertion of pedicle screws. The length of the middle column can change throughout the range of flexion and extension, therefore the patient’s intraoperative position regarding the amount of lumbar lordosis needs to now be compared to the preoperative simulation (Figure 6A, B, C, D, E). Since the robot is floor mounted and can withstand 180 lbs of force, a retractor can also be attached to the effector arm of the robot. The intraoperative navigation shows the direction of the disk preparation instruments, shavers, and cage implant holder. The orientation and depth of the implant can be checked on the computer, matched up with the planned simulation, and confirmed under direct vision.
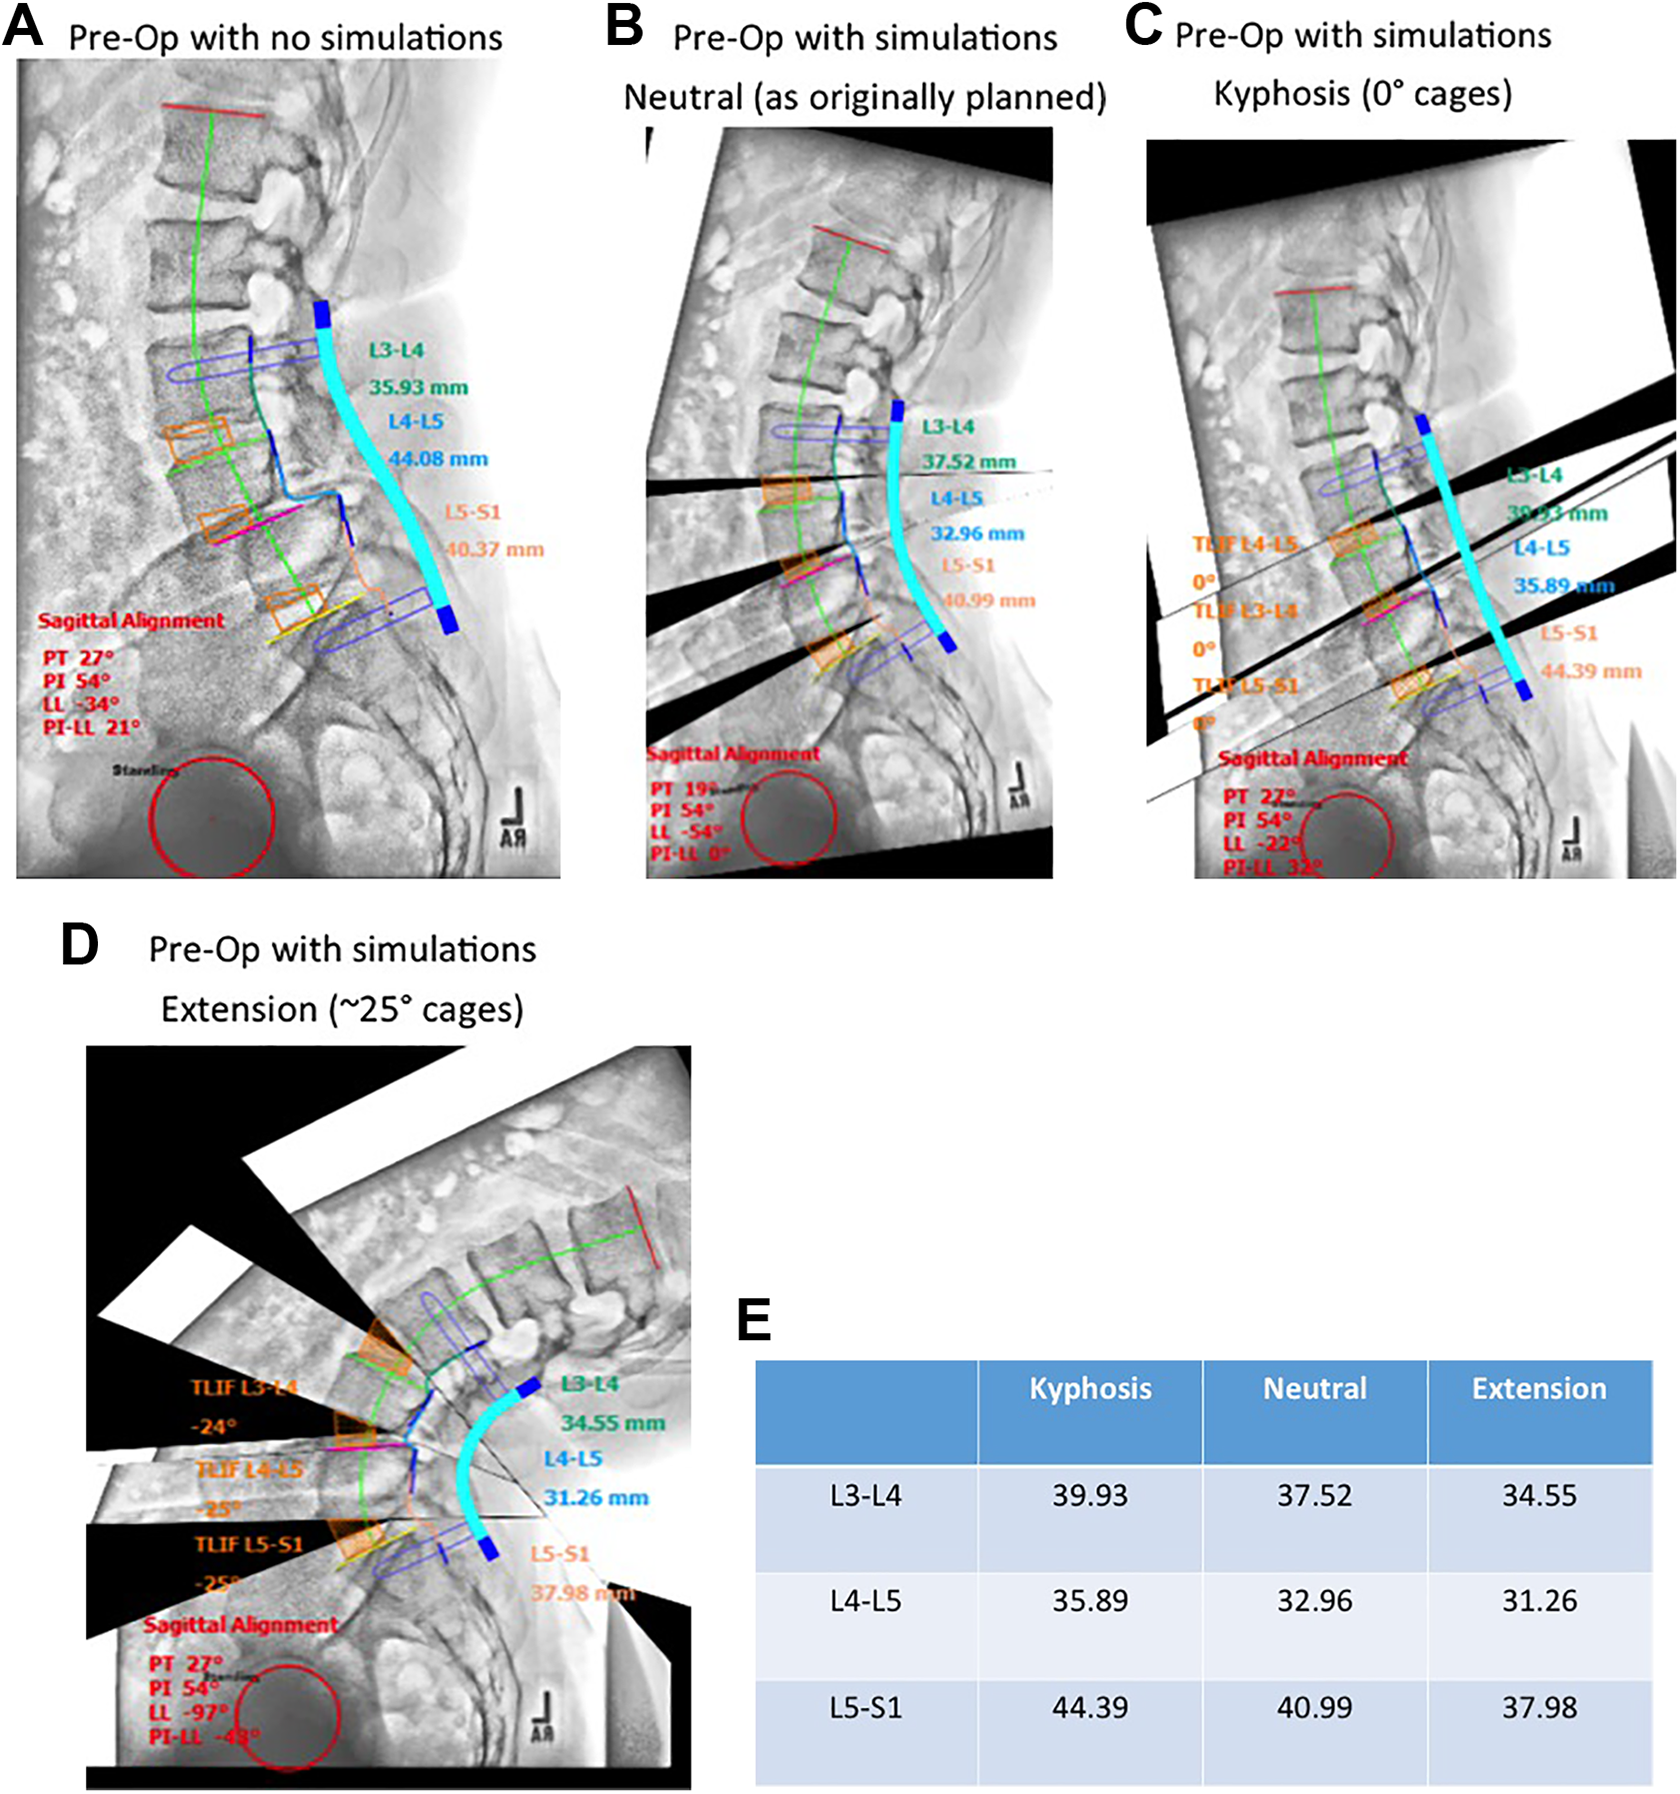
Changing interbody dimensions with sagittal balance. Most pre-operative planning simulated software programs do not change the spacer dimensions as the spinal alignment varies from flexion to extension. A, The preoperative lateral radiograph without simulations shows a grade II L4-L5 degenerative spondylolisthesis. B, C, and D, This series of 3 simulations from extreme flexion to extreme extension shows how much the cage dimensions would change depending on the cage angulation after reduction. E, The actual cage dimensions at L3, L4, and L5 vary significantly with the change in position. At L4-L5 this leads to a potential error of 4.63mm/ 31.26 mm = 14.8%, for example.
Clinical Retrospective Series
Twenty-one consecutive patients undergoing surgery with multilevel deformities for cervical, thoracic, and lumbar procedures had middle column height pre and post operatively measured by 3 blinded observers. The preoperative and postoperative measurements were compared using a linear regression analysis and Pearson product-moment correlation.
Cage Materials
All of the cages were made from Titanium 6Al-4 V and were printed by Direct Metal Laser Sintering (DMLS). The additive manufacturing allows for a highly porous 3 dimensional volume to provide required stability, immediate frictional resistant fit, ligamentotaxis, and long term ingrowth. On inspection all of the cages fit and stayed in position much better than the same sized non-porous ingrowth trials. The cages are also noticeably honeycombed and lighter that their conventional cage counterparts. The pore sizes were made in a range of diameters based on 1) the size limitations of what would form during 3D printing (500 microns) and the optimal size pores from the literature using animal models.11,12 They ended up being a range of sizes between 500 to 650 micron diameter pores. The more pores, the more surface area available for osteoblastic ingrowth. Pores and roughness both increase the available surface area.
Direct metal laser sintering (DMSL) is a metal 3D printing process that builds fully functioning metal prototypes and production parts within 7 days. The DMLS machine builds the implant layer by layer. A laser is aimed onto a bed of titanium powder. Each cross-sectional layer of powder is micro-welded, or sintered and a recoater blade moves across the build to provide the next layer. After the layers complete the implant build, the construct is heat-treated while still anchored at the base to relieve any additional stresses and to prevent any microfractures. The last refining process removes the support structures by bead-blasting and polishes the surface burrs. Acetates are made with various magnifications to allow correction of radiographic magnification error. These overlays can be directly placed on preoperative, intraoperative or post-operative images to obtain optimal implant sizing.
Results
Table 1 shows the demographics of our retrospective cohort of 21 patients with 33 vertebral levels with spacers. The preoperative simulations were able to be overlaid over the postoperative radiographs, and magnification corrections were made. Thirty-three interbody devices in 21 patients had pre-operative planning, simulation of cage dimensions to determine the proper cage fit which would provide for the desired correction of foraminal height and sagittal balance parameters.
The Demographics of 33 Intervertebral Spacers in 21 Consecutive Patients.
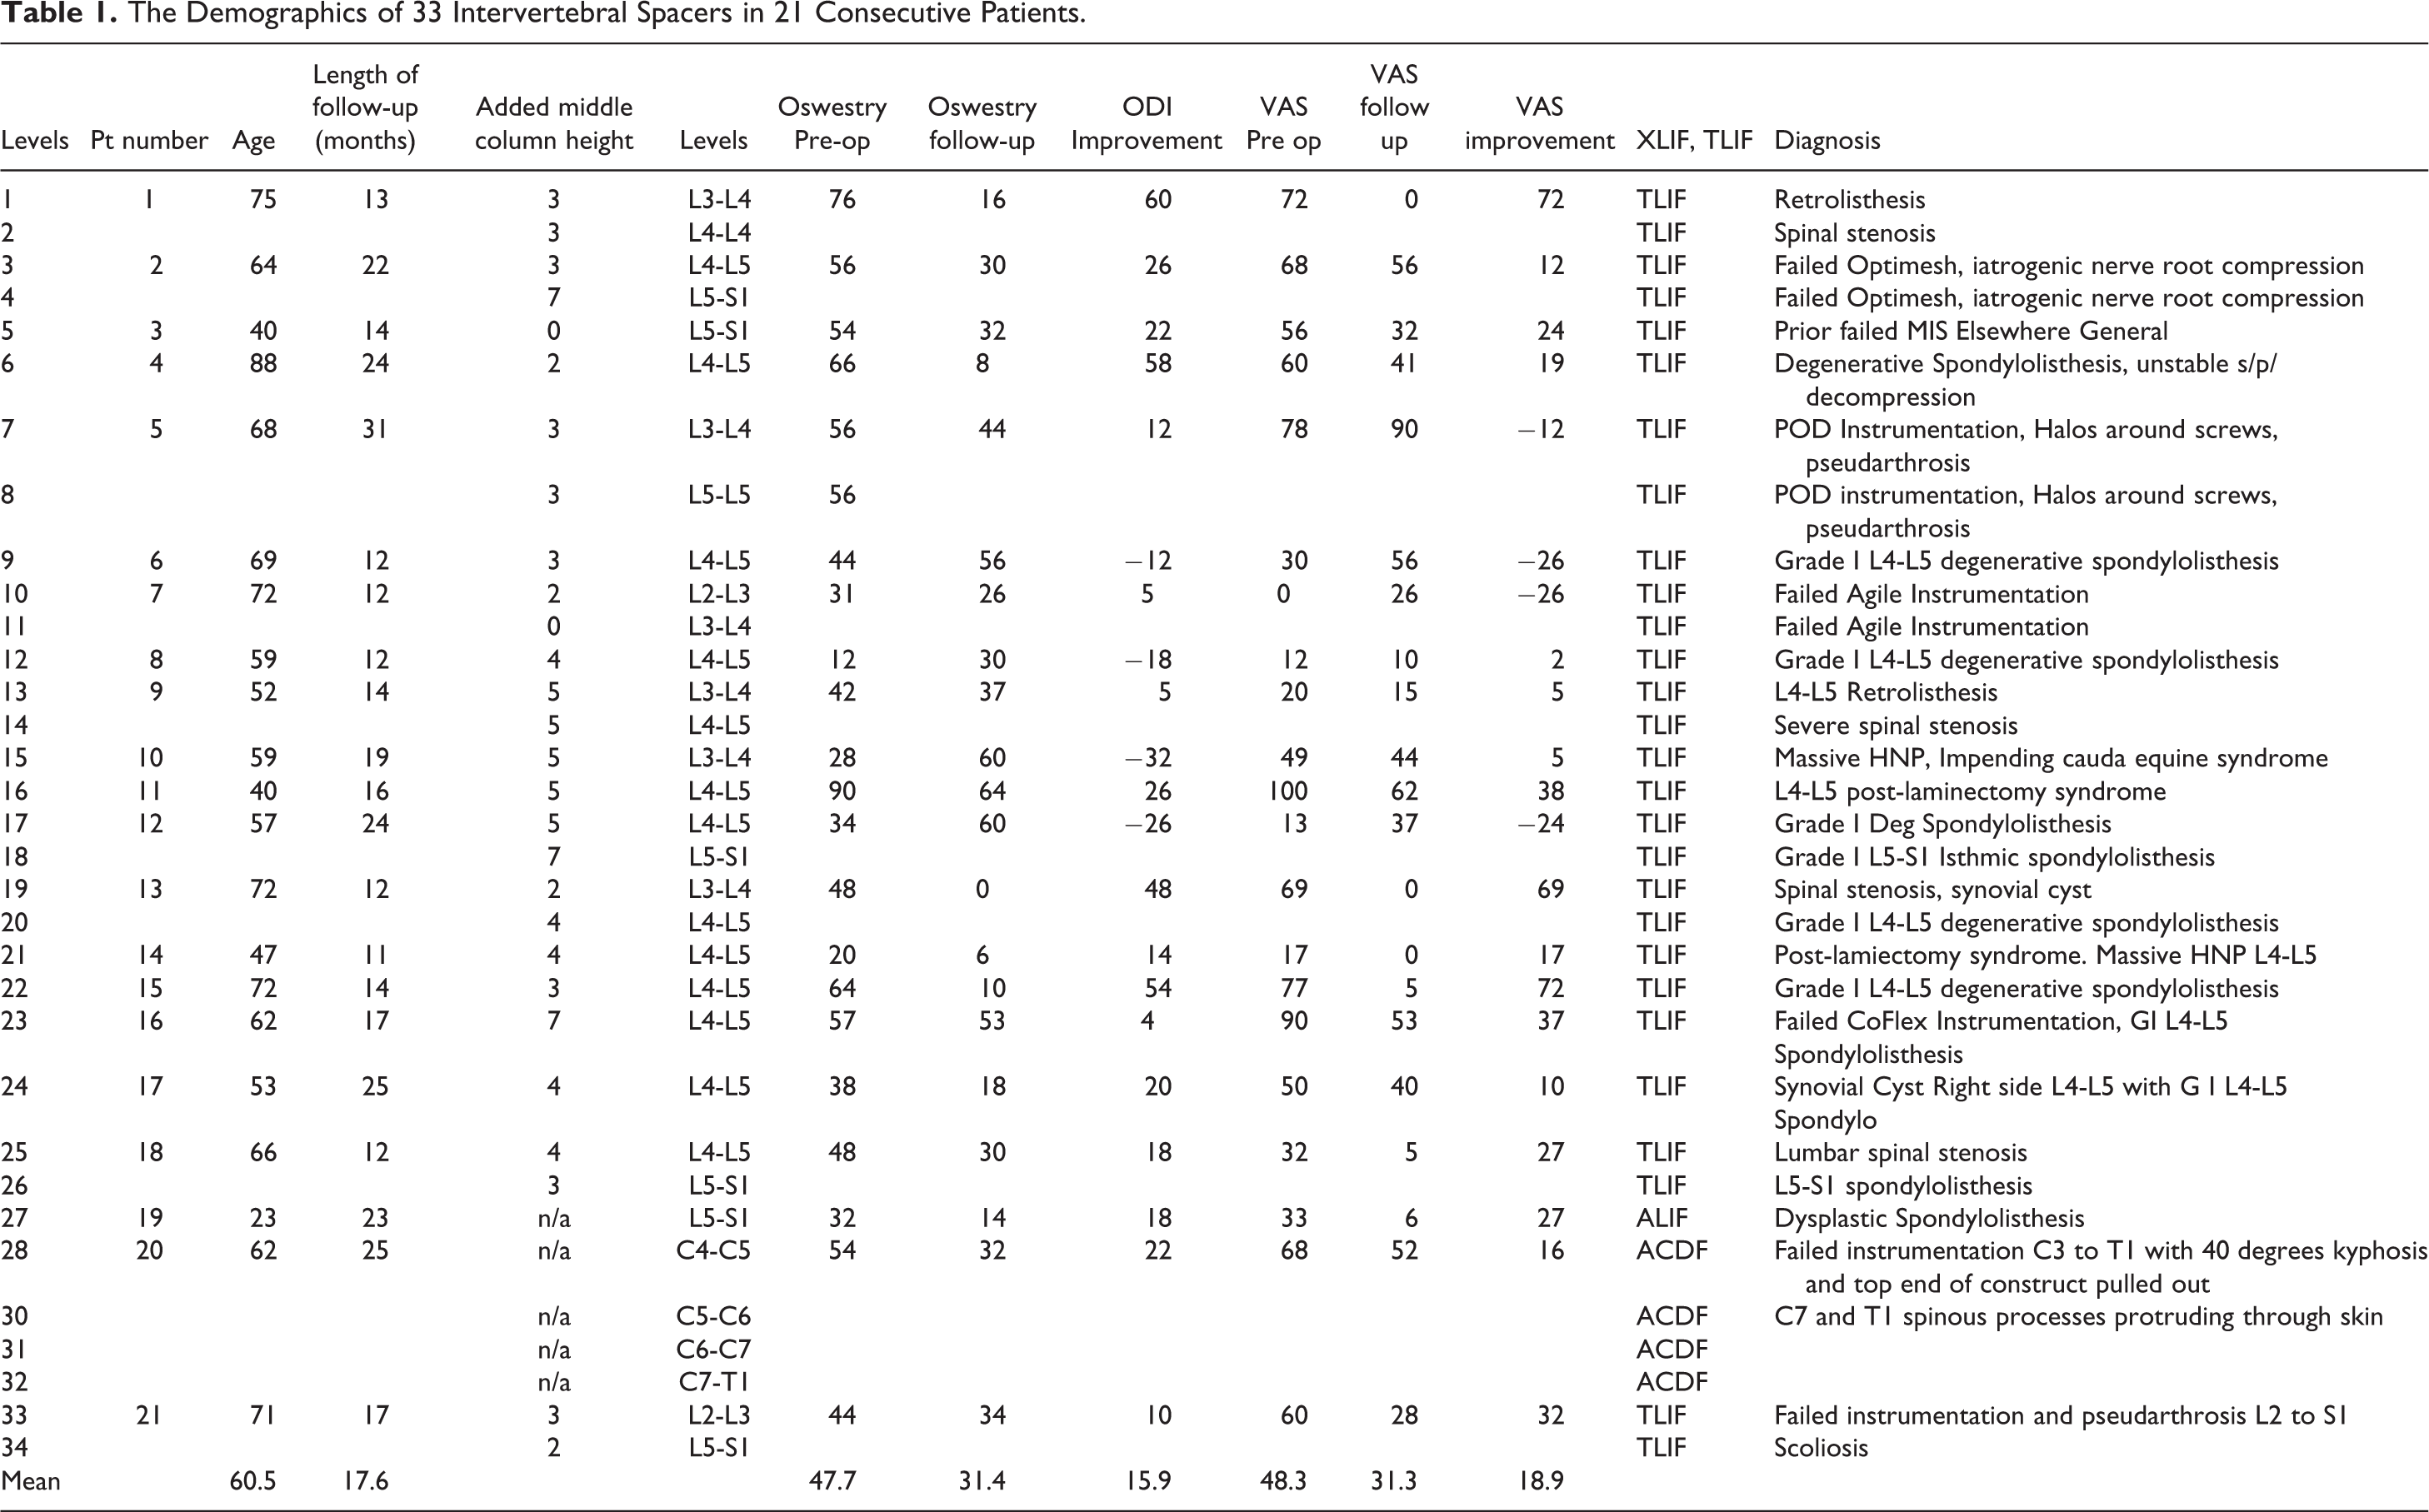
The average age was 60.5 years (range 23 to 88). There were 13 patients requiring one-level spacers, eight patients requiring 2 level spacers, and 1 patient with cervical kyphosis required custom 3-D printed spacers at 4 levels. The individual diagnoses were quite varied as expected and they are listed on the far right hand column in Table 1. Eighteen of the cases were performed as primary procedures, whereas 15 of the procedures were performed as revisions (45%), with 14 of the cases having prior failed instrumentation. After measuring the difference between the boney aspect of the middle column and the ligamentous tension of the middle column (posterior longitudinal ligament), the added height or posterior height of the trapezoid is listed in millimeters (added middle column height). The most redundant PLL required 7 mm of added height whereas one case was a tethered cord situation where no added lengthening of the spacer was indicated.
The mean length of clinical follow up was 17.6 months (range 11 to 31 months). There were no cage loosening or revision surgeries required. Flexion and extension radiographs were obtained on all patients at every follow up interval and there was never a radiolucent line present at the metal-bone interface of more than 40% of the surface area of the cage. It is important to keep in mind that the ingrowth or anterior stability was augmented by posterior fusions in all 33 cases.
The mean clinical outcomes improvement was 15.9 on the Oswestry Disability index and the mean improvement was 18.9 on the Visual analog scale (VAS) of the patients most symptomatic extremity.
The simulated preoperative plan overlayed the final post-operative radiograph and was a perfect match in 20 of 21 patients (95.2%). A representative accurate overlay showing a well executed plan is shown in Figure 7A. In contrast, a simulation that was not well achieved is shown in Figure 7B. Notice that the instrumentation was not carried down to the sacrum, a spacer was not placed at L5-S1, and the sagittal balance was never corrected to the desired amount due to suboptimal execution.
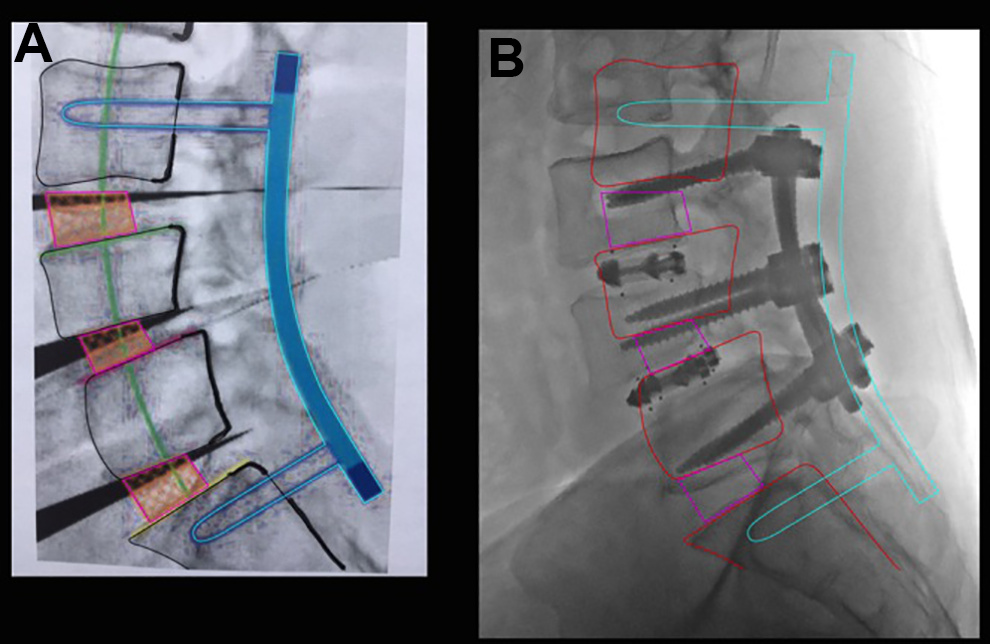
Simulated overlay from a suboptimal result. The superimposition of the pre-operative simulated plan onto the post-operative images allow for a clear assessment of the accuracy of the surgical plan and how it matches up with the surgical execution. The preoperative plan on the left illustrates 3 interbody spacers, 3 SPO corrections at L3-4, L4-5 and L5-S1. The decision was made intraoperatively to improvise and to not correct nor instrument the L5-S1 level. This led to inadequate improvement in sagittal balance evidenced by the large discrepancy between the proposed vertebral body outlines in red and the actual ghosted vertebral body outlines on the postoperative image.
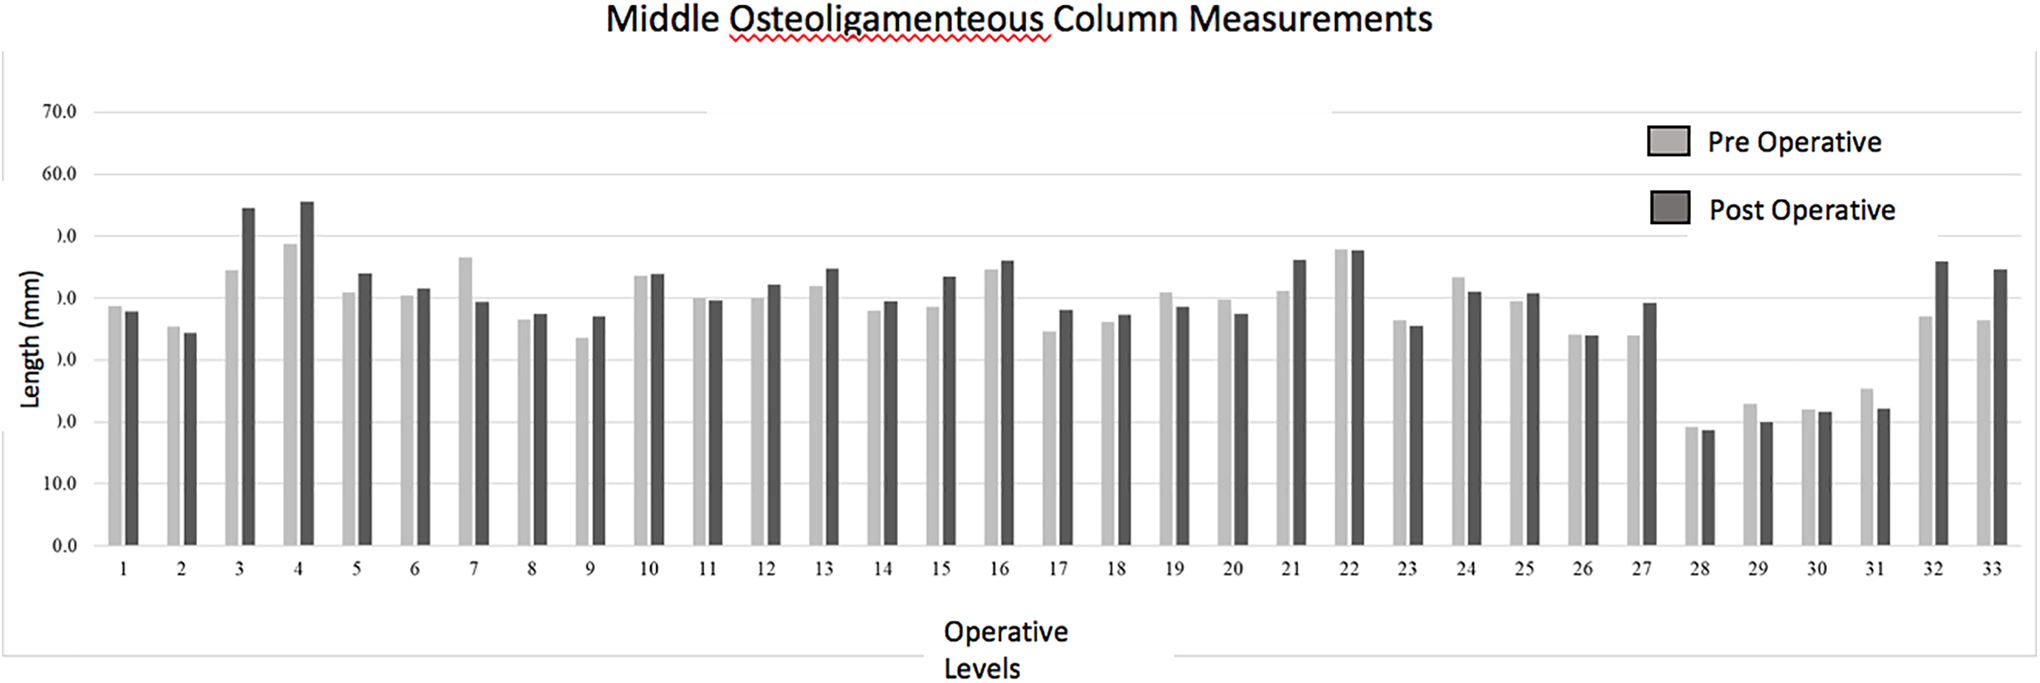
A bar graph illustrates the pre-operative and postoperative measurement of the middle column using a proprietary digital mapping program capable of measuring the length of a curved line (Image J. Paired t test was run on a sample of 33 vertebral levels to determine whether there was statistical significance between pre-operative and post-operative measurements of the middle osteoligamentous column. Increases in middle column length following surgery were negligible (post-op: 9.9 ± 3.4 cm; pre-op: 9.8 ± 4.1 cm), no statistical difference was found between column lengths (95% CI, −0.27 to 0.19) cm.
A Pearson product-moment correlation was run between each individual’s pre-op and post-op middle column measurements. There was a strong, positive correlation between pre-operative and post-operative measurements, which was statistically significant (r = 0.903, n = 33, P < 0.001).
The linear regression line expressed by the formula, y = 1.0981x + 2.2595 is illustrated in Figure 9. There was a high correlation between the preoperative middle column gap balancing measurement and the post-operative reconstructed middle column height including spacers, R squared = 0.815.
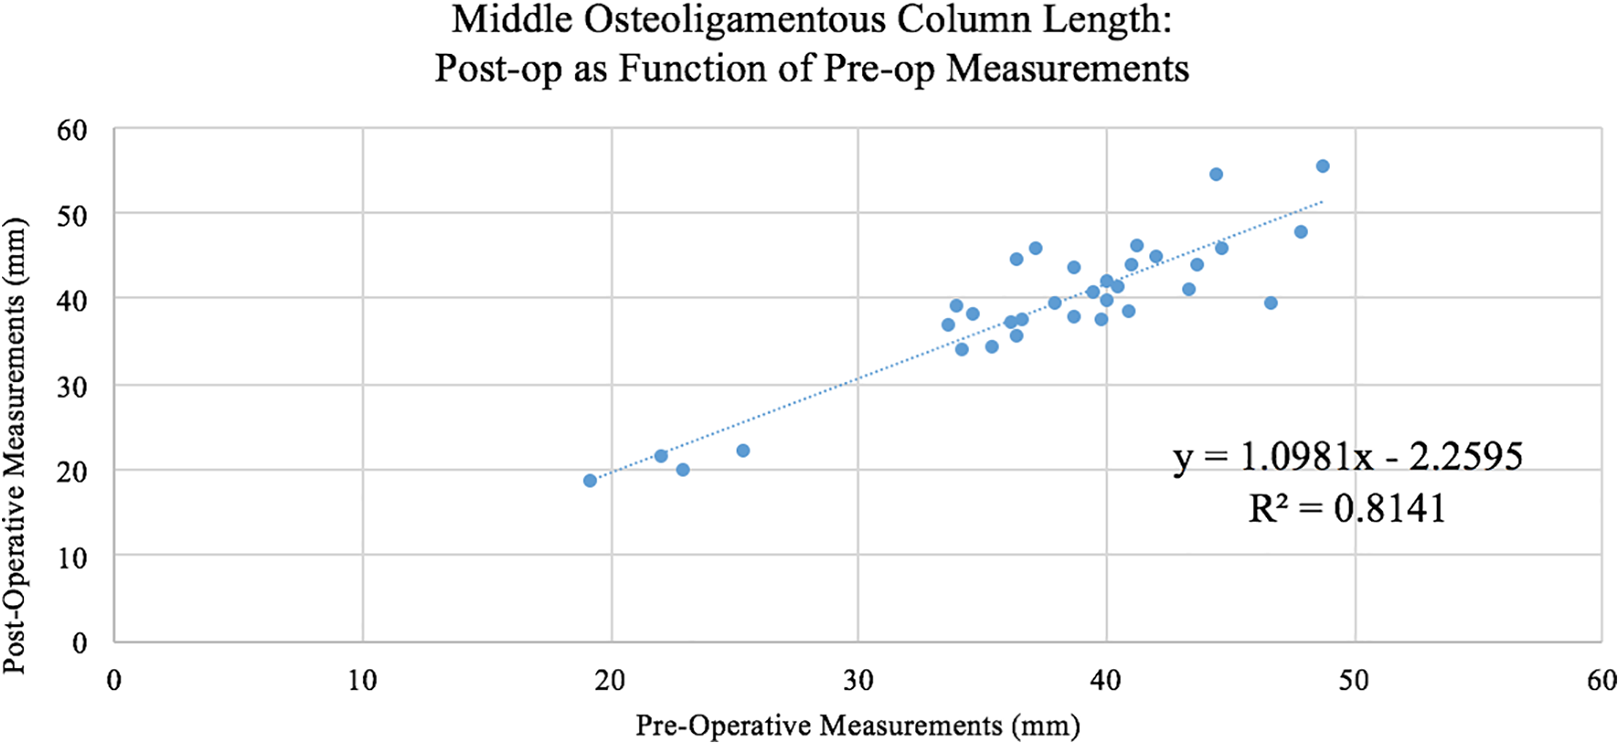
The linear regression line expressed by the formula, y = 1.0981x + 2.2595 is illustrated. There was a high correlation between the preoperative middle column gap balancing measurement and the post-operative reconstructed middle column height including spacers, R squared = 0.815. The intra-observer and inter-observer coefficients of reliability for measurements were R = 0.949 and R = 0.946, respectively—indicating a very high precision and reliability with regard to the intra- and inter-observer measurement results (P < 0.001). The average percent error across all observations for 3 observers was 2.04 ± 2.01%, with no statistical differences detected between observers (P > 0.05).
The intra-observer and inter-observer coefficients of reliability for measurements were R = 0.949 and R = 0.946, respectively—indicating a very high precision and reliability with regard to the intra- and inter-observer measurement results (P < 0.001). The average percent error across all observations for 3 observers was 2.04 ± 2.01%, with no statistical differences detected between observers (P > 0.05).
Discussion
“Human versus Robot” published by Shillingford et al 13 is a common design across many surgical fields to compare the accuracy of surgical technique—105 pedicle screws were placed freehand and in an age-matched non-randomized comparison to 59 screws paced using a robotic guided technique. There was no difference in the overall accuracy between the freehand group and the robotic-guided group (94.9% vs 97.8%) (P = .630). In the placement of interbody and hemicorpectomy type cages and spacers it is not amenable to a freehand versus robotic guided comparison. Robotic guidance for spacers utilizes all faculties, surgeon-feel, intraoperative imaging, pre-operative precise measurement, etc that is utilized for a so called freehand technique. With spacers the preparation and discectomy, contouring of the vertebral endplates, and anterior-posterior placement of the spacer within the disk space, are all contaminating variables. Instead the best comparison is the fit of a patient-specific spacer within the desired a disk space or anterior column defect. This is the type of comparison we are currently studying but power analysis shows that this will require a much larger sample size than 33 cases.
McGilvray et al 12 studied the porous ingrowth of a porous titanium alloy similar to the one used on our series. They compared the ingrowth measured by histomorphometry at 8 and 16 weeks post-operatively in an ovine model. They compared the ingrowth and biomechanical stiffness of 3 types of spacers—1) polyetheretherketone (PEEK), 2) plasma sprayed porous titanium coated PEEK (PSP), and 3) 3D printed porous titanium alloy (PTA). Similar to our clinical application, the thoracolumbar spacers (L2 to L5), were supplemented with posterior pedicle screw fixation.
Only the PTA cages demonstrated increase in stiffness, indicating more stable fusion, at 16 weeks in all 3 loading directions. Micro CT analysis at 8 weeks and 16 weeks was significantly higher for the 3D printed titanium alloy (PTA)—mean density of bone volume / mean density of total bone = MDBV / MDTV ratio (P < .01). This was the most accurate measure of bony ingrowth into the spacers as fibrous tissue and soft tissue reduce ingrowth bone volume. They also found a biofilm layer around the chemically inert PEEK spacers which was absent around the bioactive 3D printed titanium alloy spacers. The investigators described a poorly connected layer of vascularized connective tissue surrounding the PEEK and PSP groups. Thusfar we have not been able to quantitate the amount of bone ingrowth to this degree of accuracy in a clinical series. Microradiography in a laboratory histologic specimen is much more accurate than a high resolution CT analysis in the clinical situation.
Planning Cage Height using Posterior Longitudinal Ligament Elasticity
There are several challenges in predicting and planning cage placement—the cage position can vary and affect the amount of lordosis-kyphosis (distance from the PLL to the back wall of the cage), the vertebral end plate contour and shape is variable (fish mouth disk space), and the amount of cage subsidence into the vertebral end plates is different depending on each patient’s bone mineral density.8,14 These are some of the factors that render current commercially available software programs unreliable. Additionally, the primary shortcoming of preoperative computer planning tools is that they cannot take into account the degree of spinal instability nor subluxation by deriving measurements solely from one standing lateral and one standing anteroposterior radiograph. Instead the ligamentous instability and change in angulation from flexion and extension standing radiographs, CT, and MRI measurements of the middle column length/ redundancy needs to be incorporated.
We have found that there is not just one right way to navigate cage insertion. There is NuvaMap, Surgimap, Medicrea, Image-J and other digital preplanning software programs based on PACS.7-10 The programs are digital so they provide for extracting the important parameters from different imaging sources. For example, the most accurate measurement of the visualization for the desired height of the middle column is from the PLL measurement on the pre-operative MRI. Whereas the footprint of the spacer is best measured on a preoperative CT with sequential cuts, no gantry changing angle, and at least 1 mm or thinner slices. The sagittal balance parameters are best abstracted from the 3 foot plain radiographs which are not stitched together. The navigation program then merges this diverse imaging data at the beginning of the procedure and orients the robot or navigation end effector. In particular the intraoperative fluoroscopy or 3D CT requires a calibration reference and a magnification reference to integrate the preoperative plan with the real time position of the patient’s anatomy. This is a work in progress and each system has its merits. At the current time there is no perfect system as the measurements for placement and sizing of an interbody spacer have been a secondary priority of the developers—the primary objective being correct pedicle screw placement. The JPEGS for simulation of SPO, PSO, and VCR usually hinge the correction at the position of the pedicle screw tulips, rather than the physiologic center of vertebral rotation, IAR = instantaneous axis of rotation. Anatomically an SPO is hinged at the PLL, a PSO is hinged at the ALL and a VCR is usually hinged along a variable pivot point posterior to the entire spinal column. The current software programs require the surgeon to make individual adjustments. There is also no real way to account for the elasticity of the PLL. We have software that merges the information from 5 lateral radiographs in 5 stages of flexion and extension. In flexion the length of the PLL is maximized whereas in extension the ALL is maximized. The cage dimensions would be inaccurate if the cage size were taken from these extremes. Usually the optimal cage height is reflected in the neutral zone, or Dubousset’s cone of balance in the middle range of maximum flexion and extension. In our software program the surgeon can move the vertebra of the motion segment into the optimal position. If the PLL is within the physiologic range the ligament is green, if it is stretched up to 5% of its maximum length it turns yellow, and if it is overstretched beyond 5%, the simulation turns the ligament red. A red ligament means that if the surgeon chooses this position then the ligament should be released.
At the current time we have not found a way to merge the data from digital images and to extract the information from DEXA in correcting for the degree of osteoporosis in an aging spine. The best that surgeons tend to do is to simply to gear down the amount of correction and don’t attempt to achieve perfect sagittal balance parameters.
One advantage of the software navigation and planning programs is that there is a database of experience behind each program. For example Medicrea’s has a database of over 3000 cases. 15 So one can determine the feasibility of obtaining correction with a 30 degree TLIF, for example. The simulating technicians would say something like, we would be happy to dial this into your correction but thusfar in over 1000 procedures no other surgeon in our worldwide database has been able to accomplish this—you might want to think about trying 3 adjacent SPO osteotomies instead of one 30 degree correcting TLIF cage. In a similar vein the pre-planning simulating database accumulates surgeon-specific information. For example, if one particular surgeon usually accomplishes 20 degrees of correction with a 30 degree hyperlordotic cage then the simulation will reflect this track record. In our core radiographic laboratory our technicians noticed that one surgeon invariably placed his L4-L5 ALIF cages too far toward the left side of the disk space. This was because his access surgeon could not adequately mobilize the vessels across the far side of the spine. Therefore a downsized version of the ALIF spacer might be appropriate.
Some investigators refer to this database accumulation of experience as “machine learning.” In addition the specifics of the different simulations can be compared to the literature. For example the simulator technician might say—“we would be happy to plan out a 40 degree osteotomy correction at L1 but this is associated with a higher chance of mesenteric artery obstruction compared to a PSO performed at L3 and furthermore there is a better reported chance of achieving correction within the range of improved HRQOL parameters (SVL < 5 mm, PI-LL < 10).”2,15
Limitations of this Study
This was a relatively small sample size, N = 33. Twenty-eight of thirty-three cases had a type of expandable cage, where the porous ingrowth endplates are compressed against the vertebral endplates with a torque-applying expansion mechanism. Technically although the dimensions of the cage are patient-specific, the amount of expansion and pressure at the metal-bone interface should also be patient specific. One can maximize the end plate footprint but ideally one would also want to individualize the expansion pressure. At the current time each expandable cage utilizes a torque screwdriver which is calibrated by the manufacturer in a “one size fits all” type of calibration. The torque-out or maximum torque as the screwdriver turns is approximately two and one half revolutions corresponds to 1 mm of increased cage height. This means that with torque control, the cage expansion force is the same across the range of patient bone mineral densities regardless of the patient’s age and dimensions.
Another scientific limitation of this study is the lack of quantitation of bony ingrowth amount clinically. Our laboratory has performed more than 10 prospective randomized trials and/or animal models measuring ingrowth from implant surfaces, notably in cervical and lumbar disk replacement. We have histomorphometric studies of porous tantalum, porous titanium alloy, titanium calcium phosphate, titanium hydroxyapatite, PEEK, cobalt chrome, etc. In clinical trials we have measured the subsidence of stand-alone cages and disk replacements. In this study the sample size is too small and the amount of cage subsidence is too small to lend significant measurements. Particularly with 29 of the 33 cases being supplemented with posterior pedicle screw instrumentation and posterolateral fusion, there was no appreciable cage subsidence, at least not enough to reliably measure on post-operative radiographs.
Summary
In this retrospective study, 33 interbody spacers were digitally planned and navigated successfully into position. Simulation and navigation proved clinically valuable in these challenging cases. The simulated preoperative plan overlayed the final post-operative radiograph and was a near-perfect match in 20 of 21 patients (95.2%). The encouraging aspect of the operative simulation was the ability to merge different types of digital imaging information. The surgeon could then incorporate this information at surgery to have less intra-operative improvisation and more precise cage line-to-line fit, despite variable anterior column defects.
Footnotes
Authors’ Note
The views expressed in the article are our own and not an official position of the institution.
Declaration of Conflicting Interests
The author(s) declared the following potential conflicts of interest with respect to the research, authorship, and/or publication of this article: Dr McAfee receives royalties from Globus Medical, Medtronic—Medicrea, and Nuvasive. He is a Board Member of Globus Medical. He receives payment for lectures and travel accommodations from DePuy, Medtronic, Nuvasive, and Globus Medical. He receives payment for patents and royalties from DePuy, Medtronic—Medicrea, and Globus Medical. Dr. McAfee is on the editorial board of Journal of Spinal Disorders and Techniques and Spine. Dr. Cunningham receives research support from AO Spine North America Spine Fellowship support, Globus Medical research support. The authors have no further potential conflicts of interest to disclose.
Funding
The author(s) received no financial support for the research, authorship, and/or publication of this article.