
Abstract
Study Design:
Prospective multicenter cohort study.
Objective:
To investigate (1) the discriminative ability and cutoff estimates for success 12 months after surgery for lumbar disc herniation on the Oswestry Disability Index (ODI) raw score compared with a change and a percentage change score and (2) to what extent these clinical outcomes depend on the baseline disability.
Methods:
A total of 6840 patients operated for lumbar disc herniation from the Norwegian Registry for Spine Surgery (NORspine) were included. In receiver operating characteristic (ROC) curve analyses, a global perceived effect (GPE) scale (1-7) was used an external anchor. Success was defined as categories 1-2, “completely recovered” and “much better.” Cutoffs for success for subgroups with different preoperative disability were also estimated.
Results:
When defining success after surgery for lumbar disc herniation, the accuracy (sensitivity, specificity, area under the curve, 95% CI) for the ODI raw score (0.83, 0.87, 0.930, 0.924-0.937) was comparable to the ODI percentage change score (0.85, 0.85, 0.925, 0.918-0.931), and higher than the ODI change score (0.79, 0.73, 0.838, 0.830-0.852). The cutoff for success was highly dependent on the amount of baseline disability (low-high), with cutoffs ranging from 13 to 28 for the ODI raw score and 39% to 66% for ODI percentage change. The ODI change score (points) was not as accurate.
Conclusion:
The 12-month ODI raw score, like the ODI percentage change score, can define a successful outcome with excellent accuracy. Adjustment for the baseline ODI score should be performed when comparing outcomes across groups, and one should consider using cutoffs according to preoperative disability (low, medium, high ODI scores).
Introduction
In Norway, operative treatment of lumbar disc herniation is the most frequently performed spine surgery procedure in patients younger than 50 years. 1 The indication for surgery is most often relative, that is, reducing pain-related disability. 2 To compare treatment effects across interventions and institutions, changes in patient-reported outcome measures (PROMs) are frequently used, but their interpretation is complex. Previous studies have used score changes of the Oswestry Disability Index (ODI) to calculate clinically meaningful improvements, such as cutoffs for a “successful outcome.” 3 -6 However, the amount of change needed for success is highly dependent on the baseline scores of the PROMs. 7
Studies from other medical fields, such as rheumatology, have used a Patient Acceptable Symptom State (PASS) 8 -10 in order to define a cutoff for a successful outcome on a PROM. The PASS could be viewed as a separate entity to the underlying change score. 8,9,11 We have previously defined cutoffs for success based on PROM change scores for patients operated for lumbar disc herniation, by either open- or micro-discectomy. 6 In a recent study, we found cutoffs on the 12-month ODI raw score that had the highest accuracy for identifying cases that could be classified as failed and worsened after lumbar disc surgery, 11 indicating that patients could be more focused on their current disability than on health changes when reporting clinical outcomes.
In the present study, we sought (1) to define the discriminative ability and cutoff estimates of success for a 12-month ODI raw score (current disability), an ODI change and ODI percentage change score and (2) to investigate if these clinical outcomes depend on the baseline disability, that is, the preoperative ODI score. We defined success by the patient's ratings of a substantial effect of surgery (Global Perceived Effect scale, GPE), that is, when the patient is feeling “completely recovered” (GPE = 1), or “much better” (GPE = 2) 12 months after the operation. Such information would aid in the classification and understanding and of successful outcome, facilitating reporting and comparisons of treatment results.
Materials and Methods
Patient Population and Data Collection
A total of 6840 patients operated for lumbar disc herniation at 38 different surgical units between January 1, 2007 and February 28, 2014 were followed for 12 months, according to the standard protocol of the Norwegian registry for spine surgery (NORspine). The NORspine is a comprehensive clinical registry for quality control and research. During the study period, the NORspine comprised 95% (38 of 40) Norwegian public and private centers performing lumbar disc surgery. Completeness, the proportion of patients operated on for lumbar disc herniation reported to the NORspine, was 65%. 1 The registry excluded patients unable to consent, children aged <16 years, patients with documented drug abuse or severe psychiatric disorders, and patients with traumatic, infectious or malignant conditions in the spine. In this study, we included all elective and emergency cases operated for lumbar disc herniation. Fusion procedures and/or procedures including laminectomy were not included.
Informed consent was obtained from all patients and participation was neither mandatory, nor required to gain access to healthcare. The registry protocol has been approved by the Data Inspectorate of Norway. The study protocol had been submitted to the regional ethical committee for medical research which categorized it as a clinical audit study, not in need of their formal approval. 12
At admission for surgery, the patients completed a baseline questionnaire on demographics, lifestyle issues and PROMs (Figures 10x-13x, appendix). During the hospital stay, the surgeon recorded data concerning diagnosis, treatment, and comorbidity on a standard registration form (Figures 14x-15x, appendix). Twelve months after surgery a questionnaire was distributed by regular post, completed at home by the patients, and returned in prestamped envelopes to the central registry unit without involvement of the treating hospitals. One reminder with a new copy of the questionnaire was sent to those who did not respond.
Patient-Reported Outcome Measures
This study is based on the cohort used in a previous study by the authors. 11 The ODI version 2.1a was used to assess pain-related disability. It contains 10 questions on limitations of activities of daily living. Each item is rated 0 to 5 and then transferred into a percentage score ranging from 0 (none) to 100 (maximum pain-related disability). 13
The patient-rated benefit of the operation was rated on the GPE at follow-up. 11,14 The response alternatives were as follows: 1 = “completely recovered,” 2 = “much better,” 3 = “somewhat better,” 4 = “no change,” 5 = “somewhat worse,” 6 = “much worse,” and 7 = “worse than ever.”
Statistics
All statistical analyses were performed with the Statistical Package for the Social Sciences (SPSS, IBM Version 23.0).
We excluded all patients who did not respond at 12 months. This strategy was based on a study from the NORspine on a comparable patient population, and a recent and similar Danish registry study, both indicating that patients lost to follow-up could be handled as missing at random in the analyses. 15,16
We assessed the mean 12-month ODI raw score, as well as the mean ODI percentage change score and the mean ODI change score after 12 months against the GPE by one-way analyses of variance (ANOVA) with post hoc analysis (Tukey, α = .05) and by analyses of covariance (ANCOVA, generalized linear model) with adjustment for baseline scores. Correlation analyses between the different ODI tools and the GPE were done by Spearman rank correlation.
Cutoffs for all scores were estimated by receiver operating characteristic (ROC) curves. We calculated cutoffs for a substantial improvement from baseline (GPE 1-2 vs 3-7), termed success.
To determine the cutoff with the highest sensitivity and specificity, the closest point to the upper left corner of the ROC curve was calculated from the coordinates of the curve. The area under the curve (AUC) determined how well the instruments differentiated between the outcome groups. An AUC value of >0.70 was considered acceptable, >0.80 good, and >0.9 excellent. The overall accuracy for each cutoff was calculated with a confusion matrix. 17
To be able to study the impact of low and high baseline disability on the outcome cutoffs (success criteria), we split the patient sample based on the baseline ODI score into low (<25th percentile), medium (25th-75th percentile) and high disability (>75th percentile) and calculated cutoffs for the 12-months ODI raw score, ODI percentage change and ODI change after 12 months, for each of these percentiles.
Floor and ceiling effects were assessed by calculating the frequency of the highest and lowest possible scores at baseline. If 15% of patients had a minimal or maximal score value at baseline, these were considered as floor or ceiling effects. 18,19
Results
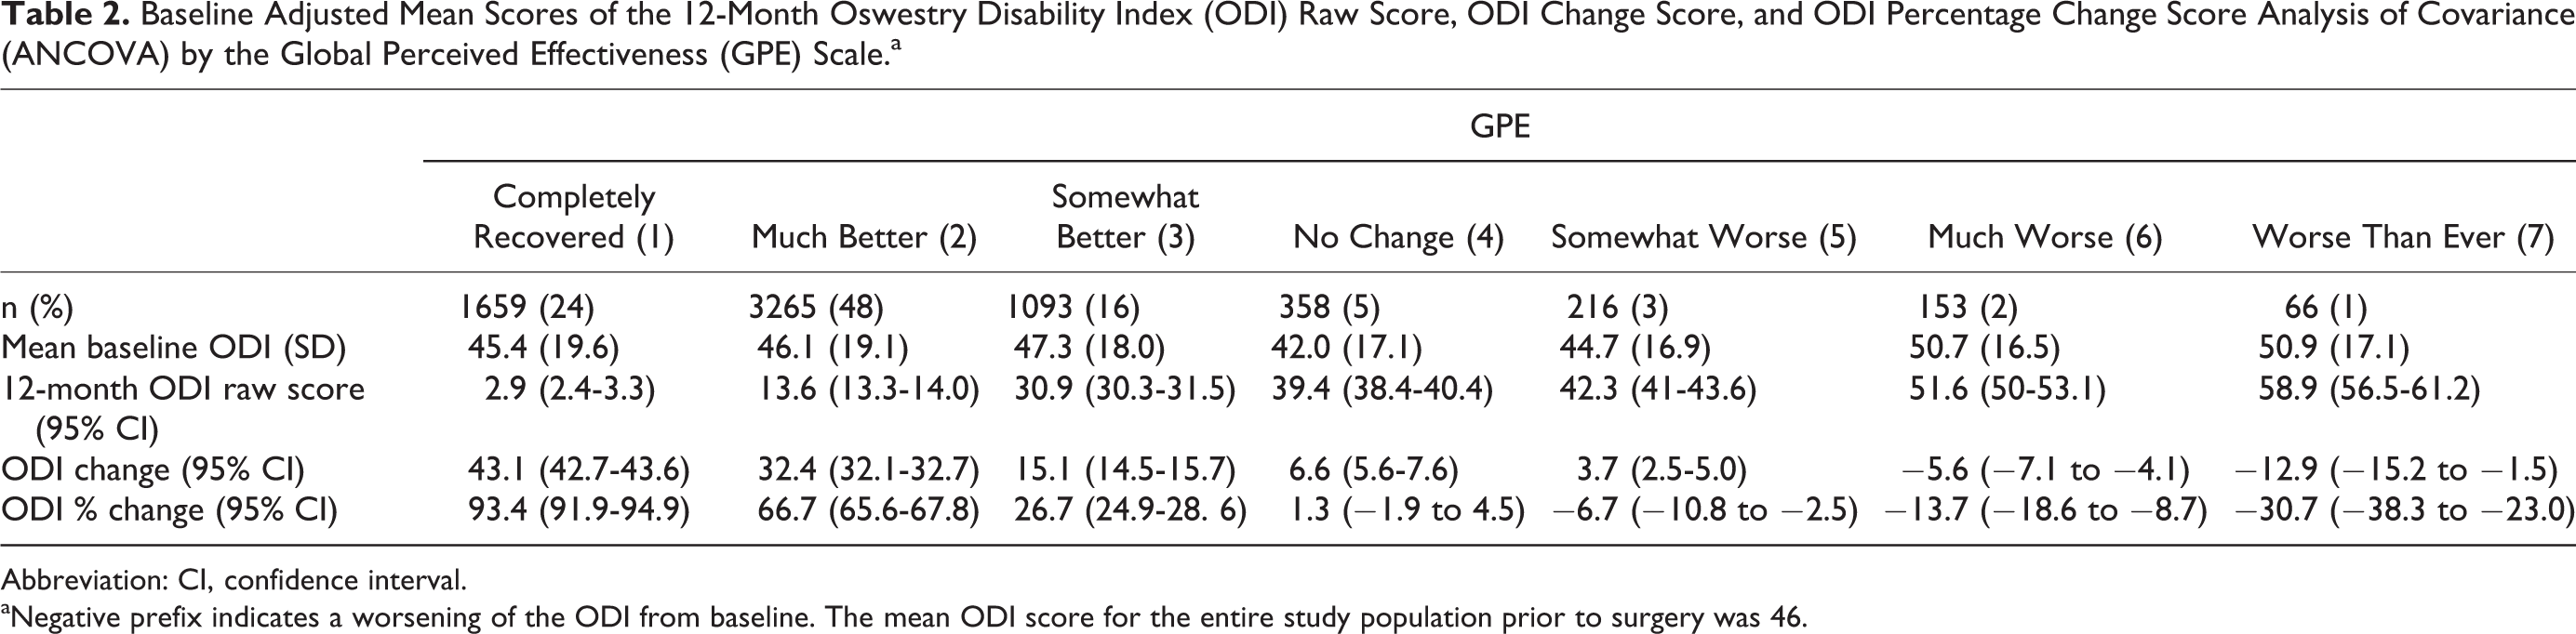
Baseline characteristics of both respondents and nonrespondents of this patient population have been shown and discussed in a previous study. 11 Characteristics of the study population are listed in Table 1. Follow-up data after 12 months were available for 6840 (69%) out of 9930 of patients. The sample was divided into low ODI baseline (n = 1617), medium ODI baseline (n = 3718), and high ODI baseline (n = 1505). Only 13 data points (0.2%) were missing for the baseline ODI. At 12-month follow-up, 40 values (0.6%) were missing for the GPE and 11 (0.2%) on the ODI. As shown in a previous article, the lost to follow-up group contained more smokers, fewer with higher education, more sickness benefits recipients, more previously operated patients and fewer cases operated for paresis. 11 The Spearman correlation coefficients were 0.6 for the 12-month ODI change (P < .001), 0.8 for the 12-month ODI percentage change (P < .001), and 0.8 for the 12-month ODI raw score (P < .001). ANOVA with post hoc analysis indicated that the 12-month ODI raw scores of all estimates were significantly different between GPE categories. For each outcome, baseline adjusted mean ODI scores (ANCOVA), are shown in Table 2.
Baseline Characteristics of the Study Population.
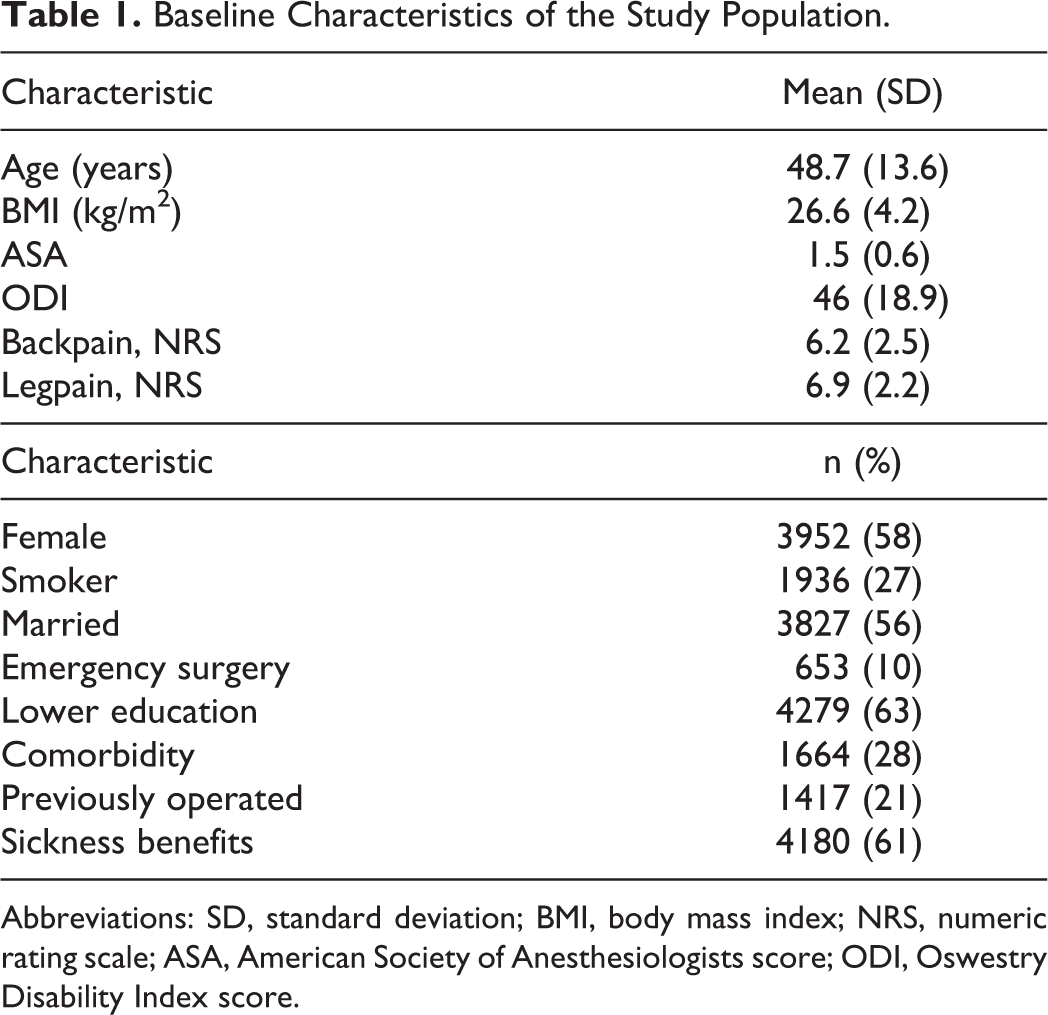
Abbreviations: SD, standard deviation; BMI, body mass index; NRS, numeric rating scale; ASA, American Society of Anesthesiologists score; ODI, Oswestry Disability Index score.
Baseline Adjusted Mean Scores of the 12-Month Oswestry Disability Index (ODI) Raw Score, ODI Change Score, and ODI Percentage Change Score Analysis of Covariance (ANCOVA) by the Global Perceived Effectiveness (GPE) Scale.a
Abbreviation: CI, confidence interval.
aNegative prefix indicates a worsening of the ODI from baseline. The mean ODI score for the entire study population prior to surgery was 46.
Cutoffs for Success
The discriminative ability for success was significantly higher for the ODI percentage change and the 12-month ODI raw score in comparison with the ODI change score (Table 3). In the subgroup analyses, we found that the cutoffs for success were dependent on the baseline ODI score. Patients with a low baseline ODI (<25th percentile, ODI score <32) had a cutoff on the 12-month ODI raw score (ODI % change) of 13 points (39%), those with medium baseline ODI (25th-75th percentile, ODI score 32-60) a cutoff of 21 points (55%), and those with high baseline ODI (>75th percentile, ODI score >60) a cutoff of 28 points (66%). The cutoffs for all ODI scores for all the different ODI baseline groups are listed in Table 4. Figure 4 shows that for the subgroups, the change cutoff (downward arrow) reaches the ODI raw score cutoff for success (horizontal line).
Cutoff for the 12-Month Oswestry Disability Index (ODI) Raw Score, the 12-Month ODI Change Score, and the 12-Month ODI Percentage Change Score, Classifying Success in the Whole Study Population (Receiver Operating Curve [ROC] Analyses) and Accuracy (Confusion Matrix).
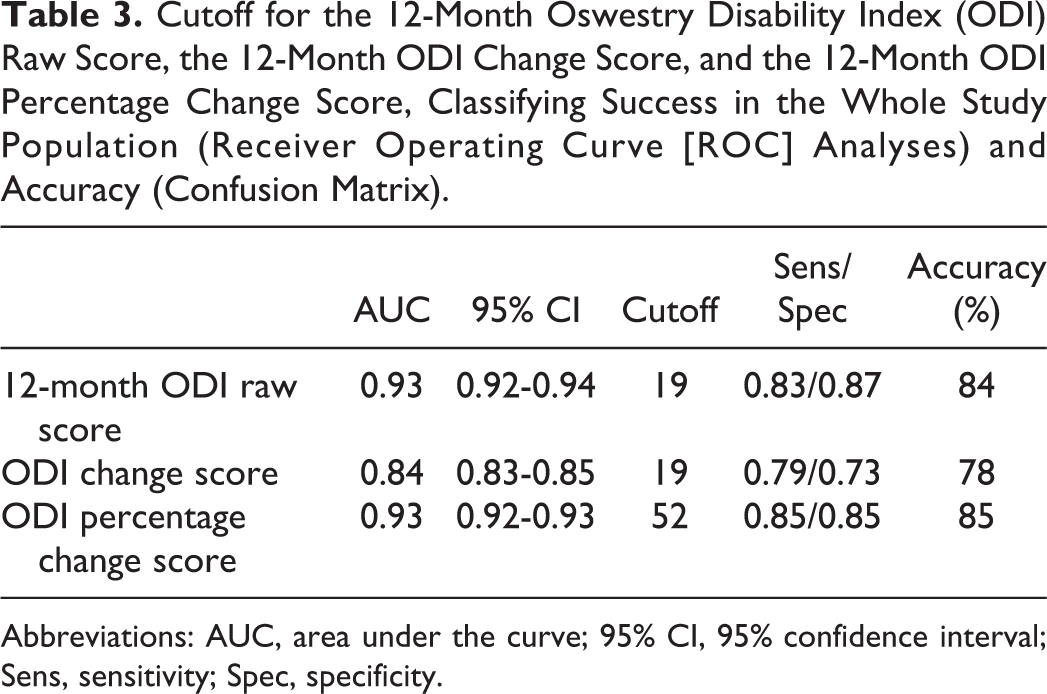
Abbreviations: AUC, area under the curve; 95% CI, 95% confidence interval; Sens, sensitivity; Spec, specificity.
Cutoffs for the 12-Month Oswestry Disability Index (ODI) Raw Score, the 12-Month ODI Change Score, and the 12-Month ODI Percentage Change Score When Classifying Success in Each of the 3 ODI Baseline Subgroups.a
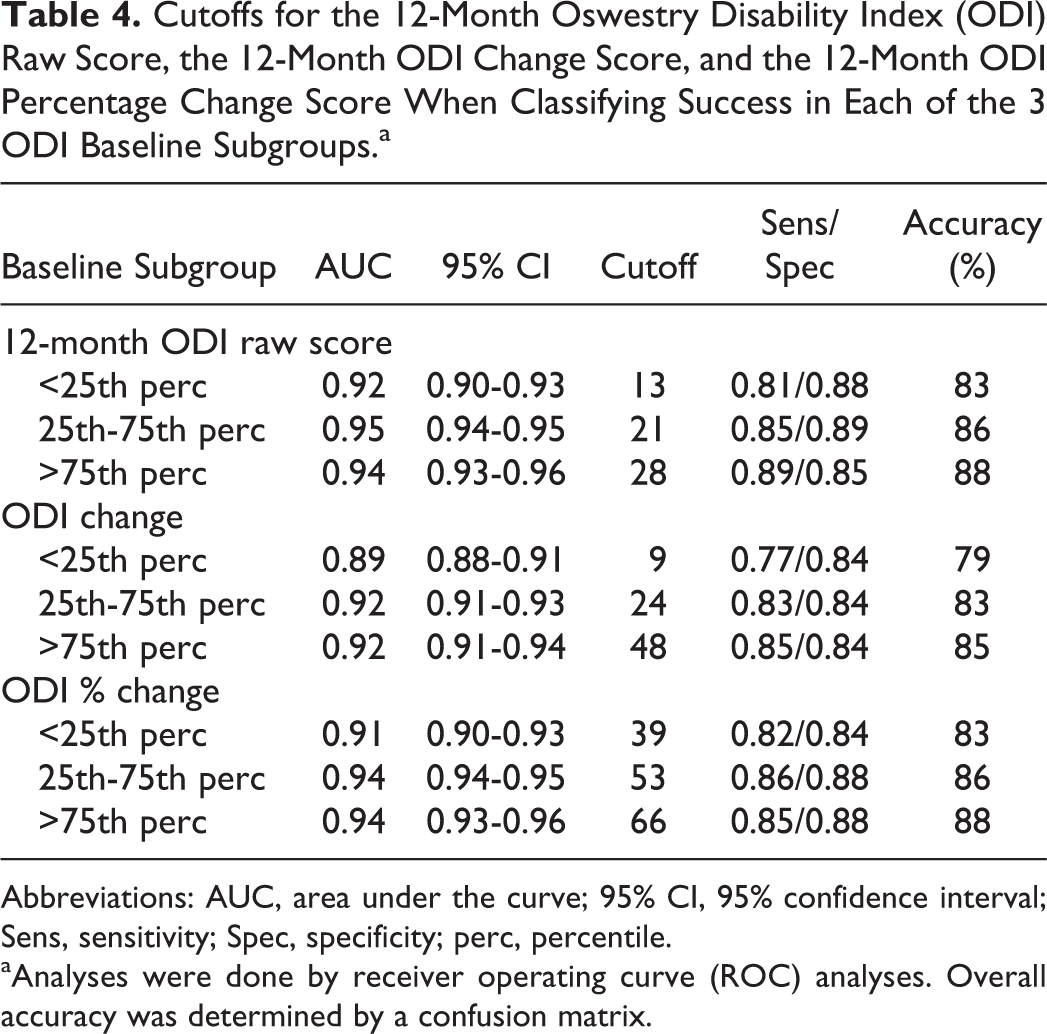
Abbreviations: AUC, area under the curve; 95% CI, 95% confidence interval; Sens, sensitivity; Spec, specificity; perc, percentile.
aAnalyses were done by receiver operating curve (ROC) analyses. Overall accuracy was determined by a confusion matrix.
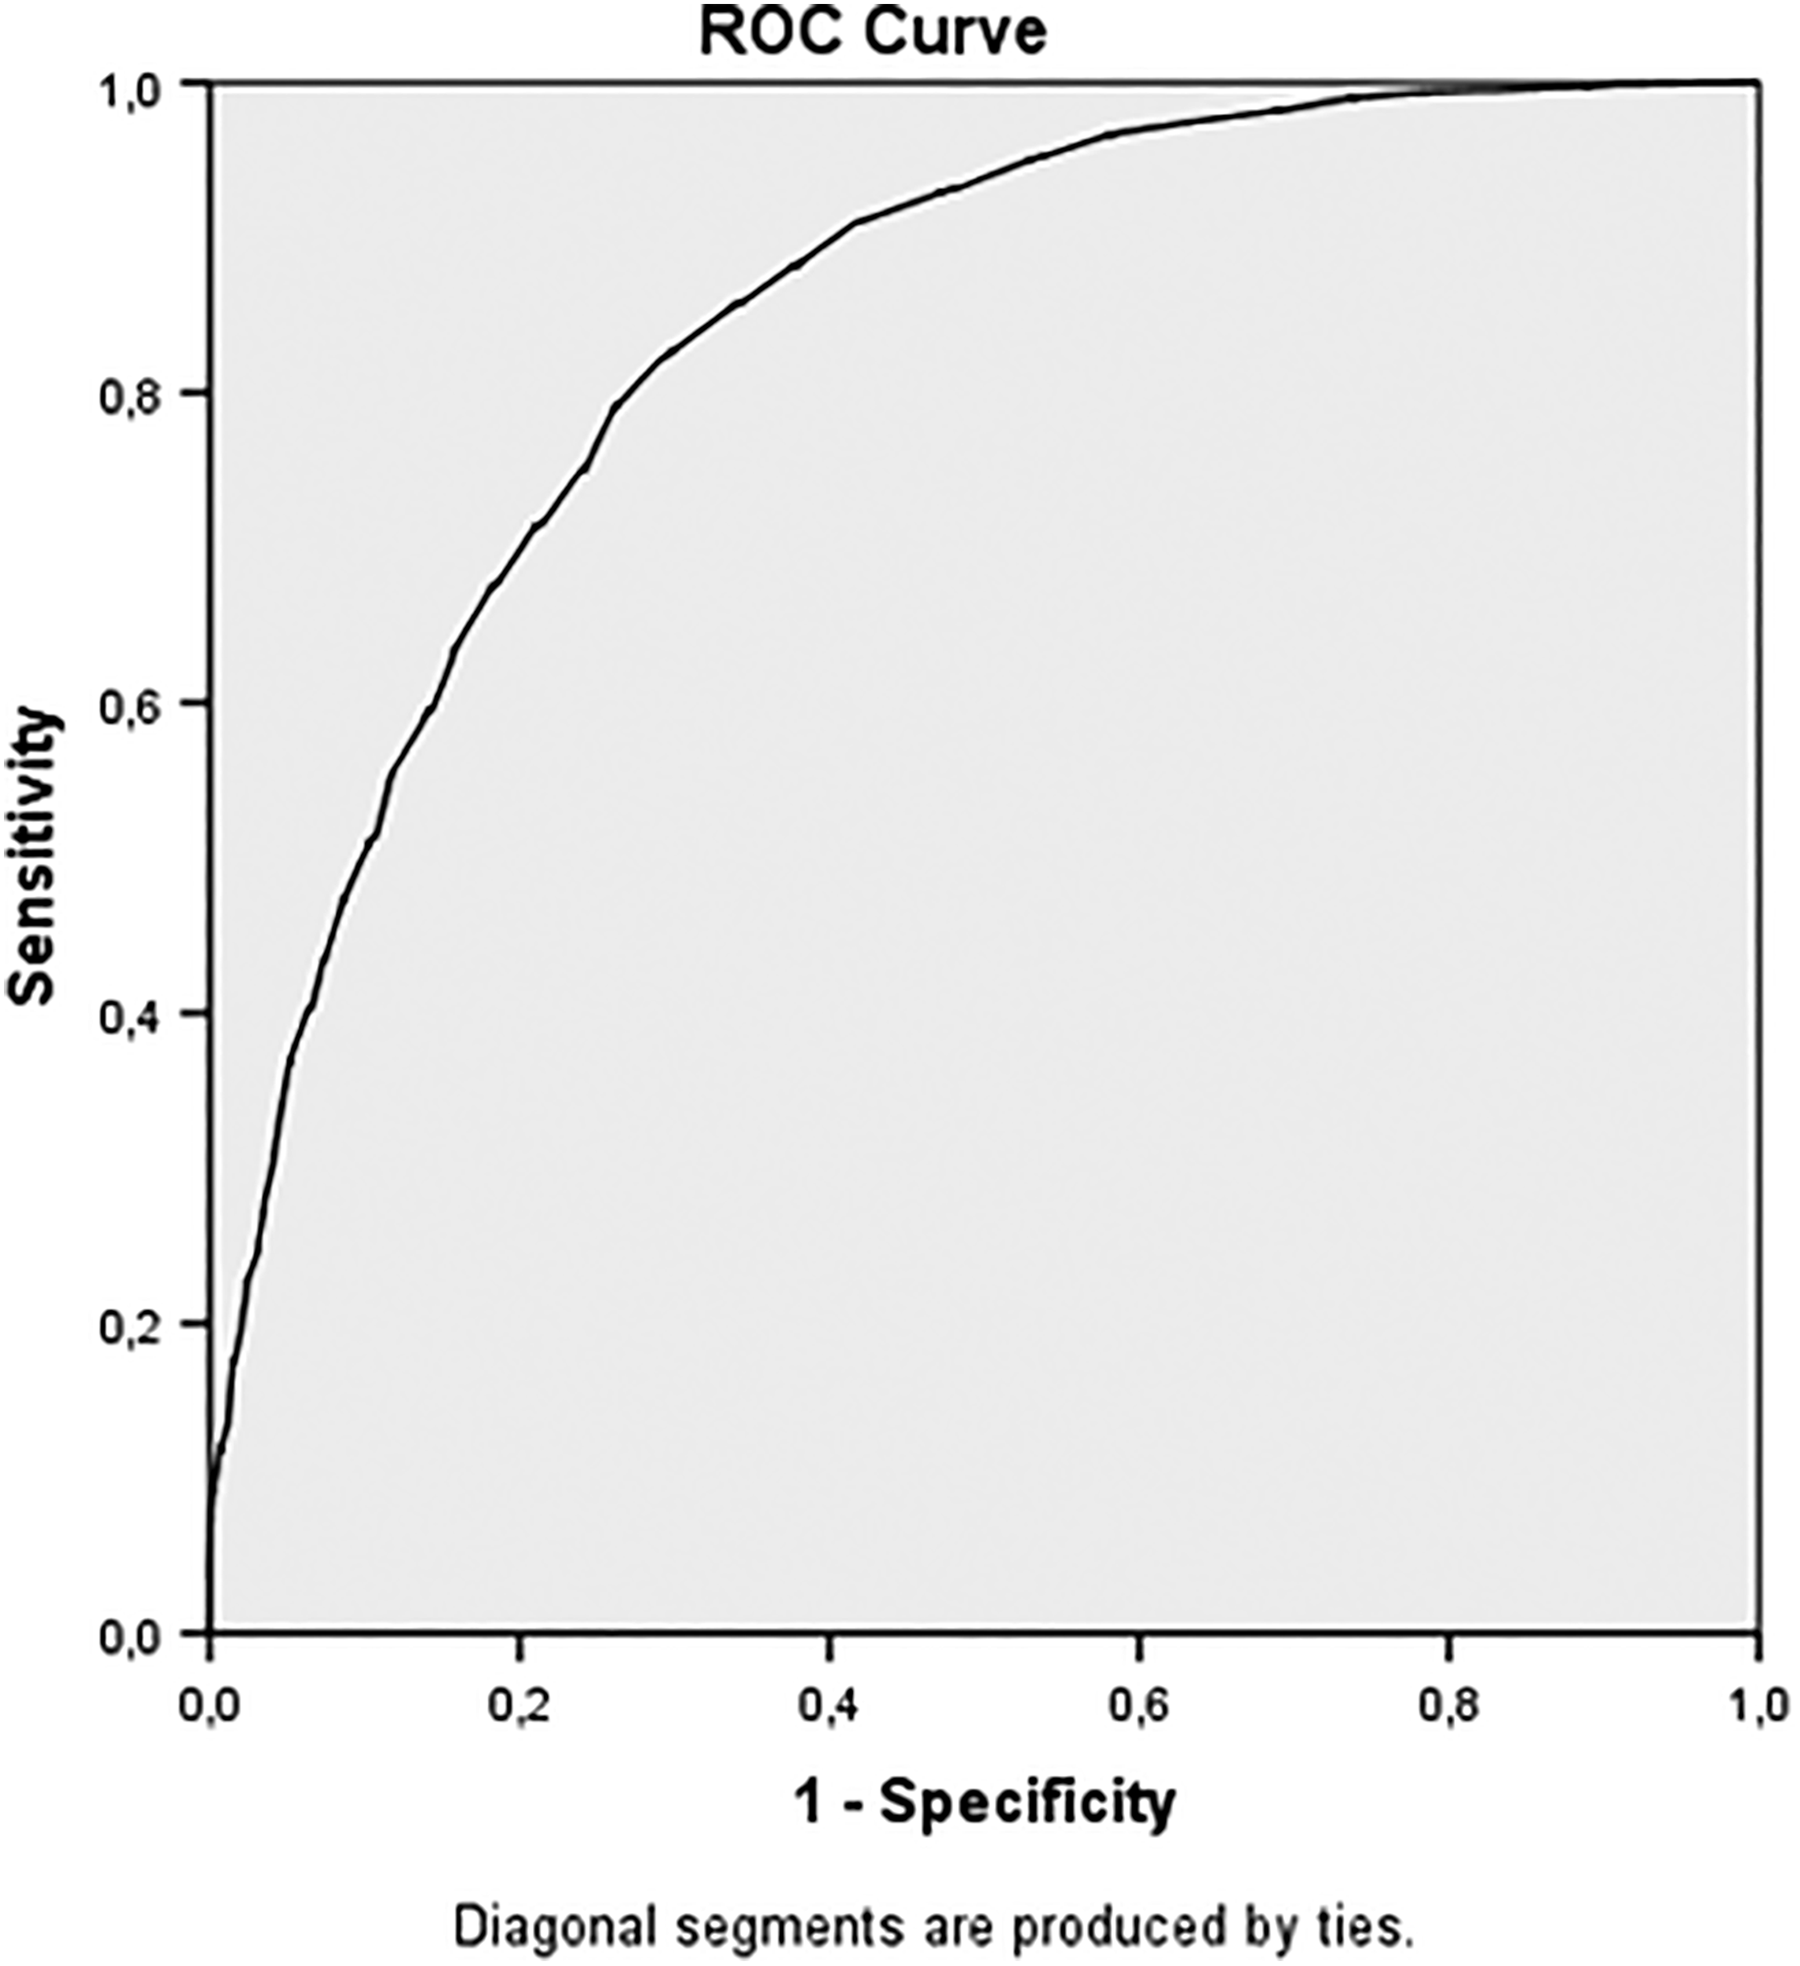
For the entire population, the cutoffs were 19 (ODI raw score), 19 (ODI change score), and 52% (ODI percentage change score) (Table 3). AUCs were high for all curves, ranging from 0.84 (ODI change score) to 0.93 (ODI raw score, ODI percentage score) (Figures 1 –3).

Receiver operating curve for the 12-month Oswestry Disability Index (ODI) score cutoff for “success”. AUC (area under the curve) = 0.93 (0.92-0.94).
Receiver operating curve for the 12-month Oswestry Disability Index (ODI) change cutoff for “success”. AUC (area under the curve) = 0.84 (0.83-0.85).
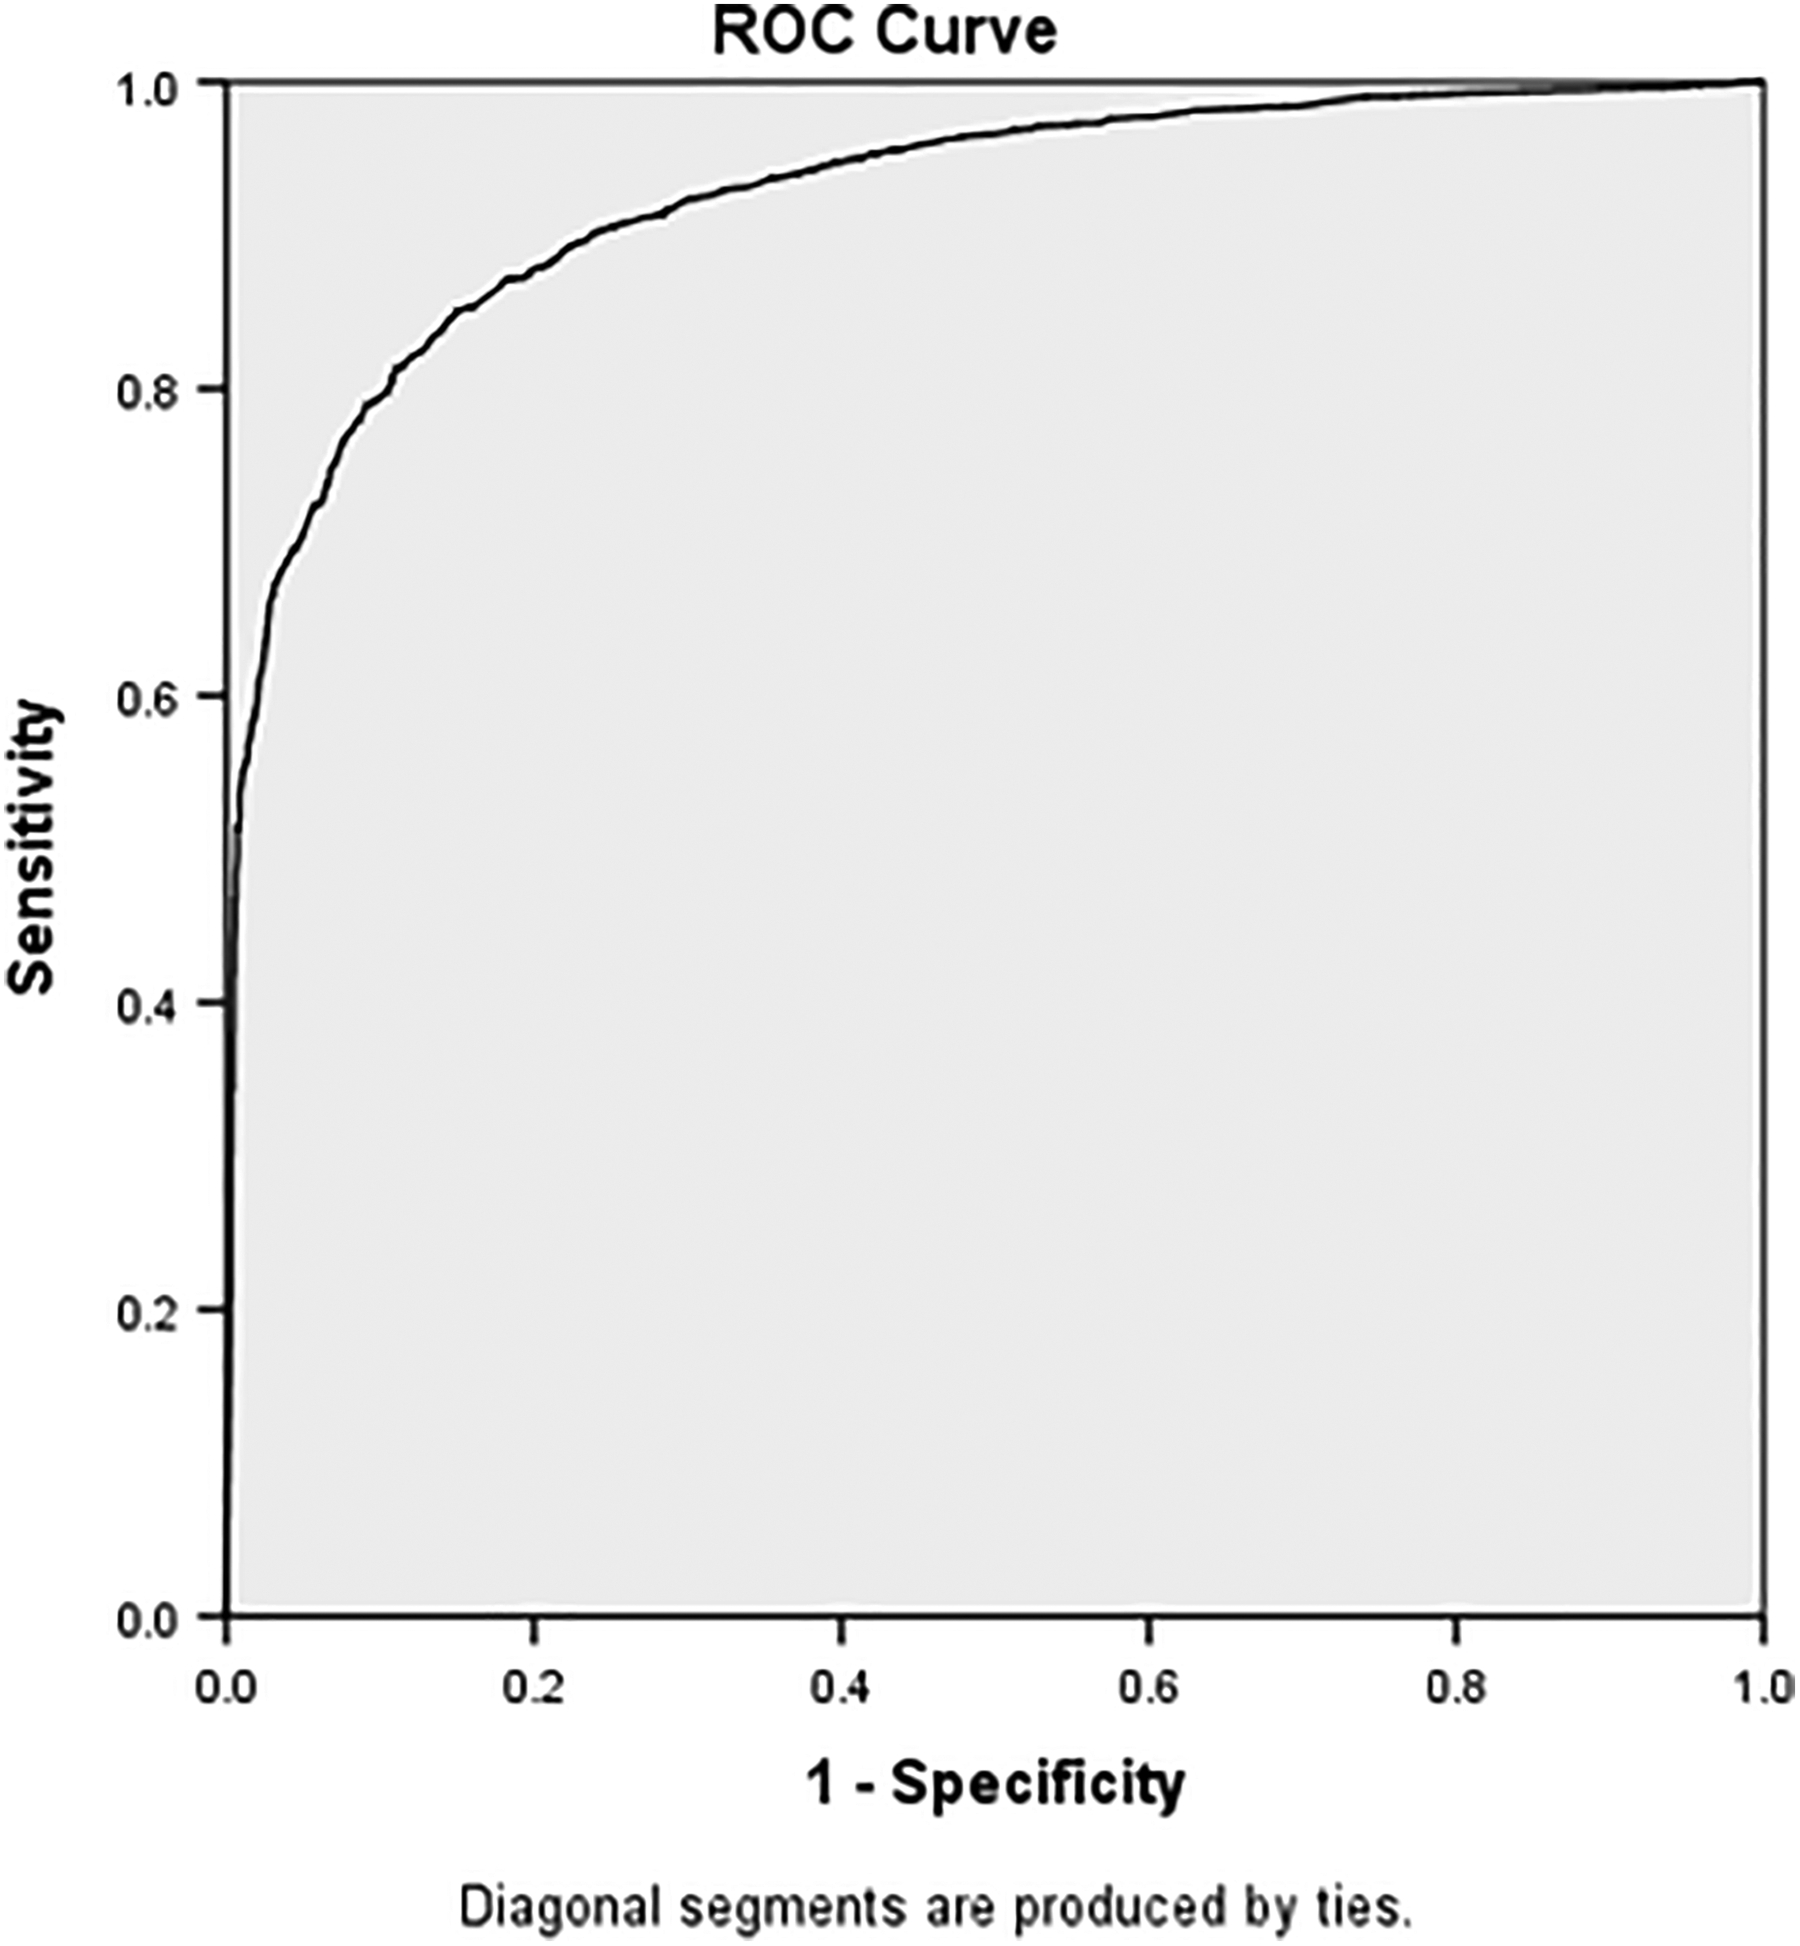
Receiver operating curve for the 12-month Oswestry Disability Index (ODI) percentage change cutoff for “success”. AUC (area under the curve) = 0.93 (0.92-0.93).
Proportion of Success at 12 Months
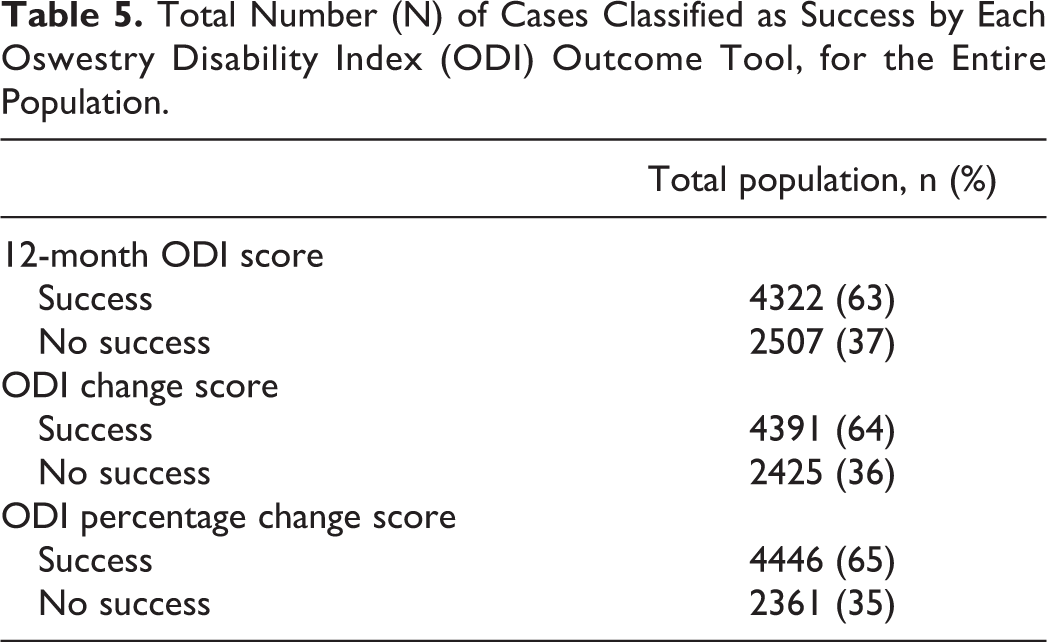
For the entire population, the ODI percentage change score and the ODI raw scores corresponded better to a successful outcome (groups 1 and 2 on the GPE-scale) than the ODI change score (Table 3). Table 5 shows the proportion of cases classified as success 12 months after surgery. Table 1x (appendix) shows these proportions using separate cutoffs based on the different baseline ODI levels (percentiles). The ODI percentage change classified the highest proportions of success for the whole sample.
Total Number (N) of Cases Classified as Success by Each Oswestry Disability Index (ODI) Outcome Tool, for the Entire Population.
Floor and Ceiling Effects
No floor or ceiling effects were detected.
Discussion
We found that success after surgery for lumbar disc herniation could as accurately be defined by the 12-month ODI raw score, as by the ODI percentage change score, and more accurately than by the ODI change scores from baseline. In a previous study we also found that the 12-month ODI raw score was more robust than the change scores for defining failure and worsening. 11 In the subgroup analyses we found that the cutoffs for success were dependent on the baseline ODI score. For those with low baseline disability the amount of improvement from baseline was considerably lower than for those with high baseline disability (Table 4). This dependency on the baseline score illustrates that patients perceive their postoperative improvements based on the amount of disability they experienced prior to surgery. Thus, in a patient sample with a low mean ODI other criteria for a positive outcome need to be applied, than in a patient sample with medium or high baseline ODI scores. This also implies that the previous recommendation to use a 30% change score cutoff for minimal clinical change 3 must be reconsidered for patients with medium and high baseline ODI scores. Our results confirm the importance of adjusting for baseline scores when comparing success rates between groups, for example, hospitals and surgical interventions. 11,20 When evaluating outcomes for individual patients or groups, one should consider using cutoffs according to baseline disability (low, medium, or high ODI scores). Moreover, statistical studies aimed at predicting outcome after surgery for lumbar disc herniation should be modeled with adjustment for preoperative ODI score, for example, by stratification.
The ODI change score had the lowest accuracy for defining success, especially among patients with high and low baseline disability. Therefore, we only recommend using the 12-month ODI raw score and the ODI percentage change score cutoffs.
Interestingly, the success rates among patients with low and high baseline scores were the same. This indicates that patients with low baseline disability may have higher demands for physical performance, and they may be more sensitive to smaller improvements which they would consider meaningful compared to those with high baseline disability. 21 Prior to surgery, these issues should be discussed with the patient. Differences in symptom tolerance before and after the operation may also reflect variation in patient expectations and coping strategies.
Studies in rheumatology suggest that a treatment needs to reduce symptom intensity below a certain threshold to be perceived as successful by the patient. This threshold has been termed a “patient acceptable symptom state” (PASS). 8,9,22 As illustrated in Figure 4, it does not matter if a patient experiences, for instance, a 30% or 50% improvement of the baseline score, as long as he or she achieves the cutoff for the 12-month ODI raw score. Moreover, for the study population as a whole, the 12-month ODI raw score cutoff for success (≤19) corresponds to what van Hooff et al 23 defined a cutoff for a patient acceptable symptom state (PASS = ODI ≤ 22 at follow-up).
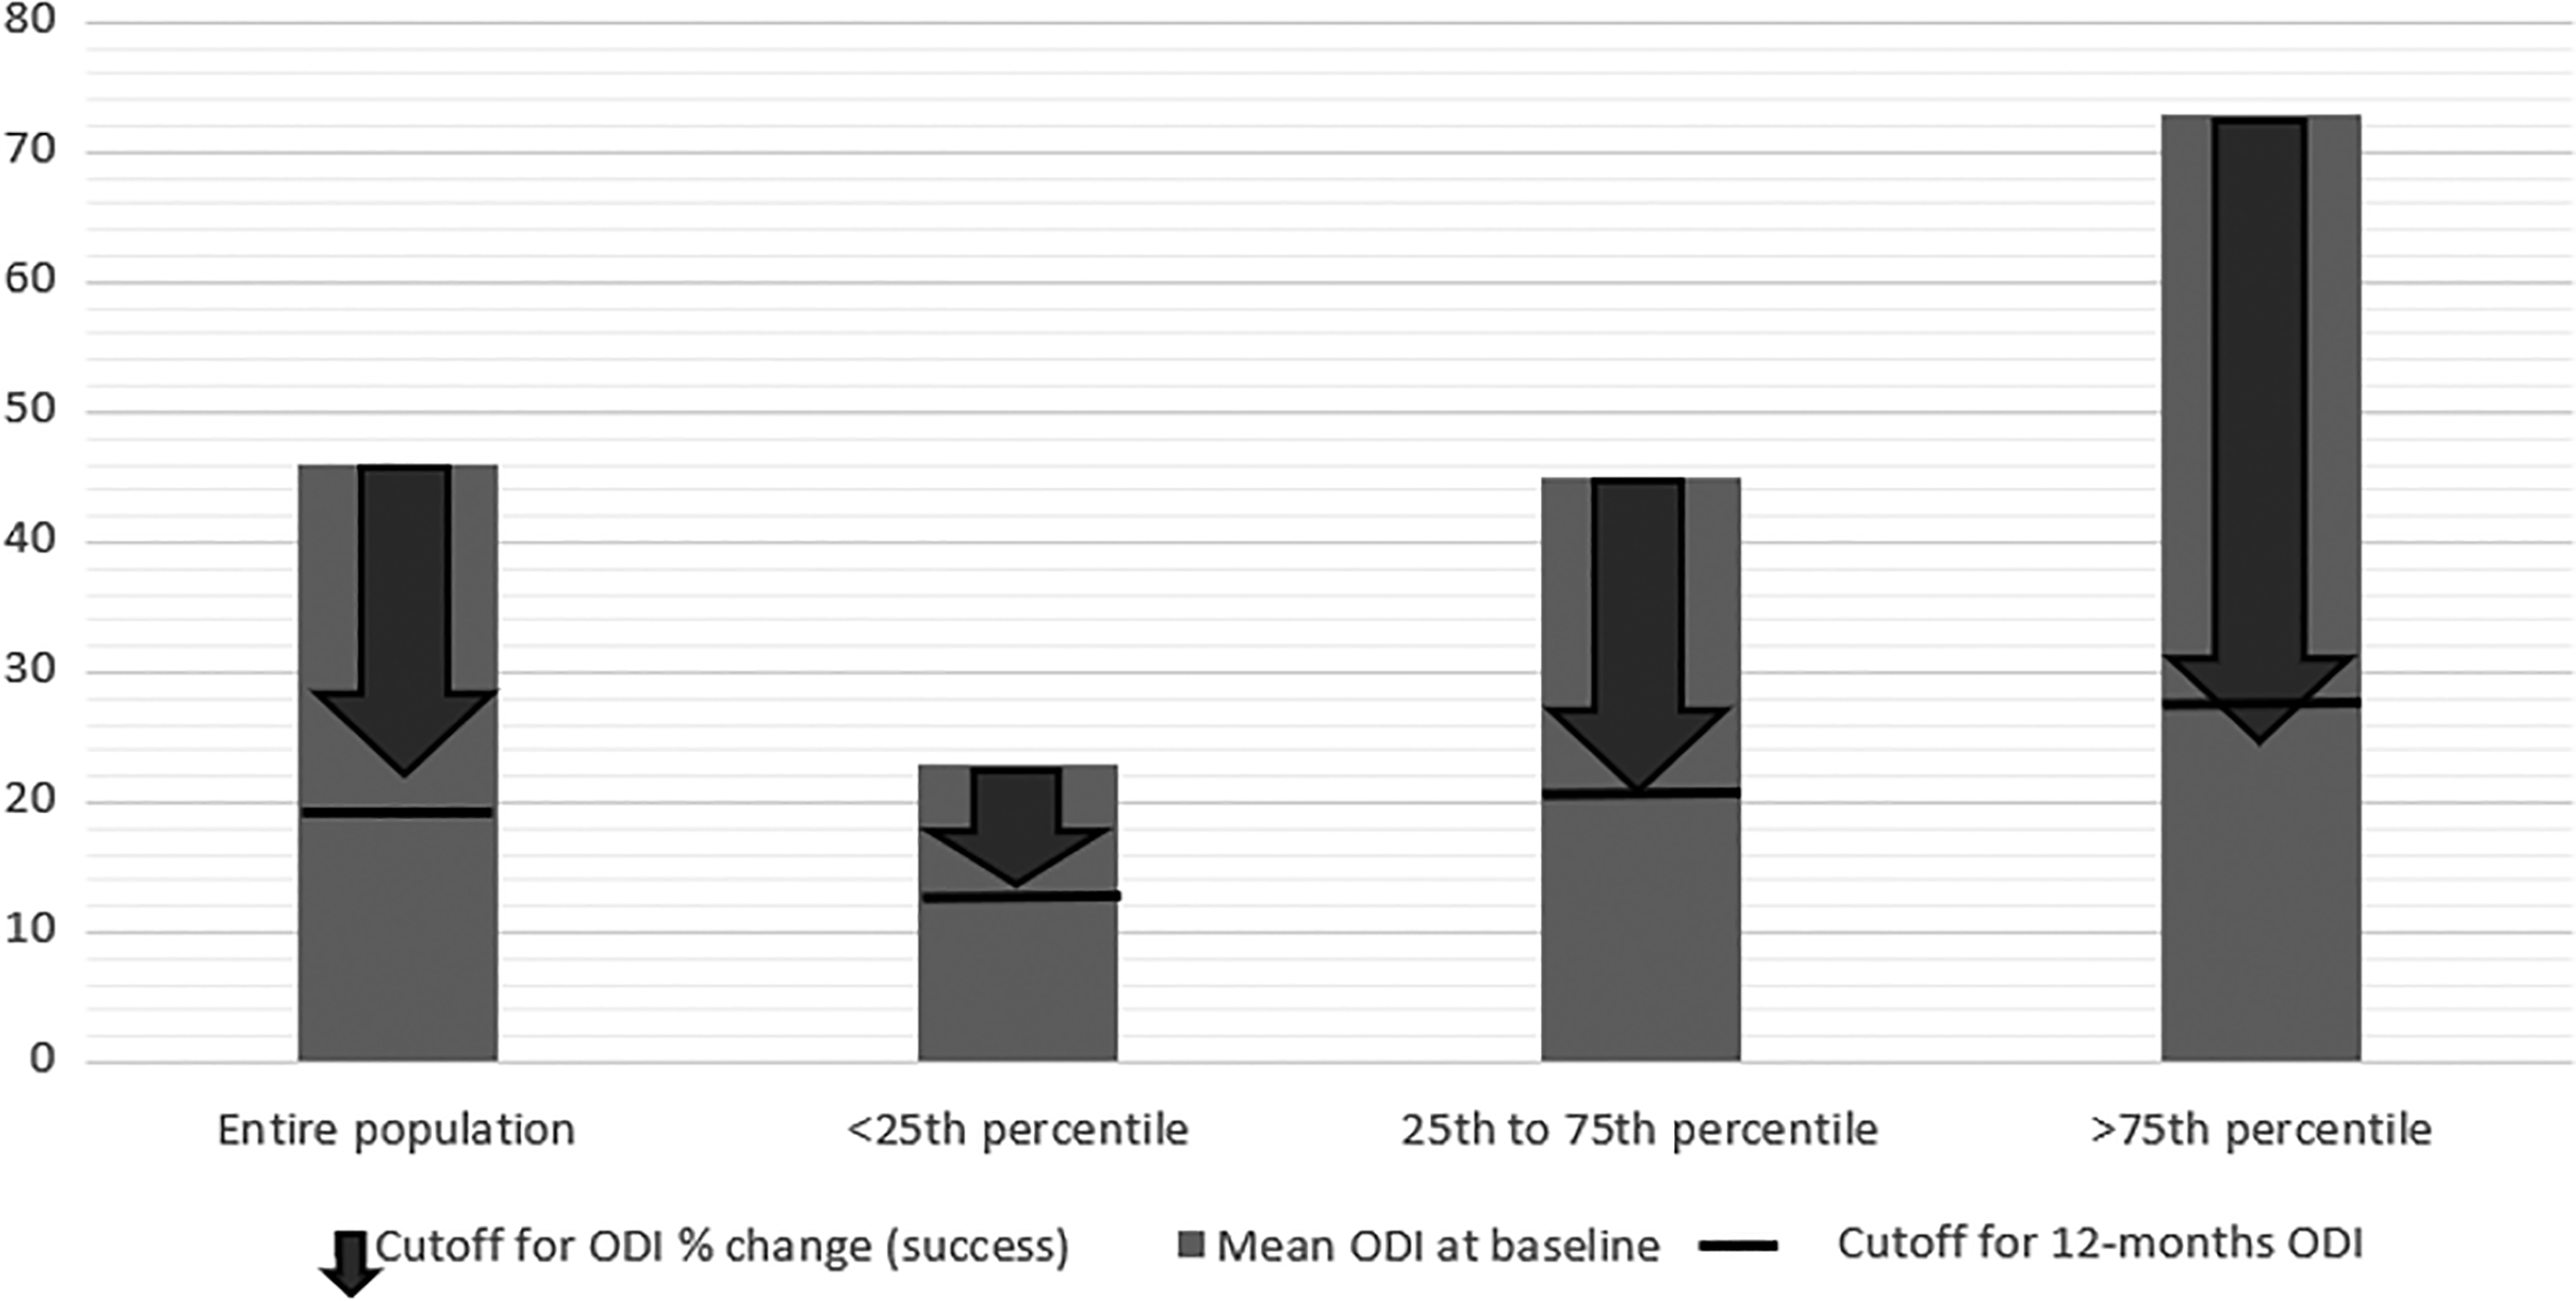
Mean baseline Oswestry Disability Index (ODI) (bar) with the 12-month ODI percentage change cutoff for success (arrow) and the 12-month ODI score cutoff for success (line).
Methodological Challenges
By collecting data from “real-world” clinical practice, studies from clinical registries not only have advantages such as large sample sizes and high external validity but also limitations such as lower follow-up rates compared with closely monitored clinical trials. Still, there is increasing evidence in the literature that observational studies conducted according to the STROBE check list report corresponding results similar to those found in randomized controlled trials. 24
Loss to follow-up was 31%. In three previous studies from the Scandinavian spine registries (NORspine, SWEspine, and DANEspine), dropout cases (rates of 12%-38%) were traced and interviewed. These studies found the same differences in baseline characteristics that we found between patients who responded and those who did not, yet the same clinical outcomes at 1 and 2 years of follow-up. 15,16,25 Thus, we do not expect that loss to follow-up would bias our success rate estimates. Furthermore, the aim of the study was not a clinical effectiveness evaluation, but rather to define cutoffs for success over the wide range of different outcomes found in this large cohort. Generalizability of our findings beyond the Norwegian population is supported by previous comparative studies in Scandinavian countries and the United States, who report conceding results on baseline data and clinical outcomes (effect sizes). 26 -28
Using the GPE as an external anchor has been criticized since recall bias may exist. Moreover, the patients tend to be more focused on their current health state than health change when responding on a GPE scale, indicating a weakness of its construct validity. 11,29 The ideal anchor should objectively measure the patient’s status before and after surgery with high reliability and validity. It should be easy to use, and universally applicable in different clinical settings. However, to the best of our knowledge no such anchor exists. In the search for such a tool, other variables have been evaluated by different research groups, such as return to work, use of painkillers, or surgeon-reported outcome. However, such measures also have limitations, namely, bias due to selection of certain subgroups, and subjective information based on surgeon’s assessment of the clinical outcome. 30 -33 Acknowledging these limitations, both the FDA (Food and Drug Administration) and the IMMPACT consensus group recommend a 7-point Likert-type scale, like the GPE, to be used as an external anchor. 34,35
Conclusion
The ODI raw score can be used to define a successful outcome 12 months after surgery for lumbar disc herniation with high accuracy, similar that of the ODI percentage change. The ODI change score in points was not as accurate. Since these cutoffs are point estimates and vary depending on the baseline disability, adjustment for the baseline ODI should be performed when comparing success rates between hospitals or interventions. We recommend using ODI raw score or ODI percentage change (value in parentheses) cutoffs for success, according to their level of baseline disability, low= 13 points (39%), medium= 21 points (53%), or high= 28 points (66%).
Supplemental Material
Supplemental Material, Supplementary_appendix_211118 - Can a Successful Outcome After Surgery for Lumbar Disc Herniation Be Defined by the Oswestry Disability Index Raw Score?
Supplemental Material, Supplementary_appendix_211118 for Can a Successful Outcome After Surgery for Lumbar Disc Herniation Be Defined by the Oswestry Disability Index Raw Score? by David A. T. Werner, Margreth Grotle, Sasha Gulati, Ivar M. Austevoll, Mattis A. Madsbu, Greger Lønne and Tore K. Solberg in Global Spine Journal
Footnotes
Declaration of Conflicting Interests
The author(s) declared no potential conflicts of interest with respect to the research, authorship, and/or publication of this article.
Funding
The author(s) disclosed receipt of the following financial support for the research, authorship, and/or publication of this article: This study was supported by The Norwegian Medical Association–Foundation for Quality Improvement and Patient Safety, and The Regional Health Authority of Northern Norway.
Supplemental Material
The supplemental material is available in the online version of the article.
References
Supplementary Material
Please find the following supplemental material available below.
For Open Access articles published under a Creative Commons License, all supplemental material carries the same license as the article it is associated with.
For non-Open Access articles published, all supplemental material carries a non-exclusive license, and permission requests for re-use of supplemental material or any part of supplemental material shall be sent directly to the copyright owner as specified in the copyright notice associated with the article.