
Abstract
Study Design:
Retrospective study.
Objectives:
To determine familial clustering of primary spinal cord tumors using a statewide genealogy database.
Methods:
The Utah Population Database (UPDB) was queried using ICD-Oncology (International Classification of Diseases for Oncology) codes for primary spinal cord tumors. The hypothesis of disproportionate familial clustering was tested using the Genealogical Index of Familiality (GIF). The relative risks (RRs) in relatives were calculated using the ratio of observed spinal cord tumors to expected spinal cord tumors in relatives using estimated rates from the UPDB. The related clusters of spinal cord cancer cases with a significant excess number of spinal cord cancer cases descending from a common founder pair were identified using internal UPDB rates.
Results:
The analysis of the GIF for individual with tumors of the spinal cord showed excess close and distant relatedness (case GIF = 3.82; control mean GIF = 2.68; P = .068). Excess relatedness for spinal cord cancers was observed when only more distant relationships were considered (P = .019). The RRs for spinal cord tumors were elevated in second- and third-degree relatives but this did not reach statistical significance (RR = 2.9, P = .15, and RR = 2.0, P = .14). Multiple extended pedigrees with a significant excess of spinal cord cancer cases among the descendants were identified.
Conclusions:
The excess relatedness of tumor cases over controls in distant relationships, the higher RRs to distant relatives, and the discovery of high-risk pedigrees all suggest a familial predisposition to the development of spinal cord tumors.
Introduction
Cancer is a genetic disease with environmental influences. It results from aberrant gene expression leading to changes in the genetic networks that control cell growth and differentiation. Several cancers have been attributed to single genes, such as BRCA1 in familial breast cancer and RB1 in familial retinoblastoma. 1,2 However, it is hypothesized that a less direct familial influence exists as part of a complex interaction between genetic and environmental factors in many cancers.
Spinal cord tumors are exceedingly rare. However, among these rare tumors, ependymomas are relatively common, accounting for approximately 60% of all tumors in the spinal cord. 3 Interestingly, ependymomas have been found to occur in approximately 33% of patients with type 2 neurofibromatosis (NF2), 4,5 a rare autosomal-dominant disorder caused by a mutation of the NF2 gene on chromosome 22. Research into this association with chromosomal and microarray studies has revealed several specific genetic variations in the area of the NF2 gene on chromosome 22 that are associated with ependymomas. 6,7
Due to the rarity of the diagnosis, the biologic understanding of spinal tumors is limited to a few reports on the biology of a small number of specific tumors. Parsa et al 8 discuss familial intramedullary spinal cord tumors. There are various case reports of rare cases with spinal cord tumors associated with familial schwannomatosis, Wilms tumor, familial intracranial ependymomas, and Von Hippel Lindau. However, despite these associations and suggestions, genetic and epidemiologic studies have been limited.
The Utah Population Database (UPDB) is a digital genealogy of the founding pioneers of Utah and their descendants. The UPDB has been linked to the Utah Cancer Registry (UCR) as well as to other data for the state. This has resulted in a powerful research tool to evaluate familial clustering in cancer and other disease processes. 9 -11
This study’s purpose was to analyze the familial clustering of spinal cord tumors across multiple generations in a large population-based resource. Two validated methods were used to test the hypothesis that there is an inherited predisposition: the calculated relative risk (RR) in relatives and the Genealogical Index of Familiality (GIF); pedigrees with an excess of spinal cord cases were identified.
Methods
The UPDB is a population-based resource for the state of Utah that combines a genealogy of the Utah pioneers from the mid-1800s with a statewide cancer registry from 1973 and other Utah data. The original Utah genealogy data was created from 3-generation pedigree documents from the Genealogical Society of Utah. 12 It has been extended with the addition of genealogy data available from state vital statistics data (eg, mother, father, and child from a birth certificate). The UPDB now includes data for over 2.6 million individuals with at least 3 generations of genealogy data and includes some pedigrees with as many as 12 generations. The Utah pioneers were primarily from Northern Europe. 13 The population today is still representative of the founder populations and has normal to low inbreeding levels. 14,15
The Utah Cancer Registry (UCR) is a population-based cancer registry. Cancer has been designated as a reportable disease in Utah since 1948; systematic cancer surveillance began in 1966. In 1973, the UCR became one of the original National Cancer Institute’s designated Surveillance, Epidemiology, and End-Results (SEER) registries and continues participation in that program. The UCR records all independent primary cancers diagnosed, or treated, in Utah. All cancers included in the UCR have histologic confirmation; data on site, histology, stage, grade, survival, and other details are included in the UCR. The UCR has been record linked to the Utah genealogy in the UPDB and is updated annually.
Spinal cord cancers in the UCR were identified using International Classification for Oncology (Revision 3) site code 720 with any histology (8000-9589) except those for leukemias and lymphomas.
The GIF test for excess relatedness is commonly reported for analyses of the UPDB. The pairwise genetic distance between all pairs of cases was measured to calculate the average relatedness of the set of spinal cord tumor cases; the pairwise relatedness measure for the cases was compared to the average pairwise relatedness expected in Utah for a similar group of randomly selected individuals. The pairwise genetic distance was estimated using the Malécot coefficient of kinship, which is the probability that 2 patients share the same allele that was inherited from a common ancestor at a given locus. The significance of this hypothesis test is then calculated empirically. To estimate the expected average relatedness of the set of cases, we calculate the average relatedness for a set of randomly selected matched controls and then repeat this process 1000 times. The significance is measured as the number of times out of the 1000 iterations that the average relatedness in controls exceeds that seen in the cases. The GIF test is also performed ignoring relationships closer than third degree; this test is termed the distant GIF (dGIF) test. The dGIF test thus avoids the confounding variables of exposures (infectious, environmental, etc) that can often be shared in near relatives, and tests if the observed familial clustering may have a genetic contribution.
Relative risks in relatives are the most commonly presented measures to prove a genetic contribution to risk. RRs were estimated in first- through third-degree relatives as follows. All 2.6 million individuals in the UPDB with genealogy data were assigned to 1 of 204 cohorts based on sex, birth place (urban or rural), 5-year birth year range, and birth state (Utah or not). Cohort-specific rates of spinal cord cancer were estimated as the number of spinal cord cancers in each cohort divided by the total number of individuals in each cohort. We estimated the RR for spinal cord cancer in a set of relatives as the observed number of spinal cord cancers (O) in that set of relatives divided by the expected number of spinal cord cancers (E). The expected number of spinal cords in a set of relatives is estimated by counting all of the relatives by cohort (without duplication) and multiplying the number of relatives in each cohort times the cohort-specific rate of spinal cord cancer, and summing over all cohorts. The test of the hypothesis that RR = O/E ≠ 1.0 is performed and 95% confidence intervals for RR are calculated as presented in Agresti and Min. 16
All genetic relationships among the 229 spinal cord cancer cases can be considered in order to identify all clusters of cases descending from a common ancestor (pedigrees). We do not consider clusters that completely overlap, but some cases may occur in more than one such cluster, or pedigree. To determine which clusters have a significant excess of spinal cord cancer cases among the descendants, we compared the observed number of spinal cord cancer cases among the descendants in each cluster to the expected number. The expected number of spinal cord cancer cases among the descendants was estimated by counting all descendants for a pedigree by cohort, multiplying the number of descendants by the cohort-specific rate of spinal cord cancer, and summing over all cohorts. Those pedigrees with a significant excess of observed to expected spinal cord cancers (P < .05) were termed high risk. This study obtained institutional review board approval, IRB_00066403.
Results
The GIF test was performed for 229 patients with spinal cord tumor and 1000 sets of matched controls to evaluate the null hypothesis that there was no significant excess relatedness among cases. Table 1 shows the number of patients (N), the average relatedness of cases (case overall GIF), the average relatedness of 1000 matched control sets (mean control GIF), the P value for the overall GIF test of all relationships, the case dGIF, the mean control dGIF, and the P value for the dGIF test.
Genealogical Index of Familiality (GIF) Results.
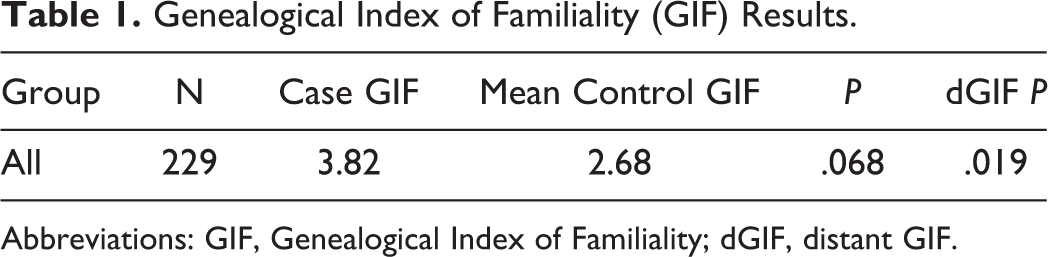
Abbreviations: GIF, Genealogical Index of Familiality; dGIF, distant GIF.
The overall GIF test showed borderline evidence for an excess of relationships among cases compared with controls (P = .068), while the dGIF test, which ignored close relationships, showed an excess of distant relationships among patients with spinal cord tumors that was statistically significant (P = .019), strongly supporting the hypothesis of a genetic contribution to predisposition to spinal cord cancer.
The GIF statistic represents the sum of the kinship measure for multiple close and distant genetic relationships. The GIF for different genetic relationships among cases and controls is shown in Figure 1. The genetic distance (or relationship) is represented on the x-axis (1 = parent/offspring; 2 = siblings; 3 = avunculars; 4 = first cousins, etc). The value of the GIF statistic for each genetic distance is represented on the y-axis. Figure 1 reveals that no close relationships of spinal cord cases were observed (no parent/offspring and no siblings), although some were expected. Since the contribution to the GIF statistic is largest for closest relationships, this may explain why the overall GIF test was only borderline significant (P = .068), even though an excess of pairwise relatedness was observed for all other relationships. The higher value of the GIF statistic among cases than controls from a genetic distance of 3 to 7 signifies increased heritability.
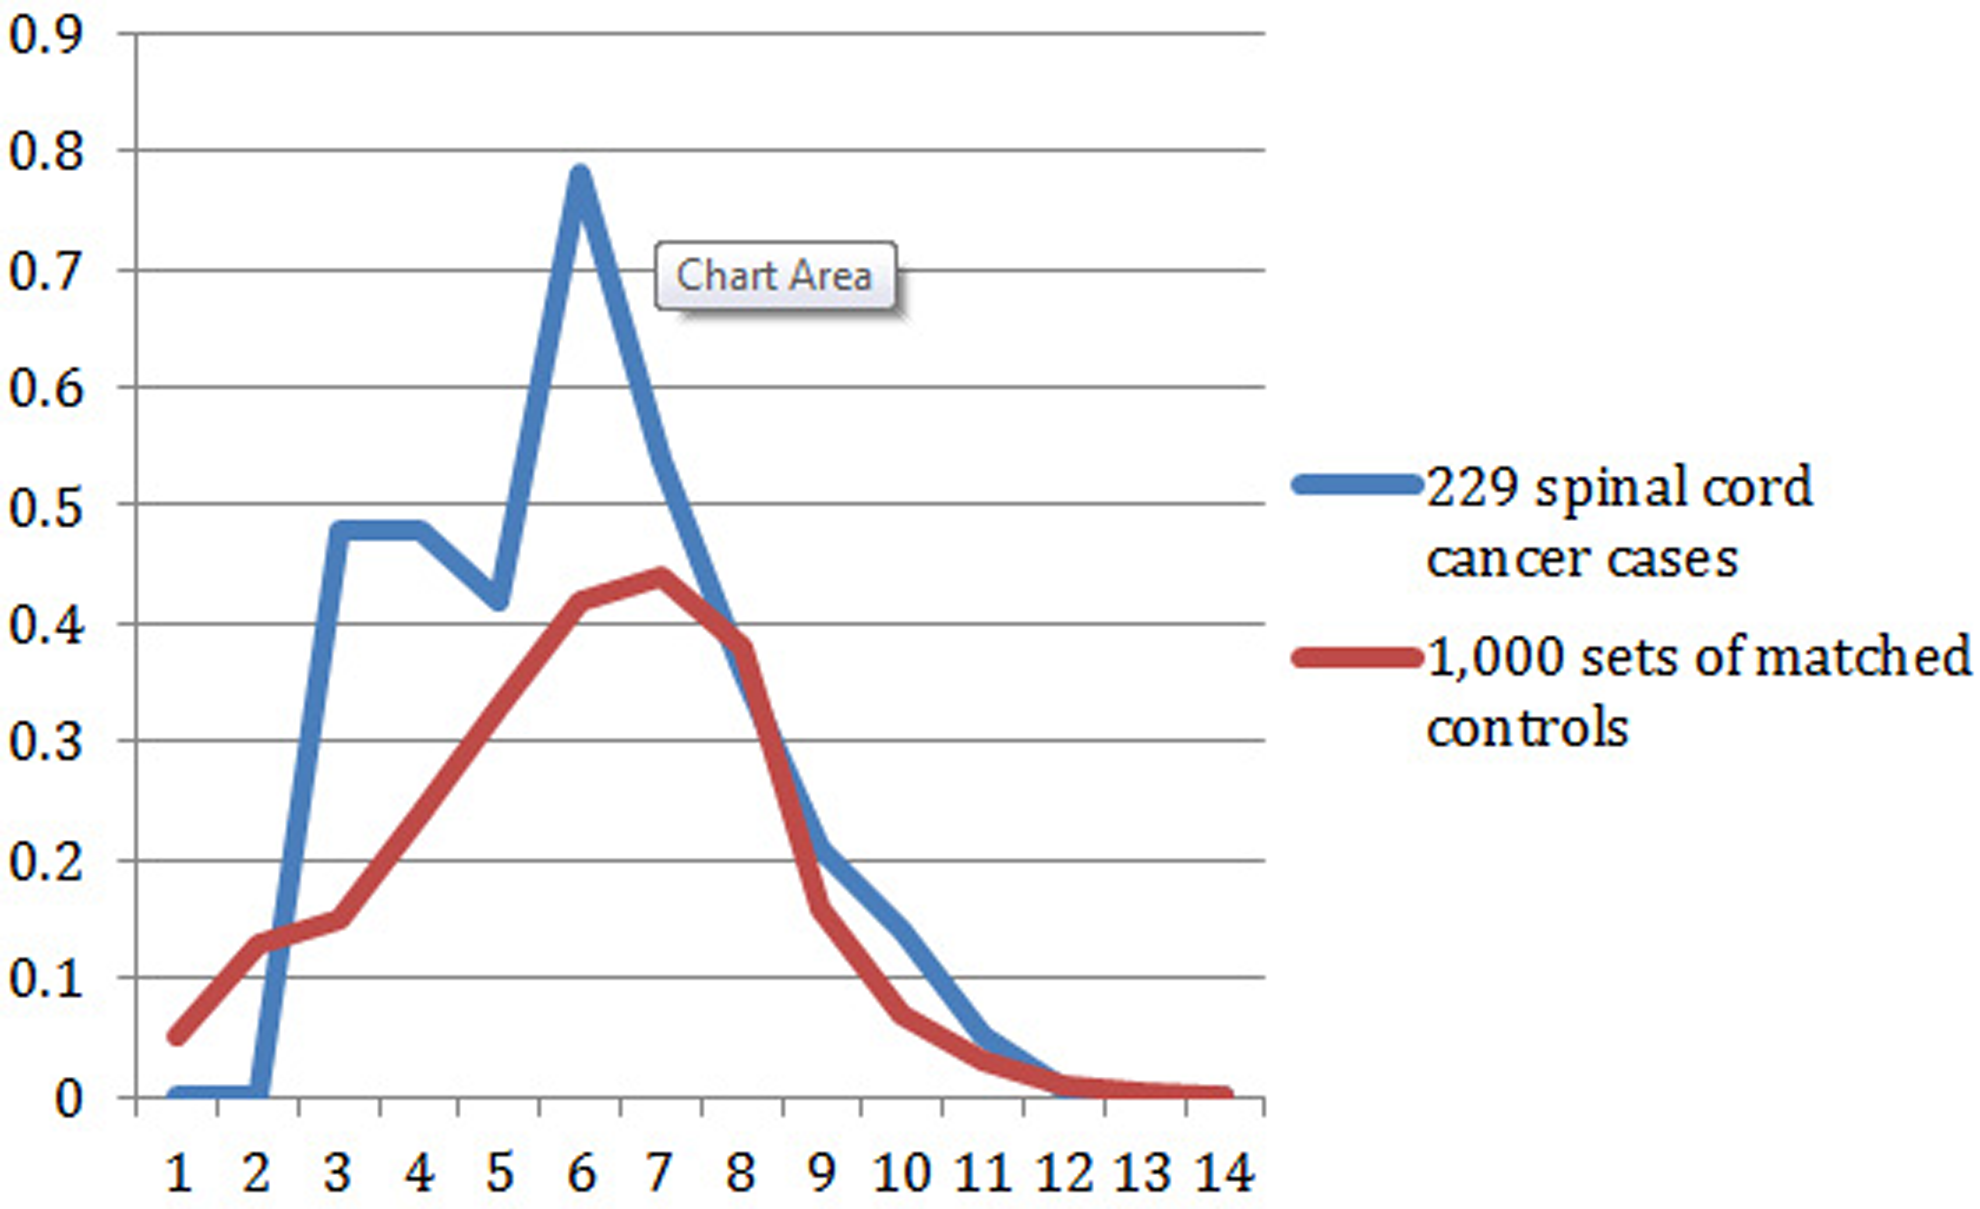
Contribution to the GIF statistic by pairwise genetic distance for cases compared to 1000 sets of matched controls.
Relative Risks in Relatives
Relative risks for spinal cord cancer in first- through third-degree relatives of spinal cord cancer cases are shown in Table 2, which includes the degree of relationship, number of relatives, observed number of spinal cord cancers, expected number of spinal cord cancers, RR, P value, and 95% confidence interval. No first-degree relationships were observed, similar to the GIF analysis. The absence of cases among first-degree relatives is not unexpected given the small number of spinal cord tumors in the population. Elevated RRs were observed for both second- and third-degree relatives, but neither RR was significantly elevated.
Estimated Relative Risks for Spinal Cord Cancers in Relatives of Cases.
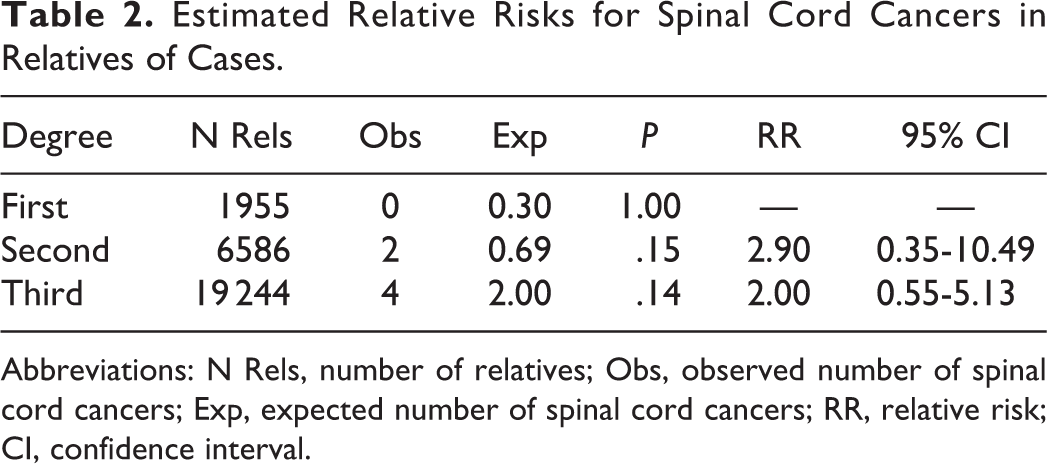
Abbreviations: N Rels, number of relatives; Obs, observed number of spinal cord cancers; Exp, expected number of spinal cord cancers; RR, relative risk; CI, confidence interval.
High-Risk Pedigrees
The 229 cases of spinal cord cancer clustered into 134 pedigrees descending from a common founder pair. After testing each pedigree for a significant excess of spinal cord cancer cases (P < .05), we identified 65 of the pedigrees as high risk, including 1 pedigree with 10 cases, 3 pedigrees with 4 cases each, 15 pedigrees with 3 cases each, and 46 pedigrees with 2 cases each. Figure 2 shows one of the high-risk pedigrees with 4 cases of spinal cord cancer. There are over 14 500 descendants of the founding pair of this pedigree in the UPDB Utah genealogy; 4 of them have spinal cord cancer when only 0.9 cases were expected (P = .01)—showing a genetic predisposition for disease. Since cancer data is only available from 1966, the intervening generations of the pedigree remain unknown for cancer status.
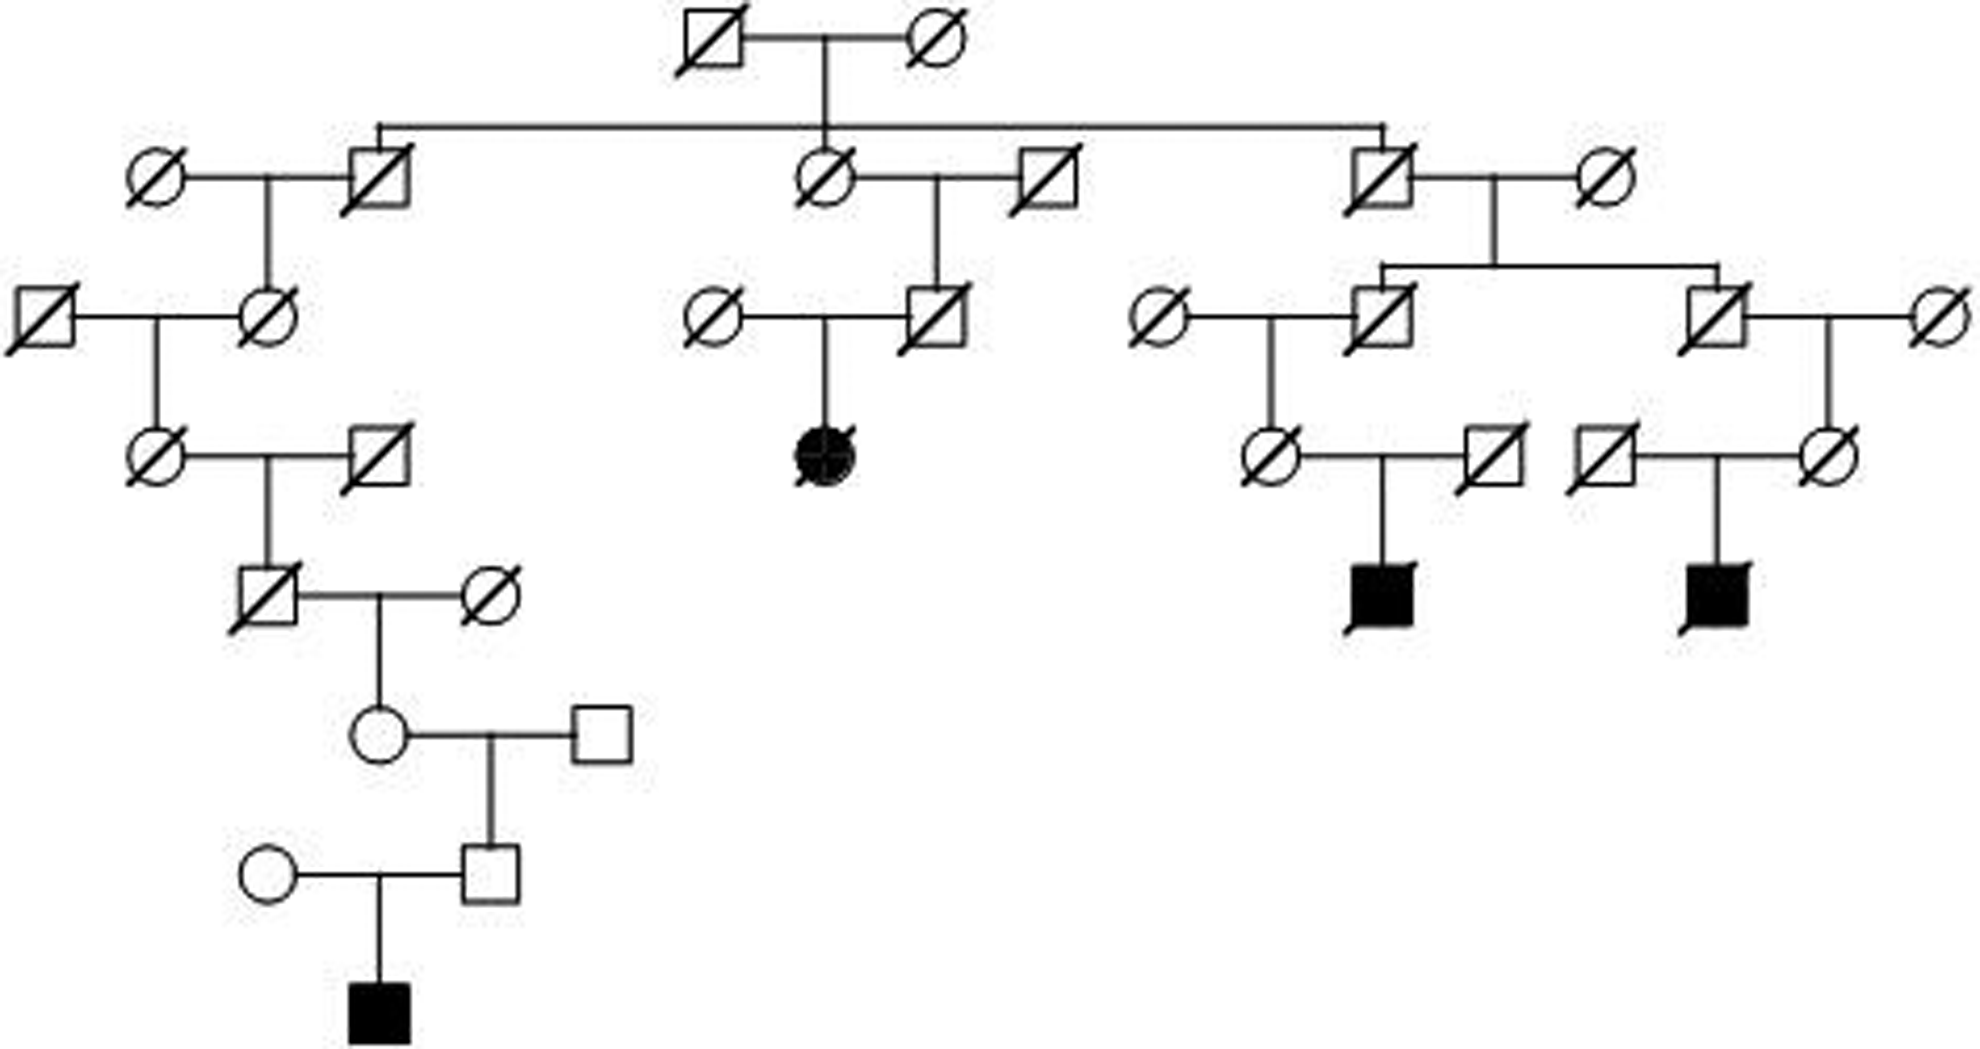
Example high-risk spinal cord cancer pedigree with over 14 500 descendants in UPDB; 4 spinal cord cancers observed and 0.9 expected; P = .01.
Discussion
Previous literature has proposed a predisposition within families to the development of spinal cord tumors (specifically ependymomas), but it has failed to verify this association with a large population-based study. This analysis of the Utah population supports a heritable predisposition to the development of these tumors, proving an excess relatedness of tumors, significantly higher relative risks for distant relatives, and the existence of pedigrees with a significant excess of spinal cord cancers in the Utah genealogical database.
To our knowledge, this is the first population-based study to evaluate the genetic influence on the development of spinal cord tumors. The methodology used in this endeavor has been previously validated and used to show a familial predisposition to asthma, 10 cancer, 17 and rotator cuff disease, 9 among many other disorders. This genealogical approach of identifying high-risk Utah pedigrees has led to the discovery of predisposition genes associated with a disease process (eg, the BRCA1 breast cancer predisposition gene). 1 This study confirms earlier suggestions of a genetic predisposition for spinal cord tumors and should stimulate further study into the possible reasons for the reported heritable predisposition for spinal cord tumors. Furthermore, this study identified several Utah pedigrees with a very high risk for tumor formation that will be used as a resource to test candidate genes in the future. Although the relative risk of spinal cord tumors was shown to be be elevated in near relatives, the absolute risk of spinal cord tumor formation remains very low even in high-risk populations. Until this genetic influence is more thoroughly understood and better screening tools are developed, screening of asymptomatic relatives with spinal cord tumors cannot be recommended at this time.
Although the methodology used in this study has been previously validated and provides this study with intrinsic validity, a number of limitations must be noted. Spinal cord cancer cases diagnosed before 1966 or outside Utah were not identified. Similarly, individuals who are not included in the UPDB genealogy data or whose data failed to link to a UCR record would be censored. This censoring should not affect the overall results since it should occur across the data uniformly to both cases and controls. It may, however, limit our ability to identify genetic factor affecting our results by lowering the power of the study. The Utah population has been previously studied for its genetic diversity and it is similar genetically to Northern European and US populations. 14 The results we observed in this population should apply to patients throughout North America and Northern Europe but confirmatory studies should certainly be attempted.
In conclusion, the development of spinal cord tumors likely has a multifactorial etiology that includes contributions from environmental exposures and genetics. Our research supports a genetic basis to spinal cord tumor development and has identified high-risk pedigrees that can be further evaluated to help identify the responsible genes. By identifying the specific genetic products responsible for tumor development, we hope to gain insight into potential biologic agents to treat or prevent these cancers.
Footnotes
Declaration of Conflicting Interests
The author(s) declared no potential conflicts of interest with respect to the research, authorship, and/or publication of this article.
Funding
The author(s) disclosed receipt of the following financial support for the research, authorship, and/or publication of this article: This work was partially supported by National Library of Medicine Grant LM009331 (to Lisa A. Cannon-Albright). Partial support for all data sets within the Utah Population Database (UPDB) was provided by Huntsman Cancer Institute, University of Utah, and the Huntsman Cancer Institute’s Cancer Center Support Grant, P30 CA42014, from the National Cancer Institute. Research was supported by the Utah Cancer Registry, which is funded by Contract No. HHSN261201300017I from the National Cancer Institute’s SEER Program with additional support from the Utah State Department of Health and the University of Utah.