
Abstract
The Climate Change Scepticism Questionnaire (CCS-Q) has been used in numerous studies. However, we found no studies in the literature review that analyse its psychometric properties. The aim of this study is to confirm the one-dimensional factorial structure of the Climate Change Scepticism Questionnaire, verify its reliability and analyse factorial invariance with respect to gender. To do this, we conducted instrumental, quantitative research, analysing the factorial structure and reliability of the questionnaire in a sample of 426 Spanish participants. The results show a single factor structure comprising 12 items with satisfactory fit indices for metric, scalar and strict invariance with respect to gender. Therefore, we present this tool as a test with good psychometric properties and equivalence of measurement by gender.
According to the Intergovernmental Panel on Climate Change (IPCC, 2019), human activity has caused a temperature rise of 1°C compared to pre-industrial levels. This increase in temperature is generating noticeable negative effects on agriculture, biodiversity, health, psychological aspects of the population, tourism, the economy and other areas of human activity (Abbass et al., 2022). This change in climate and its tangible effects generate a high level of concern in the scientific community and stakeholders, and could be considered one of the major threats that humanity will face in the future (IPCC, 2021). However, temperatures and emissions continue to rise, and this could be due, on the one hand, to the difficulty of translating the population’s concern about climate change into significant actions to reduce it, but also to the existence of groups of natural and legal persons who are sceptical of climate change and who block or simply do not participate in the generation of actions to combat this phenomenon (Hornsey & Fielding, 2020).
Despite broad scientific consensus on the existence and anthropocentric origin of climate change (Doran & Zimmerman, 2009; Oreskes, 2004; Van der Linden et al., 2015), some do not agree with the serious existence of the consequences and/or origin of the phenomenon (Corner et al., 2012; Hornsey & Fielding, 2020; Hulme, 2009). There are terms used to refer to such people, one being ‘climate change sceptics’, although this generates a certain rejection within the scientific community, and the term ‘deniers’ might be more appropriate (Abellán López, 2021). Rahmstorf (2004) makes a distinction between trend sceptics (those who deny that change is occurring), attribution sceptics (those who deny anthropocentric origin) and impact sceptics (those who do not believe the impact is negative or as negative). Whitmarsh (2011), on the other hand, groups mistrust in the evidence of climate change, beliefs about how the media exaggerate information about climate change, and doubts about the existence of change on a single scale that measures scepticism. This conception of the phenomenon, often shaped by broad ignorance of how climate functions in the world and by the influence of other economic interest groups that have no concern for climate change, affects the course of social conceptions and discussions of the problem and the development of public policies on environmental care (Huber, 2020).
Generally, there has tended to be a relationship between climate change scepticism and right-wing political and social ideology (Dunlap, 2013; Engels et al., 2013; Huber, 2020), rejection of science (Rutjens et al., 2018), religious thought (Ecklund et al., 2017), gender, with men generally more sceptical than women (Poortinga et al., 2011, 2019; Vázquez et al., 2021), and environmental attitudes (Dunlap, 2013; Haltinner & Sarathchandra, 2022; Hennes et al., 2020; Rutjens et al., 2018) among other variables. So the debate on this topic can be complex.
For a long time, this ‘sceptical’ view of climate change has been considered a variable of interest in various studies in which participants are asked for their opinions on the phenomenon, in some cases with specific statements such as ‘Climate change is happening’ and ‘Climate change is caused by human activities’ (Engels et al., 2013; Haltinner & Sarathchandra, 2022) or with questions such as ‘As far as you know, do you personally think the world's climate is changing or not?’ (Poortinga et al., 2011). Sceptics have also been identified based on the pattern of responses given to questions such as ‘Thinking about the causes of climate change, which of the following best describes your opinion?’, taking into account possible responses such as ‘Entirely caused by natural processes’, ‘Mainly caused by natural processes’, ‘Mainly caused by human activity’, ‘Entirely caused by human activity’, ‘There is no such thing as climate change’ and ‘I don’t know’(Hornsey et al., 2018). And although there is evidence for the interest in inquiring about this, there has not broadly speaking been an adequate tool that can accurately measure this construct. In this sense, Whitmarsh (2011) recently developed the Climate Change Scepticism Questionnaire (CCS-Q), initially consisting of 23 items. This instrument was based on the results of previous research by the same author (Whitmarsh, 2005). The preliminary analyses found four components that shaped scepticism: (a) scepticism about climate change; (b) the emotional and moral dimensions of the perceived risk of climate change; (c) disinterest in climate change; and (d) the lack of information about climate change. The first factor on the scale would be the basis for the climate change scepticism scale (Whitmarsh, 2011) in its final version.
This tool emerges as a technical and scientific proposal to evaluate climate change scepticism based on self-perceptions regarding the phenomenon and interest in it. It was originally developed in English, but very limited psychometric exploration has been conducted into it. The literature contains studies analysing properties of factor validity, only through exploratory factor analysis (EFA) carried out by its creator (Whitmarsh, 2011). Therefore, there are some limitations in terms of the measurement of this phenomenon, which need to be solved initially by psychometric research, for the future development of relevant empirical studies on the social aspects linked to climate change. Among these limitations, we should consider the need to analyse the efficiency of the scale and the performance of its psychometric properties in different sociocultural contexts (e.g., the Spanish population). Therefore, studies of validity and adaptation to these population segments are required. Another limitation is associated with revealing the internal structure of the measure, to confirm both the factorial structure of the scale proposed by the creator as well as its usefulness in new populations and languages. It is therefore necessary to use more advanced statistical techniques such as confirmatory factor analysis (CFA) to determine the fit of the measure, and also the equivalence of the test measurement against the conformation of subsamples with regard to variables of interest, for example, considering gender as a criterion for categorizing groups. This is because it has been said that generally men score higher than women in the criterion of scepticism (Poortinga et al., 2019; Vázquez et al., 2021), but this has not been demonstrated with multigroup studies based on validated scales. Prescriptive gender stereotypes and roles can be important in explaining differences between women and men regarding their beliefs about climate change (Vázquez et al., 2021). It is usually assumed, in studies in which a variable is compared according to a grouping, that the scales measure in the same way in both groups (Byrne, 2006). However, it is possible that differences may occur because the test has different factor solutions depending on the group (Asparouhov & Muthén, 2014), and this may be generating erroneous conclusions if gender invariance has not been previously tested (Caycho-Rodríguez et al., 2022; Larzabal-Fernandez et al., 2023; Meade et al., 2008; Moreta-Herrera et al., 2024).
Therefore, it is necessary to conduct in-depth psychometric analysis of the tool, to review its reliability and validity, analysing its factorial structure and invariance according to different groups.
Objectives and hypotheses
The objectives of this study are: (1) confirm the one-dimensional factorial structure of the Climate Change Scepticism Questionnaire in the Spanish population; (2) determine the reliability of the CCS-Q in the Spanish population; (3) determine the gender invariance of the CCS-Q in the Spanish population; and (4) determine the evidence of criterion validity of the CCS-Q in the Spanish population.
Method
Design
The study is instrumental and quantitative in its design (Montero & León, 2007), seeking to analyse the factorial structure, the equivalence of measurement by gender and the internal consistency reliability of the CCS-Q in a sample of Spanish adults.
Participants
The study involved 426 subjects of Spanish nationality, 59.2% women, with a mean age of 34.26 (SD = 12.05), recruited using a snowball strategy. First-year students enrolled on the degree in psychology at UNED were asked to send the link to the questionnaire to four acquaintances. Participants completed the online study voluntarily. Figure 1 shows the geographical distribution of participants:
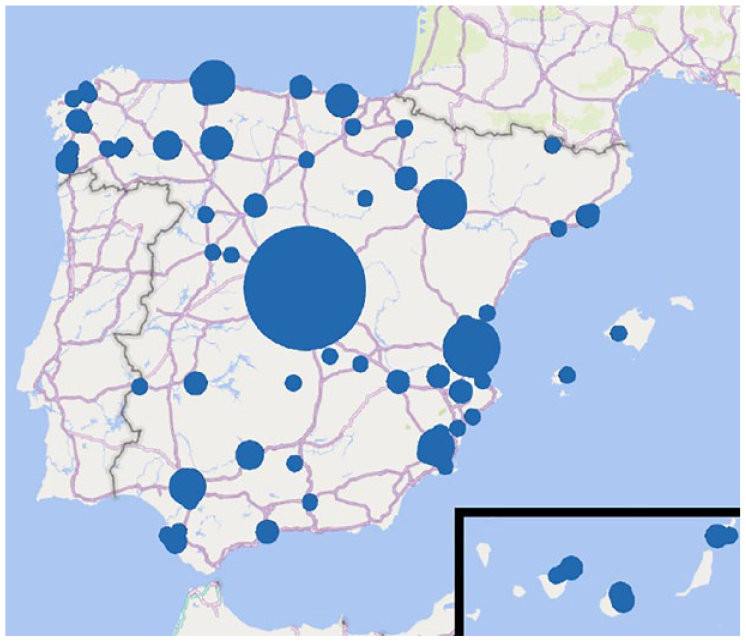
Geographical distribution of participants.
Instruments
Climate Change Scepticism Questionnaire (Whitmarsh, 2011). The scale is designed to ascertain people’s levels of scepticism about climate change. The questionnaire consists of 12 items, answered on a Likert scale with seven response options ranging from ‘Completely disagree’ (1) to ‘Completely agree’ (7). It contains assertions about climate change such as ‘The claims that human activities are changing the climate are exaggerated’ and ‘Floods and heat waves are not increasing, there is just more information about them in the media these days’. For the translation, we used the backtranslation method (Isart Gil & Vicent Montalt, 2018) involving teachers from the language school of the Pontificia Universidad Católica del Ecuador, Ambato, native speakers of English and native speakers of Spanish.
New Ecological Paradigm (NEP) created by Dunlap and Van Liere (1978) and later revised (Dunlap et al., 2000). Scale that analyses subjects’ belief systems about themselves, nature and the relationship between the two. It consists of 16 items and measures attitudes related to human beings, nature and the relationship between them. This research uses the Spanish version (Amérigo & González, 2002). It starts from the short proposal of 11 items by Vozmediano and Guillén (2005), who propose the existence of two factors. One is anthropocentrism, the belief that environmental conservation is important since it contributes to the well-being of human beings (Suárez et al., 2007). It consists of six items such as ‘The idea that humanity is going to face a global ecological crisis has been greatly exaggerated’ and ‘Human beings were created to dominate the rest of nature’ (α = .72; and Ω = .74). The second is another factor called ecocentrism, which implies that ecosystems must be valued for their own intrinsic value (Suárez et al., 2007). It contains five items such as ‘When humans interfere with nature, the consequences are often disastrous’ and ‘Plants and animals have as much right to exist as humans’ (α = .75; Ω = .75). The two dimensions were answered on a Likert scale with seven response options ranging from ‘Completely disagree’ (1) to ‘Completely agree’ (7).
Political leanings were evaluated through two items: ‘Please indicate your political beliefs from left/progressive to right/conservative in relation to economic issues (e.g., social welfare, public spending, tax reductions)’ and ‘Please indicate your political beliefs from left/progressive to right/conservative in relation to social issues (e.g., immigration, gay marriage, abortion)’. The two items ranged from 1 (far left) to 7 (far right). Since the correlation between the two items is high, r (426) = .73; p < .001, the mean between the two items was calculated and used as a single measure. Lower scores represent left-wing political leanings and higher scores right-wing political leanings.
Procedure
The data used in this study are a part of a larger study that mediates the influence of the situational activation of materialism on climate change scepticism. The original study involved 1,257 participants who, after responding to the NEP and questions regarding ideological leaning, were randomly assigned to three conditions, two experimental and one control. Scepticism was influenced in the experimental conditions, so in this study we are working with the control group.
Once the data were collected, the statistical software package SPSS version 27 was used to analyse them. It began with a preliminary analysis of the items, taking into account the mean, standard deviation and correlation item test. Cronbach's alpha and McDonald's omega were obtained in a complementary way to determine internal consistency, and the relationships between climate change scepticism and other variables were analysed to determine evidence of criterion validity (political leanings and NEP). Using version 24 of the AMOS program, we performed Confirmatory Factory Analysis (CFA) and then analysed factor invariance by gender by means of multigroup CFA (CFA-MG).
Data analysis
Statistical analysis in this study was divided into the following blocks. The first includes the preliminary analysis of the items, describing them statistically by means of central tendency and dispersion measures such as arithmetic mean (M) and standard deviation (SD), respectively. In turn, we analysed the relationship between the items and the global construct by means of the item-test correlation (r(item-test)), in order to ascertain the contribution of each to the general evaluation of the measure. The reliability analysis of the questionnaire is also included, using Cronbach’s reliability coefficient (α) and the omega coefficient (Ω), as well as the reliability result if each item is removed (α-it). This is an analysis of relevance since it allows us to estimate the performance of the items along with their usefulness and relevance within the measure explored in the psychometric context.
Subsequently, we analysed the criterion validity or relationship with other variables. In this case, we analysed the CCS-Q with the NEP to ascertain the strength of the relationship that these measures might have as an indicator of the capacity to evaluate a construct with close evaluation measures. In this case, Spearman’s correlation coefficient (rho) is used to identify the existing strength of the relationship.
In the next block, we apply confirmatory factor analysis (CFA) using the estimation of Robust Maximum Likelihood (MLR), since multivariate normality is absent, and estimators that consider this criterion are required (Li, 2016). Here we test two fit models for the CCS-Q based on a single-factor model (12 items and 11 items). The factor validity of the scale is interpreted by means of the values of absolute fit indicators such as Chi Squared (χ2), Normed Chi Squared (χ2/df), those not based on centrality such as the Room Mean Square Error of Approximation (RMSEA), incremental fits such as the Comparative Fit Index (CFI) and the Tucker-Lewis Fit Index (TLI), and the factor loadings of items (λ) are also analysed. The structural model is considered appropriate when the indicators approach the different cut-off points, such as when χ2 is not significant (p > .05) or χ2/df < 4, RMSEA is less than .08, CFI and TLI are greater than .95, and the factor loadings are greater than .40. (Brown, 2015; Byrne, 2008; Dominguez-Lara, 2018; Hancock et al., 2019; Wolf et al., 2013).
Table 4 corresponds to the gender-based measurement equivalence analysis through the MG-CFA with ML estimation. Here, we are looking for the factorial invariance of the scale as the measure levels of restriction and nesting increase. Initially, this process begins by checking the fit of the group-segmented scale through independent CFA (baselines) to know if the groups themselves are similar or different in their reported fits. Subsequently, the scale restrictions based on an unrestricted assessment are analysed, and the loadings (metric or weak invariance), intercepts (strong invariance) and residuals (strict invariance) are subsequently delimited and the differential or change (Δ) in the estimators χ2 is analysed, CFI and RMSEA, at each restriction level. Measurement equivalence is considered according to the restriction level when the differential is not significant in χ2 (p > .05) or does not exceed .2 in the CFI or RMSEA (Asparouhov & Muthén, 2014; Brown, 2015; Meade et al., 2008; Moreta-Herrera et al., 2022)
Results
Preliminary analysis of the items
Table 1 shows the performance of the scores for the CCS-Q items according to the average scores. These are found to be homogeneous with each other, fluctuating between M(item 11) = 3.41; SD = 2.10 and M(item 3) = 1.60; SD = 1.25. Likewise, the relationship that each of the items has with the CCS-Q is analysed globally by means of r(i-tc). In this context, item values fluctuate between r(item 11-tc) = .37 and r(item 4-tc) = .78 with item 4.
Preliminary analysis of the items.
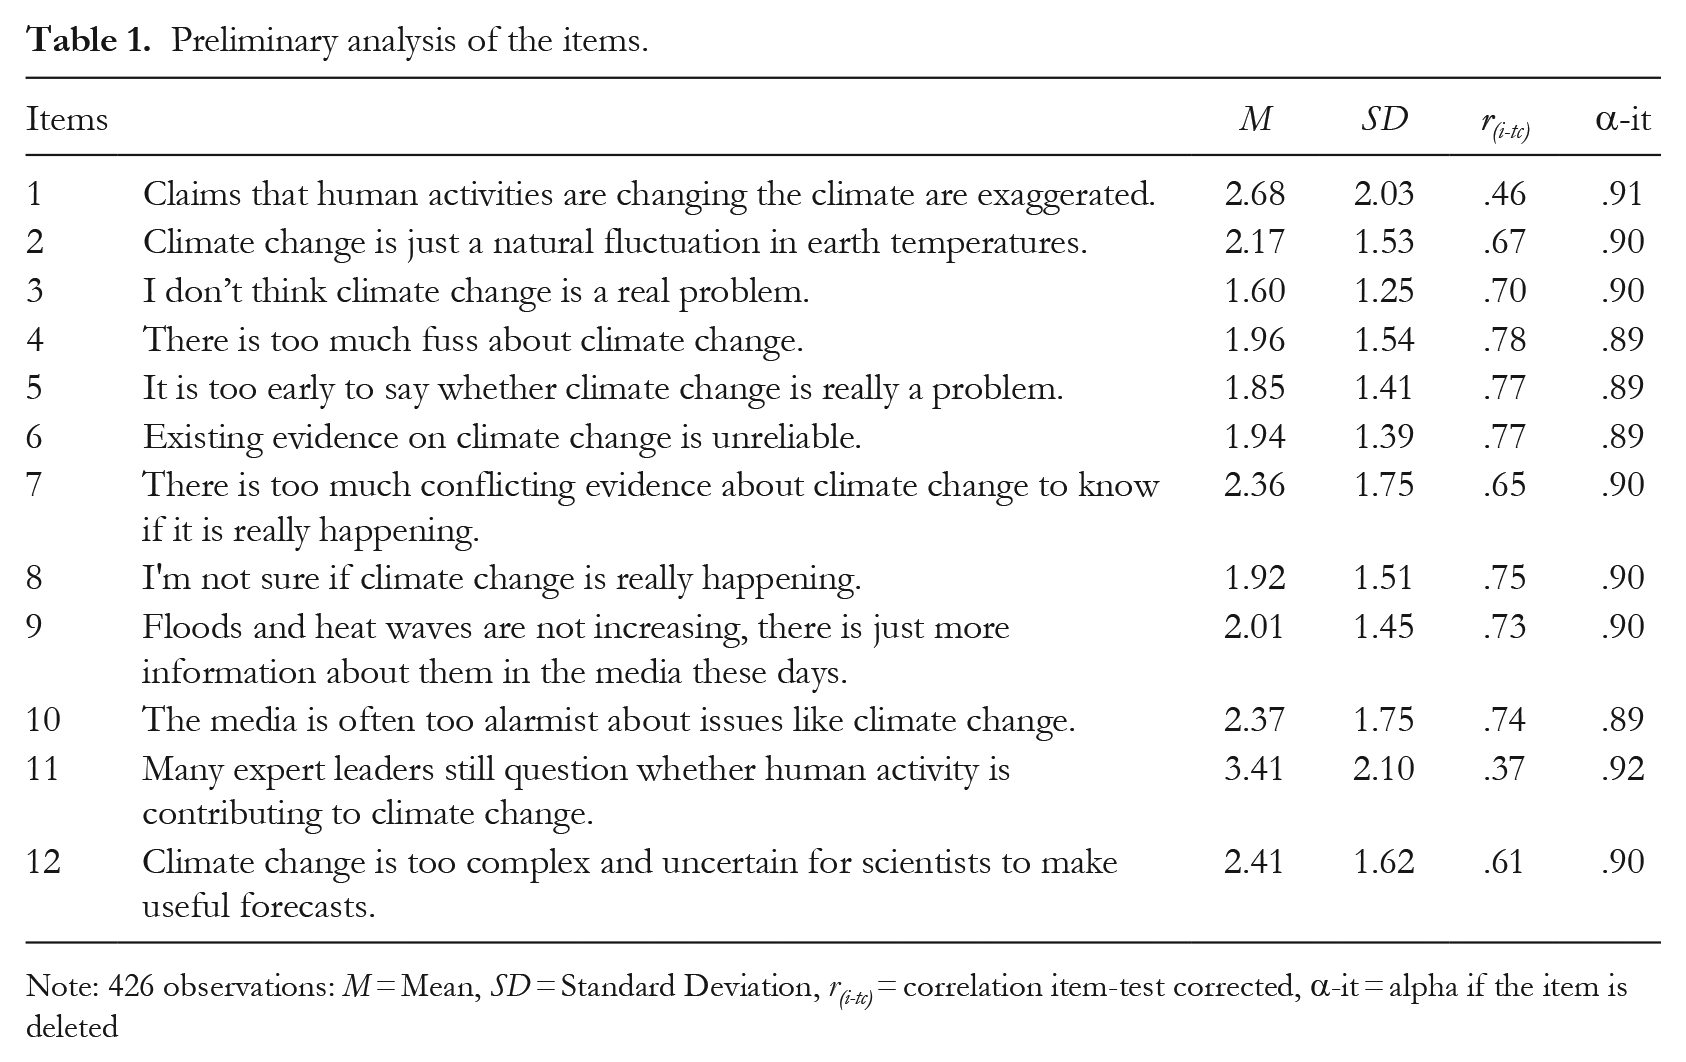
Note: 426 observations: M = Mean, SD = Standard Deviation, r(i-tc) = correlation item-test corrected, α-it = alpha if the item is deleted
Finally, the internal consistency reliability analysis of the CCS-Q is presented, achieving a score of α = .911 for the internal consistency reliability of the items and ω = .912 for the global consistency based on the one-dimensionality of the measure, which are equivalent to high internal consistencies.
On the basis of this analysis, we can make two important observations with respect to item 11. The first is that the item-test relationship is one of the lowest among the CCS-Q items, so its contribution to the CCS-Q construct may not be representative, and on the other hand, its performance in terms of internal consistency also apparently shows an impact, since when it is removed, this consistency level would increase although it would remain high. This raises the possibility of testing at the level of factor analysis fit models including and excluding the presence of the item analysed.
Finally, we analysed multivariate normality using the Mardia (1970) test for asymmetry (g1) and Kurtosis (g2), with Mardia values(g1) = 12,134.5; p < .001 and Mardia(g2) = 165.8; p < .001, resulting in the absence of multivariate normality, as statistical significance was found (p < .05).
Evidence of criterion validity
To analyse the validity of the criterion, we took into account political leanings and the responses to the New Ecological Paradigm (NEP) scale in the dimensions of anthropocentrism and ecocentrism, giving rise to the matrix of correlations shown in Table 2. As expected, a positive and significant correlation was found between the CCS-Q and right-wing political leanings, rho (426) = .404; p < .001, and with anthropocentrism, rho (426) = .506; p < .001, and a negative and significant correlation with ecocentrism, rho (426) = −.433; p < .001.
Matrix of correlations.
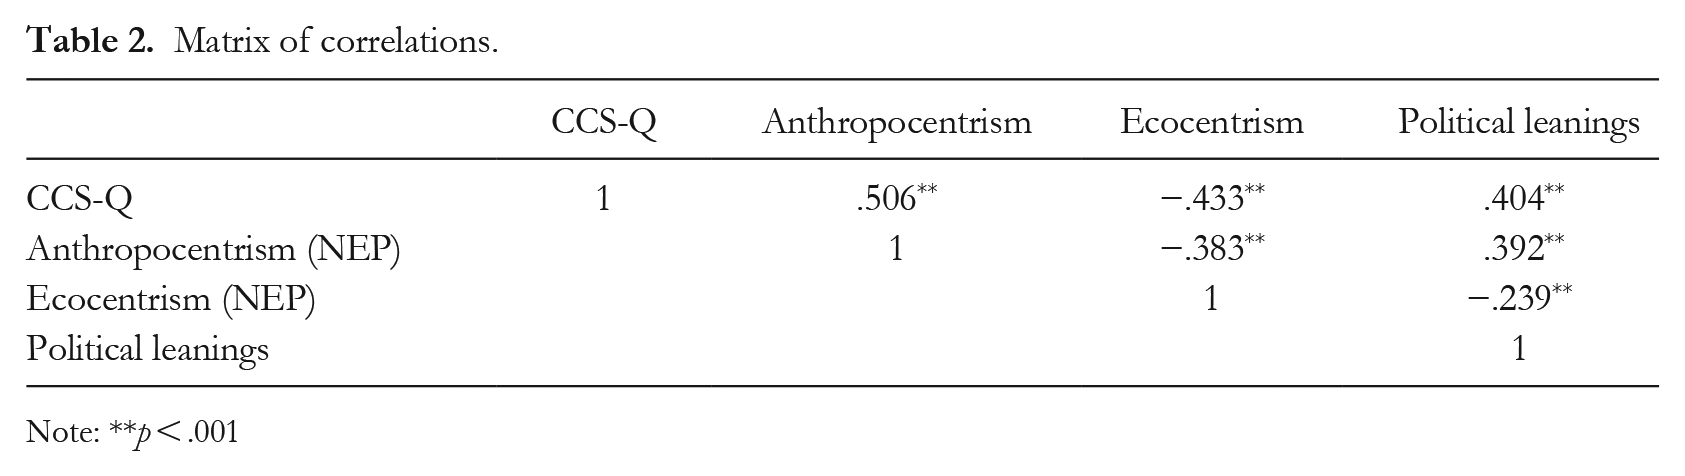
Note: **p < .001
Confirmatory factor analysis
In order to confirm the factorial structure of the CSS-Q, we carried out CFA, taking into account, on the one hand, the original model of the CCS-Q and, on the other hand, a reduced version of 11 items (without item 11) (CCS-Q-11) to know which of the two CCS-Q models is best suited for the interpretation of items within the internal fit of the measure, considering a one-factor-fit model. Table 3 shows the values of the different fit indices for the CCS-Q according to the two proposed models. In both cases, the fit criteria are relatively adequate (with the exception of χ2, mainly due to the sample size, which is corrected by the χ2/df found within the tolerance criteria). However, fit levels are slightly better in CCS-Q-11, especially in the incremental fit indicators (CFI and TLI).
Confirmatory factor analysis of the CCS-Q with Maximum Likelihood Estimation.
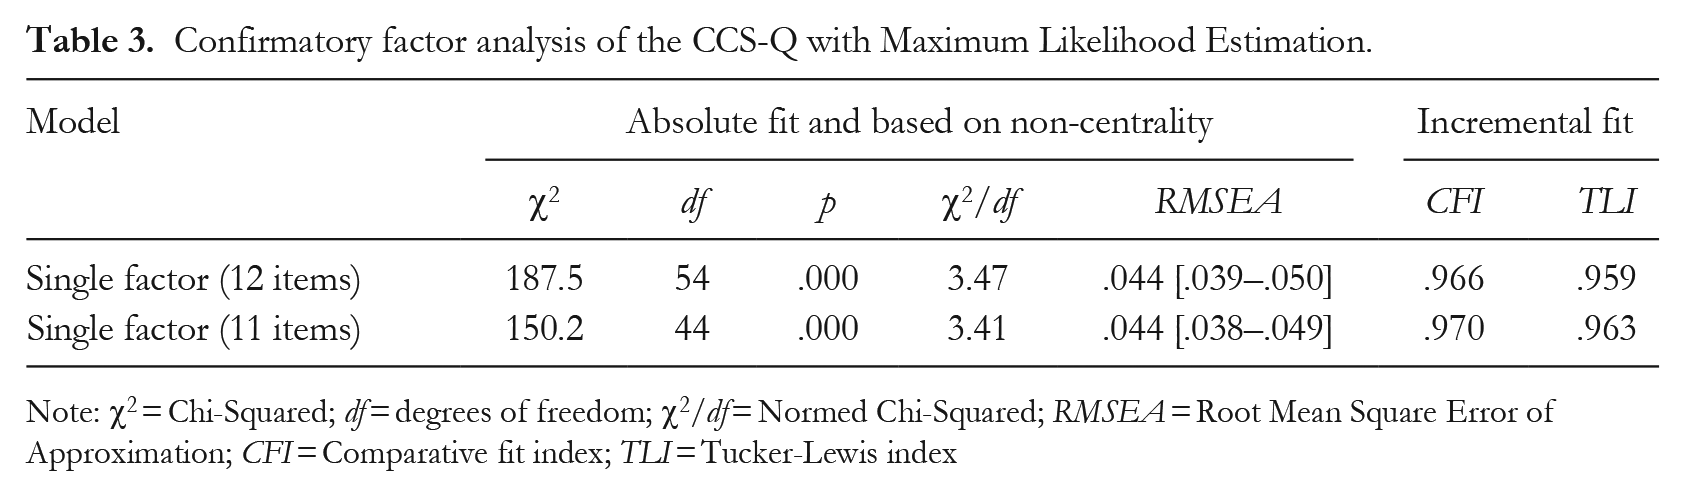
Note: χ2 = Chi-Squared; df = degrees of freedom; χ2/df = Normed Chi-Squared; RMSEA = Root Mean Square Error of Approximation; CFI = Comparative fit index; TLI = Tucker-Lewis index
In addition, Figure 2 shows the saturations of the CCS-Q and CCS-Q-11 items, respectively. The factor loadings in model 1 range from λ(item 11) = .37 to λ(item 4) = .83, while in CCS-Q-11, the loadings range from λ(item 2) = .47 to λ(item 4) = .84. As observed, the behaviour of item 11 as in the previous analyses continues to show low performance in this aspect. A low loading may have implications in the explanation of the total variance of the measure since it does not reach the expected tolerance criterion. In this sense, CCS-Q-11 can presumably be considered the most appropriate model to measure the construct in the Spanish sample, although to favour content validity, the original version is considered since the equal factor fit is still adequate.
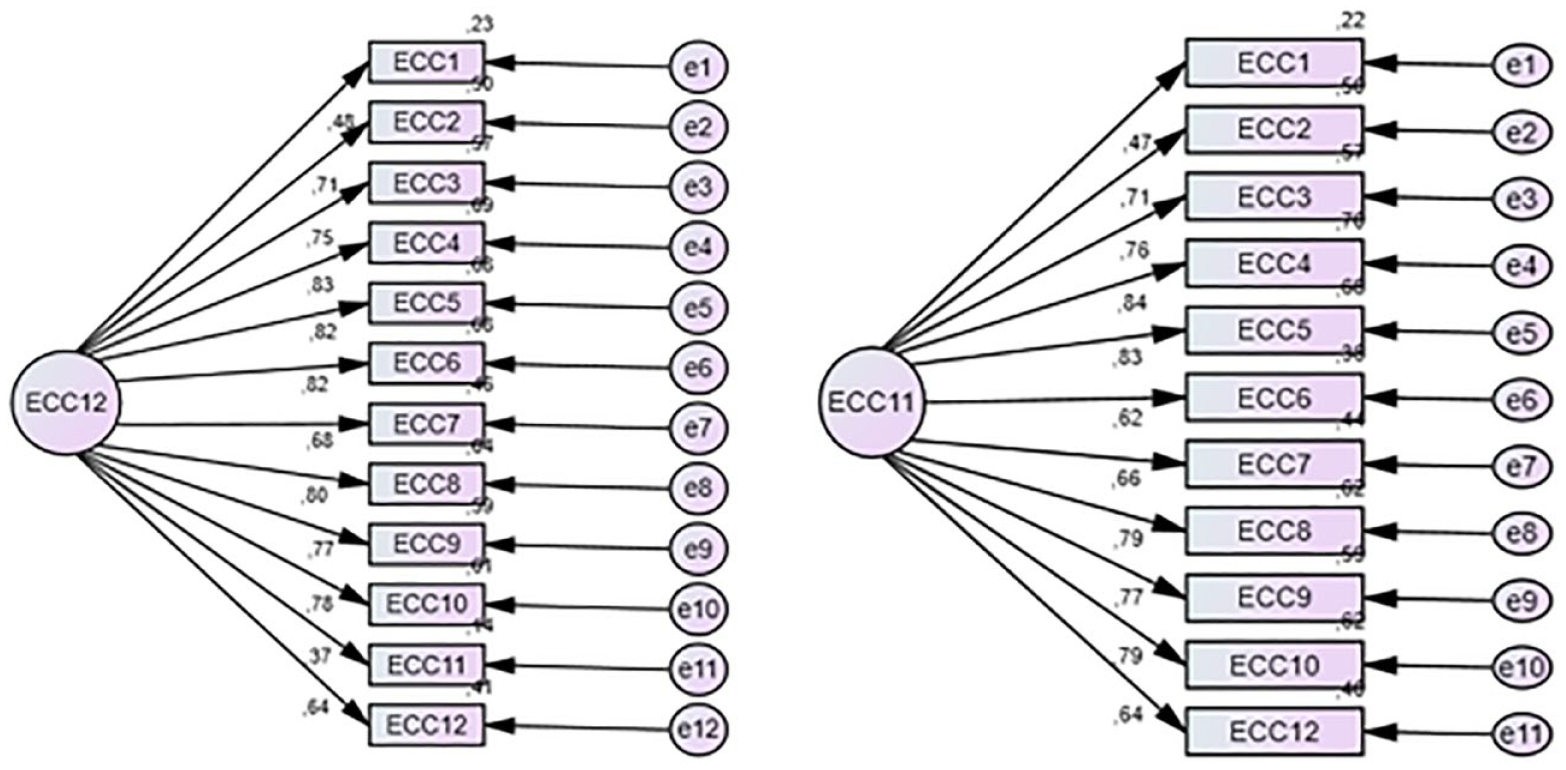
Factorial structure of the Climate Change Scepticism Questionnaire in the 12- and 11-item versions.
Analysis of the measurement equivalence of the CCS-Q by gender
To test the measurement invariance of CCS-Q by gender, a multi-group confirmatory factor analysis (CFA-MG) was performed (see Table 4). This is based on analysing the fits of the model independently by group (baselines), showing that the two groups independently preserve adequate fit indicators and therefore are considered similar.
Analysis of equivalence of measure by gender.
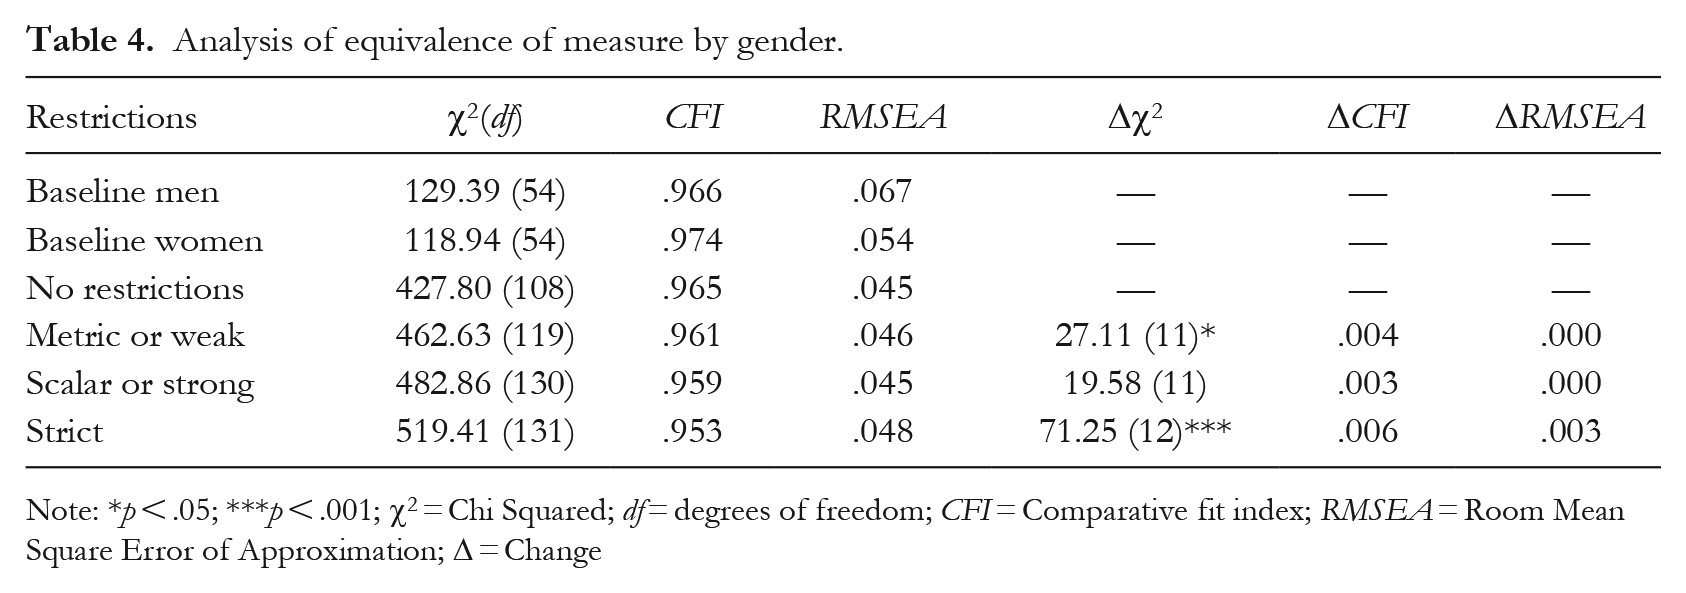
Note: *p < .05; ***p < .001; χ2 = Chi Squared; df = degrees of freedom; CFI = Comparative fit index; RMSEA = Room Mean Square Error of Approximation; Δ = Change
The different levels of restriction were already tested in the CFA-MG. In the metric invariance model, factor loadings were restricted to be equal between men and women. The indexes showed that the model offered a good fit, and when compared with the first model (without restrictions), ΔCFI was < .01 and the ΔRMSEA was < .015, and Δχ2 was significant (p < .05) (considering the sensitivity of the test to the sample size). Therefore, it is adequate. In the scalar or strong invariance model test, in which the intercepts in addition to the factor loadings were restricted to be equal between the groups, a good fit is also shown, when compared with the metric invariance model. There were no significant changes in ΔCFI and ΔRMSEA, or in Δχ2. Finally, in the strict invariance model, in which residuals were restricted to more than factor loadings and intercepts, Δχ2 proved to be significant (p > .05). In addition, ΔCFI and ΔRMSEA did not increase more than expected.
Therefore, the results show that the CCS-Q has satisfactory fit indices for metric, scalar and strict invariance. Thus, the scores between the two groups analysed could be predominantly comparable and the change in units could be comparable between them.
Finally, compared to the measurement equivalence of the CCS-Q, the internal consistency of the CCS-Q is extracted independently for men, α(men) = .933 and Ω(men) = .934, as well as for women, α(women) = .900 and Ω(women) = .901. In all these cases, the equivalent internal consistencies reported were high.
Discussion
The objectives of this study were to ascertain the evidence of validity (factor, invariance by gender and criterion) and reliability of the CCS-Q in a sample of Spanish subjects.
Regarding the validity of the criterion, we found a positive and significant correlation between the CCS-Q and the anthropocentrism dimension of the NEP and right-wing political leanings, and a negative and significant correlation with the ecocentrism dimension of the NEP, which was expected based on the literature consulted (Dunlap, 2013; Engels et al., 2013; Haltinner & Sarathchandra, 2022; Hennes et al., 2020; Huber, 2020; Rutjens et al., 2018). In other words, scepticism is significantly associated with elements of political ideology as well as information and social positioning regarding this phenomenon, as a relevant element for the configuration of this phenomenon.
As for the validity of the measure, we found that the CCS-Q can be adequately represented through a one-dimensional-fit model, initially through 12 items according to the original proposal, as well as through a set of 11 items. The criterion to consider is that the factor loading of item 11 contributes a lower explanation of the variance, so its withdrawal in essence supports the integration of a fit model with a more robust participation of the items in the latent interpretation of the construct. The results of the values of the fit indicators in the CFA of the CCS-Q and the CCS-Q-11 remain within the parameters of acceptance and adequate fit (Brown, 2015; Byrne, 2006; Dominguez-Lara, 2018; Hancock et al., 2019; Wolf et al., 2013). Based on the review, it can be said that the CCS-Q remains the most suitable tool for use in the Spanish population. It should be noted that the results shown cannot at the moment be contrasted with other studies due to the apparent lack of instrumental validation studies. In this respect, there is a coincidence in terms of the factorial structure with the original version that establishes that the best representation is one-dimensional (Whitmarsh, 2011). However, this should be taken with caution because further replication studies are required to give solidity and especially evidence of validity of the tool to measure phenomena such as climate change scepticism.
Regarding measurement equivalence by gender, the CCS-Q found that the measure at an independent level (men vs. women) has adequate fits for each group. In addition, considering restrictions on loadings, intercepts and residuals, we found that the changes observed do not exceed the tolerance values (Asparouhov & Muthén, 2014; Brown, 2015; Meade et al., 2008; Moreta-Herrera et al., 2022), so the CCS-Q is invariant at the metric, strong and strict levels. This is relevant since there is evidence that allows us to estimate that probable differences in the interpretation of climate scepticism values between groups classified by gender would respond in reality to differences arising from the particular characteristics of the groups, rather than differences in the mechanics of interpretation of the measure by the groups (Caycho-Rodríguez et al., 2022; Meade et al., 2008; Moreta-Herrera et al., 2024), thus ensuring the veracity of the scores and the respective interpretation. These results at the moment cannot be contrasted with other studies because there are no measurement equivalence studies classified by gender of the CCS-Q, so these findings represent a significant advance.
Among the implications of the study, it provides information on the usefulness of a measure that broadly evaluates the construct of climate change scepticism, which currently has not only theoretical interest in climate sciences but also practical interest because of the real implications of climate change. Indeed, any proposals regarding improvements in the processes of intervention and correction of this phenomenon require instruments that more accurately measure this and other similar phenomena. Thus, the evidence of scale validity reaffirms its usefulness for social research into climate change, but it is also adapted for these purposes to the Spanish language, which will allow researchers to explore this phenomenon in greater depth in this population group and opens the door for other national groups that share the same language.
Conclusions
This study confirms the one-dimensional factorial structure of the Climate Change Scepticism Questionnaire in the Spanish population and agrees with the original version (Whitmarsh, 2011). The CCS-Q also obtains good fit indices in metric, scalar and strict invariance. In addition, the questionnaire is estimated to obtain adequate reliability indices. Regarding criterion validity, there are positive and significant correlations with anthropocentrism and right-wing political leanings, and negative and significant correlations with ecocentrism. Finally, the CCS-Q offers good psychometric properties and measurement equivalence with respect to gender in the Spanish population, so we would suggest that instead of using single-item scales (which have traditionally been used to measure this construct), this questionnaire should be used in the future.